

Introduction
The purpose of this paper is to introduce snow temperature as an independent field variable in avalanche dynamics calculations. Snow temperature defines the mechanical properties of flowing snow (Reference VoytkovskiyVoytkovskiy, 1977; Reference Bozhinskiy and LosevBozhinskiy and Losev, 1998) and therefore the avalanche flow regime (Reference Gauer, Issler, Lied, Kristensen, Sandersen, Campbell, Conger and HaegeliGauer and others, 2008; Reference Issler and GauerIssler and Gauer, 2008). Dense, wet snow avalanches form from moist snow at high temperatures (Fig. 1); mixed flowing/powder avalanches form from dry snow at low temperatures. Wet snow avalanches exhibit pronounced visco-plastic type flow behaviour, in contrast to the dispersive granular motion of dry snow avalanches, which are often accompanied by a powder cloud of suspended ice-dust. The important role of snow temperature in controlling avalanche runout was recently highlighted by Reference Naaim, Durand, Eckert and ChambonNaaim and others (2013). An understanding of how temperature controls the mechanics of avalanche motion is key to predicting how different snow conditions influence the avalanche flow regime, runout and deposition (Reference Steinkogler, Sovilla and LehningSteinkogler and others, 2014). Temperature, T, is related to the internal heat energy, E, of the avalanche, which is a function of the dissipative processes (Reference Miller, Adams, Schmidt and BrownMiller and others, 2003; Reference Bartelt, Buser and KernBartelt and others, 2005). In this paper we assume the temperature describes the total specific internal energy, E, of the avalanche completely, i.e. we do not consider effects such as the potential energy of microscopic bonding forces, including cohesion (Reference RowlinsonRowlinson, 2002). In our case, the total energy balance of the avalanche requires all potential energy from the initial fall height to be dissipated to heat. However, dissipative processes, such as frictional work, are extensive path functions and therefore require a precise definition of how they are created and where they work (Reference BejanBejan, 1997). Conventional avalanche dynamics models consider only the heat generated from the slope-parallel frictional shear work (Reference Pudasaini and HutterPudasaini and Hutter, 2007). We consider, in addition, the dissipation of kinetic energy associated with granular fluctuations (Reference Bartelt, Buser and PlatzerBartelt and others, 2006). Because the dissipation rate of each mechanism is controlled by a different process, the spatial distribution of temperature varies within the avalanche. When the temperature exceeds the melting temperature the production of meltwater lowers the friction at the basal gliding surface (Reference ColbeckColbeck, 1992). Therefore, we must also consider phase changes in the model.
The deposition field of the Gatschiefer avalanche that released on 26 April 2008 at Klosters, Switzerland. A cold, dry snow slab released. However, the avalanche entrained warm moist snow in the transition and runout zones, leading to the formation of a heavy wet snow avalanche. Snow temperature controlled the avalanche flow regime.

However, calculating the rate at which the avalanche transforms potential energy into heat is only one component of the total energy balance. The thermal flow regime of an avalanche is determined by the release temperature of the starting mass, as well as the temperature of the entrained snow cover (Fig. 2). Snow-cover temperature profiles can vary, ranging from isothermal distributions to strong temperature gradients with depth (Reference Bozhinskiy and LosevBozhinskiy and Losev, 1998; Reference McClung and SchaererMcClung and Schaerer, 2006). The combination of (1) variable release temperature, (2) snow-cover temperature that varies with track elevation and depth and (3) the path-dependent evolution of different dissipative processes allows snow avalanches to exhibit a wide range of flow behaviour. The path-dependent processes are a function of the avalanche terrain. In this paper we develop an avalanche dynamics model that accounts for release temperature as well as the influx of thermal energy with snow entrainment. The model facilitates the study of different dissipative mechanisms because it accounts not only for shearing, but also for the dissipation of the fluctuation energy associated with random particle movements within the avalanche core. We use the model for four case studies. The question emerges under what snow conditions the calculated temperature rise is large enough to induce meltwater production and the lubrication of sliding surfaces, leading to longer avalanche runouts. We also demonstrate how the spatial distribution of temperature and meltwater can affect avalanche deposition patterns, such as the formation of levees (Reference Bartelt, Glover, Feistl, Bühler and BuserBartelt and others, 2012a).
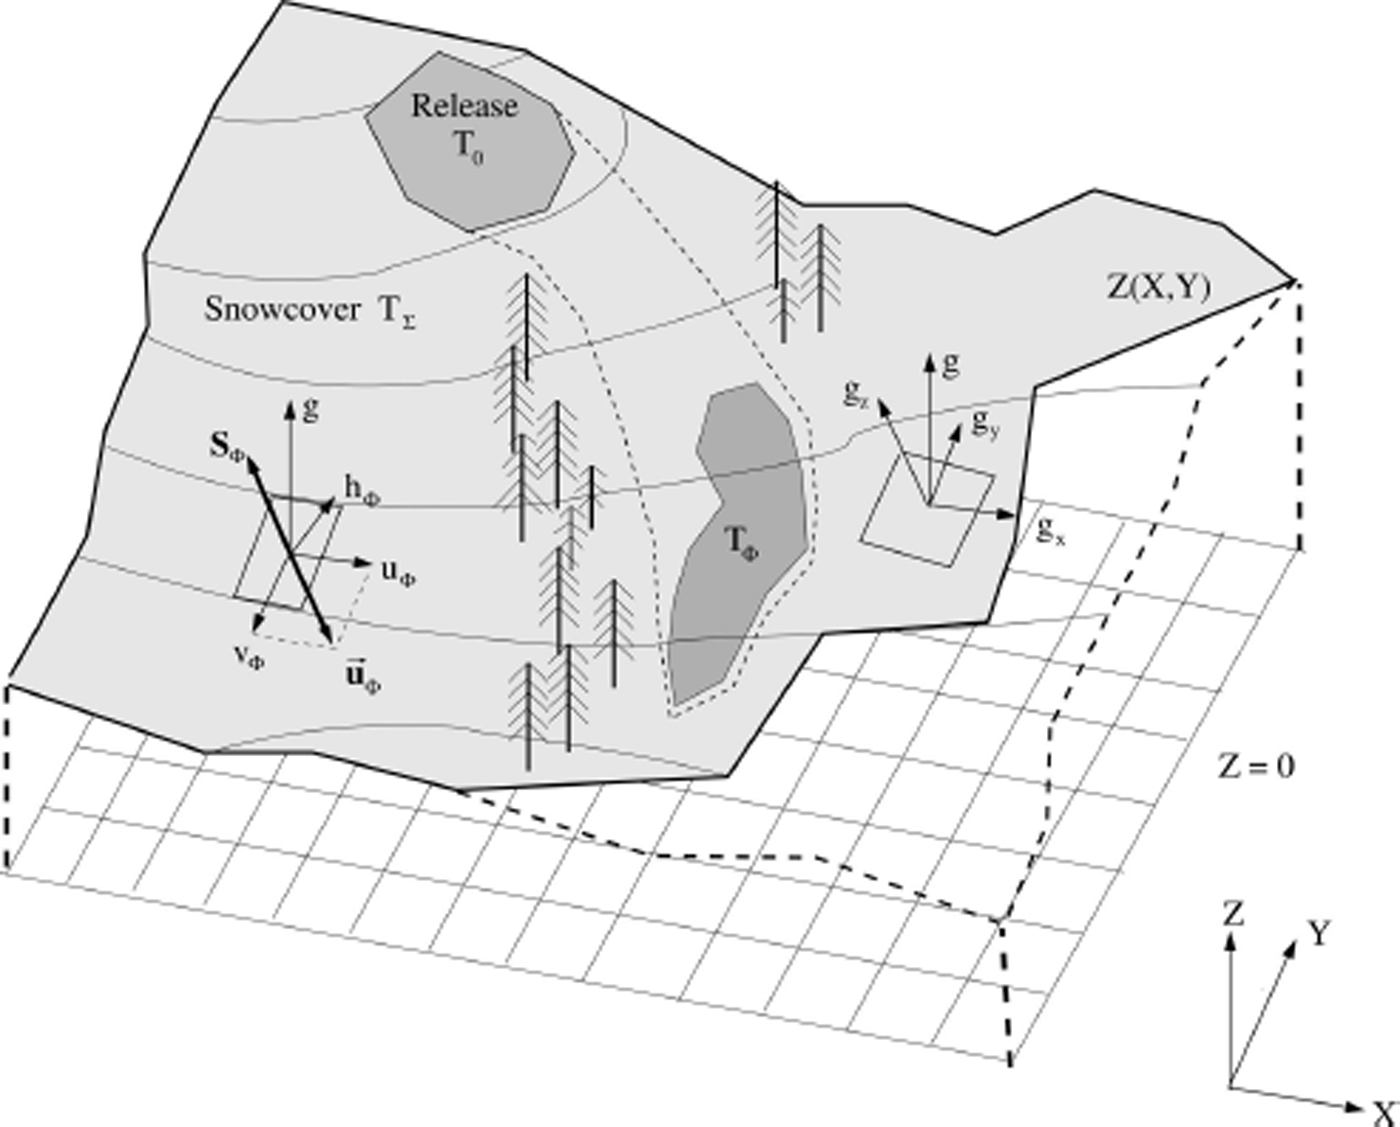
Definition of model domain and coordinate system (Reference Christen, Kowalski and BarteltChristen and others, 2010). The starting zone is assigned an initial temperature T
0. The snow-cover temperature is T
Σ. The avalanche temperature, T
Φ, increases from the release temperature, T
0, as a function of the dissipative processes and entrainment. The avalanche core, Φ, entrains snow from the snow cover, E, at a rate ![]() .
.
Model Equations
We extend the equations for avalanche flow derived by Reference Christen, Kowalski and BarteltChristen and others (2010) to account for temperature effects. The general system of four differential equations describes the volume, mass, momentum and energy balances of a representative flow volume, V Φ (Fig. 2). The mathematical description of the mountain terrain is defined using a horizontal X-Y coordinate system. The elevation, Z(X, Y), is specified for each (X, Y)-coordinate pair, typically using digital elevation models with a resolution of 1 in 10 m. We introduce a local surface (x, y, z) coordinate system with directions x and y parallel to the metric geographic coordinates, X and Y (Fig. 2). Directions x and y are the slope-parallel directions while the z-direction is oriented perpendicular to the local x-y plane.
The equations are (Reference Christen, Kowalski and BarteltChristen and others, 2010)


containing the four unknown state variables
The velocities, u Φ and v Φ, are defined in the x- and y-directions, parallel to the avalanche slope (Fig. 2). The components of UΦ . include the mass, M Φ, per unit area and the avalanche momentum in the directions tangential to the slope,M Φ u Φ and M Φ,v Φ,. The remaining state variable is the non-directional kinetic energy associated with granule velocity fluctuations, R (Reference Bartelt, Buser and PlatzerBartelt and others, 2006). The flow height of the core is h Φ. α and β are model parameters, discussed in the following section. The flowing avalanche is driven by the gravitational acceleration in the tangential directions, G = = (Gx , Gy )T = (M Φ gx , M Φ gy )T . The total normal pressure, N, at the base of the avalanche is given by the weight per unit area, N g, and the centripetal pressure, N f (Reference Fischer, Kowalski and PudasainiFischer and others, 2012),
The total slope perpendicular acceleration of the flow column is therefore the sum of gravity, gz , and centripetal accelerations, fz :
The total normal pressure is therefore N = M
Φ
g′. The term ![]() represents the snow influx by entrainment. This term is especially important as the mass influx is associated with a corresponding influx of heat energy defined by the snow-cover temperature. It is discussed in the next section. Frictional resistance is given by the Voellmy-type shear stress (Reference VoellmyVoellmy, 1955), S
Φ = (S
Φx
, S
Φy
)T, with
represents the snow influx by entrainment. This term is especially important as the mass influx is associated with a corresponding influx of heat energy defined by the snow-cover temperature. It is discussed in the next section. Frictional resistance is given by the Voellmy-type shear stress (Reference VoellmyVoellmy, 1955), S
Φ = (S
Φx
, S
Φy
)T, with

i.e. the shear stress is a function of the avalanche velocity, u Φ, fluctuation energy, R, and total pressure, N, in the z-direction (ρ Φ is flow density). We define the functional dependency of the friction parameters (μ, ξ) on R as

and

With this frictional model μ 0 and ξ 0 are the friction coefficients associated with the volume, and therefore the non-fluidized state, R = 0. The model parameter R 0 defines the activation energy required to fluidize the core (Reference Bartelt, Bühler, Buser, Christen and MeierBartelt and others, 2012b). We apply second-order HLLE schemes to solve the equations on general quadrilateral grids (Reference Christen, Kowalski and BarteltChristen and others, 2010).
Thermal Heat Production and Melting
Frictional and collisional dissipation
The frictional work rate (dissipation rate) is
Frictional work is required to produce both the fluctuation energy, R, and internal heat energy, E (Reference Bartelt, Buser and PlatzerBartelt and others, 2006). As fluctuation energy is produced according to
thermal heat energy is generated according to
We consider no loss of heat energy by conductive boundary fluxes or radiation. The avalanche stops before cooling processes are relevant (Reference Miller, Adams, Schmidt and BrownMiller and others, 2003). Therefore, we consider only thermal heat advection during avalanche motion and do not model diffusive heat transfer within the avalanche flow. For the timescale of the avalanche, diffusive processes are small, as Peclet numbers are Pe » 1 (Reference Incropera and DeWittIncropera and DeWitt, 2002). Energy conservation requires (Reference Bartelt, Buser and PlatzerBartelt and others, 2006)
Moreover, the frictional work rate, ![]() , is split into two parts. One part is dissipated immediately to heat, E, while the second part becomes fluctuation energy, R. The splitting fulfils the condition that the sum of the change in kinetic energy,
, is split into two parts. One part is dissipated immediately to heat, E, while the second part becomes fluctuation energy, R. The splitting fulfils the condition that the sum of the change in kinetic energy, ![]() , the change in random kinetic energy,
, the change in random kinetic energy, ![]() , and heat energy,
, and heat energy, ![]() , is equal to the work done by gravity,
, is equal to the work done by gravity, ![]() :
:
Model parameter α describes the production rate of random energy from the shear work, ![]() . When α = 0, all frictional shear work is dissipated immediately to heat. No intermediate fluctuation energy can exist in the avalanche. When α > 0, fluctuation energy is produced from the shear work, but inelastic interactions between snow granules (shearing, collisions, rubbing) cause the fluctuation energy to decay to heat at a rate β (Reference Buser and BarteltBuser and Bartelt, 2009). All fluctuation energy created within the avalanche will eventually decay to heat. The model parameters (1 − α and β) therefore define the relative production of heat by internal shearing and decay of fluctuation energy, respectively. Typically α ∼ 0:1, meaning that 90% of thermal energy is generated by shear and only 10% by collisional interactions between snow granules. The temperature, T
Φ, is a measure of the internal heat energy, E, contained within the representative volume, V
Φ. This volume is defined between the basal boundary and the avalanche top surface given by the flow height, h
Φ, with flow density, ρ
Φ. The flow volume contains snow in the form of particulate mass and air. The particulate mass is in the form of snow granules and other snow-cover fragments that are produced during the release slab break-up and the churning motion of the avalanche core. The flow density of the volume, ρ
Φ, is
. When α = 0, all frictional shear work is dissipated immediately to heat. No intermediate fluctuation energy can exist in the avalanche. When α > 0, fluctuation energy is produced from the shear work, but inelastic interactions between snow granules (shearing, collisions, rubbing) cause the fluctuation energy to decay to heat at a rate β (Reference Buser and BarteltBuser and Bartelt, 2009). All fluctuation energy created within the avalanche will eventually decay to heat. The model parameters (1 − α and β) therefore define the relative production of heat by internal shearing and decay of fluctuation energy, respectively. Typically α ∼ 0:1, meaning that 90% of thermal energy is generated by shear and only 10% by collisional interactions between snow granules. The temperature, T
Φ, is a measure of the internal heat energy, E, contained within the representative volume, V
Φ. This volume is defined between the basal boundary and the avalanche top surface given by the flow height, h
Φ, with flow density, ρ
Φ. The flow volume contains snow in the form of particulate mass and air. The particulate mass is in the form of snow granules and other snow-cover fragments that are produced during the release slab break-up and the churning motion of the avalanche core. The flow density of the volume, ρ
Φ, is
where θ ice and θ air are the volumetric fractions of ice and air, respectively. The ratio between internal heat energy, E, and temperature, T Φ, is given by
where c Φ is the specific heat capacity of the co-volume mass
with c ice the specific heat capacity of ice (2110J kg−1 K−1) and c air the specific heat capacity of air (1012 J kg−1 K−1) (Reference Armstrong and BrunArmstrong and Brun, 2008).
Thermal energy entrainment
Snow of density ρ
Σ and temperature T
Σ is entrained at a rate ![]() (kg m−2 s−1) (Fig. 3). The snow starts at rest and is accelerated to the avalanche flow velocity. The entrainment rate is parameterized using the erodibility parameter, κ, and the slope-parallel speed of the avalanche (Reference Christen, Kowalski and BarteltChristen and others, 2010):
(kg m−2 s−1) (Fig. 3). The snow starts at rest and is accelerated to the avalanche flow velocity. The entrainment rate is parameterized using the erodibility parameter, κ, and the slope-parallel speed of the avalanche (Reference Christen, Kowalski and BarteltChristen and others, 2010):
Definition of avalanche core, Φ. We consider the thermal energy balance within a representative flow volume, V Φ, in the avalanche core. The height of the core is h Φ. Thermal energy, E, is associated with the flowing snow mass which resides in the co-volume V Φ, which has height h Φ and density ρ Φ.
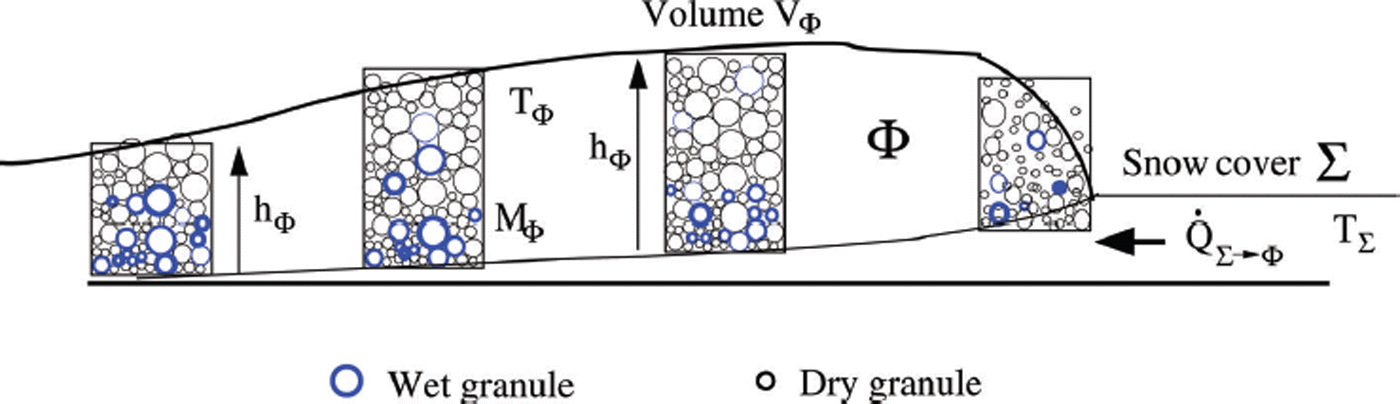
The total influx of internal heat energy within the avalanche core volume of height h Φ is then
This entrainment model does not account for thermal heat or fluctuation energy produced during the break-up and granularization of the incumbent snow cover. Let ![]() represent the frictional work involved in this process. In this model formulation, we take
represent the frictional work involved in this process. In this model formulation, we take ![]() . Moreover, the energy required to accelerate the entrained mass to the avalanche velocity is subtracted directly from the kinetic energy of the main flow in the slope-parallel direction. Entrainment therefore decreases the speed of the avalanche.
. Moreover, the energy required to accelerate the entrained mass to the avalanche velocity is subtracted directly from the kinetic energy of the main flow in the slope-parallel direction. Entrainment therefore decreases the speed of the avalanche.
Meltwater production and lubrication
When the temperature of the flowing snow, T m, reaches 0°C, the ice grains in the snow granules begin to melt and meltwater is produced. We assume that capillary pressures retain the meltwater in the pore space of the flowing snow and that the meltwater is transported with the flow.
To calculate the meltwater production a phase-change constraint is added to the model. When the flowing-snow temperature exceeds the melting temperature, T Φ > T m, within a time interval dt, the energy associated with the excess temperature (Fig. 4),
When T Φ > T m, melting occurs. The latent heat, which is proportional to the difference, T Φ − T m, is subtracted from the energy equation to constrain the temperature at T m (Eqn (21)).

is used to drive the phase change and produce meltwater at a rate ![]() ,
,
where L f is the latent heat of fusion (334 kJ kg−1). The quantity M w is the meltwater mass per unit area, M w = ρ w h w, where h w is the height of water in the volume V Φ and ρ w is the density of the meltwater.
The effect of meltwater is to lubricate sliding surfaces, decreasing the dry friction (Reference ColbeckColbeck, 1992). We have no information on the distribution of meltwater over the flow depth of the avalanche and relate the decrease in friction to the total meltwater contained in the flow volume, V Φ.
We apply the function

where μ wet is the sliding friction coefficient of wet snow (μ wet = 0:12) and h m is a constant defining the decrease of friction as a function of the meltwater content (h m = 0.01 m). Equation (23) treats the effects of the fluctuation energy and meltwater on the Coulomb friction as two independent processes. It satisfies the physical constraint that as h w → 0 and R → 0 the equation collapses to the dry Coulomb friction parameter μ = μ 0. The function is defined such that the Coulomb friction, μ, cannot decrease to values less than μ wet. The function corresponds to observations of wet snow avalanche runout on flat slopes (Reference ColbeckColbeck, 1992). In future work we will consider the possibility that meltwater can adhere to the basal surface, lubricating sections of the avalanche track.
Model summary
The thermal energy equation (Eqn (13)) and meltwater production and transport equation (Eqn (22)) can be added to the general system of model equations (Eqns (1–4)). It is convenient for numerical solutions to write these equations in compact matrix form:
A model formulation with six state variables results:
The flux components, Φ x , Φ y , are:

The source terms, G Φ, are

The mass, M Φ, contains both the ice mass of the flowing snow and the meltwater, M w. There is therefore no momentum exchange between the snow ice and liquid phases. The model was applied to simulate four case studies. The equations are solved using the numerical schemes outlined by Reference Christen, Kowalski and BarteltChristen and others (2010).
Model Calculations
Temperature entrainment calculations on an inclined plane
To investigate the relationship between release temperature, T 0, entrainment temperature, T Σ, and slope angle, we applied the model to simulate avalanche flows on an infinite inclined plane (Fig. 5). The simulation series allowed us to investigate model results without considering variations in natural terrain. The slope angle was varied to produce different frictional dissipation rates in the avalanche core. We performed three sets of simulations: (1) identical released mass at the same initial temperature with no entrained snow at three different slope angles; (2) identical released mass at the same slope angle with four different initial temperatures; and (3) identical mass released at the same four different initial temperatures and slope angle entraining snow at two different temperatures (Table 1). The grid size and friction parameters were kept constant to allow comparison between the simulation results. In all three case studies the release depth was set to h 0 = 1 m and release density ρ 0 = 300 kg m−3. When entrainment was specified, the entrainment height and density were also kept constant, h Σ = 0.20 m and ρ Σ = 300 kg m−3.
Three series of simulations were carried out on an infinitely long inclined plane (Table 1). The slope angle, φ, release temperature, T 0, and entrained snow temperature, T Σ, varied in the simulation. The outputs give the maximum calculated temperatures when the flow stops.

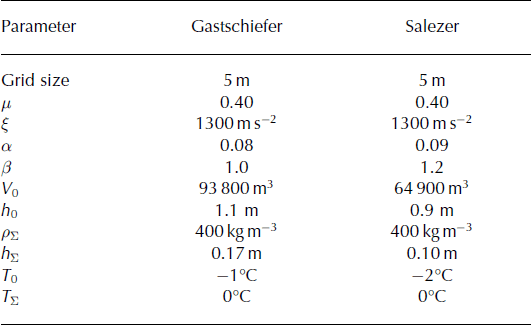
Summary of input and simulation parameters for the numerical experiments on an infinite inclined plane (Fig. 5)

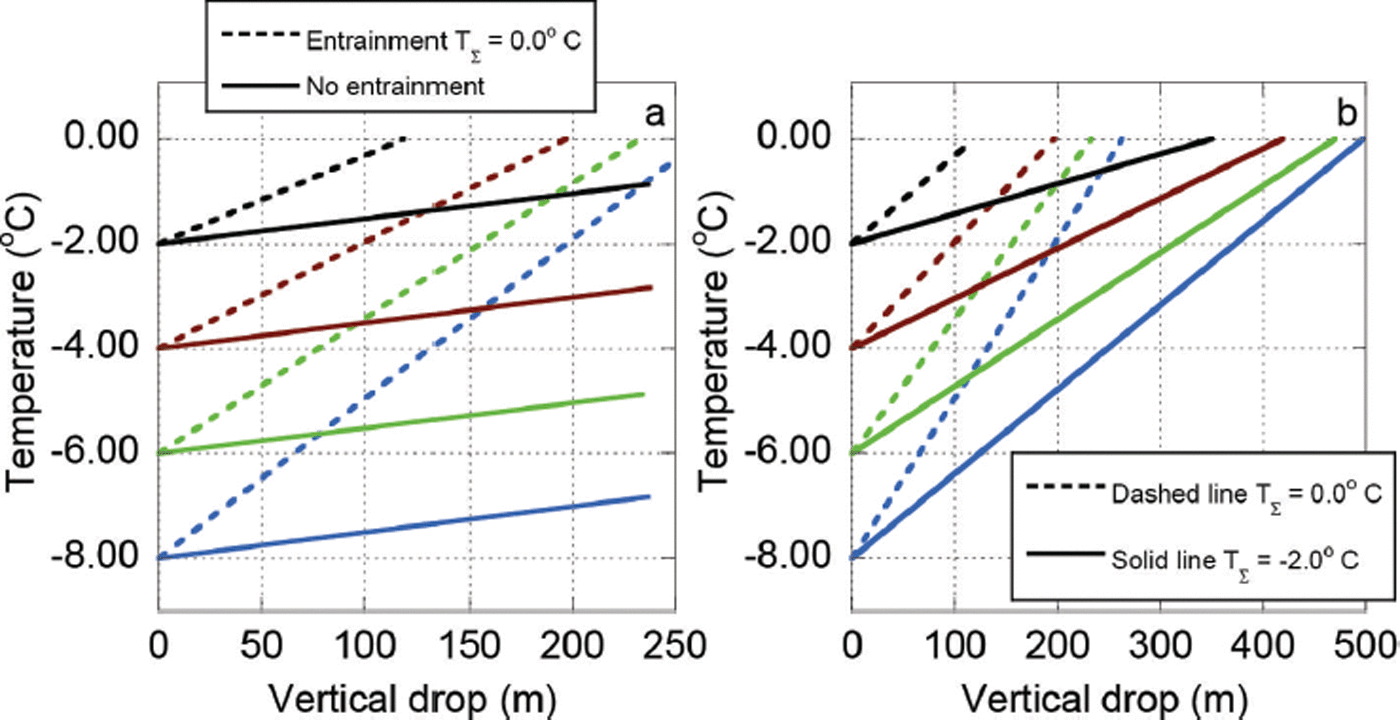
The increase of the snow flowing temperature, T Φ,, for flows at different slope angles with no entrained mass, show that the model correctly dissipates energy proportional to the vertical height drop (the total change in potential energy), i.e. there is no influence of the slope angle on dissipation rate for constant friction parameters (Fig. 6). The total temperature rise is constant for the same vertical drop, but the flows on the steeper slope reach the final temperature faster (higher slope angle leads to higher speeds and quicker warming, but the total energy dissipated is always proportional to the vertical drop, therefore the final dissipated energy will be the same). The example simulation for a 25° slope angle stopped before reaching T Φ, = 0°C. With no entrainment the avalanche stopped flowing after 200 m of vertical drop (Fig. 6).
Temperature calculations performed on the inclined plane with identical mass and initial temperature, but with three different slope angles (25°, 30°, 35°) and no entrained mass. Note that temperature gradient with vertical drop is the same for the three cases. However, the example calculated with 25° stopped before reaching 0°C, whereas the other two cases reached 0°C after dissipating the same amount of potential energy (∼380 m vertical).

In the next series of numerical experiments, we held the slope angle of the plane constant (φ = 35°) but varied the release temperature, T 0, and the entrained mass temperature, T Σ (Fig. 7). We investigated four release temperatures, T 0 =−2, −4, −6, −8°C. For the case with no entrainment, the rise in avalanche temperature with vertical drop is constant, indicating a constant dissipation rate (Fig. 7). When entrainment is included, T Σ = 0°C and T Σ = −2°C, the temperature rise with vertical drop is no longer constant. In fact, the slope of the temperature rise increases with relative difference between the release temperature and entrainment temperature. Although the influx of heat energy is the same, the averaging procedure leads to a slightly higher warming rate for lower release zone temperatures. In comparison to frictional heating, entrainment appears to be a more effective way to increase the average temperature of the avalanche. Higher entrainment temperatures lead to higher warming rates (Fig. 7b). An avalanche that starts as a cold slab can reach high temperatures quickly by entraining warm snow. In this case study, the rise in temperature without entrainment was ∼+1 °C per 200 m of vertical drop. When entraining snow at T Σ = 0°C we find the rise in temperature to be ∼+2°C per 100m of vertical drop, i.e. almost four times higher than the case without entrainment.
Temperature calculations performed on the inclined plane with identical slope angle, 35°, and identical initial mass, but varying the temperature of the released mass. (a) Different release temperatures from −2 to −8°C entraining snow at 0°C (dashed line) and with no entrainment (solid line). Note that with no entrainment the avalanche stops before reaching 0°C, but with entraining snow at 0°C the avalanches reached the melting point after different vertical drops, depending on the initial temperature. (b) Different release temperatures from −2 to −8°C entraining snow at 0°C (dashed line) and −2°C (solid line). The varying slopes of the lines are the result of the relative temperature differences between released and entrained snow.
Gatschiefer and Salezer avalanches
The Gatschiefer (Klosters, Switzerland) and Salezer (Davos, Switzerland) avalanches occurred spontaneously on the afternoon of 23 April 2008. Both started as dry-slab avalanches and ended as wet snow avalanches. They are well-documented events, as aerial laser scanning of the release and deposition zones was performed. Aerial photographs help delineate the exact extent of the release zones. Furthermore, it was possible to enter the runout zones several hours after release to investigate depositional features (Reference Bartelt and McArdellBartelt and McArdell, 2009; Reference Bartelt, Glover, Feistl, Bühler and BuserBartelt and others, 2012a). Temperatures at the time of release were determined from local weather stations located <1 km from the starting zones. The stations measured both air and snow surface temperatures. The Gatschiefer avalanche was recorded by chance by a passing bus driver; therefore front velocities could be estimated by video analysis (http://www.youtube.com/watch?v=kgY43LZ8o94).
The Gatschiefer avalanche started from two main release areas (Fig. 8). The first area was large (141 000m2) and located at 2200 m a.s.l. The fracture crown extended 250 m along the mountain crest. The second release area was smaller (21 000 m2) and located at 2100 m a.s.l. The entire snow cover released from both areas. From laser scan measurements, the mean fracture height of the large area was estimated to be 2.5 m. The fracture height of the secondary release zone was determined to be 1.6 m. Immediately below the upper release zone the avalanche deposited 194 000 m3 of snow on a terrain terrace (Fig. 8). Assuming a release density of 300 kg m−3 and a deposition density of 500 kg m−3, the deposited mass in this region corresponds to 83% of the total release mass. Thus, 192 100 m3 (57 630 t) of snow continued down into the track from the two release areas. From the laser-scanning measurements, the estimated volume of the lower deposit was 153 000m3. Assuming a deposit density of 500 kg m−3, the mass of the deposit was >77 000 t. Thus, the avalanche increased in mass by 18 870 t. Assuming a potential erosion area of 280 000 m2, this corresponds to an average entrainment depth of h Σ = 0.17 m (of snow with a density of 400 kg m−3) (Reference Sovilla, Sonatore, Bühler and MargrethSovilla and others, 2012).
Gatschiefer avalanche. (a) Avalanche release area and upper avalanche track. (b) Closer view of the Release 1 and 2 and Deposit 1 areas. A large part of the initial released area was deposited at Deposit 1 (Reference Sovilla, Sonatore, Bühler and MargrethSovilla and others, 2012).

The mean snow-cover temperature of the release zones (T 0 = −1 °C) was estimated from snow surface temperature measurements from a weather station <200m from the starting zone. We estimated the temperature of the snow at lower elevations to be higher, T Σ = 0°C (Table 2). The avalanche event was simulated using data from the laser scan and weather station as initial values for release heights and temperature. It was possible to simulate the snow deposited on the terrain terrace. The total volume that reached the valley bottom is in good agreement with the laser scan measurements. The simulation results indicate that the flow temperature of the avalanche, T Φ, reaches 0°C after descending 200 m vertically (Fig. 9). After 300 m of vertical drop the entire flowing mass is at T Φ, = 0°C and considerable melting occurs. Meltwater contents reached 10 mm m−2, h w = 0.01 m (Figs 10 and 11). Snow that departed from the primary release area and was deposited on the upper terrace did not reach the melting point. A large amount of snow stopped before the avalanche reached the melting temperature. There is good agreement between the measured and simulated extent and height of the avalanche deposits in the runout zone. The avalanche did not fluidize and flowed as a dense flowing avalanche at 5 m s−1 in the runout zone. The deposition occurred in two waves. The measured velocity from video recordings was estimated as 5ms−1, in agreement with the calculations (Fig. 10). At the end of the runout the entire snow mass within the avalanche was at 0°C, (Fig. 9). We performed an additional simulation setting T 0 = T Σ = −5°C. The avalanche stopped completely on the upper plateau and did not reach the runout zone.
Summary of input and simulation parameters for the avalanche simulations of the different case studies
Snow temperature calculations for (a) the Gatschiefer avalanche and (b) the Salezer avalanche. In both cases the model predicted that the avalanche would begin to produce meltwater within only a few metres of vertical drop. Both avalanches flowed at 0°C until the final deposition.

(a) Gatschiefer avalanche maximum calculated velocity. The calculated maximum velocities agree with the observed front velocities from the video recording (Reference Sovilla, Sonatore, Bühler and MargrethSovilla and others, 2012). (b) Calculated meltwater production. The model predicts maximum meltwater production at the points of maximum velocity.

Calculated meltwater profiles for (a) Salezer avalanche and (b) Gatschiefer avalanche. Both profiles are positioned at the middle of the avalanche flow.

The Salezer avalanche was also characterized by multiple releases, probably triggered at the same time (Fig. 12). In comparison with Gatschiefer, the release zones were higher, 2400–2200 m a.s.l., and the mean release temperatures were slightly lower, T 0 = −2°C. Observations revealed full-depth fracture planes. Laser-scanning measurements outside the avalanche path estimated the snow-cover depth before the avalanche to be 0.9 m, on average. This value was used to determine the avalanche fracture height. The temperature of the snow cover was determined from a weather station in the neighbouring area (Weissflujoch, Davos), T Σ = 0°C. The estimated release volume was ∼67 000 m3. The measurements revealed that 35 750 m3 of snow was deposited in the runout zone. Thus, 31 250 m3 of snow was deposited at the upper terrace. Assuming a density of 300 kg m−3 for the release zone and 400 kg m−3 for the deposition zone, the avalanche entrained an additional 3575t of snow. Because the potential entrainment area is ∼120 000 m2, the average entrainment depth is h Σ = 0.10 m. Most of the Salezer avalanche path is located in a narrow gully. Entrainment volumes were thus smaller than in the Gatschiefer case study.
(a) Aerial image of the Salezer avalanche, 23 April 2008. Release occurred 2200–2400 m a.s.l. The avalanche flowed through a gully with a shallow snow cover. (b) Closer view of the avalanche deposits in the runout zone. Photograph by C. Wilhem.

This event is interesting because frictional heating, not entrainment, is the primary heating mechanism. Like the Gatschiefer avalanche, the Salezer avalanche quickly reached the melting temperature in the upper regions of the flow path (Fig. 9). The model predicts that considerable melting occurred before the avalanche exited the narrow gully and stopped on the 18° runout zone (Figs 11 and 13). The avalanche fluidized only in the upper regions of the path, where the slopes were high (α = 0.08, β = 1.0s−1; Table 2). In the runout zone the flow velocities were <2 m s−1 (Fig. 13).
Salezer avalanche (a) maximum calculated velocity and (b) calculated meltwater production. The maximum meltwater production occurred in the gully.

Andina copper mine, Chile
Andina copper mine is located 100 km to the northeast of Santiago de Chile in the Cajon del Río Blanco valley, Chile. The mine is at the end of the 35 km long north–south oriented valley. The valley entrance is at 1700 m a.s.l. and the mine is situated at its end on a glacial bed at 4200 m a.s.l.
Since the valley is north–south oriented, the avalanche paths start at slopes with east- or west-facing aspects. The avalanche paths start mostly on an open slope at high altitude (3200–4500 m a.s.l.) and become channelized through rough terrain until they reach the valley bottom, endangering the mine service road. After 21–28 km the valley becomes narrower and all the avalanche paths jeopardize the mine service road. Due to the maritime climate of the region, most of the avalanches contain warm, moist snow. Avalanches range from mid-sized (V = 20 000–30 000 m3; Fig. 14) to very large, catastrophic avalanches (V > 100000m3) that can reach lower elevations. Mid-sized avalanches can occur several times each winter, following significant snowfall.
Image from the avalanche at km 28 from the industrial road at the Andina mine on 9 September 2013. The avalanche started as a point release below a rock band and eroded the warmer uppermost snow cover, reaching a mine service road. Photograph from C. Vera, SLF. The calculated model velocity reached 18 m s−1 at the steepest track segment.

On 9 September 2013 a wet snow avalanche released at 14:00 at 3245 m a.s.l. after 2 days of intense thermal cycling (Fig. 14). An automatic weather station located 300 m above the release area measured an air temperature of 7°C at release. The snow surface temperature was 0°C for the 3 hours before release. The avalanche started as a point release below a rock band and eroded the uppermost snow layer and spread across the slope while flowing down, reaching a width of 150 m at the runout (Fig. 14). The erosion depth of 30 cm was measured in the field the day after the avalanche released. This value coincides with the snow layer saturated with water observed from snow-pit measurements performed 4 hours before the avalanche occurred. The runout reached the valley bottom and stopped at a mine service road. The mean height of the deposits was 1.5 m.
We simulated the avalanche by specifying a triangular release area of 900 m2 and 30 cm entrainment depth, reproducing the observed avalanche starting conditions. The starting mass had a temperature of T 0 = 0°C (Table 3). The model correctly predicted the deposition and runout on the mine access road (Fig. 14). Since the initial snow temperature was T 0 = 0°C, flowing snow began to melt immediately (Fig. 15), producing meltwater which was transported with the flow. The meltwater production reached a total of 1.5 mm m−2 (Fig. 15). The maximum calculated speed of 18 m s−1 agrees with the field observations made by the winter operation crew at the road (Fig. 14).
Meltwater profile calculations for the avalanche at Andina mine.

Summary of input and simulation parameters for the avalanche simulations of the different case studies

Bird Hill, south central Alaska
Bird Hill is a 3.2 km long ridge, on average 1000 m a.s.l. and south/southeast-facing, between Girdwood and Bird Point along the Turnagain Arm in south central Alaska. The steepest sections are in the upper elevations >700 m a.s.l. (up to 55°), which translates into, on average, 30° slopes continuing to sea level (Fig. 16). The Seward Highway and the Alaska Railroad are situated on a narrow strip of land between the terminus of the slope and the ocean. The ridge consists of ∼25 topographically similar avalanche paths. Avalanches frequently hit the highway and the railroad, accounting for 24% of all the avalanches reported by the Seward Highway Avalanche Program 1979–2013. At Bird Hill, small to medium-sized avalanches (up to ∼0.5m fracture height, <50 000m3 release volume) have historically exhibited surprisingly long runout distances and debris piles on the highway and the railroad, indicating significant snow entrainment at mid-elevation (personal communication from H. Hamre, 2013).
Avalanche calculations at Whiskey no. 934, Bird Hill. Release is situated at 1000 m a.s.l. and finishes on the coastline. The left column (a, c, e) shows the flow height, velocity and temperature calculations for an example calculated with T 0 = −2°C and T Σ = −1°C. The right column (b, d, f) shows the same calculations, but modifyingthe release temperature and the entrainment temperature to T 0 = −4°C and T Σ = −4°C. Note the difference in runout distance and velocity between both simulations after modifying the initial temperature conditions.

Coastal south central Alaska’s maritime snow climate is characterized by large snowstorms and strong winds, most often due to a dominant low-pressure system over the Gulf of Alaska (Reference Hendrikx, Murphy and OnslowHendrikx and others, 2014) that is in its strongest phase in January (Reference MockMock, 1996). Air temperatures as high as +10°C are possible, as a result of occasional warm, downslope winds that move westward through the Turn-again Arm (Reference MockMock, 1996).
A set of hypothetical avalanches were modelled along the avalanche path named Whiskey no. 934 at Bird Hill, to compare avalanche runout distances resulting from variable snow-cover temperatures. A release volume of ∼10 300m3 (fracture height 0.5m) was simulated with release snow temperature, T 0, from −4 to −1°C. The entrainment height was 0.25m and simulations were performed with snow temperatures T Σ = 0, −0.5, −2 and −4°C (Table 3).
The avalanches consistently accelerated in the upper steep section of the path and decelerated over ∼600 m, where the slope lessens to ∼30°. The avalanches continued flowing below this point with different flow characteristics, depending on the temperature of the entrained snow. T 0 = T Σ = −4°C resulted in an avalanche that stopped early (Fig. 16d). However, a simulated theoretical avalanche with T 0 = −2°C and T Σ = −1°C reached the road at the bottom of the slope, with speeds close to 18 m s−1 and flow heights of 2 m (Fig. 16a and c). The warmer example entrained snow close to the melting point, the snow temperature reached 0°C after <200m of vertical drop (Fig. 16e) and started producing meltwater. The meltwater decreases the friction (Eqn (23)). The combined effect of decreasing friction and entraining warm snow increases the avalanche runout. The temperature of entrained snow determined the elevation at which this process occurred (Fig. 17). When the initial release snow temperature is high and the avalanche encounters even higher snow temperatures at mid-elevation, entrainment is facilitated and the avalanche is capable of increasing its mass significantly (Fig. 18). Any combination of higher release temperature and entrainment temperature than that shown in Figure 16 will result in an avalanche reaching the bottom of the slope. Although meltwater is produced in the transition zone (Fig. 19), it is advected with the flow, and the meltwater content reaches high values at the bottom of the slope in the deposition zone. In this case study, meltwater advection (Eqn (26)) appears to be an important transport mechanism to describe the mobility of avalanches in the runout zone.
(a) Calculated erosion rate with T 0 = −2°C and T Σ = −1 °C and (b) meltwater production in Whiskey no. 934 avalanche. Note that the meltwater production occurs after 200m of vertical drop (800 m a.s.l.), which coincides with the highest calculated velocity (Fig. 16) and the highest entrainment rate.

Entrainment mass for the two examples: T 0 = −2°C and T Σ = −1°C in black and T 0 = −4°C and T Σ = −4°C in red. The first avalanche continued flowing at mid-elevation and entrained warm snow until the end of the slope (Fig. 16). The second avalanche with colder snow stopped earlier, before reaching the melting point (Fig. 16).

Meltwater calculations at Whiskey no. 934, with T 0 = −2°C and T Σ = −1°C. The meltwater produced along the track is shown in black and the same meltwater produced and also transported with the advection velocity of the avalanche is shown in red (Eqn (26)).

Discussion and Conclusions
In this paper we have extended an existing avalanche dynamics model to calculate flow temperature and meltwater production within an avalanche core. The model includes two dissipative processes that lead to a rise in avalanche temperature. It can be used with a wide range of initial snow release and snow entrainment conditions. It allows us to simulate wet snow avalanches and dry snow avalanches separately, but also allows us to study the case of an avalanche starting as a dry cold avalanche and transforming into a wet snow avalanche because it entrains warm moist snow along the avalanche path.
We draw three main conclusions from our analysis and applications:
The temperature rise from frictional heating is ∼1 °C. For small avalanches it is ∼0.1°C. The exact value depends on the size of the avalanche and the distance the avalanche travels. This modest temperature rise is significant only when the release temperature, T 0, is ∼0°C or slightly lower. Only then can sufficient meltwater be produced to lubricate the motion of the avalanche. Avalanches that start in cold conditions (e.g. T 0 < −5°C) and entrain cold snow (e.g. T Σ < ∼2°C) will not change phase under most topographic conditions.
Snow entrainment is the dominating process that controls the avalanche temperature and therefore flow regime. Warm, dense snow can quickly change the thermal flow regime of the avalanche, even when the starting temperature is low (e.g. T 0 < −5°C). Long-running wet snow avalanches are possible when warm, moist snow can be entrained. For example, the likelihood of an avalanche hitting the highway in the Alaska and Chile case studies should not only be linked to the amount of erodible snow at mid-elevation, but also to the temperature and density of the snow cover that potentially can be entrained. Warming of the snow surface as a result of strong solar radiation or a sudden increase in air temperature is worth close attention for more accurate forecasts of avalanche runout. Rain on snow, a common occurrence in maritime regions, introduces both heat and meltwater into the snow cover and therefore has a strong influence on the avalanche flow regime.
When the avalanche reaches T Φ,=T m, meltwater production depends on the dissipation rate. The dissipation rates are generally highest in the main body of the avalanche, where flow heights and speeds are large. They decrease towards the lateral edges of the flow. Meltwater therefore accumulates in the avalanche interior behind the avalanche front. The spatial variation of temperature and meltwater production therefore explains several features of avalanche deposits, such as location of glide planes with refrozen surfaces. These are often located upslope of the avalanche front between levee side-walls (Reference Bartelt, Glover, Feistl, Bühler and BuserBartelt and others, 2012a). Meltwater lubrication therefore assists the formation of levees that are a common feature of wet snow avalanche flows.
Currently the model does not take into account the distribution of temperature in the z slope perpendicular direction. In the future it might be necessary to model this temperature distribution (e.g. when modelling lubrication processes at the basal boundary). However, at present, the stream-wise variations in temperature in the slope-parallel directions are of primary interest. We find significant variations in both width and flow length of the avalanche. This creates spatial variations in flow temperature. The importance of this result is that experimental investigations with snow avalanches should be able to measure these variations at a particular location in time. This would make the application of thermal cameras a useful addition to other videogrammetric recordings. If it is possible to measure the thermal initial and boundary conditions, it might even be possible to reconstruct snow entrainment rates from measured temperature histories. Our results reveal that measured temperatures would contribute to a better understanding of other point measurements (pressure, velocity) because temperature is a path-dependent variable that contains much of the avalanche history. The prerequisite for such an analysis is a physical model that accounts for the complex nature of dissipative processes in snow avalanches. Our driving conjecture is that these processes are not only linked to friction in the slope-parallel direction, but also to the heat produced by granular interactions in the avalanche core. Each of these processes has a different dissipation rate and depends on the avalanche flow regime.
Another problem is apparent in our calculations. We applied a phenomenological rule relating the meltwater content to the frictional parameter, μ (Eqn (23)). This rule allows us to fit the measured runout and deposition heights of the wet snow avalanches we have observed in four field studies. Our basic postulate is that the total meltwater content per square metre of flow area is a good proxy for the reduction of flow friction and the lubrication of the basal surface. We do not have to account for detailed distributions in the z-direction of the avalanche, but assume that lubricated sliding on the basal surface is the dominant frictional mechanism controlling the runout of wet snow avalanches. The entire meltwater is collapsed down onto the flow area, as is common with depth-averaged models. Shear is concentrated at the basal layer where frictional heating is large and meltwater production high. We model a plug-like flow behaviour (Reference Dent and LangDent and Lang, 1983; Reference SalmSalm, 1993; Reference Dent, Burrell, Schmidt, Louge, Adams and JazbutisDent and others, 1998; Reference Kern, Bartelt, Sovilla and BuserKern and others, 2009). In the next steps of model development we will consider how meltwater changes the production and decay of random energy, the granularization process and cohesion.
Acknowledgements
Financial support for this project was provided by Codelco Mining, Andina Division (Chile). We thank A. Ellena and L. Cornejo for starting the project and their helpful insights into the wet snow avalanche problem. In addition we thank avalanche alert centre members L. Gallardo, M. Didier and P. Cerda, not only for their support, but also for their confidence, patience and enormous help during the three winters in the Andina mine.


