

Introduction
Taylor Glacier originates at the edge of the East Antarctic plateau, on Taylor Dome. It follows a tortuous path through the Transantarctic Mountains, and terminates in several lobes in the McMurdo Dry Valleys. Sublimation dominates the surface mass balance on most of the 80 km long ablation zone. Although Taylor Glacier accounts for a trivial fraction of the outflow from the ice sheet, several aspects make it a feature of primary importance and motivate our investigation of its ablation. The glacier connects the site of a 100000 year ice-core climate history with an extensive glacial geological record in the terminal valleys (Reference BrookBrook and others, 1993; Reference Marchant, Denton and SwisherMarchant and others, 1993; Reference SteigSteig and others, 2000; Reference Higgins, Denton and HendyHiggins and others, 2000b,Reference Higgins, Hendy and Dentona). The ablation zone itself exposes late-Pleistocene ice that is a resource for paleoclimate studies (Reference Aciego, Cuffey, Kavanaugh, Morse and SeveringhausAciego and others, 2007). The main terminus lies in Taylor Valley, the location of Antarctica’s premier Long Term Ecological Research (LTER) site (Reference PriscuPriscu, 1999; Reference DoranDoran and others, 2002). In all of these contexts, it is essential to understand how Taylor Glacier waxes and wanes over time.
In addition to these specific regional issues, Taylor Glacier is a useful laboratory for general studies of sublimation. In Antarctica, ∼1% of the total ice-sheet area comprises blue-ice zones (Reference BintanjaBintanja, 1999). Of such zones, Taylor Glacier has been the most intensively studied for ice dynamics (Reference Kavanaugh and CuffeyKavanaugh and Cuffey, 2009). All across Antarctica, net surface balance rates depend primarily on accumulation minus sublimation and wind scour (Reference Van de Berg, van den Broeke, Reijmer and van MeijgaardVan de Berg and others, 2005). Though small in magnitude, sublimation can amount to 10–15% of accumulation (Reference Van den BroekeVan den Broeke, 1997; Reference Lenaerts, van den Broeke, Déry, König-Langlo, Ettema and MunnekeLenaerts and others, 2010). Less significant, but still not negligible, are sublimation losses in central Greenland (Reference Box and SteffenBox and Steffen, 2001). In contrast to these cases, accumulation is essentially absent from much of Taylor Glacier (Reference Fountain, Nylen, MacClune and DanaFountain and others, 2006); this provides an opportunity to study sublimation with a minimum of confounding factors.
Previous studies at Taylor Glacier have elucidated ice dynamics of both the accumulation and ablation zones (Reference RobinsonRobinson, 1984; Reference Hubbard, Lawson, Anderson, Hubbard and BlatterHubbard and others, 2004; Reference Morse, Waddington and RasmussenMorse and others, 2007; Reference Kavanaugh and CuffeyKavanaugh and Cuffey, 2009; Reference Kavanaugh, Cuffey, Morse, Conway and RignotKavanaugh and others, 2009a), connections to geomorphology (Reference Higgins, Denton and HendyHiggins and others, 2000b), basal properties (Reference Hubbard, Lawson, Anderson, Hubbard and BlatterHubbard and others, 2004; Reference Holt, Peters, Kempf, Morse and BlankenshipHolt and others, 2006) and the overall state of mass balance (Reference Kavanaugh, Cuffey, Morse, Bliss and AciegoKavanaugh and others, 2009b). Most relevant to the present study are Robinson’s work from the mid-1970s and the extensive recent investigations by A. Fountain and colleagues of ablation and energy balance on the lowest part of the ablation zone. Reference RobinsonRobinson (1984) found that ablation rates for 1976–77 varied linearly from ∼0.45 m w.e. a−1 at the terminus to 0.16 m w.e. a−1 at ∼1040 m a.s.l. He also determined (by measuring crevasse temperatures) that the mean annual temperature at the terminus was −17°C. From shallow drill holes, he established a lapse rate on the glacier of 4.0 ± 0.5°C km−1. Reference Fountain, Nylen, MacClune and DanaFountain and others (2006, their fig. 8) found ablation rates at the terminus of Taylor Glacier (averaged over a 7 year period, 1994–2001) to be 0.34 m w.e. a−1. Ablation rates linearly decreased to 0.12 m w.e. a−1 at the top of their survey, 11 km from the terminus at an elevation of 500 m. They found no significant temporal trend in the data. Using 11 years of data from a weather station 4 km up from the terminus, Reference Hoffman, Fountain and ListonHoffman and others (2008) found that melt occurred on only 42 days and most of the 0.18 m w.e. a−1 ablation occurred through sublimation. They also found that subsurface melt occurred more frequently than surface melt (with an energy-balance model that included solar radiation penetration into the ice). Reference Johnston, Fountain and NylenJohnston and others (2005) used an energy-balance model to understand the melt channels at the terminus of Taylor Glacier. The microclimate within the channel walls was more conducive to melt than the flat surface surrounding the channels.
Compared with this previous work, our study significantly expands the spatial scope and resolution of mass-balance measurements and advances understanding of the factors controlling sublimation on a large portion of this glacier. We specifically address the following questions: What are the spatial and temporal patterns of ablation, temperature, wind speed, humidity and energy fluxes on Taylor Glacier? What is the simplest model that can accurately predict sublimation from weather station data? Which weather variables are most important for that prediction? Under what synoptic conditions does rapid sublimation occur? How important are such events compared to the ‘background’ levels of sublimation?
Field Site
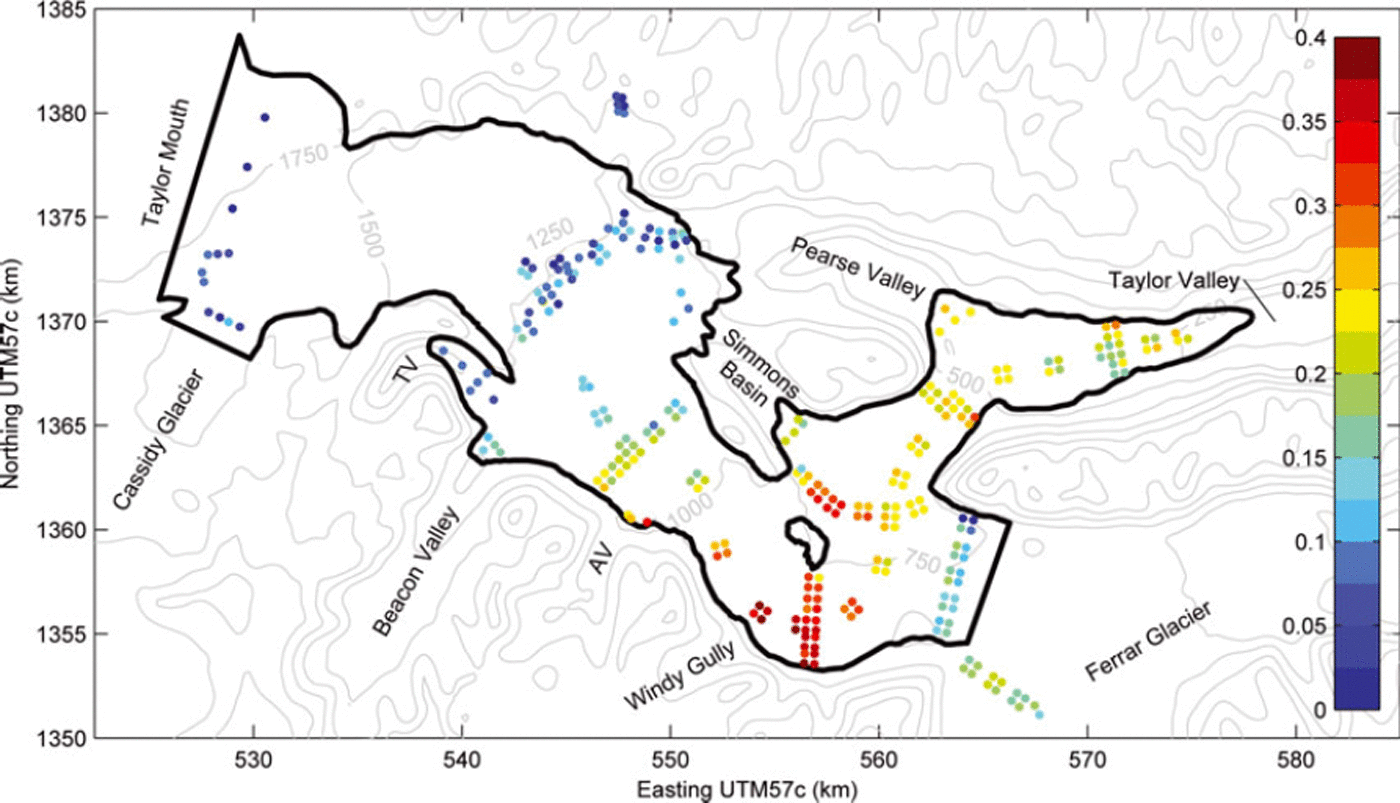
Figures 1 and 2 show the main features of the study region, in the vicinity of 77.75° S, 161.0° E. Taylor Glacier’s source on Taylor Dome (2365 m a.s.l.) is located ∼30 km west of the boundary of the figure. Ice flowing from the dome converges into Taylor Glacier proper at Taylor Mouth (1700 m a.s.l.). Between Taylor Mouth and ∼1100 m a.s.l. the glacier surface consists of patchy areas of bare ice and firn. It is heavily crevassed because of flow over bedrock steps and bumps. Our study focuses on the main part of the ablation zone (i.e. from which most mass loss occurs), which begins in a broad and gently sloping area north of Beacon Valley (∼1300 ma.s.l.) and extends to the main terminus in Taylor Valley (50 m a.s.l.). The glacier has a number of tributaries and distributary lobes. Significant tributaries include Cassidy Glacier and Windy Gully. Significant distributaries flow into Beacon Valley (and Turnabout Valley), Arena Valley and the upper and lower ends of Pearse Valley and Simmons Basin. Taylor Glacier also has a wide confluence with Ferrar Glacier but does not receive much mass from it (Reference Kavanaugh, Cuffey, Morse, Bliss and AciegoKavanaugh and others, 2009b). The mountains around the glacier rise up to 1500 m above the glacier; these features strongly affect the pattern of winds.
A SPOT (Système Probatoire pour l’Observation de la Terre) image of Taylor Glacier, Antarctica, showing this study’s weather station locations (numbered by elevation) and LTER weather stations at Lake Bonney (Bo), Taylor Glacier (T) and Beacon Valley (Be). Station 1 started at 1a and moved less than 2 months later to 1. Black dots represent ablation poles. The patchy snow line is near weather station 5 (abbreviated as Wx 5); the glacier surface to the east is blue ice. (Image credit: SPIRIT Program ©CNES 2009 and Spot Image 2008 all rights reserved.)

Measured ablation rates in the [3 :4] interval were highest (∼0.4 m a−1) at the base of the steeply sloping Windy Gully where the wind speeds, and hence the latent heat fluxes, were the highest. This plot also shows 250 m topographic contours generated from the RADARSAT Antarctic Mapping Project digital elevation model version 2 (Liu and others, 2001). TV is Turnabout Valley and AV is Arena Valley.
Ablation Data
Ablation measurement technique
We assessed ablation rates at a network of survey sites (Fig. 1), using the standard technique of repeated pole-height measurements. The 3 m long aluminum conduit poles were initially placed 2 m into the ice or firn. Exposed heights were determined as the average of measurements on the north and south sides of each pole (Reference BlissBliss, 2011). We also estimated depths of undulations on the surface; ice surfaces undulate at horizontal and vertical scales of order 10 cm and 1–10 cm, respectively. The configuration of the survey grid was primarily determined by the requirements of an ice dynamics study. Consequently, the density and spatial coverage are unusually large for a mass-balance program. The entire network was used in the first year of the study. Because of logistical constraints, subsequent measurements were obtained only at subsets of locations.
Measurements span a 4 year period, November 2002 to January 2007. In the 2002/03 summer field season (abbreviated as ‘3’), we installed 273 poles and measured initial heights. We revisited the entire network of poles in the 2003/04 season (‘4’) and also visited 73 poles along a flowline at season’s end on 26 January 2004 (‘L’ for late-season). Four poles near three of the weather stations were visited on 1 February 2006 (‘6’) by H. Basagic of Portland State University. Finally, 163 poles were measured again within 1 week of 1 January 2007 (‘7’), again by H. Basagic. The colon notation (e.g. [3 : 4]) used below represents the interval of time from one measurement campaign to another.
Uncertainties in ablation measurements
For each pole-height measurement, surface undulations introduced an uncertainty of one to a few centimeters (estimated as 25% of the undulation depth). More significant for our analyses was that local spatial variability – differences between nearby poles – showed that a single pole might do a poor job of representing the mean ablation of the local region. Fortunately, the local spatial variability tended to average itself out when considering longer time periods. For the [4 : L] interval (1–2 months), the average pole-height change was 3.2 cm and the average standard deviation of measurements among clustered poles was 36.0% of the ablation. For interval [3 : 4], the values were 19.2 cm and 15.6%. For interval [3 : 7], they were 67.7 cm and 8.0%. Sources of local variability included both measurement errors and sublimation variations, the latter related to microtopography, temporary coverage by snow dunes and, perhaps, micrometeorological effects. The sublimation from the ice surface was greatly reduced when covered by a snow dune. After a snow dune was removed via sublimation or wind scour, the exposed ice surface was much smoother than the surrounding surfaces with ablation hollows.
Measured ablation rates
Large-scale spatial variability of ablation
For the interval [3 :4], ablation rates on most of the surface ranged from 5 to 30 cm a−1 (Fig. 2). Above ∼1150 m, however, much of the glacier (the northern two-thirds or so) was covered with patchy firn and, in some places, received net accumulation. Bare ice was exposed along the southern margin. Ablation did not vary monotonically with elevation. It tended to increase down-glacier to a local maximum (up to 40 cm a−1) at ∼900 m altitude near the foot of Windy Gully. Rates varied little between ∼750 and 400 m altitude but then increased toward the terminus, where the highest values occurred (below our study area).
Temporal variability of ablation
In four separate campaigns, we obtained measurements at the same subset of sites: 67 poles arrayed on a 40 km long flowline from an elevation of 1080 m to within 3 km of the terminus (Fig. 3). The four measurement periods were 19 November to 12 December 2002, 13 December 2003 to 7 January 2004, 26 January 2004, and 27 December 2006 to 2 January 2007. The glacier ablated most rapidly during the Antarctic summer (e.g. interval [4 : L], December 2003 to late January 2004). The median ablation rate for that summer was 33.2 cm a−1 (standard deviation 22.5 cm a−1). For the whole year from late 2002 to late 2003, interval [3 : 4], the corresponding rates were 23.7 ± 5.59 cm a−1 (median ± standard deviation). But that year had higher ablation rates than the 3 year interval from late 2003 to late 2006, interval [4 : 7] (17.9 ± 5.11 cm a−1).
Measured ablation rates for intervals with weather station measurements. Summertime ablation rates were a factor of two faster than whole-year rates. For each set of four or six ablation poles (see map, Fig. 1), one symbol is plotted on the graph at the mean value of that group. The 25th and 75th percentiles within the group are plotted as the bottom and top of the gray error bar associated with the mean symbol. Symbols without error bars represent single ablation poles, so statistics could not be calculated. The stars are measurements of Reference RobinsonRobinson (1984) from November 1976 to November 1977. The set of single dots near Wx 5 are long-term ablation rates from 1993 to 2003 (personal communication from E.D. Waddington, 2005). The left-pointing triangle is that of Reference Hoffman, Fountain and ListonHoffman and others (2008) for ablation from 1995 to 2006. The weather station locations are plotted as text (e.g. Wx 1).

Weather Data
Weather station set-up
To inform our analyses of sublimation we set up six weather stations, five on Taylor Glacier itself (Wx 1 to Wx 5; Fig. 1) and one on top of the Friis Hills (Wx 6). Data from the latter are not considered here. The five glacier stations operated from November 2003 until December 2006. Each station measured wind speed and direction, temperature and relative humidity. Wx 1, 2 and 4 measured incoming and outgoing long- and shortwave radiation. Wx 5 measured net radiation. The instrumentation is detailed by Reference BlissBliss (2011).
The sensors at all stations recorded data every 5 min. Twenty-minute averages were transmitted to the Advanced Research and Global Observation Satellite (ARGOS) satellite system, and locally stored data were later retrieved from Wx 1, 2, 4 and 5. We removed spurious numbers in the ARGOS transmissions with an outlier-detection routine (Appendix A). Data gaps were short enough (median length <1 hour) to fill by linear interpolation. About 47% of the data at Wx 3 were not received.
Additional data from three LTER weather stations (Reference DoranDoran and others, 2002) supplemented our analyses; their station close to the terminus of Taylor Glacier provided wind speed and direction, temperature, relative humidity, incoming and outgoing shortwave, and a sonic distance sensor measuring ablation. LTER stations at Beacon Valley and Lake Bonney provided context. (Station locations for these, Wx T, Wx Be and Wx Bo, are shown in Figure 1.)
Weather station data
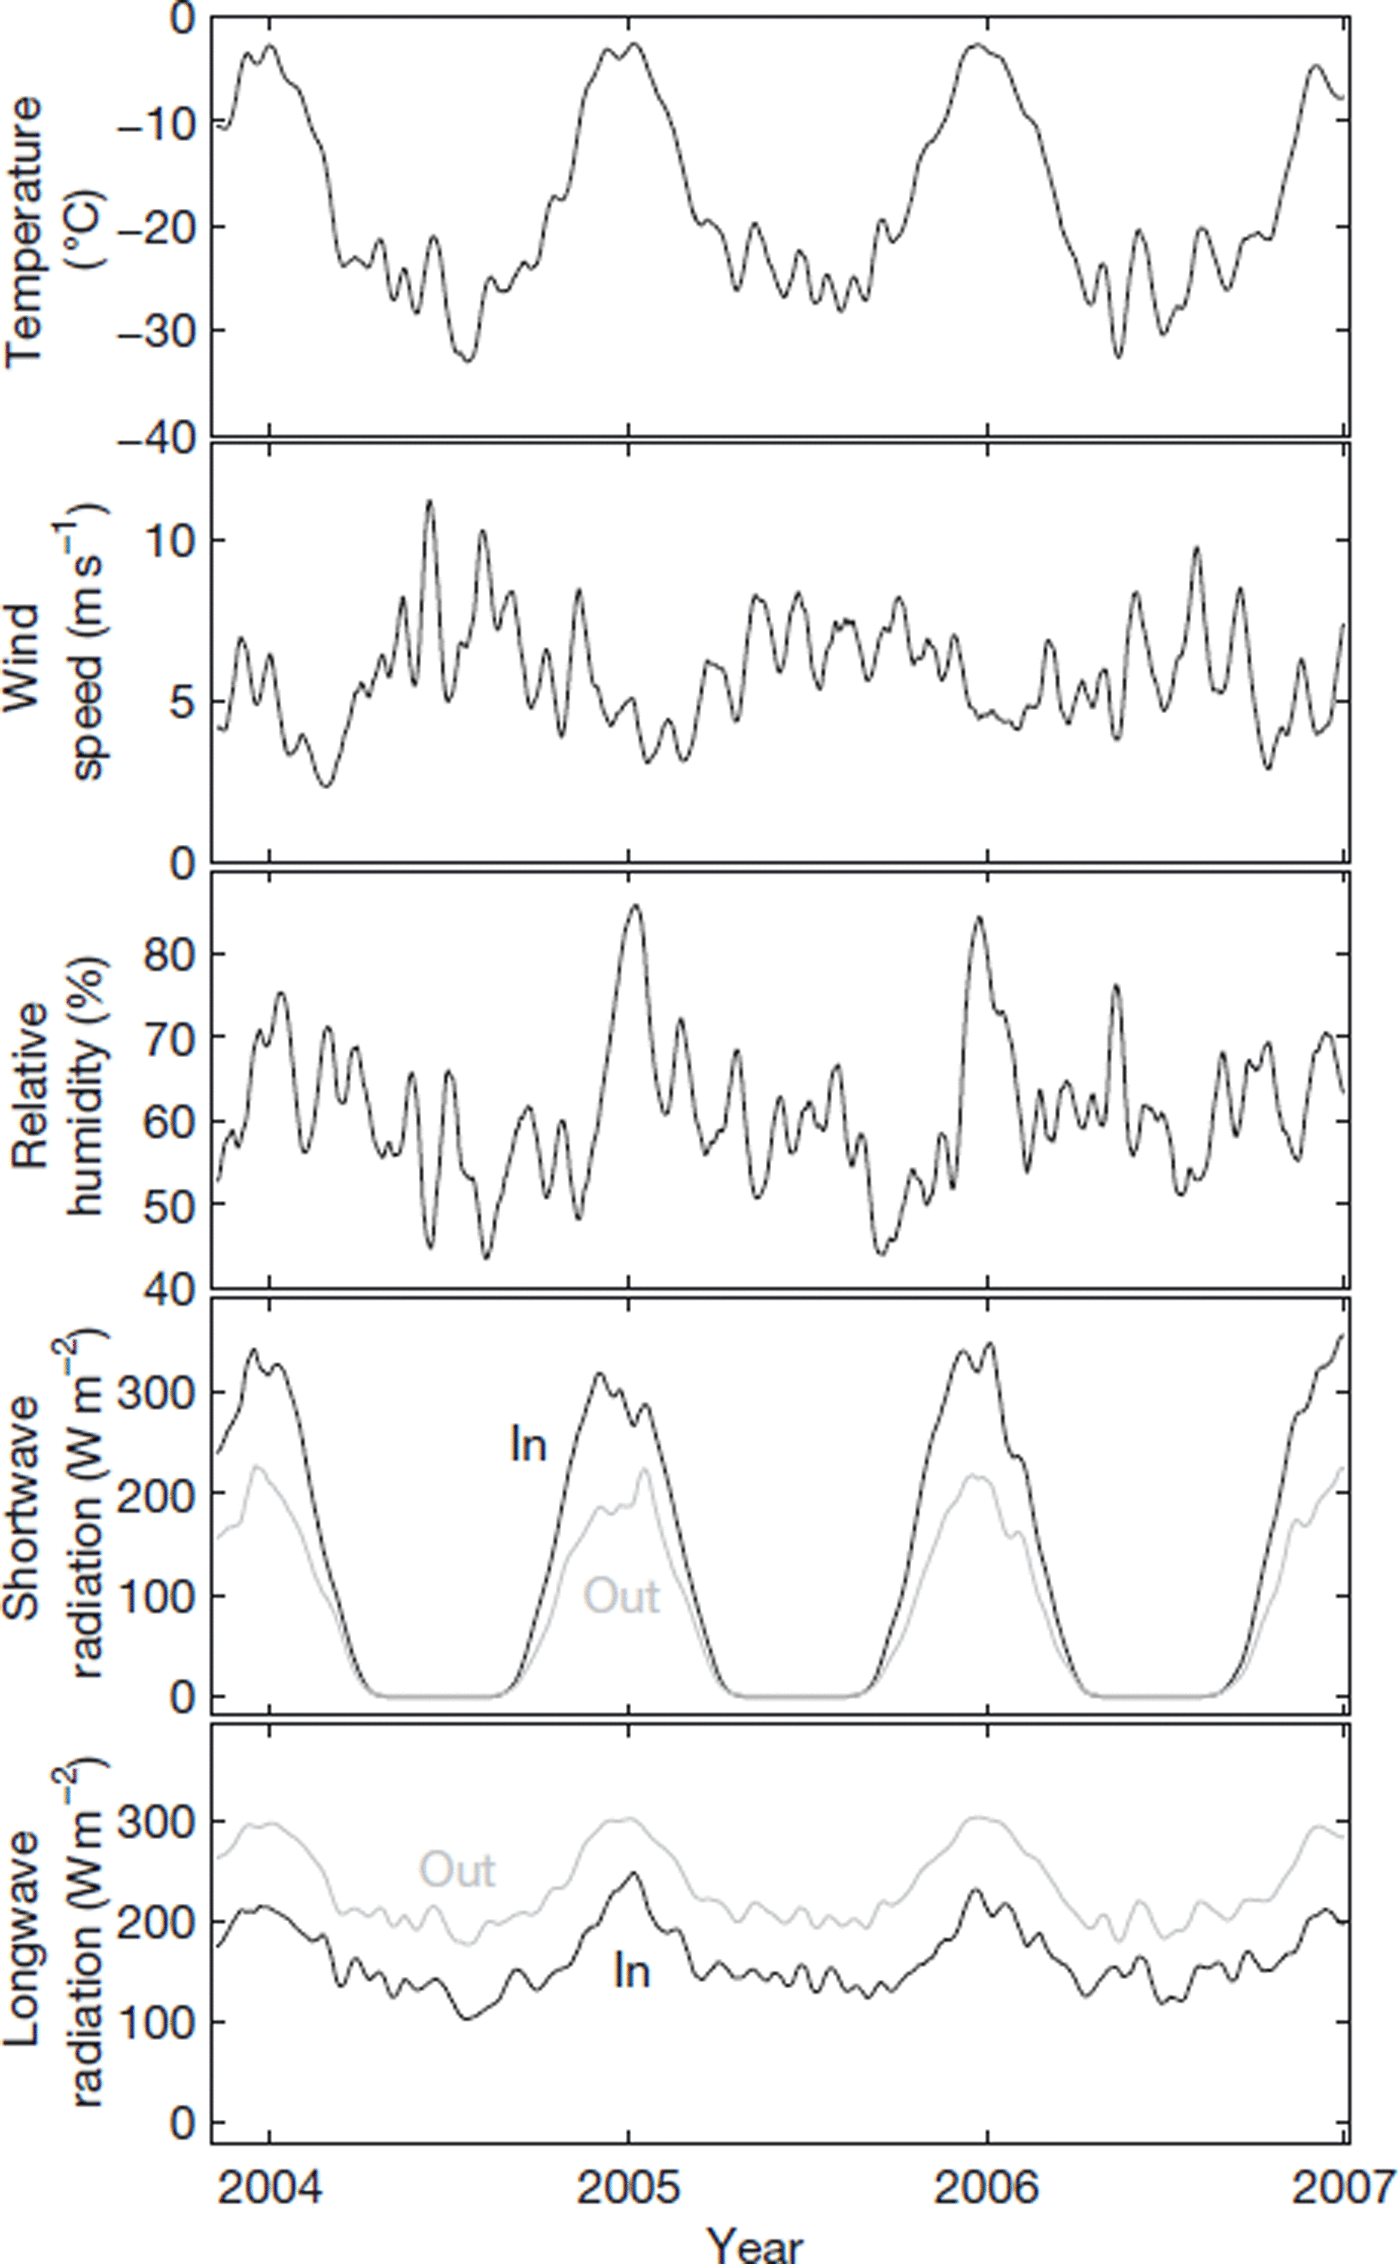
Tables 1 and 2 summarize average weather conditions in one summer (November, December, January) and winter (May, June, July). Figure 4 shows example time series for the whole study period from Wx 1. Superimposed on the pronounced seasonal cycle are large variations associated with storms and katabatic winds, both of which occur in all seasons. Interannual variability of average conditions does not reflect systematic differences, but instead arises from random factors such as the number of storms.
Measured weather variables from Wx 1, showing their seasonal cycles. Data were smoothed with a triangular filter that assigned the highest weight to the central point and the lowest weight to points 15 days prior to and 15 days after the central point. (See Reference BlissBliss, 2011, for comparable data from other stations.)
Summer averages of temperature, T
air, relative humidity, RH, wind speed, uz
, vapour pressure of the air, ez
, vapour pressure difference between the air and surface, ez
– e
s, calculated sublimation rate, ![]() , and elevation for reference. Data for November, December, January 2005/06. See Reference BlissBliss (2011) for comparable data for other years
, and elevation for reference. Data for November, December, January 2005/06. See Reference BlissBliss (2011) for comparable data for other years

Winter averages of the weather variables detailed in Table 1. Data for May, June, July 2006

Winds
In all seasons, the fastest winds occur midway along the glacier (Wx 3), below the steep tributary valley, Windy Gully. Wind speeds on the glacier tend to be slower in summer than in other seasons. The stations close to the ice-free portion of Taylor Valley (Wx 1 and Wx T) often experience diurnal mountain/valley winds when solar heating warms the valley walls. Summertime katabatic winds generally descend from Windy Gully. Wintertime katabatic winds descend alternately from Windy Gully or from the plateau, through Taylor Mouth. The 52.2 m s−1 maximum wind speed (30 s gust) was recorded at Wx 3 during a storm on 15 May 2004. The wind fetch was >2 km at all stations. Thus, despite the mountainous topography, we calculated turbulent fluxes (see below) using models developed for flat surfaces.
Air temperature
Temperatures range from as low as −50°C, during calm periods in the winter, up to 5°C, for a few days in summer at low elevations. The temperature sensors were shielded with ten-plate Gill shields and were naturally ventilated. Problems with sensor overheating were minimal due to consistently high wind speeds (see Reference BlissBliss, 2011, for more detail). Lapse rates tend to be strong (7.5°C km−1) and well organized (linear drop-off of temperature with elevation) in the summer and weaker (4°C km−1) and less organized in the winter. A persistent wintertime inversion in the ice-free portion of Taylor Valley affects Wx Bo, sometimes affects Wx T and rarely extends up-glacier to Wx 1. Temperature increases at the onset of storms and katabatic wind events are often 10°C in 2 or 3 hours.
Relative humidity
Relative humidity tends to be higher in summer than winter. Summer storms can bring moist air from the ocean, but they can also bring strong down-glacier winds which are dry, due to adiabatic warming. When the wind speed is >10 m s−1, the relative humidity is rarely >70%. At lower speeds, it spans the whole range.
Shortwave radiation
Daily mean incoming shortwave radiation values in the summer tend to be ∼300 W m−2 (Fig. 4). The mean albedos (when incoming shortwave is >100 W m−2 to avoid spurious readings) for Wx T, Wx 1, Wx 2 and Wx 4 are 0.58, 0.63, 0.60 and 0.61, respectively. Albedo varies with snowfall, cloudiness, solar zenith angle and the nature of the ice surface. On some days when the temperature neared 0°C, we observed the formation of a hollow crust on the surface due to a small amount of subsurface melt along grain boundaries; the hollow space reflected white light and increased the albedo by up to 10%.
Longwave radiation
Over the seasonal cycle, net longwave energy loss from the surface ranges from lows of ∼50 W m−2 in winter to highs approaching 100 W m−2 on clear days in summer (Fig. 4). Outgoing longwave radiation is highly correlated with air temperature, as expected. Incoming longwave correlates with air temperature and cloudiness.
Snowfall
Snowfall on the ablation zone was inferred by comparing sonic distance sensor data at Wx T, AVHRR (Advanced Very High Resolution Radiometer) imagery showing storms, measured ice albedo during summer and direct field observations. Storms that brought snow to the ablation zone occurred a few times per year. The snow was usually blown off the glacier within a few days, but sometimes remained for up to a month. A threshold wind speed of ∼15 m s−1 was required to blow the snow off the glacier, regardless of how long the snow had been there. When the snow blew away, the distance to the glacier surface was often greater than before the snowfall, indicating that sublimation of ice continued even underneath the snowpack.
Effects of Windy Gully
In the winter, Wx 3 is often warmer and drier than even Wx T, which is 500 m lower in elevation. These conditions are a consequence of strong katabatic winds moving through Windy Gully and onto the main glacier. An air parcel that quickly descends through Windy Gully, with a vertical drop of 750 m in just 10 km horizontally, warms at a rate close to the adiabatic rate. An air parcel that descends the same vertical distance on Taylor Glacier must cover a horizontal distance of 30 km (generally with a lower wind speed as well) and therefore the parcel has time to cool diabatically. Similarly, the air at the base of Windy Gully is very dry, because it has not had time to gain much moisture via sublimation from the ice surface.
Derived parameters
Some of the calculations discussed below require values for parameters not directly measured, including surface temperature, surface vapour pressure and roughness length.
Surface temperature
In our standard sublimation model, surface temperature values, T s, were adjusted to achieve a zero net energy budget (Fig. 5; Appendix B). The estimated surface temperatures were on average 1.5°C colder than the air temperature in summer and 4.2°C colder in winter at Wx 1. The persistently low temperatures of the glacier surface were maintained by the net loss of energy by longwave radiation. We also calculated a second estimate of T s by developing a parameterization in terms of measured T air and net radiation (Appendix B).
The measured air temperature is usually higher than the modeled surface temperature (adjusted to make the energy budget go to zero). The measured vapour pressure at screen height is usually lower than the surface vapour pressure calculated from the surface temperature assuming saturation. The vapour pressure difference is much larger in summer than winter. All data from Wx 1. Data were smoothed with a 30 day triangular filter. (See Reference BlissBliss, 2011, for comparable data for other stations.)

Vapour pressure
Vapour pressure at the surface was assumed to equal the saturation value at the estimated surface temperature (see Reference Box and SteffenBox and Steffen, 2001, for a discussion of errors). Because vapour pressure depends strongly on temperature, the vapour pressure difference between the air and the surface peaks during the warm summer months with values around 1.5 mbar. Winter values were 5–10 times smaller.
Roughness lengths
In the sublimation models described below, we assume that the surface roughness, Z o, was 0.005 m for all stations. Three of our stations included wind sensors at two heights, which allowed calculation of Z o from the law of the wall (Appendix C). The station with the most complete data had a median Z o of 0.0053 m. Roughness can also be estimated from surface microtopography. The amplitude of surface undulations was ∼0.1 m, implying (according to standard parameterizations for turbulent flows) roughnesses of several millimeters. These two independent measures of roughness, and lack of better data, justify our choice of Z o = 0.005 m. Additionally, the calculated sublimation was insensitive to the chosen roughness length, as shown in ‘Sensitivity of predictions to input values’ below. A factor-of-two change in roughness led to a ∼10% change in sublimation. When needed, roughness lengths for humidity and temperature were calculated from surface roughness using an empirical relationship (see Appendix C for equations).
Sublimation Models
Although melting contributes to ablation near Taylor Glacier’s terminus (Reference Johnston, Fountain and NylenJohnston and others, 2005; Reference Fountain, Nylen, MacClune and DanaFountain and others, 2006), in most of the study region temperatures never rose to the melting point except locally around morainal debris. We therefore compared our ablation measurements with sublimation calculated from weather station data. We performed the calculation using several different formulae. In all cases the sublimation rate, ![]() , was derived from an estimated latent heat flux, L, according to
, was derived from an estimated latent heat flux, L, according to
where λ = 2.8 × 10⁶ J kg−1 is the latent heat of sublimation and ρ ice denotes ice density.
In order of increasing complexity, the primary formulae are:
-
1. A bulk aerodynamic flux equation with no stability correction (equation (5.28) of Reference Cuffey and PatersonCuffey and Paterson, 2010):
(2)
where ρ is air density, ω is the ratio of the molecular weight of water to air, λ is the latent heat of sublimation, k is von Kármán’s constant, uz is wind speed (m s−1) measured at height H wind, ez is vapour pressure at the measurement height H RH, e s is vapour pressure at the surface, P is air pressure and Z o and Z RH are the roughness lengths for momentum and humidity, respectively. The calculation of e s assumed the air at the surface was saturated at the parameterized surface temperature introduced in Appendix B. Unfortunately, the net energy budgets calculated using this model varied widely on 20 min, daily and seasonal timescales. The net energy budget was rarely zero; such a mismatch arose both from measurement uncertainties and from assumptions in formulae.
-
2. The energy budget mismatch from the first model led us to try another model in which we reduced the mismatch. Because we did not measure surface temperature, T s, directly, it was one of the most uncertain variables in the analysis. Thus, as an alternative to the previous model, we used the same formulation (Equation (2)) but adjusted T s to balance the energy budget. Since the energy budget affects and depends on T s, an iterative scheme was necessary to find a solution. The adjustment was made on a smoothed (time-averaged) version of the data series rather than on the 20 min timescale. This strategy was adopted because the calculated net energy for some individual 20 min intervals deviated widely from zero; fixing the problem by adjusting an unsmoothed T s would require unrealistic temperatures.
-
3. A correction for atmospheric stability made the equation more complex but presumably more accurate. Following Reference Brock and ArnoldBrock and Arnold (2000),
(3)where the stability length scale, Λ, ranged from 0 to 676 m (10th and 90th percentiles). The length scale was ill-defined for neutral conditions (when the air temperature was roughly equal to the surface temperature). We assumed the latent heat flux was zero under those conditions (∼10% of the data). The stability correction constants, α m and α e, were set equal to 5 (Reference Brock and ArnoldBrock and Arnold, 2000). Here again, we adjusted the surface temperature to balance the energy budget. The remainder of this paper considers results from this model.


Predicted sublimation
Figure 6 shows, for different time periods, the covariation of ablation measurements with the sublimation rates calculated from Equations (1) and (3). For seasonal to annual averages, the modeled sublimation is linearly related to the measurements, with a least-squares regression slope of 0.86 and intercept of 0.052. The model over-predicts ablation at low rates because it does not include snowfall. Overall, however, the match is very good. We therefore believe that the model can provide useful interpretations of shorter-period variations in sublimation, which were not directly measured. Rates range from ∼0 mm d−1 during calm intervals in winter to 2.5 mm d−1 during warm and dry summer days. Although mean summer rates are more than twice as large as winter rates, the contribution of slow winter sublimation to the yearly total cannot be neglected (see ‘Magnitude versus frequency of sublimation’ below).
Modeled sublimation rates are linearly related to the ablation rates measured at ablation stakes close to the weather stations. The modeled sublimation in (a) does not include a stability correction; that in (b) does include the small stability correction. The symbol shapes are as given in Figure 3 and colors correspond to stations: Wx 1 blue; Wx 2 green; Wx 3 yellow; Wx 4 red; Wx 5 cyan. Note that ablation is not directly comparable with sublimation. The two points with the lowest measured ablation rates probably had significant snowfall which decreased the measured ablation, leading to a mismatch. The rest of the glacier received little snowfall. The width of the horizontal error bar depends on the measured variability in ablation, as in Figure 3. The height of the vertical error bar is ± one standard deviation away from the mean of the Monte Carlo simulation explained in the text.

Sensitivity of predictions to input values
To evaluate the sensitivity of modeled sublimation values to uncertainties of the input data, we performed a Monte Carlo analysis. Input variable time series were uniformly perturbed by a normally distributed random variable with zero mean and a standard deviation given as follows. For temperature, wind speed and relative humidity, the standard deviation equaled the manufacturer’s stated instrument accuracy (0.4°C, 0.3 m s−1, 2%). For surface temperature, we chose an uncertainty of 0.6°C to be comparable to the adjustments of surface temperature required for energy balancing. We set the Z o uncertainty to 0.001 m, based on the common range of Z o values used in the literature. We chose to uniformly perturb the input time series rather than perturb individual values because short-term random variations average out when considering seasonal or annual sublimation. In other words, instrument precision is less important than accuracy.
Sensitivities are illustrated by the resulting distributions of calculated sublimation summed over the whole period of record (Fig. 7). The most important source of uncertainty is the surface temperature. Overall, the estimated uncertainty of model sublimation values is rather large. The standard deviation of the Monte Carlo results divided by the mean was 14–18% for the different weather stations.
Histograms of modeled sublimation after perturbations to one or more input variables from a Monte Carlo simulation. The horizontal axis shows the total sublimation for the period of record at Wx 1. The solid vertical line in each plot is the sublimation predicted by the unperturbed model. The dotted line is the model result using the (+) uncertainty, and the dashed line is that using the (−) uncertainty. The total number of points in each simulation was 1000, and each of the 81 histogram bins is 0.5 cm wide. The sublimation model is more sensitive to the uncertainty in surface temperature than to the instrument uncertainties associated with the measurements of temperature, relative humidity and wind speed. (See Reference BlissBliss, 2011, for comparable data from other stations.)

In addition to the uncertainties arising from input data, the calculated sublimation obviously depends on the assumption that the equations represent the complex process of turbulent moisture transfer in nature. The only indication of total uncertainty is the mismatch between measured and modeled sublimation rates depicted in Figure 6.
Energy Budget
We define the net energy flux, E, using the budget equation
As mentioned above, we measured incoming and outgoing shortwave (SW) and longwave (LW), radiation. Latent heat fluxes, L, were obtained from Equation (3). An analogous equation gave sensible heat fluxes, H. Heat flux into the subsurface, G, was calculated using finite-difference solutions to the diffusion equation for time- and depth-varying temperatures within the ice. G sums two terms: the change of energy stored as heat within the top numerical layer (0.04 m thick) and the Fourier heat flux through the layer. Points in the finite-difference grid were spaced closer together near the surface (18 in the first meter) than at depth (2 m spacing at 50 m depth). The surface boundary condition was the surface temperature appropriate for the sublimation model being considered, as described previously. The basal boundary condition was set according to the temperature profile from a force-balance model of the glacier (Reference Kavanaugh and CuffeyKavanaugh and Cuffey, 2009).
The heat flux due to melt and subsequent runoff was assumed to be zero at our sites, which are far from the margins and the terminus. This assumption was based on field observations and the temperature record from the weather stations (∼2 days a−1) with temperatures above 0°C). Runoff does occur within 1 km of the terminus and within 100 m of the margin of the glacier elsewhere. Rain almost never occurs in this region.
In the absence of measurement uncertainties, the net energy flux as defined here should equal zero.
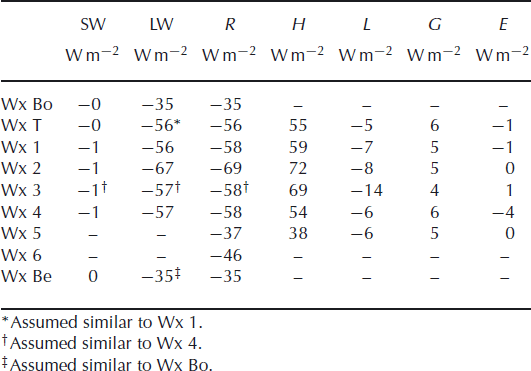
Energy budget data
Figure 8 shows time series of the terms in the energy budget for Wx 1. Tables 3 and 4 show seasonal averages for all stations. Net shortwave radiation was the largest term in the energy budget in summer. Longwave radiation also peaked in summer, but it was more constant throughout the year. The calculated sensible heat flux warming the ice was largest in the winter, approximately balancing the heat lost by longwave radiation. In summer, the ice temperature was closer to the air temperature, so the sensible heat flux was smaller, but still positive. The calculated latent heat flux was almost always negative (very little condensation or hoar deposition) and was strongest in summer. Heat flowed into the subsurface during the spring and summer and flowed out during the winter, with a maximum magnitude smaller than the latent and sensible terms. The residual of the other terms is given as the net energy balance, as in Equation (4).
Relative magnitudes of the terms in the energy budget for Wx 1. Data were smoothed with a 30 day triangular filter. Fluxes that added energy to the glacier surface were defined to be positive and fluxes that removed energy from the surface were defined to be negative. The modeled sublimation rates for all five stations exhibit maxima in the summer months. In summer, the warmer temperatures allow for higher vapour pressure differences, so despite calmer winds and higher relative humidity, the sublimation rates are higher than in winter. Winter sublimation is quite variable because of storms.

Summertime components of the energy budget for November, December, January 2005/06. Abbreviations defined in Equation (4) and R stands for net radiation. (See Reference BlissBliss, 2011, for comparable data for other years)

Wintertime components of the energy budget for May, June, July 2006. Abbreviations defined in Equation (4) and R stands for net radiation
Relation of Sublimation to Weather Modes
By systematically examining our station data and making comparisons with satellite imagery, we found that weather variability at Taylor Glacier reflects four distinct patterns or modes: (1) stormy weather related to cyclonic systems; (2) dominance of strong katabatic winds; (3) dominance of diurnal fluctuations in wind speed and direction; and (4) calm conditions. We discriminated these modes in our time series on the basis of measured wind speeds and cloud amounts (inferred from the longwave radiation) at our weather stations. Although sublimation occurred in all types of conditions, it occurred most rapidly during stormy weather and strong katabatic winds.
Example time period
A strong katabatic wind event raged for >5 days in early March 2006; this event not only appears in our station data (Wx 1 shown in Fig. 9) but also can be seen clearly in AVHRR imagery from 4 March as dark streaks of warm air descending off the Antarctic plateau. The event began with marked increases of wind speeds (to ∼10 m s−1) at each station on 1 March. On 1 and 2 March temperatures gradually rose from −20° to −12°C. Relative humidity fell from 60% to 20%, causing the vapour pressure difference between the air and the surface to rise from <0.5 to 1.5 mbar. Over 3 days, wind speeds also increased to ∼20 m s−1. The fast winds combined with the enhanced vapour pressure difference produced some of the highest sublimation rates of the fall.
Weather patterns at Wx 1 are distinctly different during katabatic, calm and stormy periods. Panels show sublimation rate, wind speed, vapour pressure difference between the measurement height and the surface, temperature and relative humidity for late February and early March 2006. When the vapour pressure difference and wind speed are large, the ablation is high. When the vapour pressure difference or the wind speeds are low, so is ablation. (See Reference BlissBliss, 2011, for comparable data from other stations.)

The strong katabatic flow was followed by a calm period, wherein wind speeds dropped to <2 m s−1, temperature abruptly dropped 8°C in 4 hours and the relative and absolute humidities abruptly rose. The air mass came from Taylor Valley, as evidenced by easterly wind directions (not shown). Sublimation during this period was close to zero. The calm period lasted 2 days, before the effects of a storm (identified using AVHRR images) approaching from the Ross Sea began to be felt.
The storm brought faster winds and clouds to all stations. On the third day of the storm (12 March), Wx 1 experienced rapidly oscillating conditions. Periods of fast down-glacier wind, high temperature, low relative humidity and rapid sublimation alternated with the opposite. The system would stay in one state for as little as 1 hour during these fluctuations. The stations above Wx 1 experienced down-glacier winds the whole time. Meanwhile, LTER stations below Wx 1 experienced consistent, weak up-glacier winds, low temperatures and high humidities.
Magnitude versus frequency of sublimation
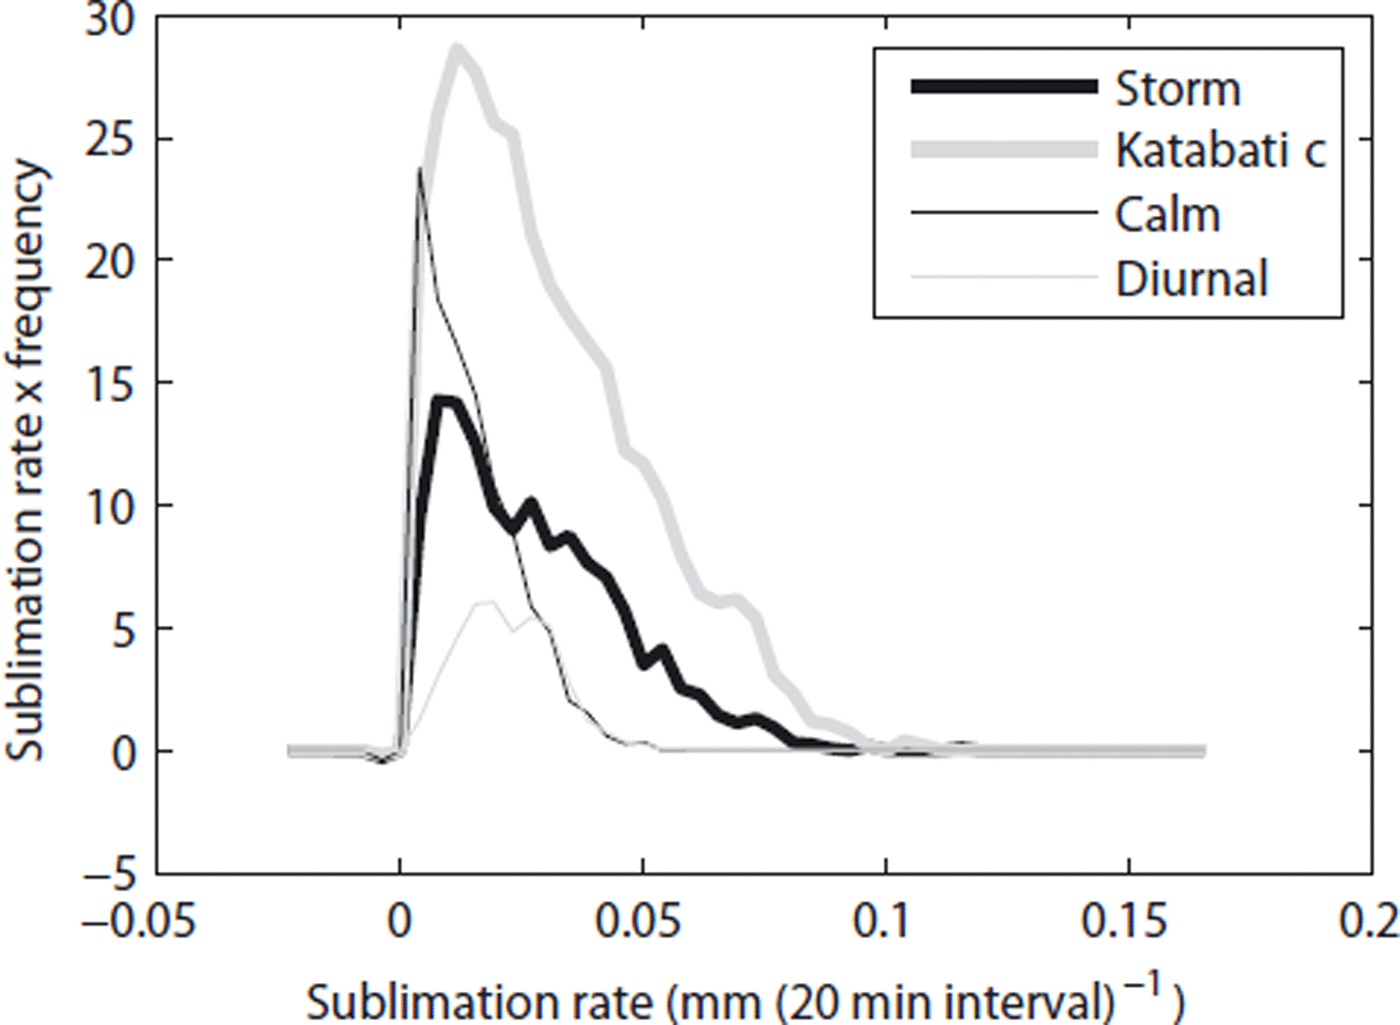
The importance of rapid but brief sublimation events compared with slow and persistent conditions can be assessed by transforming a time series of sublimation rate into a frequency distribution of the occurrence of sublimation as a function of rate (following Reference Wolman and MillerWolman and Miller, 1960; Reference Pickup and RiegerPickup and Rieger, 1979). Specifically, total sublimation in a time interval τ is ![]() , where f denotes the frequency of occurrence of sublimation of rate
, where f denotes the frequency of occurrence of sublimation of rate ![]() . Figure 10 shows the integrand of this formula for the four different weather modes at one station. The fastest sublimation occurred during storms and periods with strong katabatic winds. However, these events (with sublimation >0.05 mm per 20 min interval) occurred infrequently (1–2% of the time) and contributed 10–15% of the total sublimation. Slow sublimation (<0.025 mm interval−1) happened during all four modes, was frequent (80–90% of the record) and accounted for 50–60% of the total sublimation. This result bodes well for our ability to understand sublimation in past and future climates, to the extent that forecasts of seasonal conditions are generally more accurate than forecasts of extreme events.
. Figure 10 shows the integrand of this formula for the four different weather modes at one station. The fastest sublimation occurred during storms and periods with strong katabatic winds. However, these events (with sublimation >0.05 mm per 20 min interval) occurred infrequently (1–2% of the time) and contributed 10–15% of the total sublimation. Slow sublimation (<0.025 mm interval−1) happened during all four modes, was frequent (80–90% of the record) and accounted for 50–60% of the total sublimation. This result bodes well for our ability to understand sublimation in past and future climates, to the extent that forecasts of seasonal conditions are generally more accurate than forecasts of extreme events.
The relationship between the frequency and magnitude of sublimation at Wx 1 indicates that frequent, small events (<0.025 mm interval−1) contribute more to the total sublimation than infrequent, large events (>0.05 mm interval−1). Storms and katabatic wind periods have the largest sublimation rates while the high frequency of calm periods means that they are important too. (See Reference BlissBliss, 2011, for comparable data from other stations.)
Discussion
Measured ablation rates
On typical land-based glaciers, ablation rates are highest at the terminus, where temperatures are warm and the climate is conducive to melt or fast sublimation. Ablation monotonically decreases with increasing elevation as temperatures decline. On Taylor Glacier, while temperature does generally decrease with elevation, ablation rates peak in the middle of the ablation zone’s elevation range, at 900 m. Our model results show that this odd ablation pattern can be explained by rapid sublimation caused by dry air moving quickly over the glacier. The source of the fast dry air is katabatic flow from Windy Gully, a steep tributary of Taylor Glacier.
In the early 1970s, ablation rates close to the terminus (Reference RobinsonRobinson, 1984) were twice as high as rates measured since 2000 by our surveys. The 11 year mean ablation rate reported by Reference Hoffman, Fountain and ListonHoffman and others (2008) for a site next to Wx T falls on the trend of our data (Fig. 3), while the 7 year mean rates reported by Reference Fountain, Nylen, MacClune and DanaFountain and others (2006) were generally a few cm a−1 lower than our 4 year data. (The different time periods and locations used in these three studies preclude a direct comparison.) We speculate that the 1970s ablation rates were higher because the local climate was warmer then (Reference DoranDoran and others, 2002), which enhanced both sublimation and melt.
Our results, showing a clear maximum of ablation near Windy Gully, indicate that the spatial coverage of Robinson’s (1984) study was not sufficient to characterize the relation between ablation and elevation on this glacier, or to assess the glacier’s surface mass balance accurately. Robinson assumed a linear relationship between ablation and elevation, which proves to be a poor assumption given the effects of the complex topography on wind fields. Using Robinson’s relationship underestimates ablation rates by a factor of two at 900 m altitude. His estimate of the overall mass balance of Taylor Glacier was a gain of (9.5 ± 23.3) × 106 tonnes a−1, whereas our estimate (based on improved measurements of ice flux and surface balance) indicates that most of the glacier is nearly in mass equilibrium, even with the lower recent ablation rates (Reference Kavanaugh, Cuffey, Morse, Bliss and AciegoKavanaugh and others, 2009b). One sector, however, (that which flows into Pearse Valley from the west) appears to be shrinking.
Another contrast concerns the location of the equilibrium line. Reference RobinsonRobinson (1984) estimated it to be at an elevation just over 2000 m a.s.l., based on air photographs from between 1957 and 1973. Our ablation measurements indicate the equilibrium line is closer to 1400 m a.s.l., although it is not a ‘line’ but a broad and heterogeneous zone. Robinson may have based his estimate on the elevation of the highest exposed ice, but large patches of persistent snow (Fig. 1) at lower elevations maintain a positive surface mass balance. It should also be noted that over most of the glacier Robinson’s elevation figures are ∼300 m higher than those indicated by our GPS surveys.
Although we do not have meteorological measurements at the Taylor–Ferrar confluence, observations suggest that the low sublimation rates measured there (Fig. 2) reflect generally low local wind speeds. The down-glacier winds are steered north by the western prow of the mountain ridge that separates Taylor Valley from Ferrar Valley.
Ablation on Taylor Glacier, especially close to Windy Gully, is rapid compared with that in other Antarctic blue-ice areas. In Bintanja’s (1999) classification of blue-ice areas, Taylor Glacier is a type II (‘located on a valley glacier’), and Taylor Glacier shares many characteristics with the more extensively studied type I blue-ice zones (in the lee of a mountain). Our measurements reveal maximum rates (40 cm a−1 for the interval [3 : 4]) much higher than those reported by Bintanja in his compilation at the elevation of Windy Gully (900 m), or in fact at any elevation (see fig. 6 of Reference BintanjaBintanja, 1999).
Weather data
The mean annual temperature at the station closest to the terminus (Wx T) was −17.4°C, almost identical to the −17°C estimated by Reference RobinsonRobinson (1984) from crevasse temperatures. Reference RobinsonRobinson (1984) found a lapse rate of 4°C km−1 by measuring temperature in shallow boreholes. Reference Johnston, Fountain and NylenJohnston and others (2005) used temperature sensors to find a summertime lapse rate along the lower Taylor of ∼8°C km−1. We found that the lapse rate across the entire ablation zone had a median value of 6.4°C km−1 for the period of record but varied significantly with the season, from ∼4°C km−1 in winter to 7.5°C km−1 in summer. In winter, small lapse rates prevailed when wind speeds were less than ∼7 m s−1. With faster winds, adiabatic warming of air descending the glacier increased the lapse rate into the range 5–10°C km−1.
Modeled ablation rates
In the relationship between our modeled and measured sublimation rates (Fig. 6), the departure from a slope of unity might arise from multiple factors. Model over-prediction at low ablation rates might arise from temporary accumulation; we occasionally observed snowpatches in the vicinity of Wx 5. Accumulation is not included in our model because we did not obtain continuous measurements of surface height (e.g. taken with sonic distance sensors).
For sites in Queen Maud Land (QML), Antarctica, Reference Bintanja and ReijmerBintanja and Reijmer (2001) found that 70% of the annual sublimation happened in summer (November–February). On Taylor Glacier, 54–69% happened in summer (Wx 5 and Wx T, respectively). We attribute the greater importance of winter ablation at Taylor Glacier to strong winter winds that favor sublimation.
Energy budget
Not surprisingly, the energy budget of Taylor Glacier’s surface has the same general features as other Antarctic sites: gain of radiative energy in summer and loss in winter; year-round loss of latent heat by sublimation (condensation and hoar deposition being common but quantitatively negligible processes) and small gains and losses of heat to the subsurface in winter and summer, respectively. Sensible heating of the surface is unusually large at Taylor Glacier because of strong (downslope) katabatic winds and frequent cyclonic disturbances.
On the ablation zone of Canada Glacier, ∼15 km east of Taylor Glacier, Reference Lewis, Fountain and DanaLewis and others (1998) determined an energy budget for 21 December–21 January 1994/95 that was very similar to the budget at our lowest station, Wx 1, for the same calendar days but in 2005/06. The similarity extended to our respective calculations of sublimation: 3.65 cm w.e. for Canada Glacier and 3.4 cm w.e. for Taylor Glacier. One difference was that the Taylor Glacier sensible heat flux was positive. Moreover, in 1995/96 on Canada Glacier, Reference Lewis, Fountain and DanaLewis and others (1998) found a significantly higher net radiation that produced a large quantity of melt. We did not observe melt at our weather station sites on Taylor Glacier.
Sublimation from Lake Hoare (an ice-covered lake 10 km east of Taylor Glacier terminus) in 1986 was estimated from meteorological data to be 35.0 ± 6.3 cm (Reference Clow, McKay, Simmons and WhartonClow and others, 1988) which is in line with the values we found on Taylor Glacier.
Compared to the blue-ice sites in QML studied by Reference BintanjaBintanja (2000), summertime latent heat losses at Taylor Glacier were large. Yet the net shortwave and longwave values were nearly identical. Thus, it was the large sensible heat fluxes that sustained surface conditions conducive to rapid sublimation at Taylor Glacier. The larger sensible fluxes at Taylor, in turn, appear to reflect warmer air more than strong winds. At Scharffenbergbotnen, QML, for example, the reported summer wind speeds were similar to those near the terminus of Taylor (Wx T), but air temperature at Wx T was higher, sensible heat flux was +6 W m−2 instead of −7 W m−2 and latent flux was −33 W m−2 instead of −29 W m−2.
Conclusions
Field evidence and model results confirm that sublimation accounts for most of the mass lost from Taylor Glacier. Sublimation rates vary in a complex spatial pattern, largely because the mountainous topography interacts with regional airflow regimes (katabatic, cyclonic and diurnal) to generate non-uniform winds on the glacier. Superimposed on the general decrease of sublimation rate with altitude is a pronounced maximum midway along the glacier, related to strong winds emanating from a tributary valley, Windy Gully, and their propagation down-glacier.
We found that a simple model for sublimation, with a standard correction for atmospheric stability, explains much of the variability in ablation, temporally and spatially. The model sublimation rates compare well with observed ablation. Wind speed, vapour pressure difference between the surface and screen height, and temperature (through its effect on vapour pressure) were the dominant variables affecting the sublimation rates, as one would expect from standard boundary-layer theory.
Brief ‘events’ of fast sublimation occurred during storms and strong katabatic winds. However, these extreme events accounted for a minor portion of the total annual sublimation. More important were the common, medium-sized storm and katabatic events, during which wind speeds and temperatures were elevated and the air drier than average – all conditions that favor sublimation. Slow but persistent sublimation is important for the annual total.
Sublimation varies strongly over the annual cycle. Summer rates exceed winter rates by a multiple of 1.9 on average.
Acknowledgements
Thanks to fellow scientists and support staff who helped us in the field. The McMurdo Dry Valleys LTER project graciously provided their weather station and ablation data. The work reported here was supported in part by US National Science Foundation (NSF) grant OPP-0125579 to K.M.C. Additional funding was provided by the University of California.
Appendix A. Outliers and Gap Filling
We eliminated outliers in a multistep process. The first step was to divide a given time series into sections of 20 data points. For each section, we then calculated the 10th, 50th and 90th percentiles of the data variable (Vi is the ith percentile). Then we defined
A point, v, was an outlier if
where the ratio factor, r, was 1.8.
Outliers were removed from the data. The ratio factor (1.8) and the number of data points in a section (20) were chosen by inspection to minimize the number of outliers left in the data and minimize the removal of true values.
Gaps in the data, due to missing ARGOS transmissions or removed outliers, were filled by interpolating across the gap. We tested linear, nearest-neighbor, cubic and spline methods of interpolation. For Wx 1, 2, 4 and 5, where we had ARGOS and locally stored data, we were able to compare the interpolated points to the real data that were not transmitted. The linear and cubic methods best matched the locally stored data; since the linear method was slightly simpler, we chose to use that.
Appendix B. Surface Temperature
Parameterized
At the three stations where longwave radiation was measured directly, the radiative ice surface temperature, T rad, was calculated from the upwelling longwave radiation, LW, using the Stefan–Boltzmann equation assuming an emissivity, ϵ = 1:
where σ is the Stefan–Boltzmann constant. To estimate surface temperature, T s, at other stations, we developed a parameterization with a lagged version of air temperature, T air, and measured net radiation, R:
where 〈x〉 denotes a lagged version of x. The parameters a, b, c and d were chosen via regression to minimize Σ|T rad – T s| for Wx 1, 2 and 4. The lagged air-temperature record was created by applying a triangular filter to the air-temperature data. The filter weighted the most recent data most heavily, and past data were weighted less and less with age. The filter width (4 hours) was chosen to maximize the correlation between the radiative surface temperature and the parameterized surface temperature. After computing T s in this way, we noticed that the result had a bias depending on the temperature. So, to adjust the fit we added an offset variable that calculated the mean residual in 1 °C bins, and then subtracted the residual from the model. This whole parameterization was used at Wx 3, 5 and T, where we did not have direct measurements of upwelling longwave radiation.
We performed a few ad hoc tests of different parameterizations for surface temperature, ultimately choosing the one that best fit the radiative temperature (described above) and made sense physically for the sublimation. Parameterizations we tried were: radiative temperature from other stations; radiative temperature with an offset of a few degrees; air temperature with an offset; that of Reference PeckPeck (1996); lagged air temperature; lagged air temperature and shortwave radiation; and a parametric fit with lagged air temperature and net radiation. The other parameterizations gave results similar to the one we chose, but with slightly different slopes and intercepts for Figure 6.
Adjusted for energy balance
For the ‘standard’ model, we adjusted the surface temperature until the net energy flux to the glacier surface was zero. The energy budget terms affected by this adjustment were the latent, sensible and subsurface heat fluxes. For example, if the initial net energy budget was positive, we increased the surface temperature. This led to a reduced sensible heat flux to the glacier, an increased latent heat loss from the glacier, and either an increased loss of heat to the subsurface or a reduced gain of heat from the subsurface. The subsurface term was usually the smallest of these terms and had the smallest change upon correction.
Appendix C. Roughness Length
The ‘law of the wall’ predicts how velocity of a fluid will vary in a boundary layer near a surface. Given a ground surface roughness and a wind speed at some height above the ground, the theory gives an estimate of the wind speed at other heights. Alternatively, if wind speed is known at two heights, the roughness can be calculated:
where ux is the wind velocity at height Hx . Accounting for atmospheric stability, the equation is slightly different (Reference Brock, Willis and SharpBrock and others, 2006):

We have done these calculations for the three stations where we have wind sensors at two heights. The most complete data came from Wx 2, where the calculated roughness was 0.0053 m, or 0.0036 m when the stability correction is included. At Wx 4, prior to the failure of one of the two wind sensors, the roughness was 0.0040 m, or 0.0016 m with the correction. At Wx 1 we did not take accurate sensor heights.
The roughness lengths for temperature, Z T, and moisture, Z q, can be related to that for momentum by
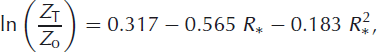
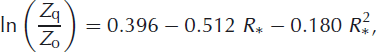
where R* is the Reynolds number (Reference Brock and ArnoldBrock and Arnold, 2000). See Reference Smeets and van den BroekeSmeets and van den Broeke (2008) for a discussion of roughness lengths in the ablation zone of the Greenland ice sheet.


