


Introduction
Titanium is a rare constituent of naturally occurring compounds in Class I Elements of Strunz and Nickel (Reference Strunz and Nickel2001); only three are listed in the 9th edition – titanium (α-Ti), khamrabaevite (TiC) and ‘osbornite’ (TiN). More recent work on the heavy mineral suites recovered from chromitite orebodies in the Luobusa ophiolite, Tibet, China has turned up several more Ti minerals, e.g. zangboite, zhiqinite, badengzhuite and wenjiite (Xiong et al., Reference Xiong, Xu, Mugnaioli, Gemmi, Wirth, Grew, Robinson and Yang2020, Reference Xiong, Xu, Mugnaioli, Gemmi, Wirth, Yang and Grew2022). One fragment recovered from the chromitite, sample M11843, is noteworthy for an especially diverse assemblage. Although only 450 μm × 800 μm in size, this fragment contains 11 minerals including the two new species described here, maurogemmiite Ti10Fe3O3 (IMA 2022-098a, Mugnaioli et al., Reference Mugnaioli, Xiong, Xu, Yang and Grew2022, Reference Mugnaioli, Xiong, Xu, Yang and Grew2023), and paulrobinsonite, Ti8Fe4O2 (IMA 2022-099a, Mugnaioli et al., Reference Mugnaioli, Xiong, Xu, Yang and Grew2022, Xiong et al., Reference Xiong, Mugnaioli, Xu, Yang and Grew2023). The fragment was extracted from chromitite orebody #31 in the Luobusa ophiolite near Luobusa Village, Tibet, China (29°13.86’N, 92°11.41’E) (Bai et al., Reference Bai, Robinson, Fang, Hu and Zhou2000; Robinson et al., Reference Robinson, Bai, Malpas, Yang, Zhou, Fang, Hu and Cameron2004). The assemblage in the alloy core of sample M11843 (Fig. 1a) includes the type titanium (α-Ti) (Fang et al., Reference Fang, Bai, Yang, Rong, Shi, Li, Xiong and Ma2013), ‘osbornite’ (Ti nitride), wangxibinite (TiFe) and the two new minerals reported here.
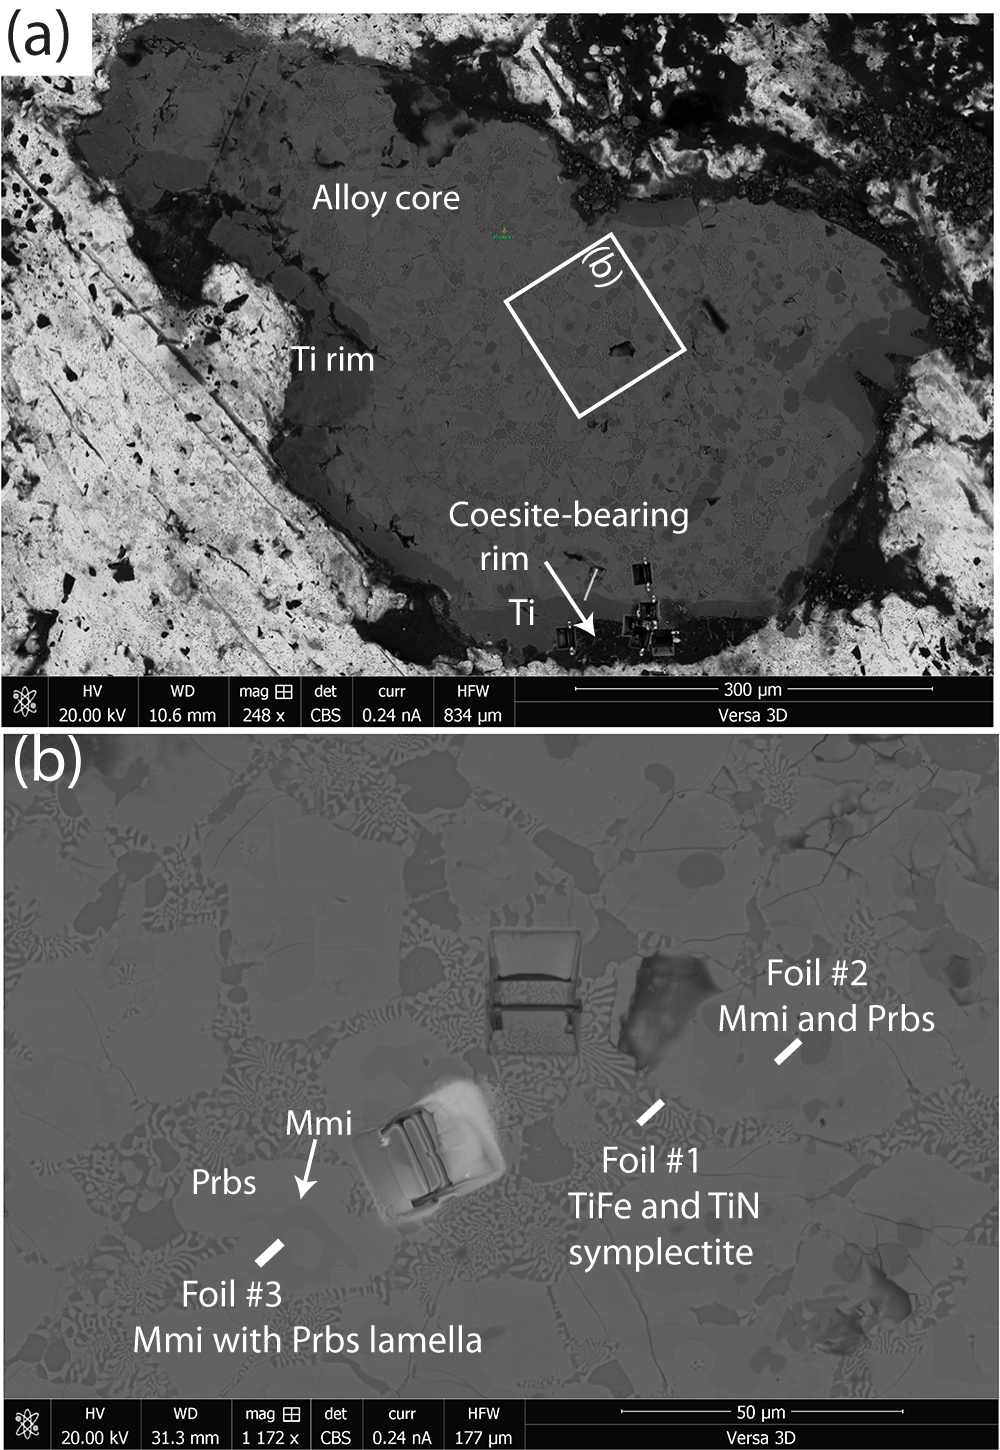
(a) Back-scattered electron (BSE) image of entire fragment (sample M11843) showing location of the three foils extracted for the present study. The light material surrounding the fragment is rosin, the glue used for mounting the fragment. The small yellow spot labelled ‘Position 1’ in green indicates a point during the investigation. (b) Back-scattered electron image showing locations of the three foils relative to one another. An enlargement of the area around Foil #3 prior to its extraction is shown in Fig. 2a.

These two new mineral species are the first analogues of the synthetic κ- and η-phases to be discovered in nature. A κ-phase is a hexagonal compound in which the structure hosts other constituents such as O, C and Si, as well as Fe, Co and Ni, occupying interstices (e.g. Hårsta and Rundqvist, Reference Hårsta and Rundqvist1987). An η-phase is similar, but the symmetry of the host lattice is cubic (e.g. Rupp and Fischer, Reference Rupp and Fischer1988; Endo et al., Reference Endo, Saitoh, Machida and Katayama2013). Both κ- and η-phases have been studied in detail for the crystallographic constraints they provide on occupancy of different sites by a wide range of elements, including volatiles such as oxygen at interstitial sites in the Ti–Fe host lattice. Recently, η-phases in the Ti–Fe–O system have attracted particular attention because of their capacity to store hydrogen (Lavrentyev et al., Reference Lavrentyev, Gabrelian, Shkumat, Nikiforov, Zavaliy, Sinelnichenko, Izvekov and Khyzhun2010).
The main objectives of the present paper are to report the distinguishing chemical and crystallographic characteristics of the new Ti–Fe–O mineral species maurogemmiite and paulrobinsonite, which were obtained from energy-dispersive spectroscopy and three-dimensional electron diffraction, followed by discussion of the implications of their occurrence in a zoned fragment extracted from chromitite in the Luobusa ophiolite.
Occurrence
The alloy core of the fragment is composed entirely of a ‘patchwork quilt’ of Ti-rich alloys, including α-titanium and several phases composed of Ti, Si, Fe and Ni in varying proportions (e.g. Yang et al., Reference Yang, Bai, Fang, Yan, Rong and Chen2004, Reference Yang, Dobrzhinetskaya, Bai, Fang, Robinson, Zhang and Green2007; Fang et al., Reference Fang, Bai, Yang, Rong, Shi, Li, Xiong and Ma2013; Dobrzhinetskaya et al., Reference Dobrzhinetskaya, Wirth, Yang, Hutcheon, Weber and Green2009, Reference Dobrzhinetskaya, Wirth, Yang, Green, Hutcheon, Weber and Grew2014). Our reinvestigation of the alloy core has revealed that two of these Ti, Si, Fe and Ni phases are the new minerals: maurogemmiite, ideally Ti10Fe3O3, and paulrobinsonite, ideally Ti8Fe4O2 (Figs 1 and 2).
Another major constituent of the alloy core is a symplectitic intergrowth of the new species wangxibinite (ideally TiFe, Xiong et al., Reference Xiong, Mugnaioli, Xu, Yang, Wirth, Grew and Yates2025) and a Ti nitride, which is face-centred cubic with a = 4.39 Å. Extensive twinning of the Luobusa Ti nitride originally gave an apparent face-centred cell with a = 7.60 Å. Energy-dispersive spectroscopy data suggest that significant amounts of oxygen and carbon substitute for N at an N:O ratio ≈ 3:1, but it was not possible to get reliable quantitative data on carbon. The Ti nitride is closest to osbornite in cell size (e.g. a = 4:24295 (19) Å, Galuskin et al., Reference Galuskin, Galuskina, Kamenetsky, Vapnik, Kusz and Zieliński2022) and composition, TiN. Titanium nitride having a = 4.23 Å and ideal stoichiometry is also reported from the outermost rim of the fragment M11483, where it occurs with coesite and kyanite (Dobrzhinetskaya et al., Reference Dobrzhinetskaya, Wirth, Yang, Hutcheon, Weber and Green2009). The ideal formula for osbornite is given as TiN in the current International Mineralogical Association (IMA) list of minerals (Pasero, Reference Pasero2025). However, authors tended to call TiN solid solutions ‘osbornite’ irrespective of composition, e.g. Meibom et al. (Reference Meibom, Krot, Robert, Mostefaoui, Russell, Petaev and Gounellel2007) for C-bearing ‘osbornite’. Small amounts of carbon are also present in the ‘osbornite’ associated with coesite and kyanite in the fragment. Given the complexity of Ti nitrides and carbides, a systematic study of ‘osbornite’ and related solid solutions is beyond the scope of the present study, thus we are placing the name osbornite in quotation marks as an interim measure.
The alloy core of the zoned fragment is surrounded successively by a nearly complete rim of α-Ti ≈ 20–70 µm thick with a border ∼10 µm thick of Ti–Si alloy, and an incomplete outer rim composed of coesite (∼45 modal%), kyanite (∼15 modal%) and an amorphous phase containing 53–63 wt.% SiO2, 14–17 wt.% Al2O3, 9–17 wt.% TiO2, and a few wt.% K2O, Na2O and MgO. These phases are associated with subordinate amounts of native Fe, TiO2-II (a high-pressure polymorph of rutile with the αPbO2 structure), ‘osbornite’, qingsongite (cubic BN) and unidentified Ti–Si and Ti–Si–Al oxides (Yang et al., Reference Yang, Bai, Fang, Yan, Rong and Chen2004, Reference Yang, Dobrzhinetskaya, Bai, Fang, Robinson, Zhang and Green2007; Dobrzhinetskaya et al., Reference Dobrzhinetskaya, Wirth, Yang, Hutcheon, Weber and Green2009, Reference Dobrzhinetskaya, Wirth, Yang, Green, Hutcheon, Weber and Grew2014). In addition, a Ti–Si alloy associated with coesite and ‘osbornite’ in the outermost rim of the fragment is P-free wenjiite, Ti10Si6. This is the second occurrence of this alloy, which is P-bearing, Ti10(Si,P,□)7, at the type locality, chromitite #11 near Kangjinla Hill, 11 km east of chromitite #31 (Xiong et al., Reference Xiong, Xu, Mugnaioli, Gemmi, Wirth, Yang and Grew2022).
Kyanite occurs as discrete cross-cutting prisms up to 50 μm long and 4 μm wide, whereas coesite forms elongate multigranular aggregates interpreted to be pseudomorphic after stishovite prisms (Yang et al., Reference Yang, Dobrzhinetskaya, Bai, Fang, Robinson, Zhang and Green2007; Dobrzhinetskaya et al., Reference Dobrzhinetskaya, Wirth, Yang, Hutcheon, Weber and Green2009, Reference Dobrzhinetskaya, Wirth, Yang, Green, Hutcheon, Weber and Grew2014). Conditions consistent with the occurrence of stishovite and TiO2-II are ∼12 GPa and ∼1300°C, whereas the inversion of stishovite to coesite suggests a decrease of pressure to 7–8 GPa (Dobrzhinetskaya et al., Reference Dobrzhinetskaya, Wirth, Yang, Green, Hutcheon, Weber and Grew2014).
Mineral names
Maurogemmiite is named for Mauro Gemmi (born August 6th, 1970). He received a Ph.D. in physics from the University of Bologna and later worked in the electron microscopy laboratories of the University of Stockholm, the University of Milan and the Néel Institute of Grenoble. Since 2010, he has been Principal Investigator at the Istituto Italiano di Tecnologia, Italy. He is recognised as one of the leading experts in electron crystallography, being among the first to use and develop precession electron diffraction and three-dimensional electron diffraction. He applied both techniques for the structure determination of nanocrystalline minerals and products of high-pressure experimental mineralogy. He also applied dynamical refinement for the study of hydrogen-carriers in the MgO–Al2O3–SiO2–H2O (MASH) system at high-pressure conditions. Recently, he took part in the investigation of ultra-reduced inclusions from the Luobusa ophiolite.
Paulrobinsonite was named in 2022 in honour of Paul Thornton Robinson, born April 15, 1934 in Saginaw, Michigan, USA, and died June 25, 2025, in Halifax, Nova Scotia, Canada. He obtained a Ph.D. in Geology at the University of California, Berkeley in 1964, and upon joining the University of California, Riverside in 1969, he became heavily involved with the Deep Sea Drilling Project and the subsequent Ocean Drilling Program (ODP) and Integrated Ocean Drilling Program (IODP). Upon moving to Dalhousie University in 1980, he was Director of the Centre for Marine Geology, and his focus turned to ophiolites beginning with the implementation of the International Continental Scientific Drilling Program (ICDP), a deep drilling study of the Troodos ophiolite, Cyprus. In 1993, he began working with Meifu Zhou, Wenji Bai, Jingsui Yang and others to research ophiolites and chromitites in China including those at Dongqiao, Hegenshan, Sartohay and Luobusa. He retired from Dalhousie in 1999. From 2003 until his death, Robinson was an Honorary Professor of the Institute of Geology, Chinese Academy of Geological Sciences, Beijing and from 2010, an Honorary Professor at the China University of Geosciences, Wuhan.
Deposition of holotype material
The holotype specimen of both maurogemmiite and paulrobinsonite is a fragment ∼0.45 × 0.8 mm across that has been deposited with the Chinese Geological Museum, 15 Yangrouhutong, Xisi, West District, Beijing 100034, PR China, catalogue number M11843.
Sample preparation
Mineral separates
The fragment used in this study was handpicked from a heavy mineral separate processed from 1500 kg of chromitite collected in 1996 from orebody #31 of the Luobusa ophiolite (Bai et al., Reference Bai, Robinson, Fang, Hu and Zhou2000; Robinson et al., Reference Robinson, Bai, Malpas, Yang, Zhou, Fang, Hu and Cameron2004; Yang et al., Reference Yang, Dobrzhinetskaya, Bai, Fang, Robinson, Zhang and Green2007). To eliminate possible sources of contamination, the chromitite sample was removed directly from the orebody, carefully washed, air dried and crushed to pass a 1 cm sieve. Mineral separation was carried out at the Institute of Multipurpose Utilization of Mineral Resources, Zhengzhou, China, using a combination of vibration, magnetic, flotation and electrical conductivity techniques. All the equipment was carefully cleaned prior to processing, and a 200 kg granite sample was processed first as a blank to check for any contamination.
Foils
The fragment from the Luobusa chromitite was studied using an FEI VERSA-3D scanning electron microscope (SEM) at the Key Laboratory for Continental Tectonics and Dynamics (CAGS), Beijing. The operating conditions for the SEM were 20 kV excitation voltage and 15 nA beam current. Preparation of the foils follows the approach in Wirth (Reference Wirth2004, Reference Wirth2009). Locations of five foils ranging in size from ∼10 to 20 μm were selected using a FEI Scios field-emission SEM at the Institute of Geochemistry, Chinese Academy of Sciences (CAS), Guiyang. A Ga-ion beam was applied to protect the surface of the sample and to extract foils. The principle we used is that the foil is lifted out of its excavation site by means of a manipulator inside the Dual Beam FIB/SEM device and moved towards a special TEM sample grid and fixed to that grid. When the foil has reached a thickness of ∼500 nm, it is cut free on both sides and at its base, transferred to a special TEM grid, and fixed to the grid by Pt-deposition between the foil and the grid. In subsequent polishing steps with decreasing ion current for each step, the final foil thickness of ∼25–30 nm can be achieved. In the final milling step, the acceleration voltage is reduced to 5 kV to minimise surface damage by ion implantation. The sputtering process and progress are controlled using the electron beam, thus avoiding serious sputtering during imaging. The prepared foils were stored under vacuum conditions prior to shipment to the University of Pisa.
Morphology
Maurogemmiite and paulrobinsonite are the Ti–Fe–Si and Ti–Fe–Si–Ni phases, respectively, described by Fang et al. (Reference Fang, Bai, Yang, Rong, Shi, Li, Xiong and Ma2013) in the alloy core of the zoned fragment constituting sample M11843 (Fig. 1). In addition, our study has revealed the presence of another new mineral, wangxibinite, ideally TiFe (Xiong et al., Reference Xiong, Mugnaioli, Xu, Yang, Wirth, Grew and Yates2025), in a symplectic intergrowth with ‘osbornite’ in the alloy core (Fig. 2).
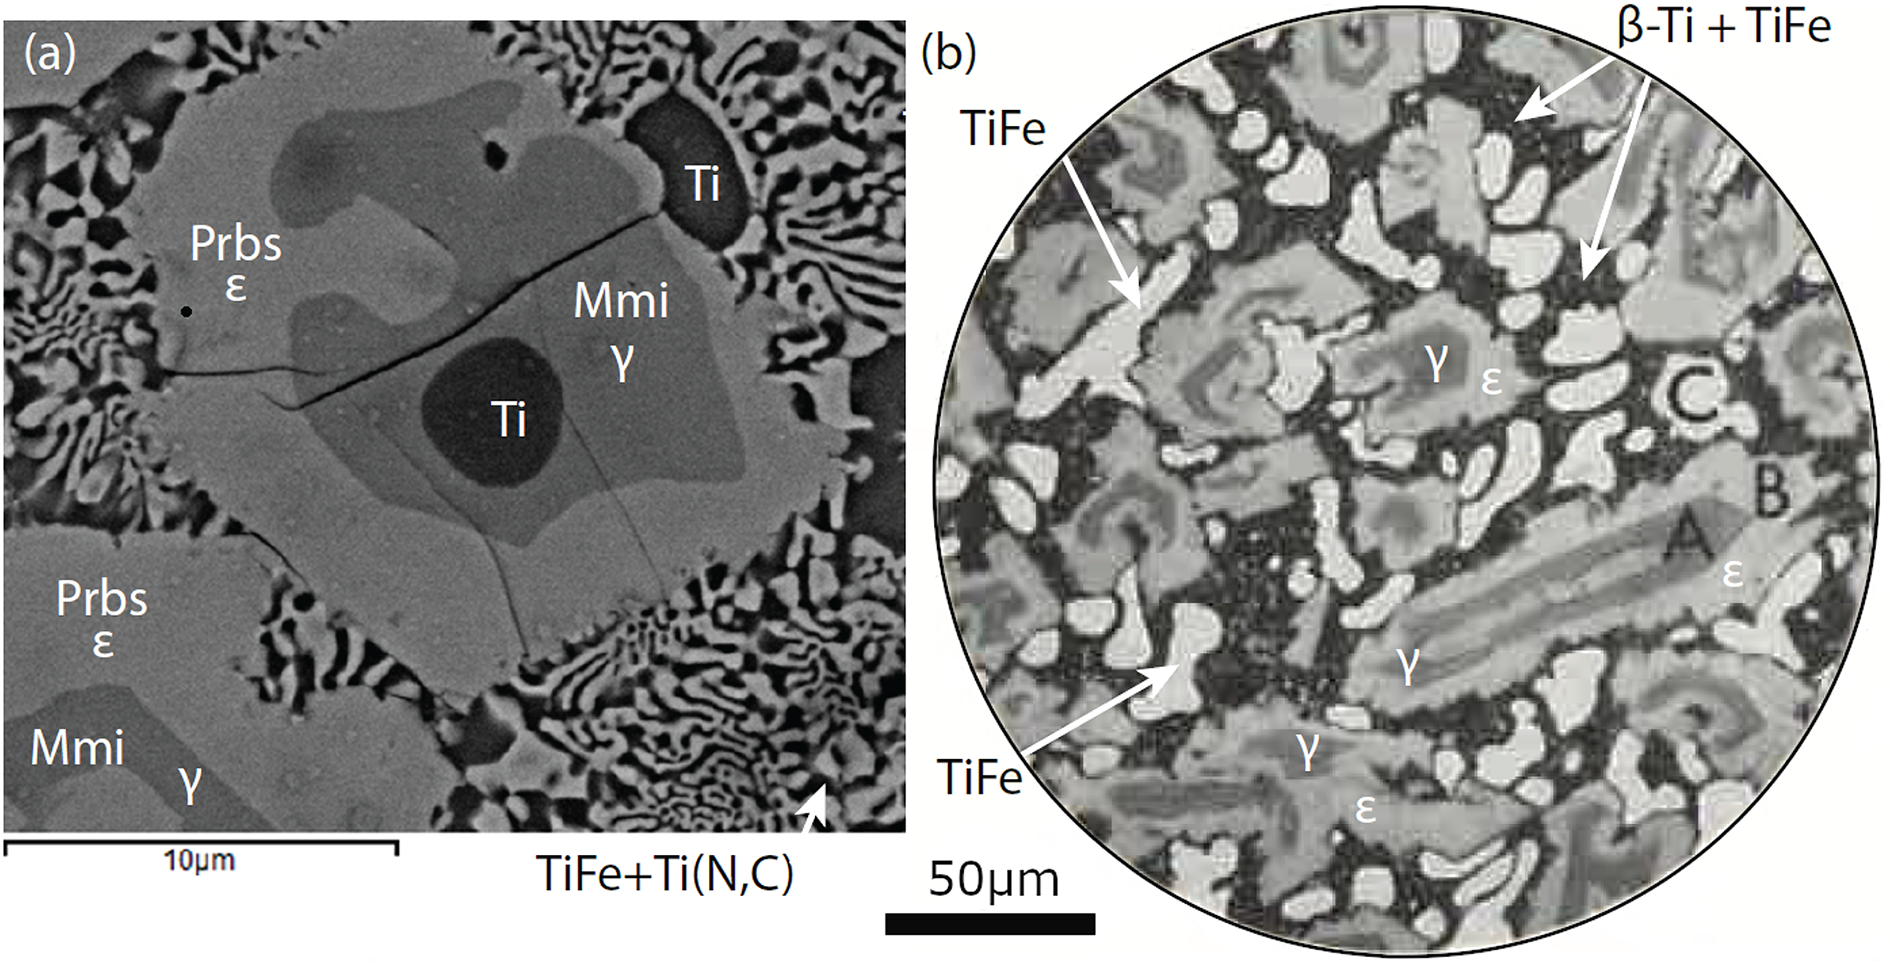
Back-scattered electron images of zoned grains in the alloy core of sample M11843. Ti – native Ti; Mmi – maurogemmiite; and Prbs – paulrobinsonite. The vermicular symplectite is composed of wangxibinite (TiFe) and ‘osbornite’ (TiN) in roughly equal proportions. (a) This image was taken near where foils for transmission electron microscopic study were extracted (Fig. 1). (b) Modified from Fang et al., Reference Fang, Bai, Yang, Rong, Shi, Li, Xiong and Ma2013, figure 4) where numbered points refer to electron microprobe analyses of α-titanium and of ‘Ti-Fe-Si-Ni alloy’ (paulrobinsonite) reported by Fang et al., Reference Fang, Bai, Yang, Rong, Shi, Li, Xiong and Ma2013, table 3).
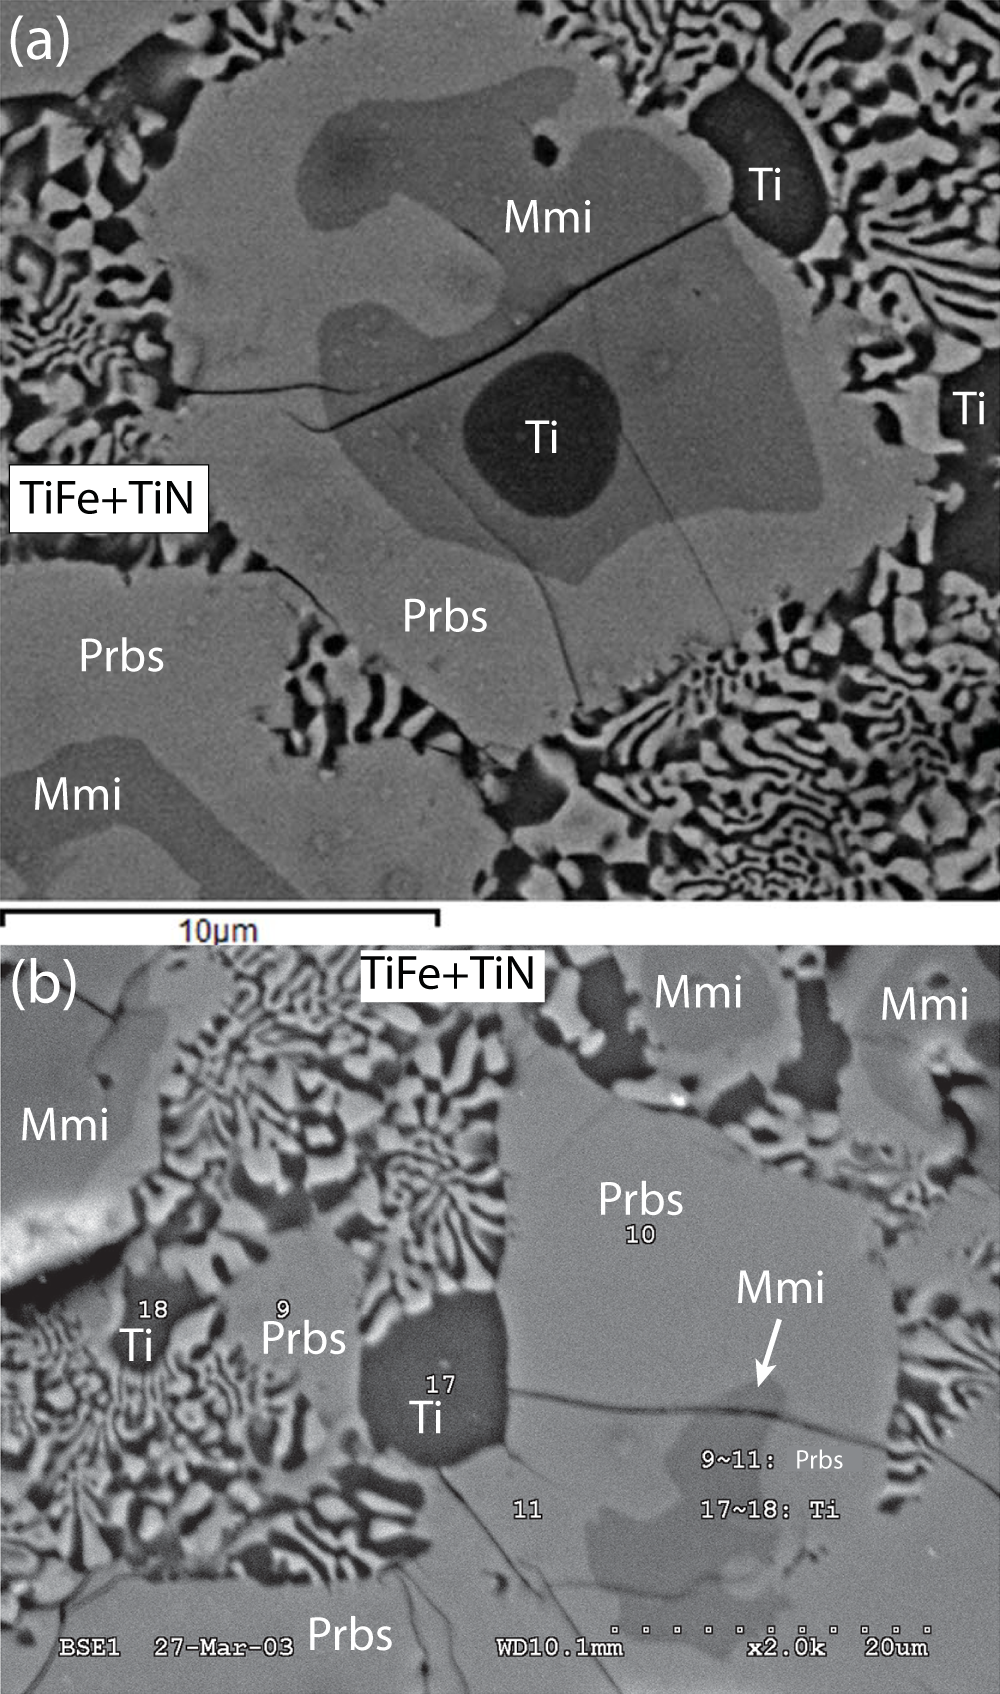
Maurogemmiite forms irregular grains up to 30 μm across enclosed in paulrobinsonite. In some cases, maurogemmiite grains are cored by a Ti-rich phase and rimmed by paulrobinsonite, whereas in others, maurogemmiite forms rings and irregular grains within paulrobinsonite (Fig. 2a). The inverse was also found; Fig. 3a shows a lamella of paulrobinsonite ∼1 μm thick in maurogemmiite. No contacts were observed between maurogemmiite and the symplectitic intergrowth of wangxibinite and ‘osbornite’; maurogemmiite was thus invariably isolated from the symplectite by paulrobinsonite. The paulrobinsonite rims are generally less than 40 μm thick.
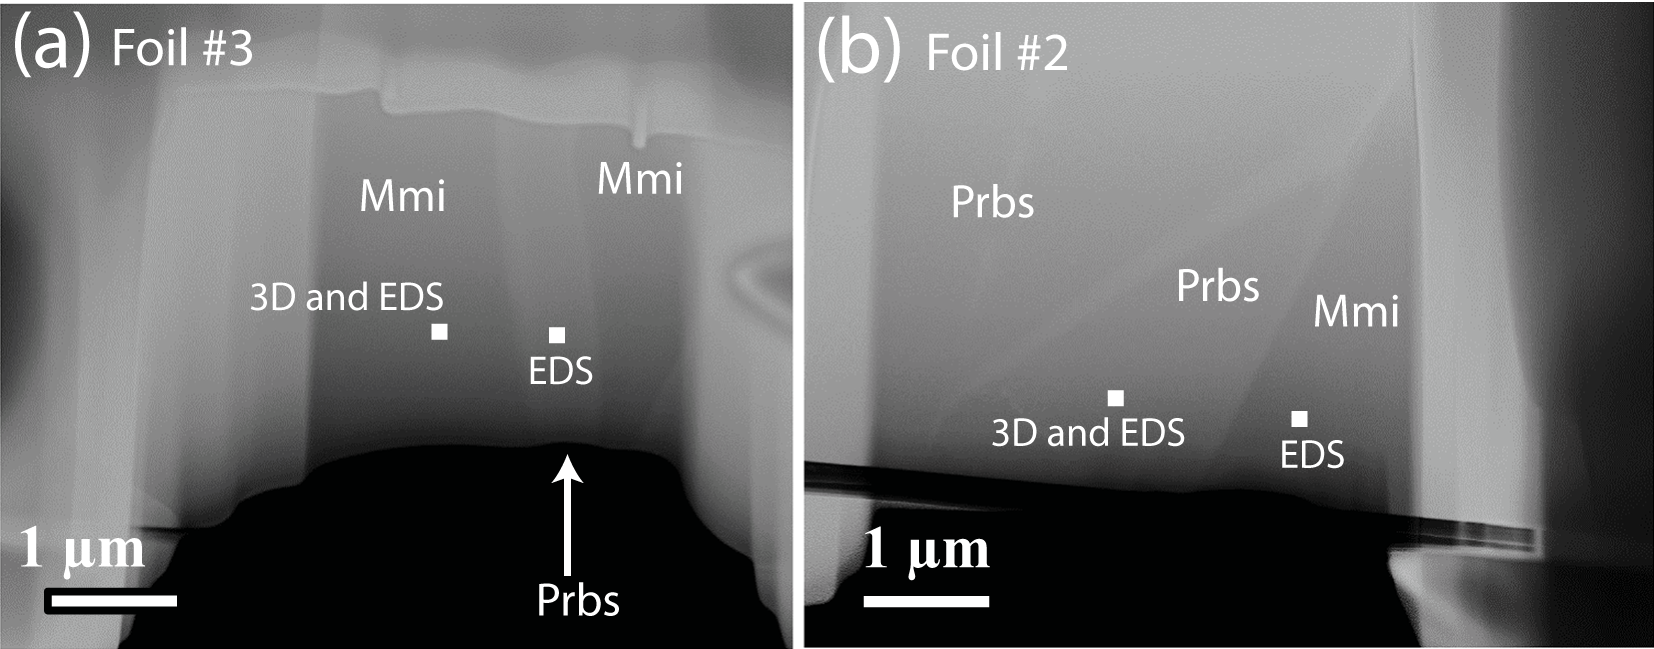
Scanning-transmission electron microscopic images of (a) a lamella of paulrobinsonite (Prbs) in maurogemmiite (Mmi) (foil #3) and (b) intergrowth of the two minerals (foil #2). The points analysed for crystal structure determination (3D) and chemical analyses (EDS) are marked.

The vermicular symplectite composed of wangxibinite and ‘osbornite’ in roughly equal proportions occupies irregular areas tens of µm across that are interstitial to paulrobinsonite grains (Fig. 2). Individual vermicules generally range from 0.3 to 1 µm in width and from 1 to several µm in length. Overall, textural relationships suggest that titanium crystallised first and subsequently was overgrown by maurogemmiite, which was subsequently overgrown and partially replaced by paulrobinsonite, resulting in some interleaving of maurogemmiite and paulrobinsonite. The vermicular symplectite of ‘osbornite’ and wangxibinite, together with minor titanium, crystallised last, filling the interstices between grains of paulrobinsonite.
Rupp and Fischer (Reference Rupp and Fischer1988) showed a scanning electron micrograph of skeletal octahedra of synthetic paulrobinsonite (composition Ti4Fe2O0.4), but we are not aware of comparable information on the morphology of single crystals of synthetic maurogemmiite.
Physical properties
Grains of maurogemmiite and paulrobinsonite are too small in what remains of sample M11843 to determine their appearance and measure their physical and optical properties. Moreover, consuming more sample would compromise its value as holotype material. According to Hårsta and Rundqvist (Reference Hårsta and Rundqvist1987), the physical properties of synthetic analogues of maurogemmiite, the κ-phases, have been barely studied. They seem to be hard, brittle materials exhibiting metallic conductivity, and thus maurogemmiite is likely also to be hard and brittle with high conductivity. Maurogemmiite is also presumably opaque and its colour is presumably black. Moreover, the synthetic Ti–Fe–O κ-phase is paramagnetic (Rogl et al., Reference Rogl, Rupp, Wiesinger, Schefer and Fischer1985). Comparable information on the synthetic analogue of paulrobinsonite has not been reported.
Densities of maurogemmiite and paulrobinsonite calculated from the empirical formulae obtained on the crystals used to determine the structure (see below) are 5.355 and 6.095 g cm–3, respectively. Nevitt (Reference Nevitt1960) reported measured densities of 5.62 and 5.74 g cm–3 for synthetic paulrobinsonite of composition (Ti2Fe)4O0.68 and (Ti2Fe)4O1.48, respectively.
Composition
Analytical methods
Fang et al. (Reference Fang, Bai, Yang, Rong, Shi, Li, Xiong and Ma2013) reported compositions for native titanium and associated minerals, including their Ti–Fe–Si phase (maurogemmiite) and Ti–Fe–Si–Ni phase (paulrobinsonite), obtained with a 1600 Shimadzu electron microprobe using wavelength-dispersive spectroscopy (WDS) at China University of Geology in Beijing (CUGB). However, these analyses are not suitable for characterising maurogemmiite and paulrobinsonite as the minerals were not analysed for oxygen.
Maurogemmiite and paulrobinsonite in the holotype sample were subsequently analysed by energy-dispersive spectroscopy (EDS) using a high-counting JEOL SDD detector on the JEOL JEMF200 Multipurpose TEM that was used for subsequent crystallographic studies at the University of Pisa. The acceleration voltage was 200 kV and the investigated area was ∼100 nm × 100 nm. The analyses were not standardised. Two analyses were obtained on each mineral.
The EDS analyses also gave counts for C, N, O, Cr, Co and Cu. The analysed section had been carbon coated, and consequently we attributed the presence of C in the analyses largely to contamination from the coating and did not attempt to quantify it. Dobrzhinetskaya et al. (Reference Dobrzhinetskaya, Wirth, Yang, Hutcheon, Weber and Green2009) reported the presence of C in ‘osbornite’ in an uncoated section of M11843 using NanoSIMS, but in subordinate amounts compared to N. The grains were analysed for N and O by EDS using the Kα lines, generally a difficult measurement especially as the signal from TiLα can contribute to the signal attributed to NKα. In the absence of a more conclusive determination of N, such as by electron energy loss spectroscopy (EELS), a methodology not available on the TEM in Pisa, we have decided to ignore the N counts. Moreover, because of the difficulties of measuring O with EDS, the value for oxygen was taken from the structurally refined structure model rather than from the values obtained by EDS (Tables 1 and 2). Chromium, Co and Cu signals are assumed to reflect contamination from the sample holder and thus were ignored. We use grids from PELCO that are supposed to be 100% pure Cu. In more than 20 years of experience, we have not witnessed the occurrence of signals other than Cu from copper TEM grids.
Compositions of maurogemmiite and paulrobinsonite
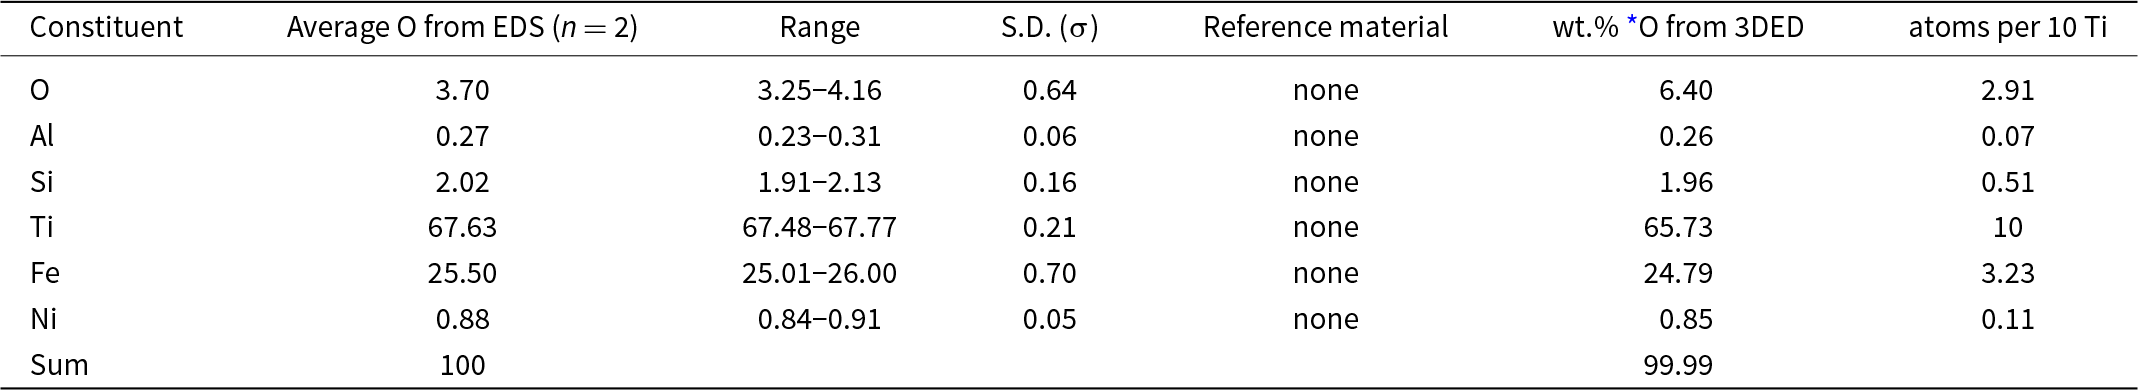
Two standardless EDS analyses of maurogemmiite normalised to 100 wt.% gave 3.70 wt.% O, whereas O calculated from the structurally refined model (see the crystallography section below) gave O 6.40 wt.% O when combined with the other constituents and re-normalised to 100 wt.% (Table 1). The empirical formula for maurogemmiite normalised to Ti = 10 and taking O per 10 Ti from the structurally refined model, is Al0.07Si0.51Ti10Fe3.23Ni0.11O2.91 (Table 1). The simplified formula, which is derived from the empirical formula, is: Ti10Fe3(O,Si,Fe,Ni,Al)3. The ideal formula is Ti10Fe3O3, which requires Ti 68.95, Fe 24.13, O 6.91, Total 100 wt.%.
Energy-dispersive spectroscopy (EDS) data (in wt.%) for maurogemmiite including the crystal used to determine the structure (Fig. 3)

* O from the structurally refined model (Table 6) using three-dimensional electron diffraction
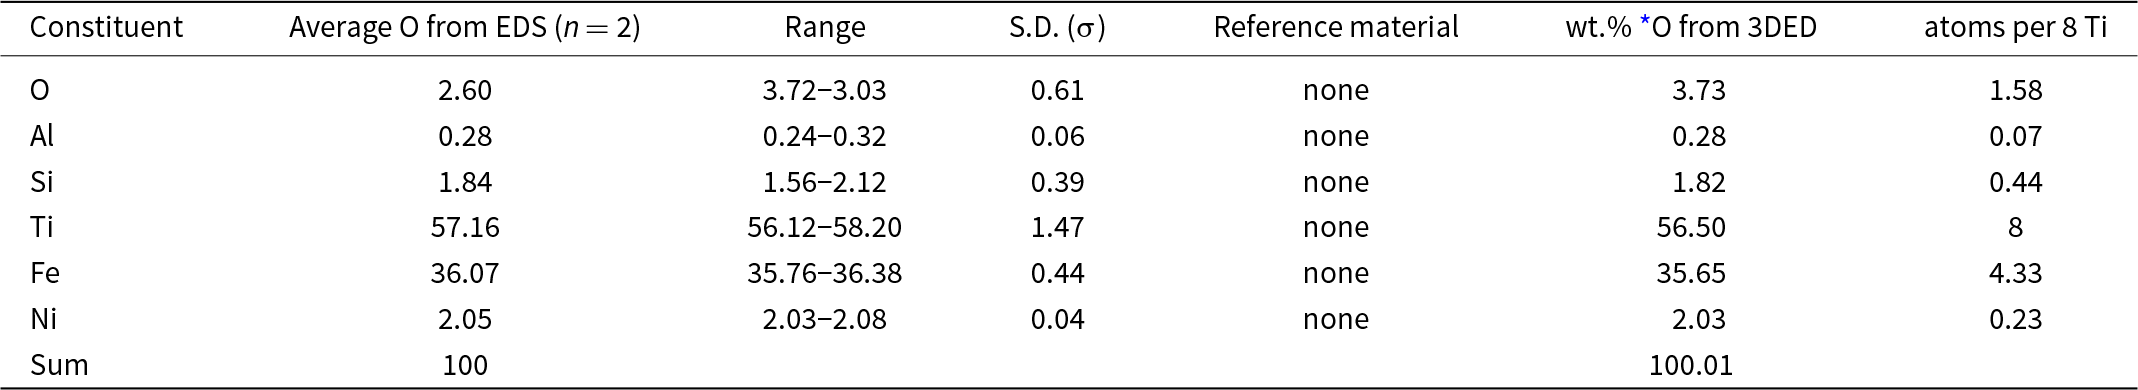
Two standardless EDS analyses of paulrobinsonite normalised to 100 wt.% gave 2.60 wt.% O, whereas O calculated from the structurally refined model (see the crystallography section below) gave O 3.73 wt.% O when combined with the other constituents and re-normalised to 100 wt.% (Table 2). The empirical formula for paulrobinsonite normalised to Ti = 8 and O taken from the structurally refined model is: Al0.07Si0.44Ti8Fe4.33Ni0.23O1.58 (Table 2). The simplified formula, which is derived from the empirical formula, is: Ti8Fe4(O,Fe,Si,Ni)2. The ideal formula is: Ti8Fe4O2, which requires, Ti 59.99, Fe 35.00 O 5.01 Total 100 wt.%.
Energy-dispersive spectroscopy (EDS) data (in wt.%) for paulrobinsonite including the crystal used to determine the structure (Fig. 3)

* O from the structurally refined model (Table 8) using three-dimensional electron diffraction
Crystallography
Powder X-ray diffraction patterns
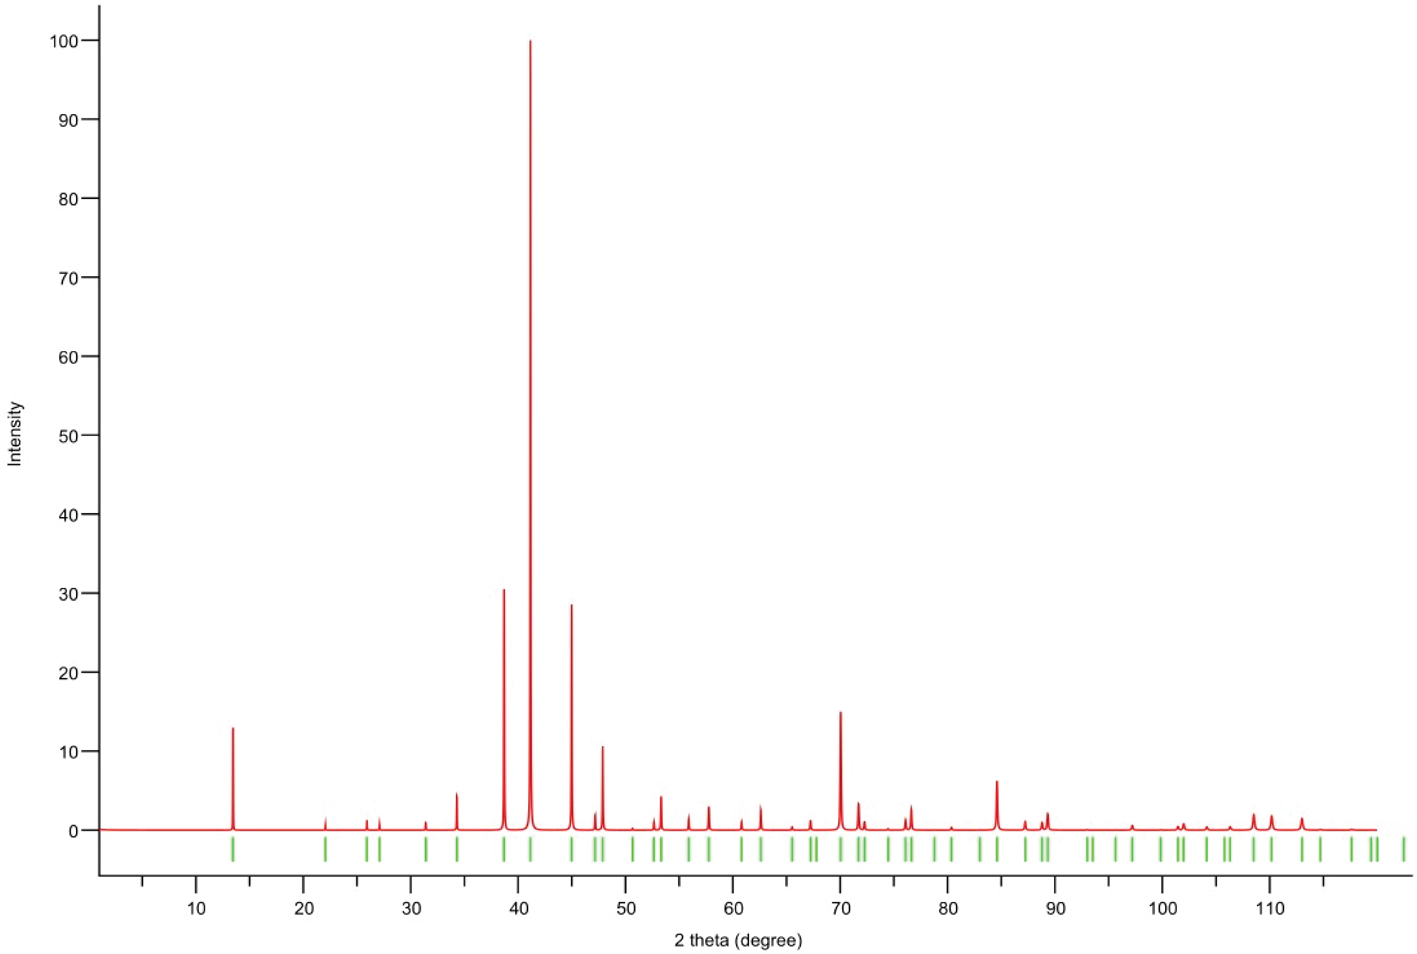
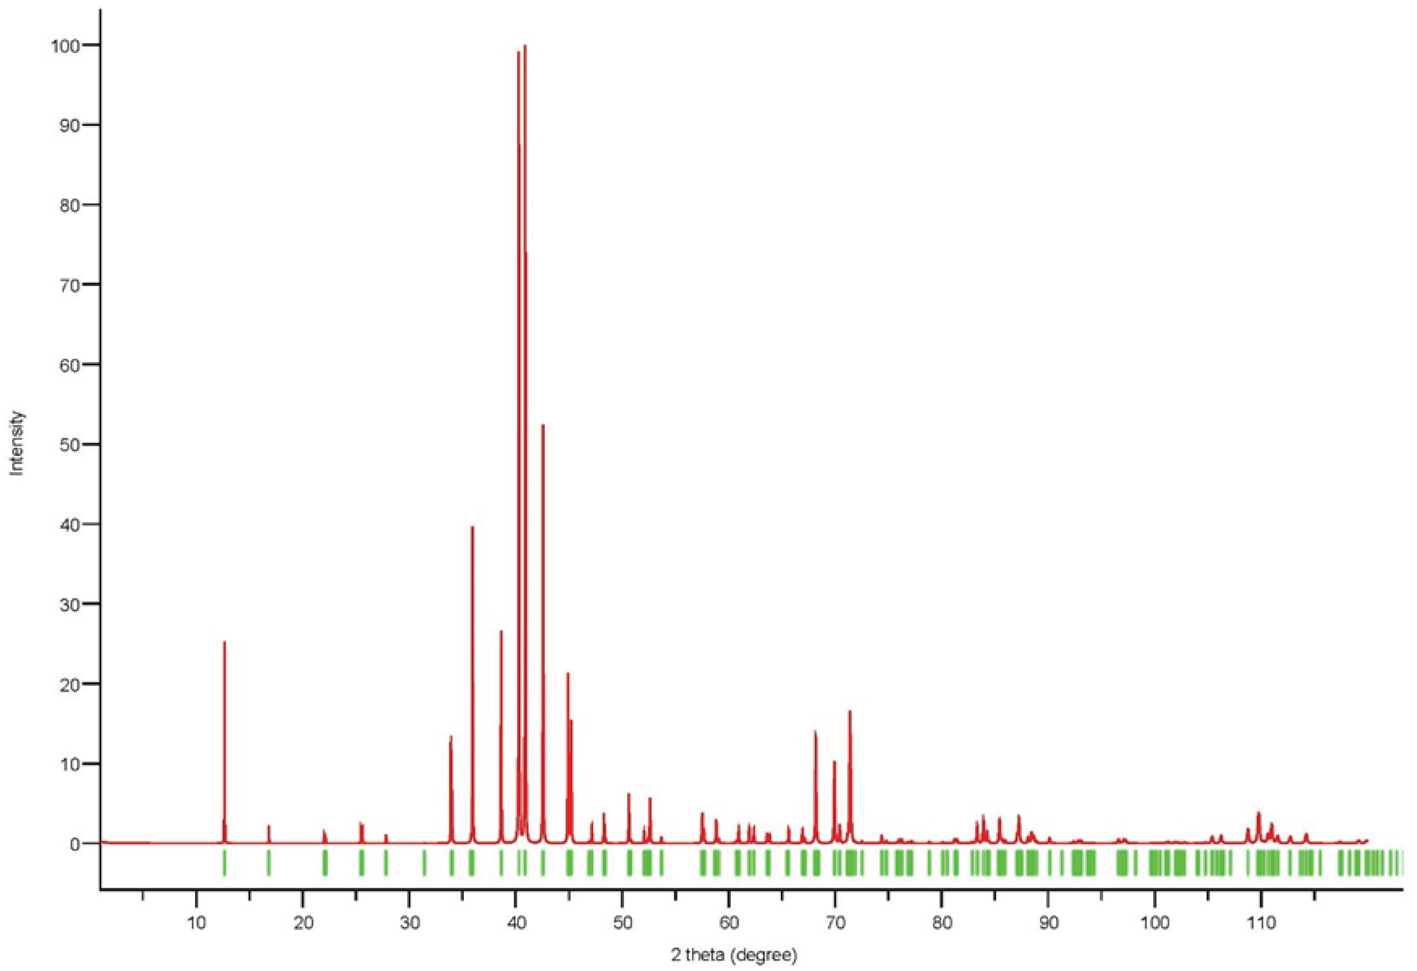
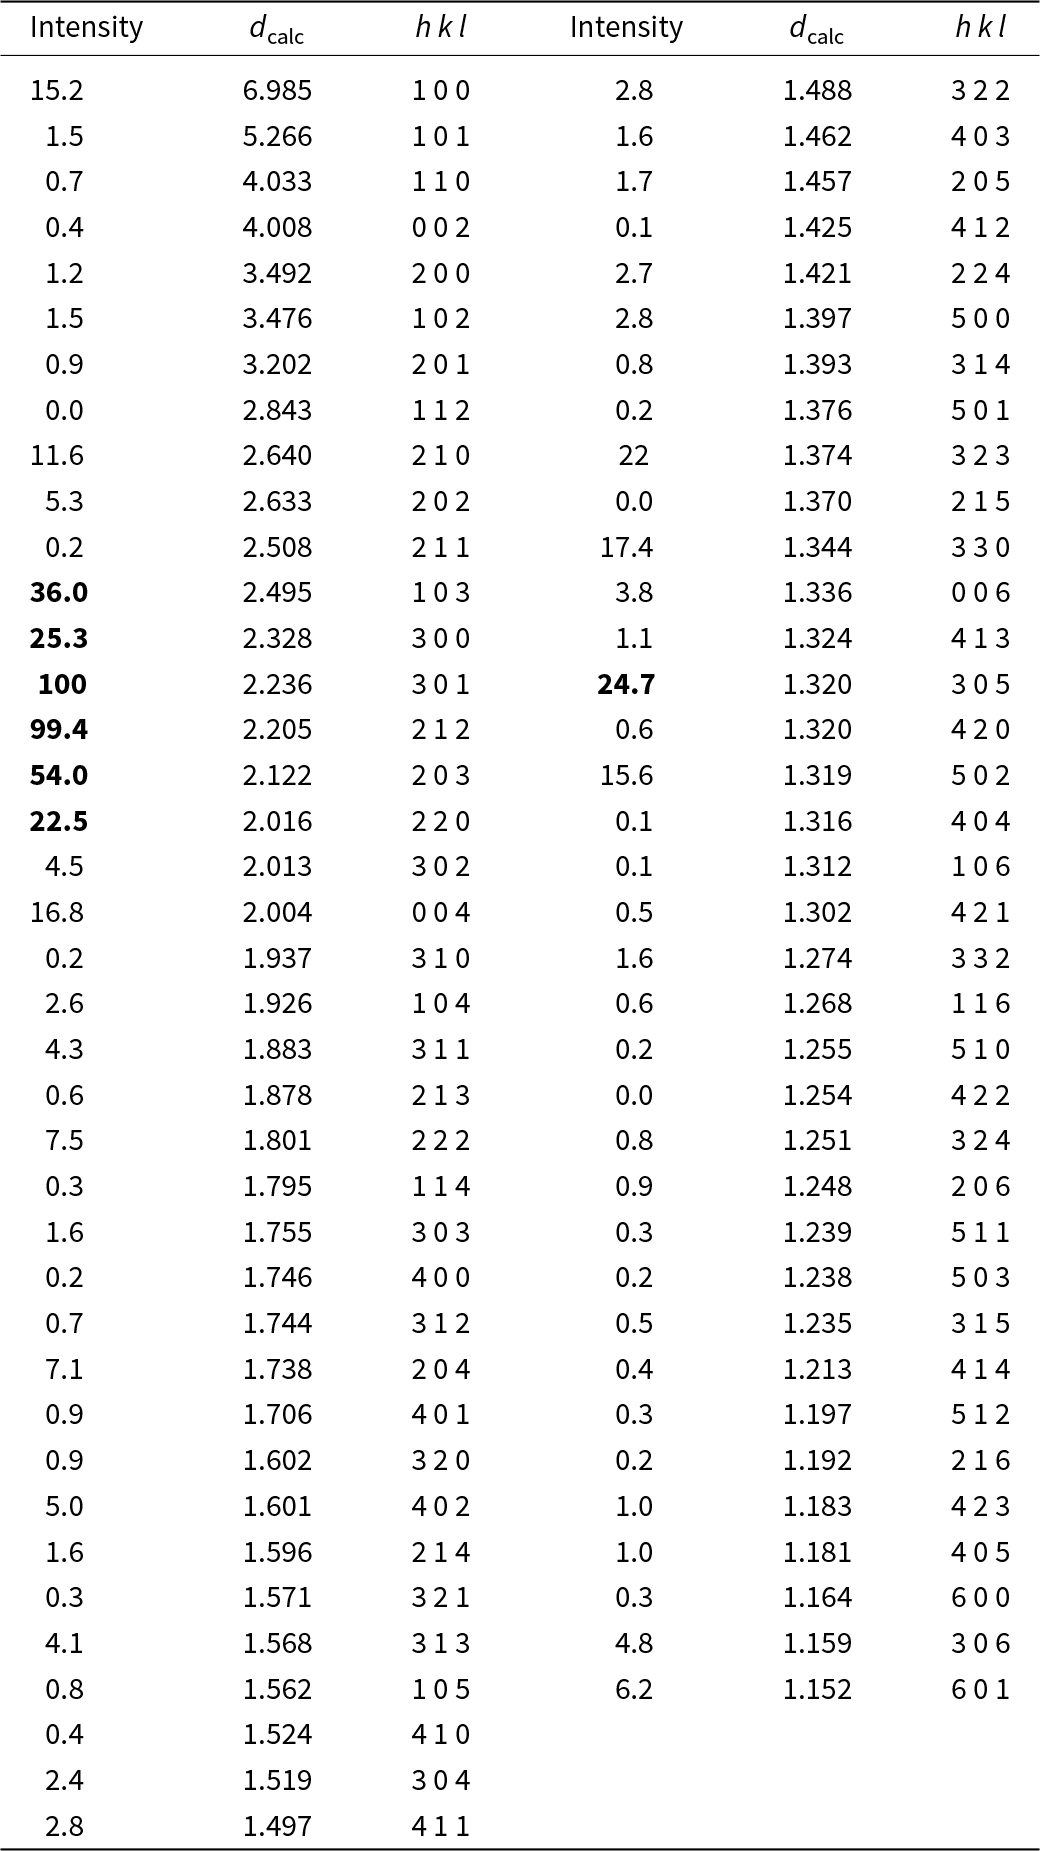
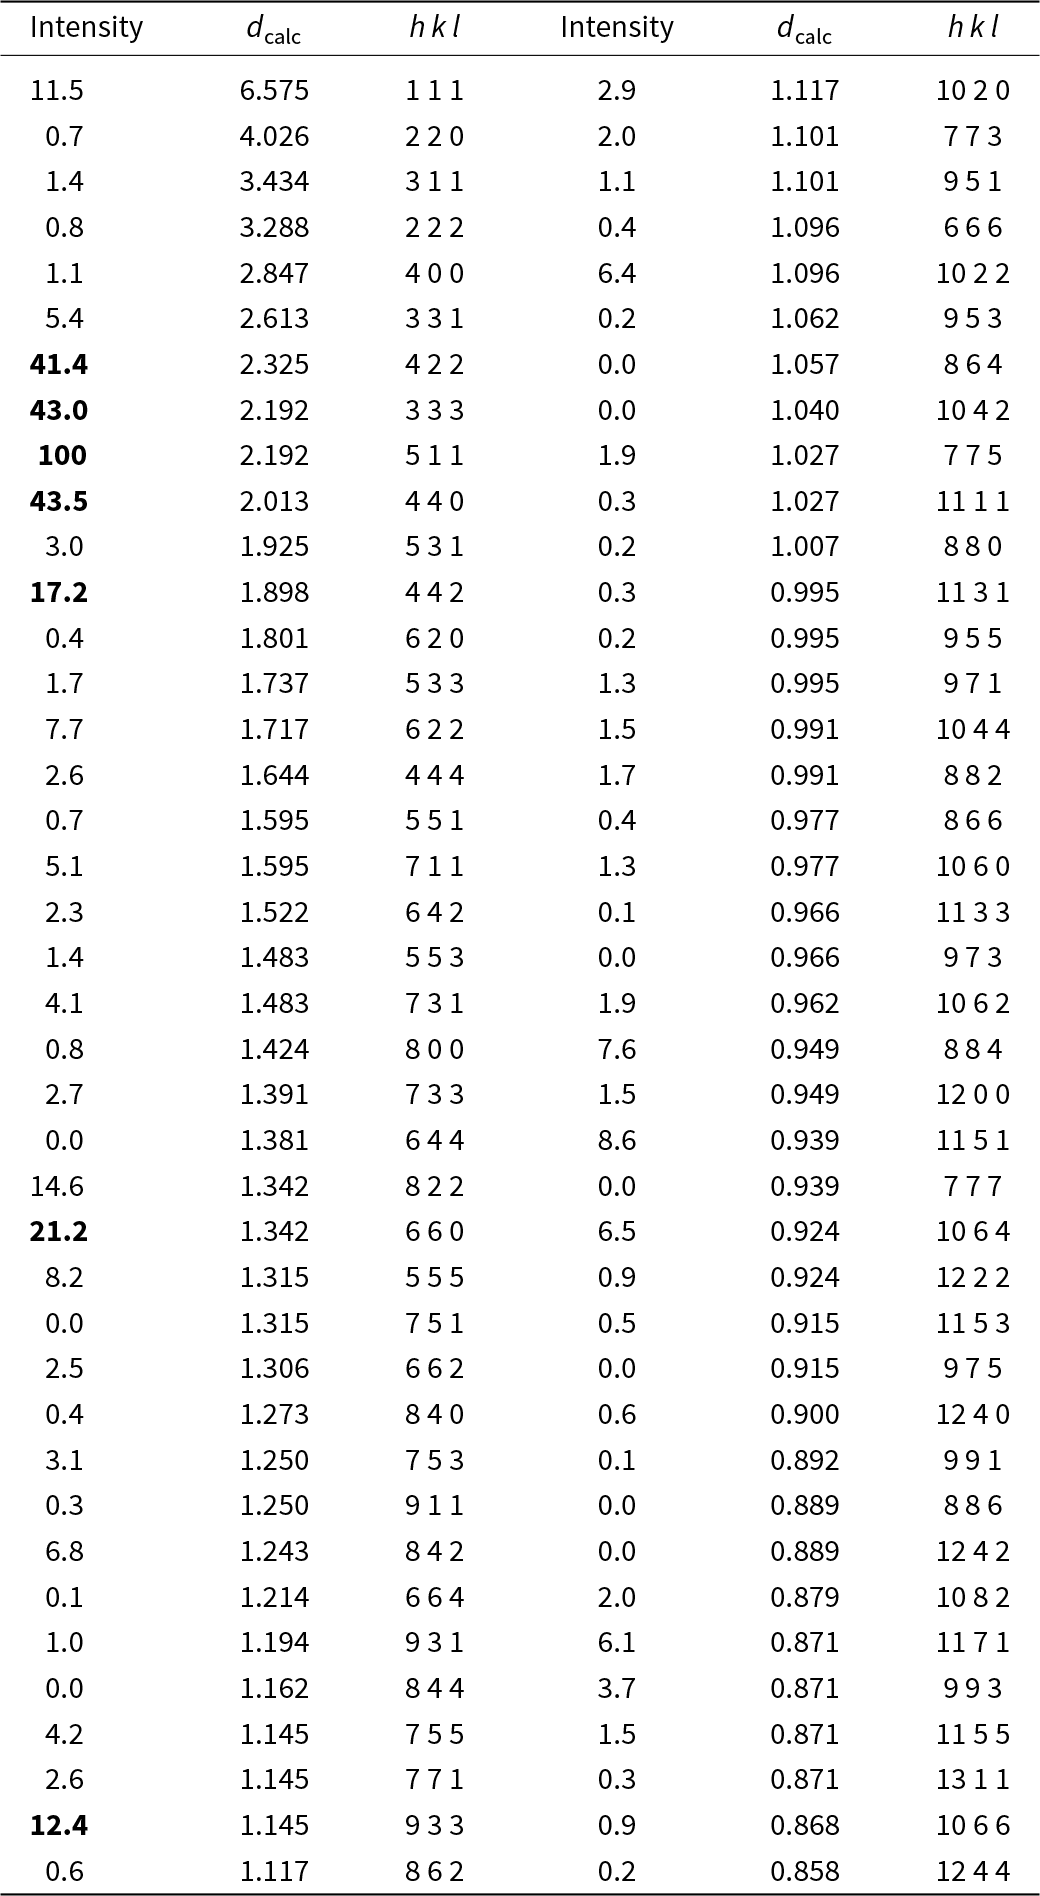
Powder X-ray diffraction data could not be collected as grains of maurogemmiite and paulrobinsonite were much too small, and consequently, we calculated simulated powder X-ray diffraction patterns from the subsequent crystal structure data with VESTA (Momma and Izumi, Reference Momma and Izumi2011) for CuKα1 radiation (λ = 1.540598 Å). A list of the reflections and a plot of the pattern is given in Tables 3 and 4 and Figs 4 and 5 for maurogemmiite and paulrobinsonite, respectively.
Simulated powder X-ray pattern for maurogemmiite from VESTA (Momma and Izumi, Reference Momma and Izumi2011), with CuKα1 radiation, λ = 1.540598 Å).

Simulated powder X-ray pattern for paulrobinsonite from VESTA (Momma and Izumi, Reference Momma and Izumi2011), with CuKα1 radiation, λ = 1.540598 Å).
Powder X-ray diffraction data (d in Å) for maurogemmiite simulated from the crystal structure data by means of VESTA (Momma and Izumi, Reference Momma and Izumi2011), with CuKα1 radiation, λ = 1.540598 Å)

Note: Most intense lines in bold. Calculated intensities are rounded off to the nearest tenth; calculated d-spacings are rounded off to the nearest thousandth.
Powder X-ray diffraction data (d in Å) for paulrobinsonite simulated from the crystal structure data by means of VESTA (Momma and Izumi, Reference Momma and Izumi2011), with CuKα1 radiation, λ = 1.540598 Å)

Note: Most intense lines in bold. Calculated intensities are rounded off to the nearest tenth; calculated d-spacings are rounded off to the nearest thousandth.
Three-dimensional electron diffraction methodology
Three-dimensional electron diffraction (3DED) data (Kolb et al., Reference Kolb, Gorelik, Kübel, Otten and Hubert2007; Mugnaioli and Gemmi, Reference Mugnaioli and Gemmi2018; Gemmi et al., Reference Gemmi, Mugnaioli, Gorelik, Kolb, Palatinus, Boullay, Hovmöller and Abrahams2019) on maurogemmiite and paulrobinsonite in foils #3 and #2 (Fig. 3) were collected at the Department of Earth Sciences of the University of Pisa using a JEOL JEM-F200 Multipurpose TEM, equipped with a Schottky FEG source and operating at 200 kV. Data were acquired in PROBE mode, using a precessing beam (Mugnaioli et al., Reference Mugnaioli, Gorelik and Kolb2009). We set the highest spot size (5 μm) to reduce the beam damage and the smallest condenser aperture (10 μm) to have the smallest parallel beam on the sample. Data were recorded by an ASI CheeTah hybrid-pixel counter set in SEQUENTIAL mode and 24-BIT.
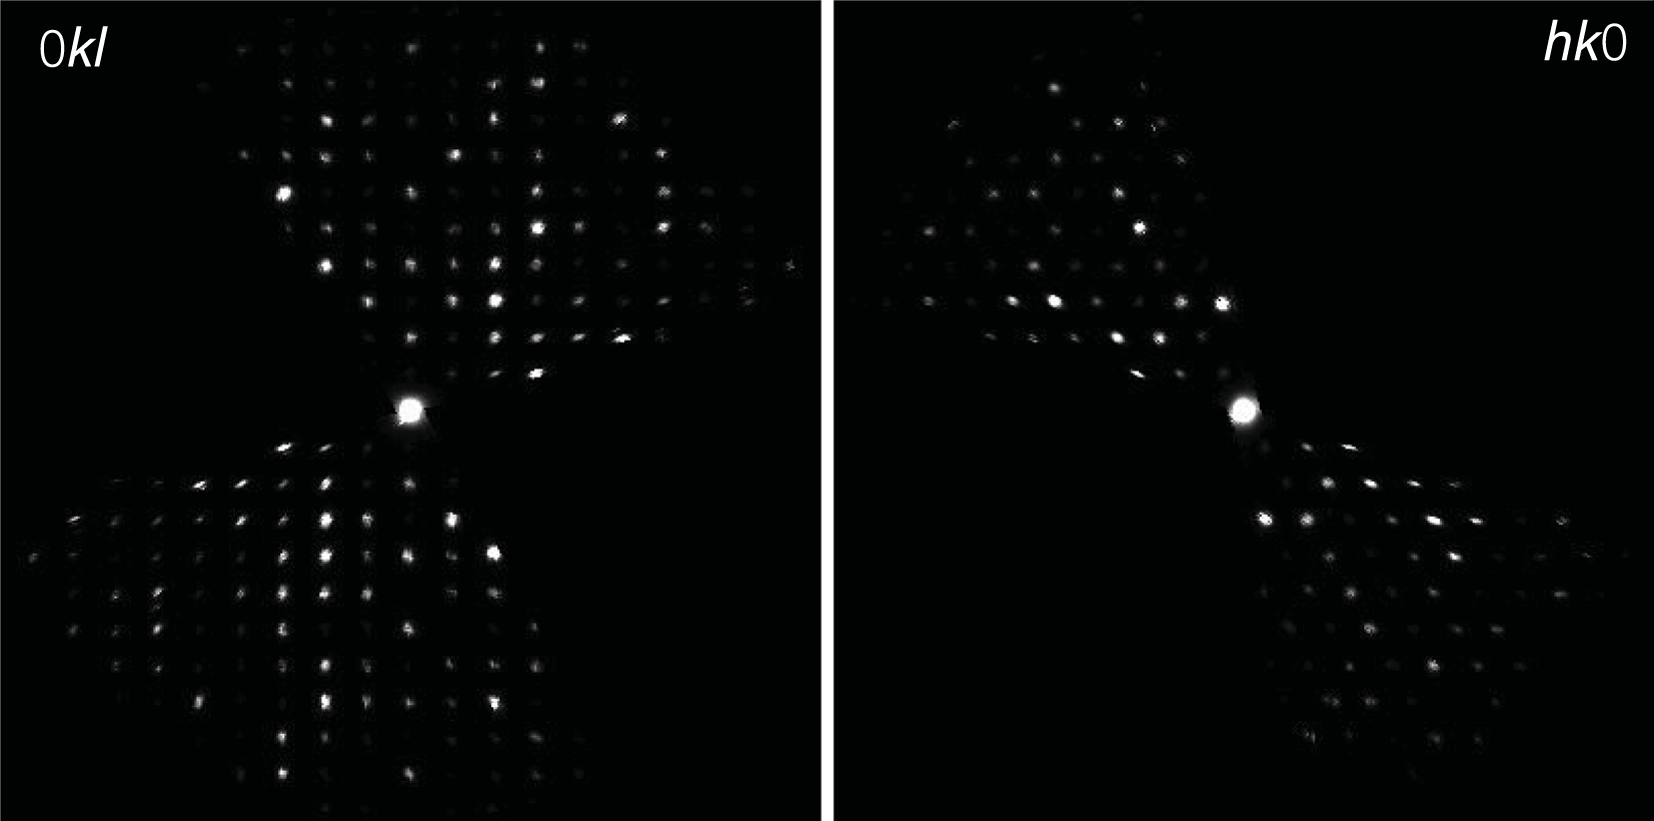
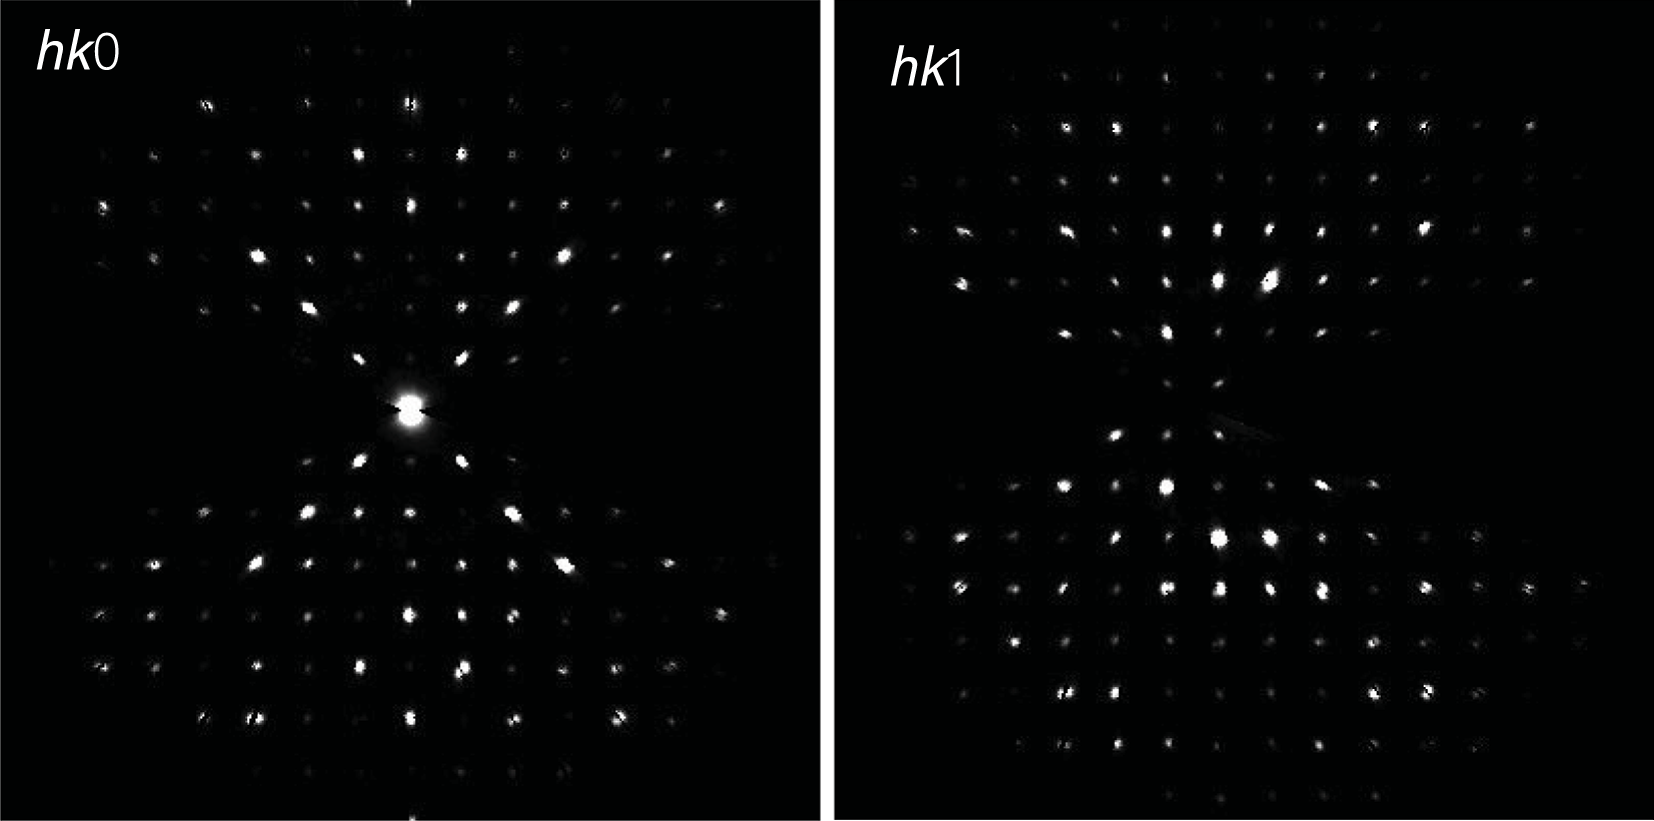
Three-dimensional electron diffraction data were taken in discrete steps of 1° with a precessing beam (Vincent and Midgley, Reference Vincent and Midgley1994; Mugnaioli et al., Reference Mugnaioli, Gorelik and Kolb2009) obtained by a Nanomegas Topspin device. The precession semi-angle was kept at 0.7°. The camera length was 250 mm, with a theoretical resolution limit of 0.7 Å. The best dataset for maurogemmiite, which was used for the final structure refinement, was taken from foil #3 within a total tilt range of 92°, whereas the best dataset for paulrobinsonite was taken from foil #2 within a total tilt range of 91°. Higher tilt was hampered by the thickness of the FIB lamellae. Data were analysed using PETS2 (Palatinus et al., Reference Palatinus, Brázda, Jelínek, Hrdá, Steciuk and Klementova2019), which allowed us to refine experimental distortions before cell determination and integration of reflection intensities. Representative two-dimensional cuts of the reconstructed reciprocal space are shown in Fig. 6 (maurogemmiite) and Fig. 7 (paulrobinsonite).
Reconstructed main diffraction zones of maurogemmiite from three-dimensional electron diffraction data. The extinction rule ‘000l: l = 2n’ is visible along the vertical axis in the left panel.

Reconstructed hk0 (left) and hk1 (right) diffraction zones of paulrobinsonite from three-dimensional electron diffraction data. In hk0, chess-board extinctions due to the d-glide plane are supposed to be present but are largely overprinted by dynamical effects. No hint of such extinctions is present in hk1.

The structure was solved ab initio by direct methods using the software SIR2014 (Burla et al., Reference Burla, Caliandro, Carrozzini, Cascarano, Cuocci, Giacovazzo, Mallamo, Mazzone and Polidori2015). Subsequently, the model was refined by JANA2020 (Petříček et al., Reference Petříček, Dušek and Palatinus2014), considering the dynamical scattering. During dynamical refinement, each diffraction pattern was refined separately using Bloch wave formalism (Palatinus et al., Reference Palatinus, Jacob, Cuvillier, Klementová, Sinkler and Marks2013, Reference Palatinus, Corrêa, Steciuk, Jacob, Roussel, Boullay, Klementová, Gemmi, Kopeček, Domeneghetti, Cámara and Petříěk2015a, Reference Palatinus, Petříček and Corrêa2015b). Together with the structure, the thickness of the lamellae was refined using a simple platelet shape. Only Ti, Fe and O species were considered for the refinement, although maurogemmiite and paulrobinsonite also contain small amounts of Si and Ni. A small amount of N may also be present, but it could not be measured and thus has been ignored. Thermal parameters were treated as isotropic for all atoms. The occupancy of all interstitial atoms was left free to refine with no constraint derived from EDS measurements, which may be severely biased for light atoms.
For the final refinement, nine zones out of 93 were excluded for maurogemmiite and 11 zones out of 92 excluded for paulrobinsonite for having either an inconsistent tilt correction, an anomalously high structural residual, or an anomalous intensity scale. Most of these zones belong to high alpha tilt values of the 3DED acquisition.
Maurogemmiite
The 3DED data delivered a primitive hexagonal cell with a = 8.065(1) Å, c = 8.015(3) Å and V = 451.6(2) Å3. Extinctions are consistent with the rule ‘hh-2hl: l = 2n’ (Fig. 6). Ab initio structure solution converged in the centrosymmetric space group P63/mmc, where four atom positions (Ti1, Ti2, Ti3 and Fe1) were immediately spotted. The first difference-Fourier map, which was performed with the dynamical method after fixing the atomic coordinates, showed two additional strong potentials at positions (6g) and (2d). The former position is octahedrally coordinated (Table 5), whereas the latter position is coordinated inside a trigonal prism with Ti2 (interatomic distance 2.37 Å).
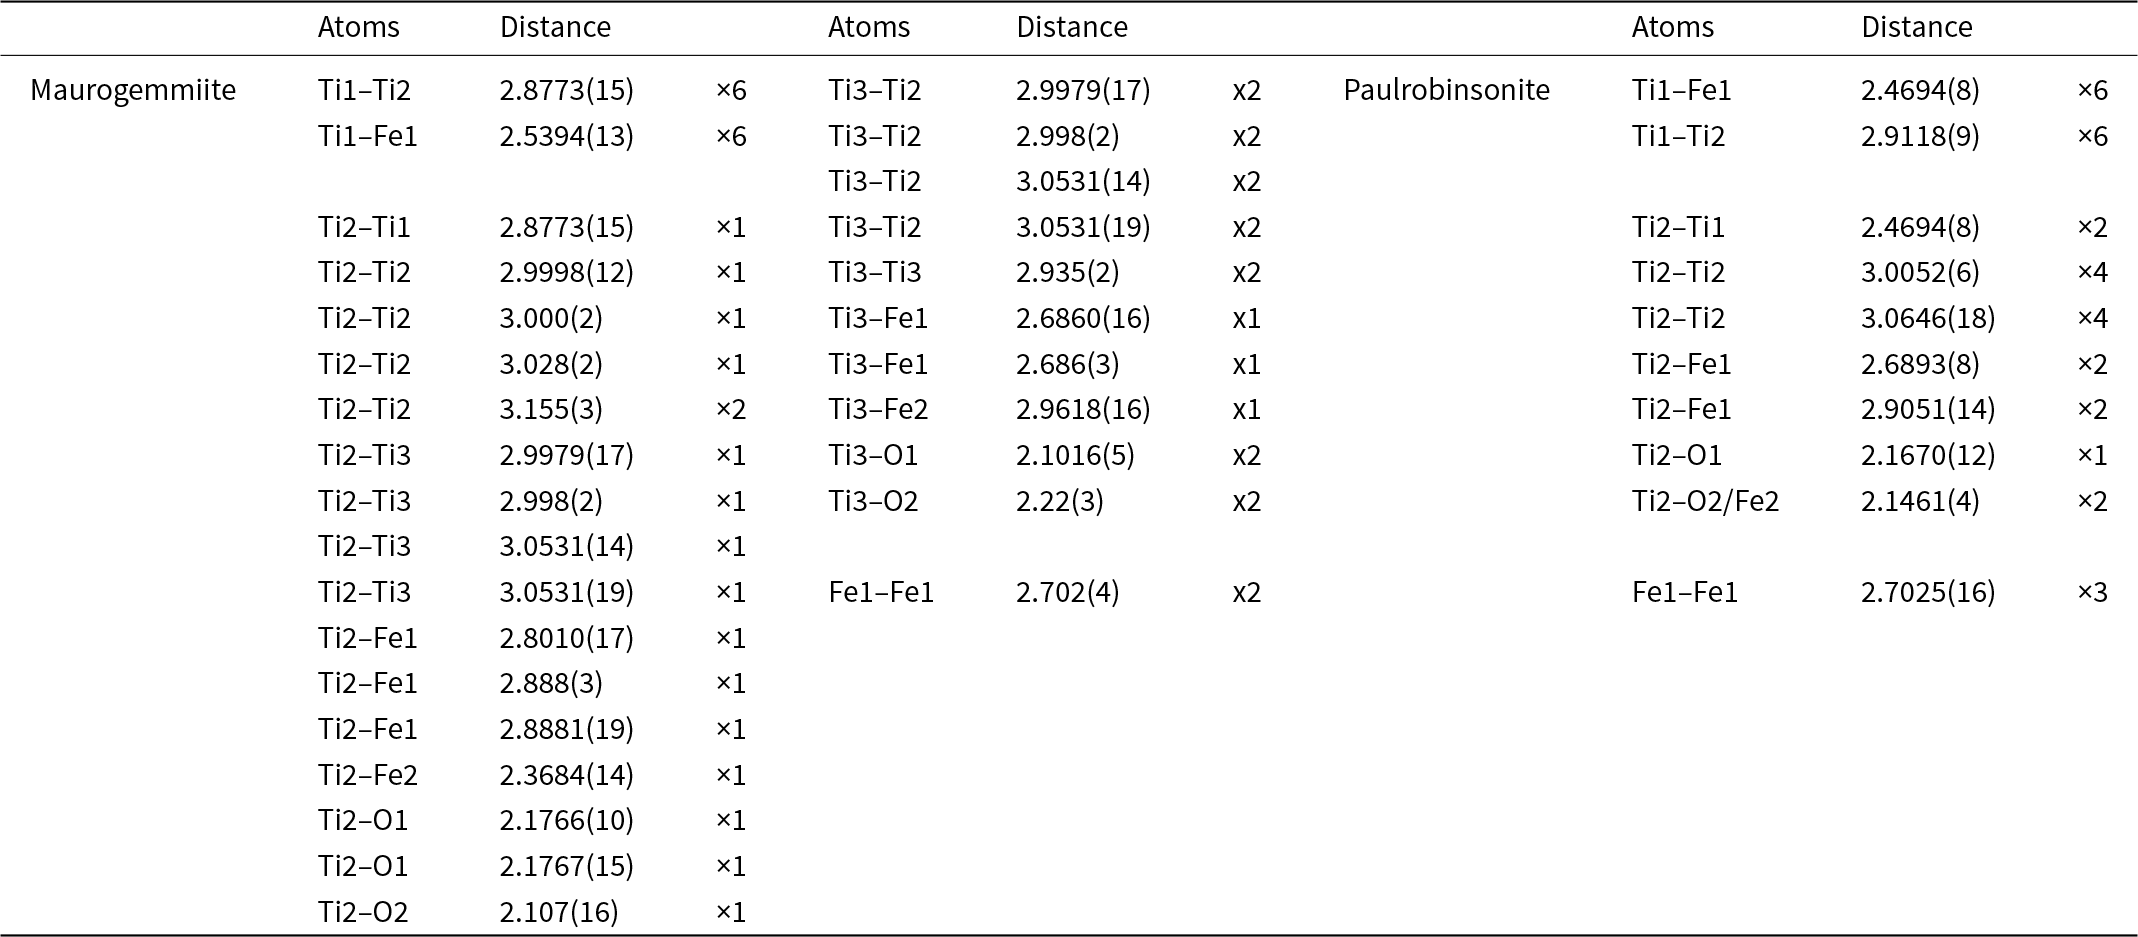
Interatomic distances (d, Å) in maurogemmiite and paulrobinsonite

In agreement with EDS data (Table 1) and considering the different coordination, we assigned O species to the first extra potential and Fe to the second extra potential. Displacement parameters and occupancies were kept unrestrained during dynamical refinement. An extra potential was detected by successive difference-Fourier mapping at position (4f), also octahedrally coordinated with Ti2 and Ti3 (interatomic distances 2.11 Å and 2.22 Å, respectively). Because of the weaker ionic potential, only the O species was assigned to this additional position. The final refined model, R(I>3σ) = 0.1089; R(all) = 0.1192, nicely converged to the formula Fe3.23Ti10O2.91 (Table 6). This formula is consistent with the Ti:Fe ratio expected from EDS results (Table 1). When the formula is normalised to Ti = 10 using the O value from the structurally refined model (Table 6), we obtain Al0.07Si0.51Ti10Fe3.23Ni0.11O2.91. That is, the amount of O is higher than the amount of O given by EDS (Table 1), confirming that EDS tends to underestimate the abundance of light elements. However, both EDS and the refined model based on 3DED data consistently indicate that O is a major constituent of maurogemmiite. In contrast, the amount of Fe derives from the experimental values measured by EDS, because it is very hard to distinguish Ti and Fe species by electron diffraction due to their similar nuclear potentials. The isotropic displacement parameters are positive and in a reasonable range for all atoms except for the partially occupied O2 site, where the displacement parameter is close to 0 (Table 6). The crystallographic information file has been deposited with the Principal Editor of Mineralogical Magazine and is available as Supplementary material (see below).
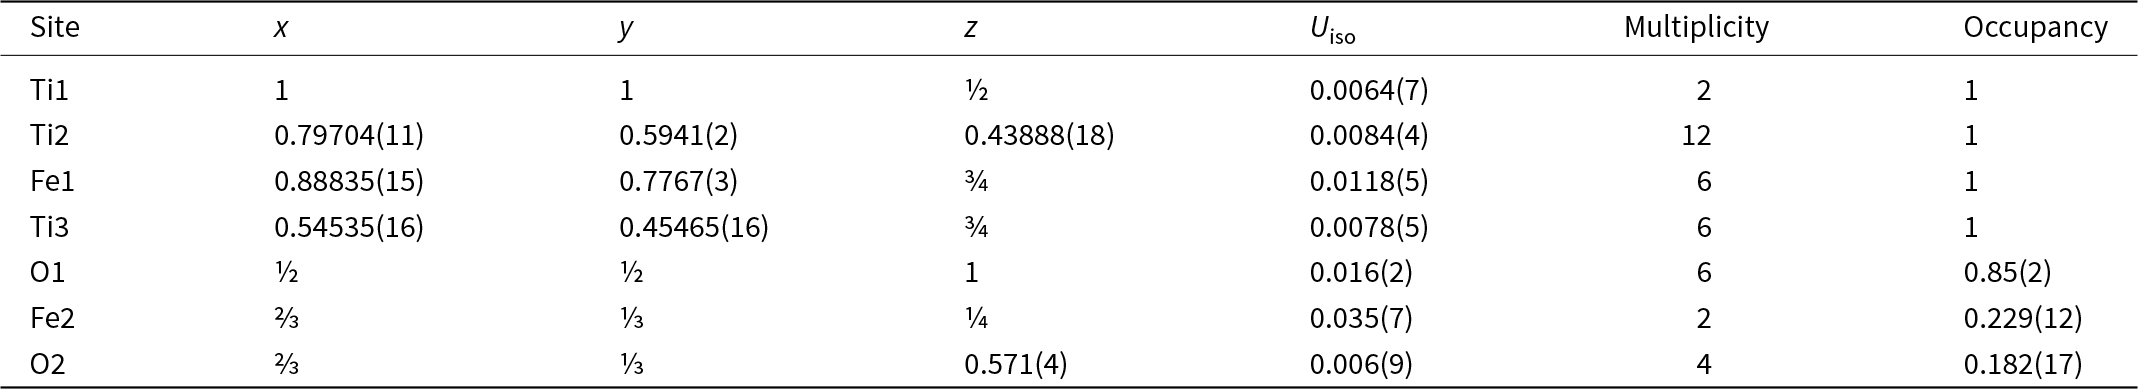
Sites, fractional atom coordinates, isotropic displacement parameters (Å2), site multiplicities and occupancies for maurogemmiite as refined from three-dimensional electron diffraction data

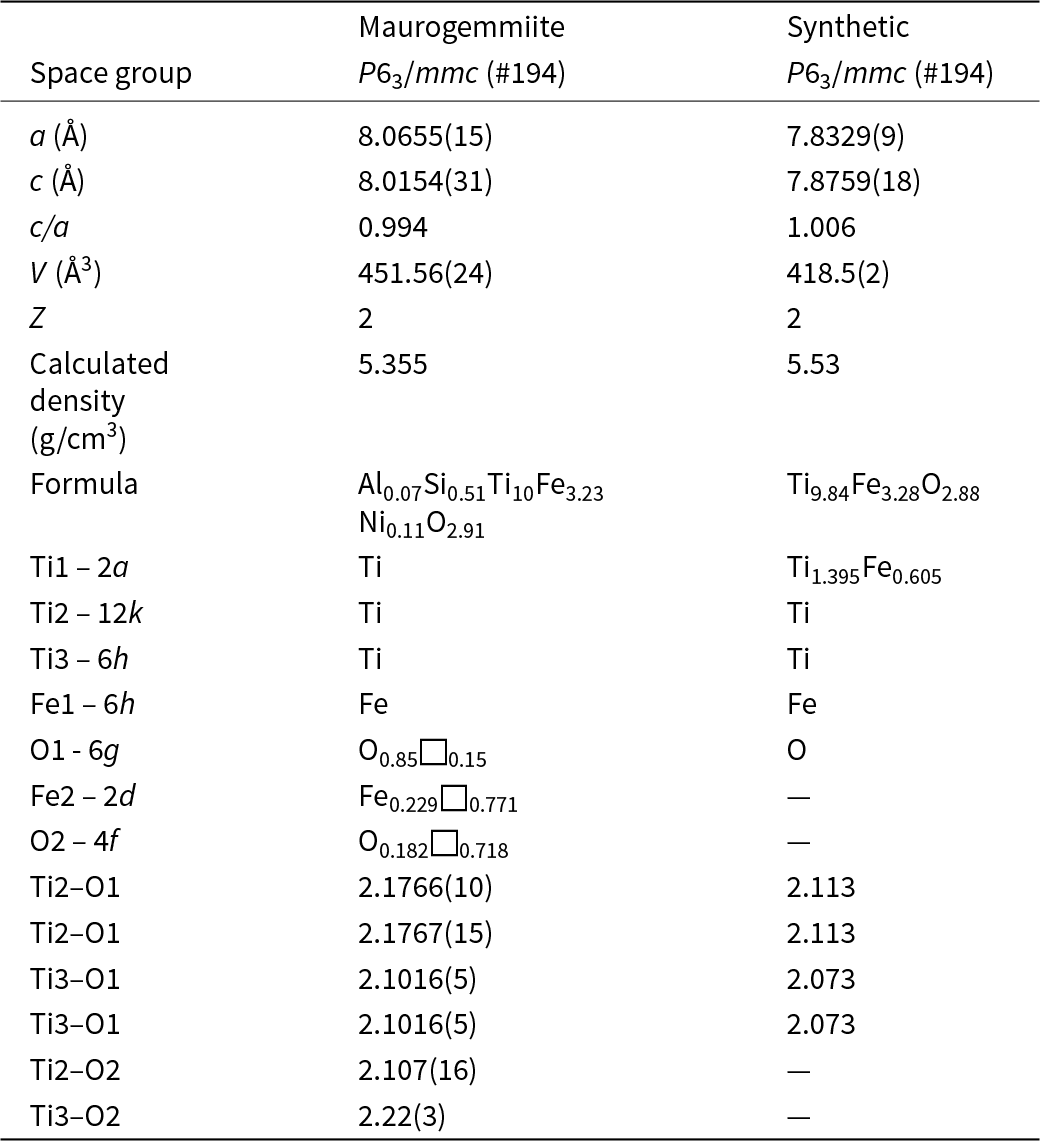
Maurogemmiite (Fig. 8) is isostructural with synthetic κ-phases (e.g. Rautala and Norton, Reference Rautala and Norton1952; Rogl et al., Reference Rogl, Rupp, Wiesinger, Schefer and Fischer1985; Hårsta and Rundqvist, Reference Hårsta and Rundqvist1987). the crystallographic properties of maurogemmiite obtained in the present work are compared in Table 7 with results for synthetic samples from the literature. The main atoms of the structure, i.e. not considering the interstitial and partially occupied positions, build a compact framework with Ti1, Ti3 and Fe1 in coordination 12, and Ti2 in coordination 13 (atomic distances between 2.1 and 3.2 Å (Table 5). Both Ti1 and Fe1 dwell inside relatively isotropic coordination environments. In contrast, Ti2 and Ti3 show a scattered pattern of interatomic distances with first neighbours. This structural anisotropy resulted in interstitial spaces in the Fe3Ti10 framework that are occupied predominantly by O and partially by non-stoichiometric Fe. The O sites are coordinated by six Ti atoms inside almost regular octahedra. These octahedra are always connected to each other by face-sharing, thus forming a continuous 3D-framework within the maurogemmiite (Fig. 9) and paulrobinsonite structures (see below), suggesting that O atoms have a certain freedom to flip between the two interstitial positions.
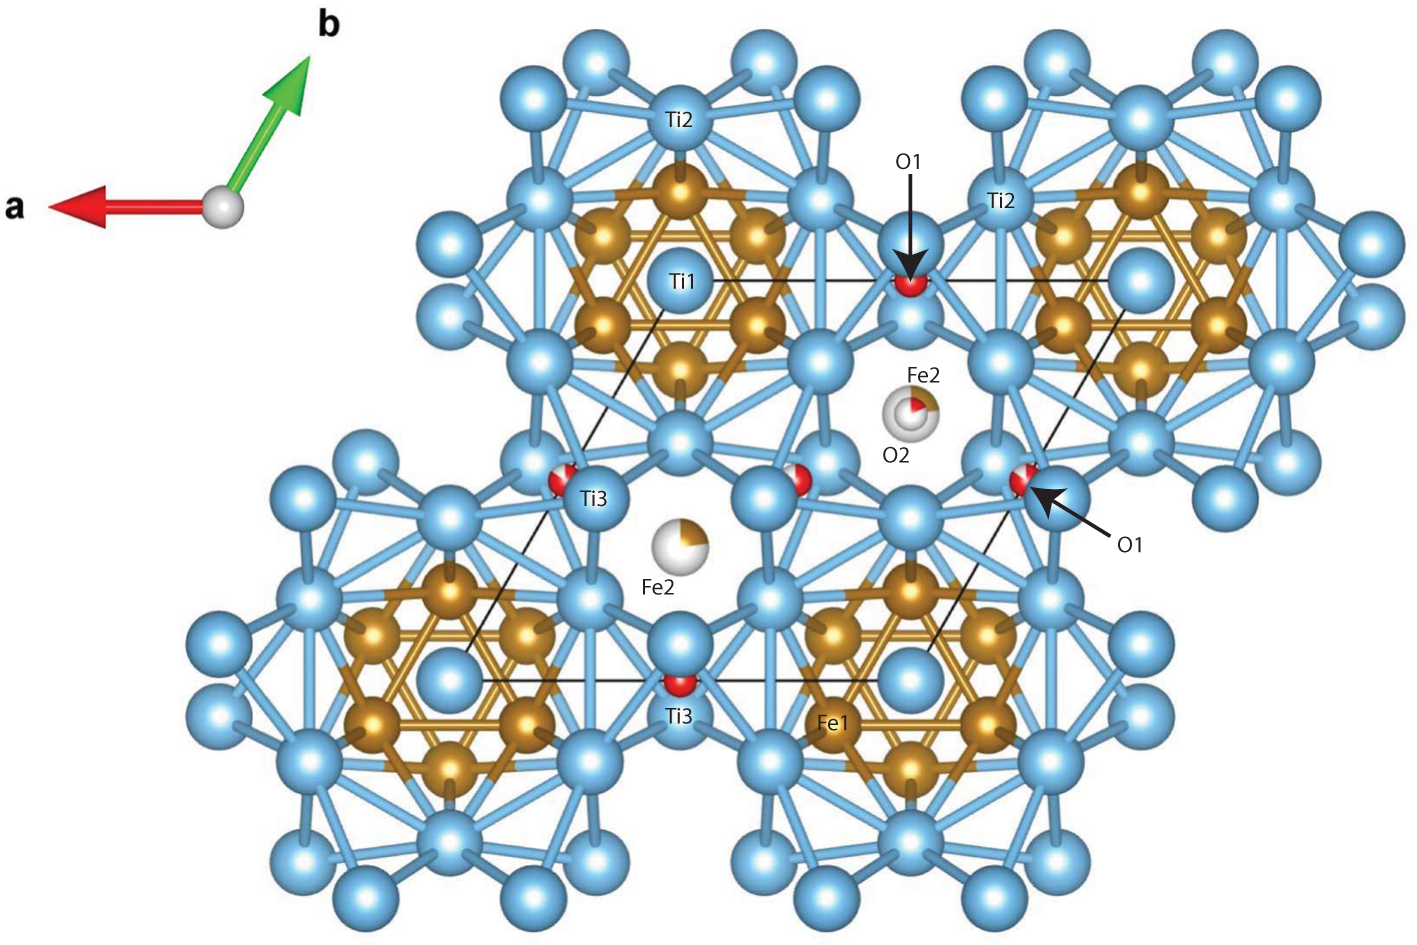
The structure of maurogemmiite projected along [001]. Ti – blue, Fe – brown, O – red. Note that O2 and Fe2 have the same x and y coordinates but differ in the z coordinate so that O2 is visible in one position but covered by Fe2 in the other.

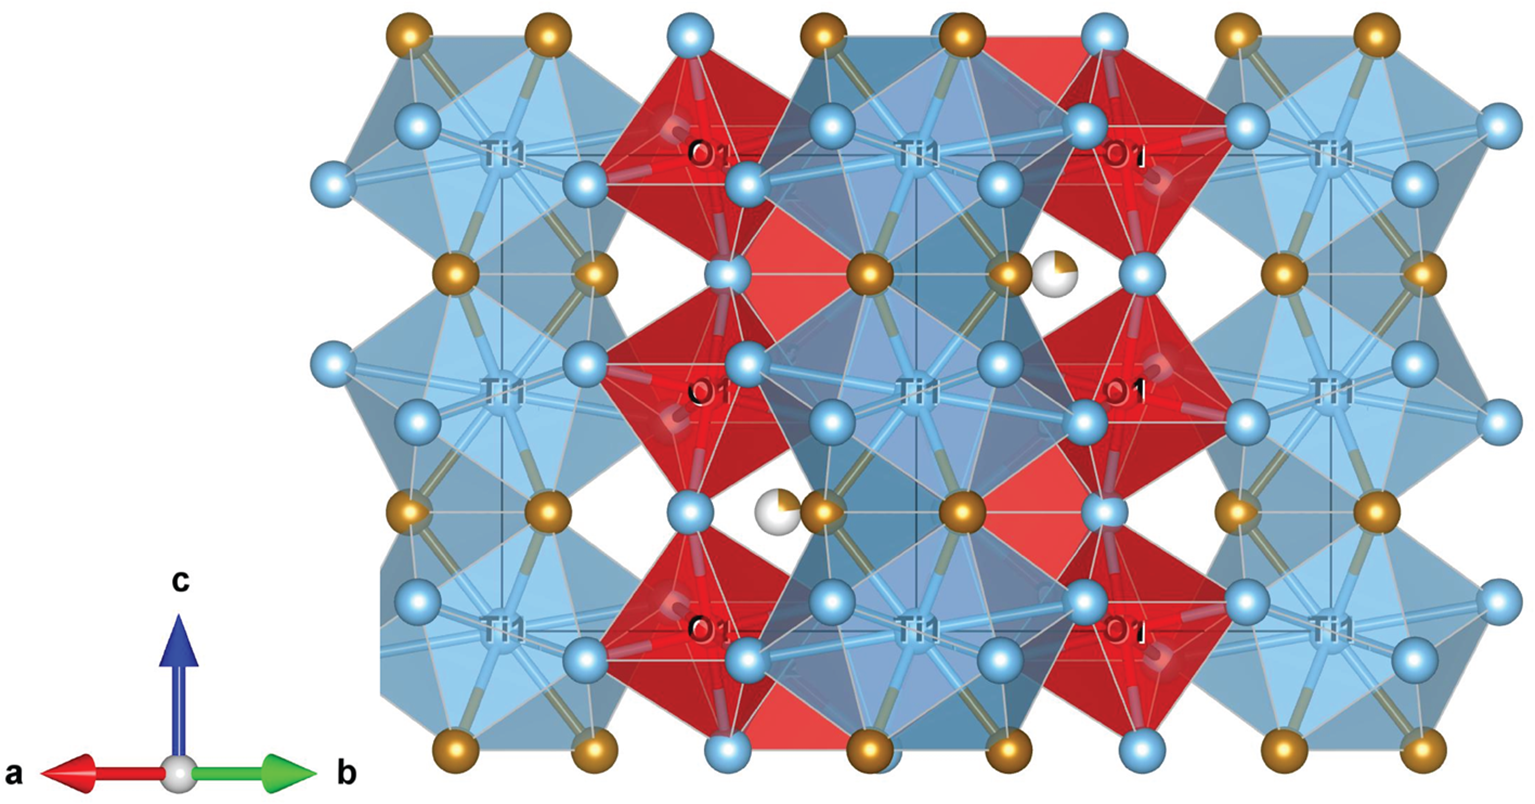
Fragment of maurogemmiite structure illustrating the O-centred octahedra connected by face-sharing in a 3D-framework: O1 octahedra (darker red) and O2 tetrahedra (lighter red). Blue spheres and polyhedra – Ti, brown spheres – Fe.

Comparison of maurogemmiite with a synthetic analogue, κ-Ti–Fe phase (Rogl et al., Reference Rogl, Rupp, Wiesinger, Schefer and Fischer1985)

Paulrobinsonite
The 3DED data delivered an F-centred cubic cell with a = 11.388(4) Å and V = 1477.0(8) Å3. Planar extinctions consistent with 0kl: k + l = 4n were observed (Fig. 7). Ab initio structure solution converged to a centrosymmetric space group Fd  $\bar 3$m, where three atom positions (Ti1, Ti2 and Fe1) were immediately spotted. The first difference-Fourier map, performed with a dynamical method but fixing atom coordinates, showed an additional strong potential at position (16d). This position is octahedrally coordinated with Ti2. In agreement with EDS data, we assigned both Fe and O species to this extra potential. Thermal parameters and occupancies of these atoms were kept unconstrained during dynamical refinement.
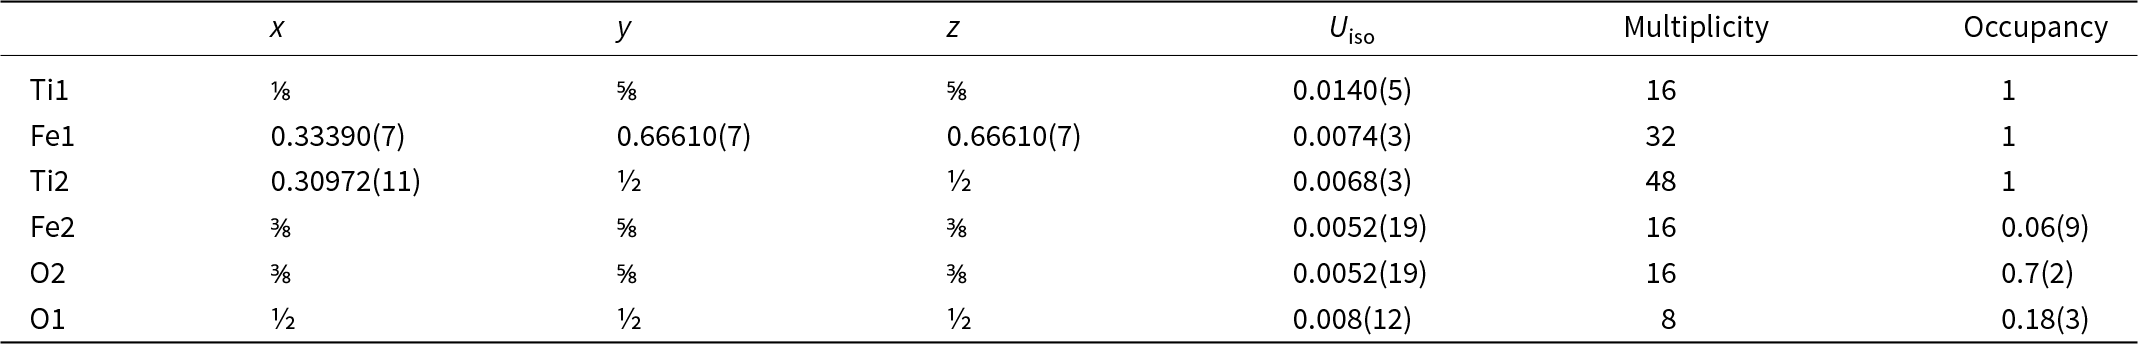
An extra potential was detected by successive difference-Fourier mapping at position (8b), also octahedrally coordinated with Ti2. Because of its weaker ionic potential, only O was assigned to this position. The final refined model, R(I>3σ) = 0.0883; R(all) = 0.0913, nicely converged to the formula Fe4.12Ti8O1.58, reasonably consistent with the Ti:Fe ratio expected from EDS results (Table 8). When the formula is normalised to Ti = 8 using the O content obtained from the structurally refined model, we obtain Al0.07Si0.44Ti8Fe4.33Ni0.23O1.58 (Table 2).
Sites, fractional atom coordinates, isotropic displacement parameters (Å2), site multiplicities and occupancies for paulrobinsonite as refined from three-dimensional electron diffraction data
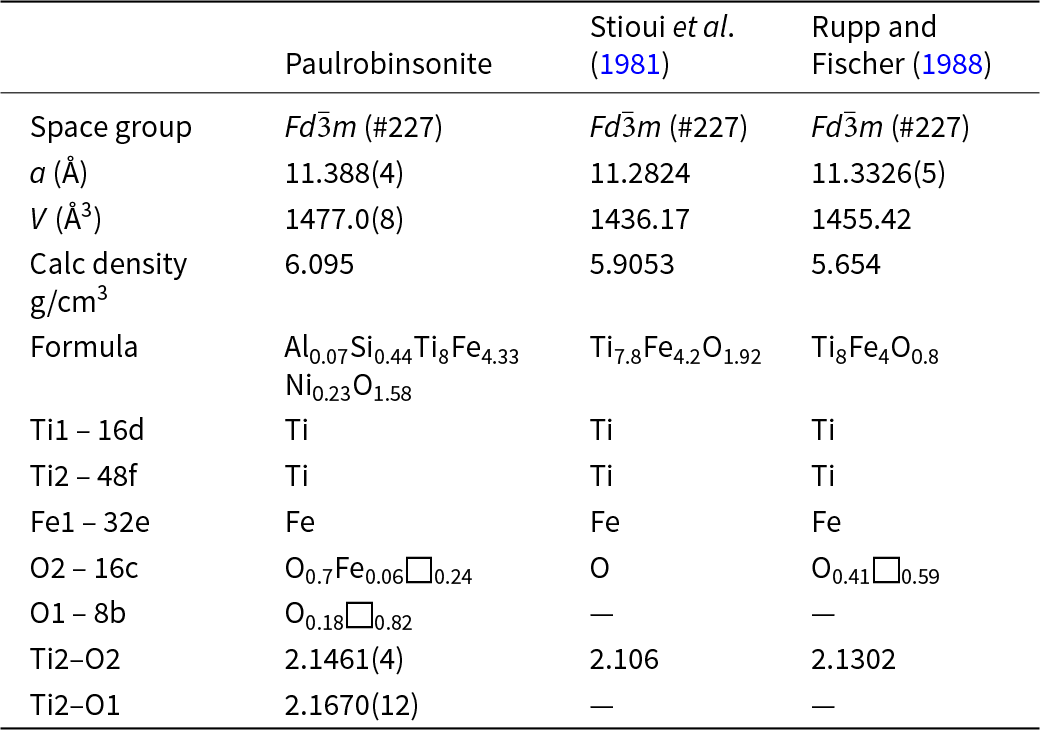
Paulrobinsonite is isostructural with synthetic η-phases (e.g. Table 9), a designation first used by Takeda (Reference Takeda1936) for the carbide Co3W3C, and subsequently by Kuo (Reference Kuo1953) for the family of carbides with the general composition M6C. Westgren (Reference Westgren1933) was the first to solve the structure. Nevitt (Reference Nevitt1960) and Nevitt et al. (Reference Nevitt, Downey and Morris1960) reviewed η-phases with oxygen instead of carbon. There are more general reviews (e.g. Stadelmaier, Reference Stadelmaier1969; Rogl and Nowotny, Reference Rogl and Nowotny1977) as well as studies specifically of η-phases composed of Ti and Fe (e.g. Rupp and Fischer, Reference Rupp and Fischer1988, Stioui et al., Reference Stioui, Fruchart, Rouault, Fruchart, Roudaut and Rebiére1981; Lavrentyev et al., Reference Lavrentyev, Gabrelian, Shkumat, Nikiforov, Zavaliy, Sinelnichenko, Izvekov and Khyzhun2010). The crystallographic properties of paulrobinsonite obtained in the present work are compared with results for synthetic samples from the literature in Table 9.
Comparison of paulrobinsonite with synthetic analogues

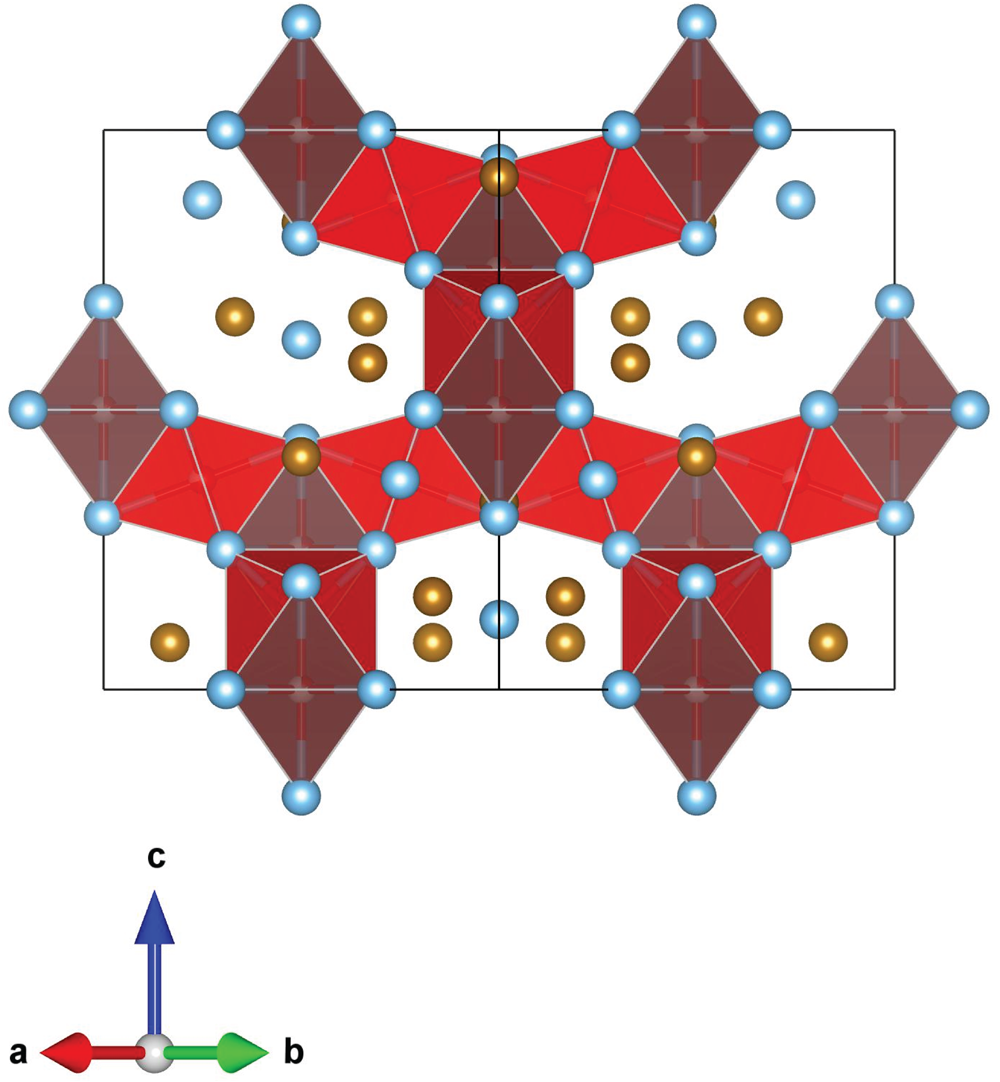
The main atoms of the structure form a compact framework with Ti1 and Fe1 in coordination 12 and Ti2 in coordination 14 (atomic distances between 2.1 and 3.1 Å) (Table 5, Fig. 10). The remaining Fe and all O atoms occupy interstitial positions, in octahedral coordination with Ti2 (interatomic distances between 2.15 and 2.17 Å, Table 5). The O sites are coordinated by six Ti atoms inside almost regular octahedra as in maurogemmiite and connected to each other by face-sharing (Fig. 11). Moreover, it would be possible for O to flip between the two interstitial positions.
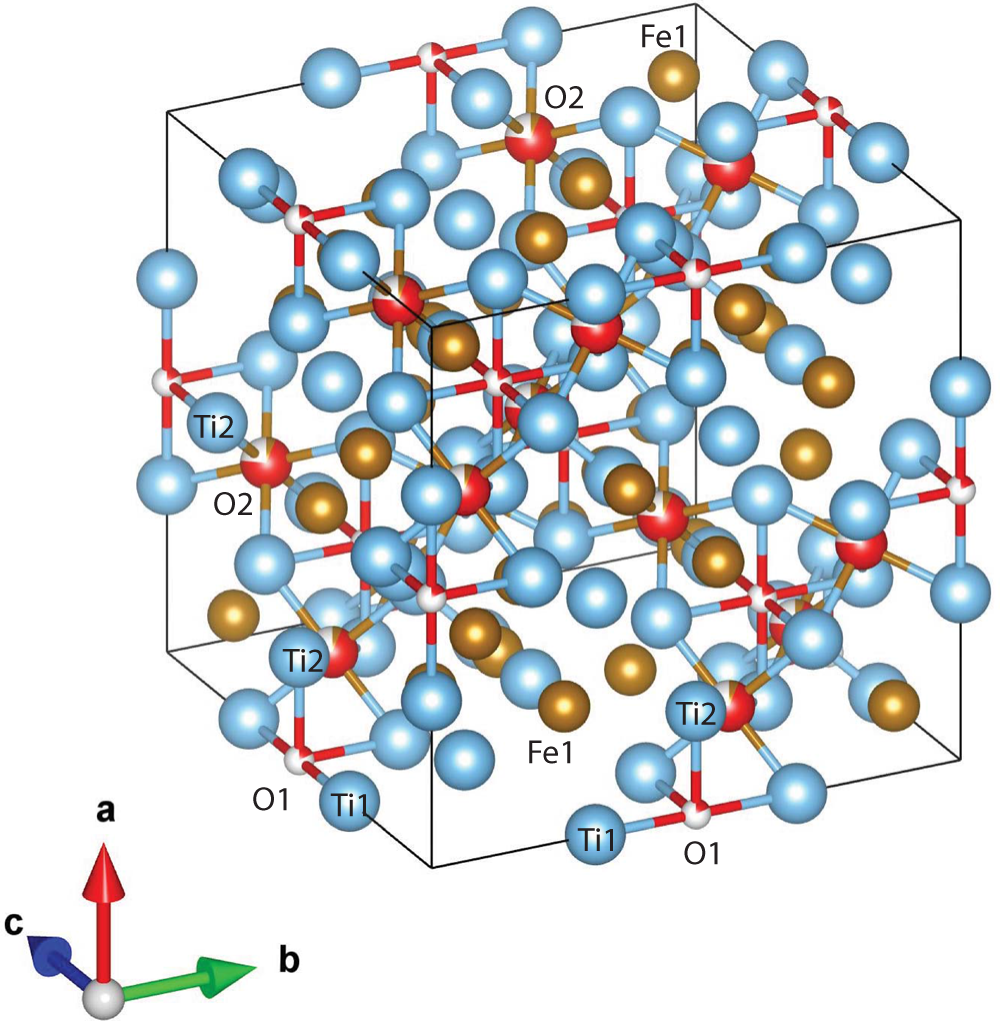
Oblique view of the structure of paulrobinsonite. Blue spheres – Ti, brown spheres – Fe and red spheres – O.

Fragment of the structure of paulrobinsonite showing O-centred octahedra connected by face-sharing, O1 octahedra (dark red) and O2 octahedra (light red).

In paulrobinsonite, O is the main atomic species that occupies the interstitial positions. As noticed for synthetic analogues, the occurrence of interstitial sites in the FeTi2 framework facilitates the entrapment of light elements. Moreover, η-type phases in the Ti–Fe–O system appear to require the presence of O at an interstitial site, which is not the case for the Ti–Co–O and Ti–Ni–O systems, in which the binary η-type phases Ti2Co and Ti2Ni can be synthesised (Nevitt, Reference Nevitt1960; Rupp and Fischer, Reference Rupp and Fischer1988). The crystallographic information file has been deposited with the Principal Editor of Mineralogical Magazine and is available as Supplementary material (see below).
Silicon contents
As mentioned above, both maurogemmiite and paulrobinsonite structure refinements were performed considering only Ti, Fe and O. The amount of Si measured by EDS is indeed not negligible and Si is known to occupy interstitial positions in κ-phases (Hårsta and Rundqvist, Reference Hårsta and Rundqvist1987). Attempts to replace interstitial Fe with interstitial Si ended in sound refinements, with comparable R values and just a slightly higher site-occupancy, as one should expect because Si is a weaker scatterer than Fe. Conversely, when we force in the interstitial positions both Fe and Si with the exact amounts measured by EDS in the interstitial positions, the associated displacement (thermal) factor became unreasonably high, showing that too much potential was imposed. Consequently, we decided to exclude Si from the final models. The amount of this element is subordinate to the amounts of Ti and Fe and we cannot confidently establish what its role might be in the maurogemmiite and paulrobinsonite structures.
Discussion
Origin of the fragment
Litasov et al. (Reference Litasov, Kagi and Bekker2019, Reference Litasov, Bekker, Kagi and Ohfuji2020) and Ballhaus et al. (Reference Ballhaus, Wirth, Fonseca, Blanchard, Pröll, Bragagni, Nagel, Schreiber, Dittrich, Thome, Hezel, Below and Cieszynski2017, Reference Ballhaus, Helmy, Fonseca, Wirth, Schreiber and Jöns2021) and others have challenged the assertion that the fragment (sample M11843) has a natural origin from deep in the mantle but instead could be a contaminant from abrasives or originating from shock, either from lightning strikes or during preparation of the separates by electrical impulses used for grinding and fragmentation. Litasov et al. (Reference Litasov, Kagi and Bekker2019, p. 188) concluded that “in our opinion, this coesite-bearing aggregate remains extremely enigmatic.” Though an argument might be made that diamond, corundum and moissanite extracted from chromitite at Luobusa resulted from contamination of mineral separates, as discussed in detail by Xiong et al. (Reference Xiong, Xu, Mugnaioli, Gemmi, Wirth, Grew, Robinson and Yang2020) in the case of corundum, such an argument cannot be made in the case of sample M11843 as neither diamond, nor corundum nor moissanite is present. Moreover, formation of a coesite + kyanite assemblage as an inadvertent synthesis is not supported by available evidence on the conditions conducive to the formation of kyanite and coesite, even in rocks affected by the strong shocks resulting in impact structures. For example, kyanite has been described from shocked rocks (Stähle et al., Reference Stähle, Rainer, Koch and Nasdala2004; Spray and Boonsue, Reference Spray and Boonsue2018), but the textures are very different from those in the fragment in that kyanite grains in the shocked rocks do not exceed 10 μm in the longest dimension and are associated with veining. Lastly, nitrogen isotopic systematics in ‘osbornite’ in the fragment are “consistent with the N in our sample containing a component coming from deep in the mantle, or conceivably even from the core” (Dobrzhinetskaya et al., Reference Dobrzhinetskaya, Wirth, Yang, Green, Hutcheon, Weber and Grew2014, p. 769), further evidence for the fragment having a natural origin not associated with lightning strikes or electrical impulses.
In summary, explaining the coesite + kyanite assemblage as an inadvertent synthesis, either with or without shock, is not supported by available evidence on the conditions conducive to the formation of kyanite and coesite. A far simpler explanation is that the fragment has a natural origin, and that the observed features resulted from natural processes. Nitrogen isotopes strongly support a natural origin for sample M11843.
Origin of the zonation in the fragment
In the first paper to describe the fragment in detail, Yang et al. (Reference Yang, Bai, Fang, Yan, Rong and Chen2004) suggested that the regular zonation from native Ti in the rim surrounding the alloy core through a narrow rim of a Ti–Si alloy to coesite and kyanite and oxide aggregates in the outer rim suggests that this series of minerals formed by a reaction between α-Ti and silicates under high pressures and temperatures. This reaction possibly occurred during the upwelling of a plume that carried the zoned fragment containing the Ti-Fe alloys and other minerals from the deep mantle. Subsequent papers on the outermost zone of the fragment reported further indication of ultrahigh pressures such as TiO2 II and coesite originating as pseudomorphs of stishovite. High contents of SiO2 and Al2O3 and presence of B in the bulk composition inferred for the outermost zone provided evidence for a crustal precursor. A mantle signature in nitrogen isotopes in ‘osbornite’ and a crustal origin of the outermost zone (Yang et al., Reference Yang, Dobrzhinetskaya, Bai, Fang, Robinson, Zhang and Green2007; Dobrzhinetskaya et al., Reference Dobrzhinetskaya, Wirth, Yang, Hutcheon, Weber and Green2009, Reference Dobrzhinetskaya, Wirth, Yang, Green, Hutcheon, Weber and Grew2014) constituted the main rationale for Dobrzhinetskaya et al. (Reference Dobrzhinetskaya, Wirth, Yang, Green, Hutcheon, Weber and Grew2014) to conclude that the outermost rim is a hybrid consisting of crustal material ‘contaminated’ by incorporation of mantle components.
Up until now, research on the fragment has focused on the outer rim and detailed characterisation of its constituents, with much less attention given to the alloy core with its ‘patchwork-quilt’ appearance and to the inner rim of α-Ti. Insight into the origin of the alloy core came from a surprising source: the metallurgical literature on alloys in the Ti–Fe–O ternary system. Ence and Margolin (Reference Ence and Margolin1956 in their figure 4) reported an ‘as cast’ alloy containing 32.6 atomic% Fe, 6.1 atomic% O and 61.3 atomic% Ti (alloy no. 8) having complex microtextures remarkably like the alloy core in sample M11843 (Fig. 12). The microstructure of the ‘as cast’ alloy shows a γ phase, an ε phase formed peritectically, primary TiFe and a eutectic of β-titanium + TiFe. After annealing at 1000°C, these phases were replaced by TiFe in a matrix of the ε phase, an assemblage Ence and Margolin (Reference Ence and Margolin1956) interpreted to be equilibrium.
Comparison of the alloy core with an ‘as cast’ alloy synthesised by Ence and Margolin (Reference Ence and Margolin1956). (a) Back-scattered electron image of the alloy core, sample M11843. (b) Metallographic image of alloy no. 8 ‘as cast’ copied from figure 4 in Ence and Margolin (Reference Ence and Margolin1956). Medium grey colour A is the γ phase, equivalent to maurogemmiite (Mmi). Light grey colour B is the ε phase, equivalent to paulrobinsonite (Prbs). The lightest colour C is primary TiFe. Black colour with speckling is a eutectic of β-Ti + TiFe. Magnification was given by Ence and Margolin (Reference Ence and Margolin1956) as ×350 followed by a 35% reduction for reproduction. Given a journal page size of 24 × 30 cm, the diameter of the metallographic image was calculated by Martin Yates to be 225.5 µm. This value was used to estimate the length of the scale bar for the metallographic image. The image (b), figure 4 in Ence and Margolin (Reference Ence and Margolin1956), is reproduced with permission of The Minerals, Metals & Materials Society.

Similarities in microtextures between the ‘as cast’ alloy and the alloy core in sample M11843 suggest that the ε phase is the synthetic analogue of paulrobinsonite, an identification supported by its composition, Ti2FeOx, and by powder X-ray diffraction data, which gave a ≈ 11.27 Å and (422), (333), (511) and (440) as the most intense reflections (Ence and Margolin, Reference Ence and Margolin1956). With an estimated composition of Ti6Fe2O, the Ence and Margolin (Reference Ence and Margolin1956) γ phase is most likely to be the synthetic analogue of maurogemmiite, but their powder X-ray diffraction data are much less diagnostic as only three of the most intense reflections of maurogemmiite, namely (301), (212) and (203), appear to be present.
Ence and Margolin (Reference Ence and Margolin1956) distinguished two textural types for TiFe in the ‘as cast’ alloy: (1) relatively coarse primary TiFe grains such as the light-grey grain labelled ‘C’ in Fig. 12b and (2), a eutectic of TiFe + β-Ti, which constitutes a nearly featureless black matrix to the grains of A (γ), B (ε) and C (primary TiFe). In contrast, as far as we can tell, M11843 contains only one textural variety of TiFe (wangxibinite), namely a eutectic with ‘osbornite’. We have not found a primary TiFe analogous to the primary TiFe that was reported by Ence and Margolin (Reference Ence and Margolin1956). The absence of primary TiFe most likely reflects a difference in the bulk composition because the symplectite interpreted as eutectic in M11843 comprises ‘osbornite’, Ti(N,C) containing mostly N, but with little, if any, Fe. The presence of nitrogen could have affected the path of solidification of the alloy core so that it differed significantly from the path taken by alloy no. 8 although the resulting microtextures are similar. Based on the limited experimental data available, Raghavan (Reference Raghavan1989) proposed a liquidus surface for the ternary system Fe–Ti–O that in principle could be used to estimate a solidification path of the composition of alloy no. 8 for comparison with sample M11843. But the data available to Raghavan (Reference Raghavan1989) were too few for such an application, and Raghavan (Reference Raghavan1989) did not consider Ence’s and Margolin’s γ phase. Consequently, we have not attempted to apply Raghavan’s proposed liquidus projection to sample M11843.
A scenario for M11843 consistent with available information is that the rim of α-Ti surrounding the alloy core crystallised from a Ti-rich liquid. This liquid then reacted with solid α-Ti to precipitate maurogemmiite in a peritectic reaction, a step suggested by cores of α-Ti in maurogemmiite. Subsequently, maurogemmiite reacted with liquid to precipitate paulrobinsonite in a peritectic reaction, a step suggested by grains of maurogemmiite being overgrown and embayed by paulrobinsonite. Finally, wangxibinite and ‘osbornite’ precipitated in a eutectic transformation as suggested by their being intergrown in a vermicular symplectite. This precipitation was accompanied by crystallisation of a few grains of α-Ti.
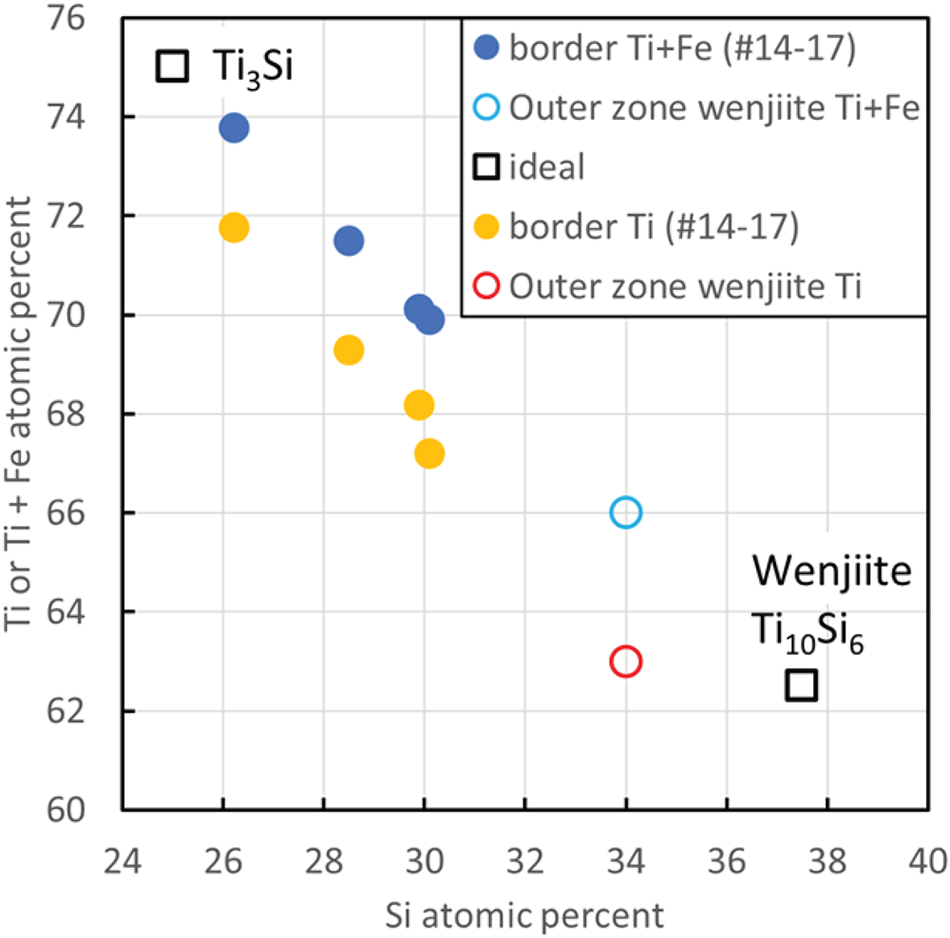
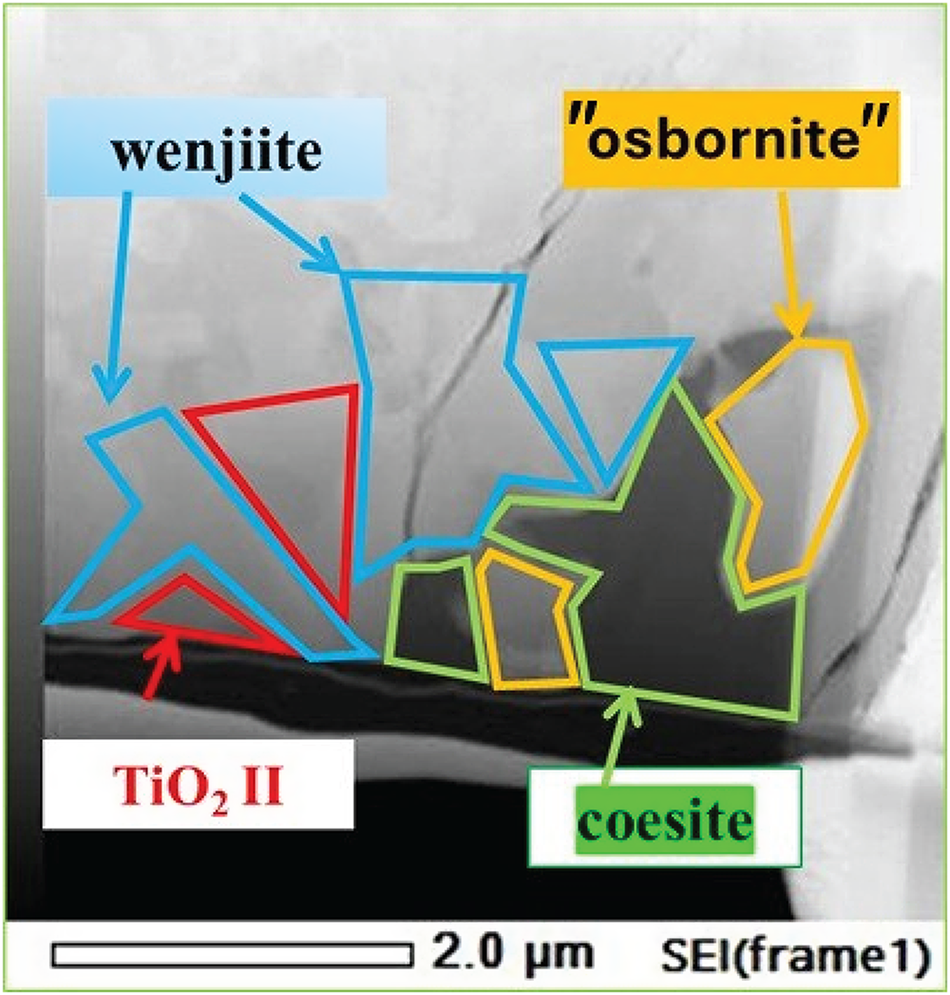
What this solidification path does not explain is the relationship between the inner rim of α-Ti and the outer rim of coesite, kyanite and amorphous Al–Ti silicate. The answer may be the narrow band of Ti–Si material separating α-Ti from the outer rim (Fig. 13); we interpret this material to be wenjiite. Analyses of the narrow band gave a range of Si/Ti values lower than the Si/Ti ratio of ideal wenjiite, Ti10Si6, (Fig. 14). We attribute this deviation to the electron beam variably striking the adjacent Ti because of the narrowness of the wenjiite band. Wenjiite associated with coesite, ‘osbornite’ and rutile II in the outer rim (Fig. 15) was also identified from the cell parameters and space group determination obtained from electron diffraction data; EDS data gave a Si/Ti ratio closer to the ideal value (Fig. 14). Although the Ti–Si phase bordering the inner rim could conceivably be Ti3Si, the synthesis of which was first reported by Roßteutscher and Schubert (Reference Roßteutscher and Schubert1965), the presence of wenjiite in the outer rim lends credence to identification of the Ti–Si phase in the band adjacent to the inner rim of α-Ti as wenjiite.
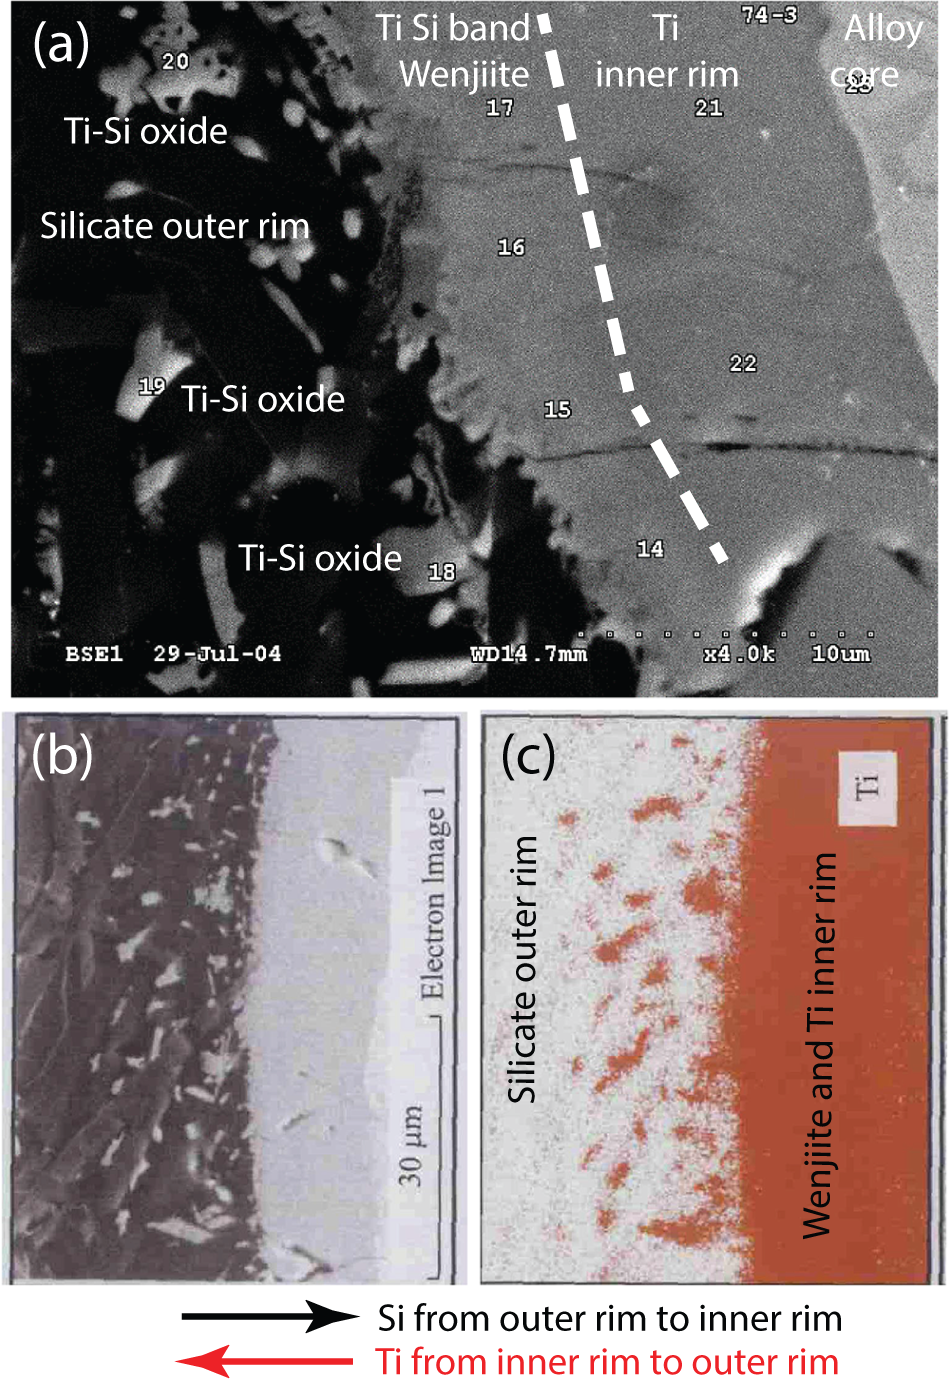
(a) Back-scattered electron image of contact between inner rim of α-titanium bordered by wenjiite and the outer rim of oxides and silicates. Analytical points #14-#17 are wenjiite plotted in Fig. 14. The bright grains in the outer rim are Ti–Si oxides (analytical points #18–#20). Analyses #21–#22 pertain to α-titanium. (b) Electron image of the contact. (c) EDS Ti map of the contact. The images in (b) and (c) are modified from figure 3 in Yang et al. (Reference Yang, Bai, Fang, Yan, Rong and Chen2004); they have been rotated 90° so that the contact between the rims is nearly parallel in all three parts of the figure. Arrows indicate the movement of Si and Ti atoms when the rims were in physical contact.

Composition of wenjiite in sample M11843, plotted considering Si against either Ti or Ti+Fe. Border refers to a narrow Ti–Si rim on the rim of α-titanium shown in Fig. 13(a). Outer zone wenjiite is shown in Fig. 15.

Secondary electron image of the wenjiite + coesite + TiO2 II + ‘osbornite’ assemblage from the outer rim.

As suggested by Yang et al. (Reference Yang, Bai, Fang, Yan, Rong and Chen2004), the wenjiite band could be related to influx of Si from the outer rim into the inner α-titanium rim (arrows in Fig. 13). Conversely, the small grains of Ti–Si oxides in the silicate outer rim adjacent to the band of wenjiite could have formed from Ti that moved out from the α-titanium rim into the adjacent kyanite–coesite-bearing outer rim where it combined with O and Si in the outer rim to form Si–Ti oxides. Yang et al. (Reference Yang, Bai, Fang, Yan, Rong and Chen2004) attributed the movement of Ti and Si to a reaction at high pressure and temperature between native Ti in the alloy core and the silicates in the outer rim.
The Ti–Si–O system
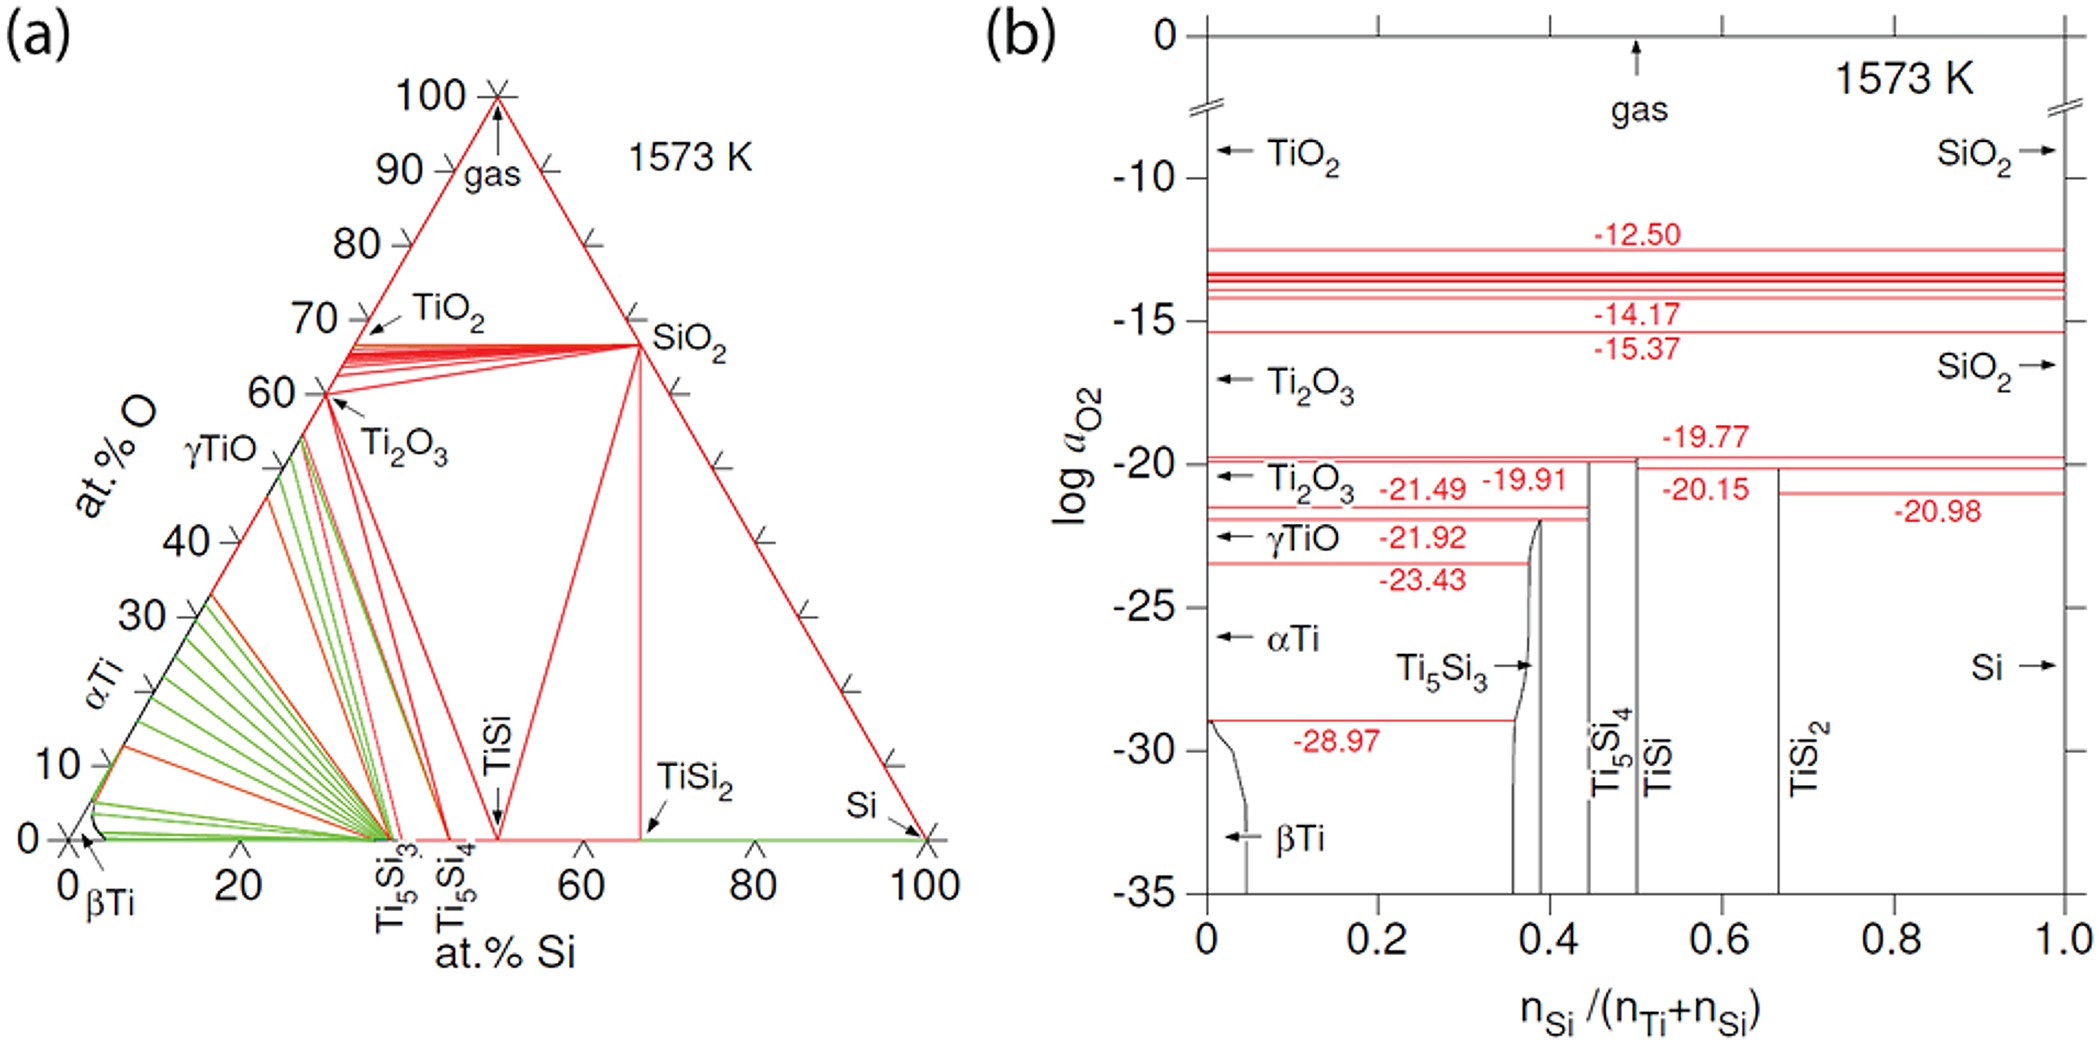
For thermodynamic calculations in the Ti–Si–O system at 1573 K, 1 bar, two datasets were combined, namely the commercial Thermocalc database for oxides (TCOX10, https://thermocalc.com) and the Ti-Si dataset from Seifert et al. (Reference Seifert, Lukas and Petzow1996). Figure 16a shows that the tie lines joining γTiO and Ti2O3 with Ti5Si3 (wenjiite), Ti5Si4 and TiSi are stable, whereas tie lines joining α-Ti and SiO2 are not. Barring a major impact on phase relationships due to high pressures, the configuration implies that α-Ti and SiO2 would react if they were brought into contact. On the one hand, γTiO, Ti5Si4 and TiSi are absent in the natural assemblage, which complicates direct application of the calculated diagram to sample M11843. On the other hand, the dataset does not consider incorporation of interstitial oxygen in the Ti silicides, particularly Ti5Si3, in which substantial amounts of interstitial oxygen have been reported (Williams et al., Reference Williams, Kramer, Akinc and Malik2000; Thom et al., Reference Thom, Young and Akinc2000). For example, Goldstein et al. (Reference Goldstein, Choi, Van Loo, Bastin and Metselaar1995) reported that their sample A1 synthesised at 1100°C had the composition in at.%: Ti 57.7, Si 32.3, O 10.0. Their phase diagram with interstitial O in Ti5Si3 at 1100°C shows the joins TiO–Ti5Si3 and Ti2O3–Ti5Si3 as stable, thereby blocking the assemblage SiO2–α-Ti, that is, SiO2 would react with α-Ti to form Ti5Si3 + Ti2O3, an assemblage much closer to that in M11843 formed at 1300°C, TiO2 + Ti5Si3. In summary, phase relationships in the alloy core and inner rim, including the band of wenjiite along the contact between the inner and outer rims, seem consistent with the incompatibility of SiO2 with Ti.
(a) Calculated phase diagram for the system Ti–Si–O at 1573 K, 1 bar. The green lines represent tie lines in two-phase equilibria, whereas the red lines correspond to three-phase equilibria. Ti5Si3 (wenjiite) can incorporate a significant amount of interstitial oxygen, which is not considered in this diagram. (b) Oxygen fugacities in the equilibria of the system Ti–Si–O shown in part (a). The stability range of Ti5Si3 (wenjiite) can be increased by interstitial oxygen towards higher oxygen fugacities, possibly up to equilibria with Ti2O3 and SiO2, that is, be above log a O2 = ‒19.7.

The choice of temperature is based on the estimated peak conditions for the fragment (1300°C, e.g. Dobrzhinetskaya et al., Reference Dobrzhinetskaya, Wirth, Yang, Green, Hutcheon, Weber and Grew2014), whereas atmospheric pressure was assumed as there are no data for higher pressures. Tridymite would be the SiO2 phase, according to the TCOX10 database (at 1573 K, 1 bar). However, as tridymite is stabilised by impurities, the stable form of chemically pure SiO2 would be beta-cristobalite under these conditions.
Values for oxygen fugacity corresponding to the equilibria in Fig. 16a are shown in Fig. 16b. The Ti5Si3 phase (wenjiite) is calculated to stable only at log a O2 < ‒21.9 for P = 0.1 MPa and T = 1300°C, that is, only under very strongly reducing conditions (cf. ‒10.7 for Fe/wüstite under these conditions). However, stabilisation of the Ti5Si3 phase by interstitial oxygen should also be considered because it would extend the range of Ti5Si3 stability to higher oxygen activities. For example, if interstitial oxygen leads to extension of the stabilisation of the assemblage Ti2O3–SiO2–Ti5Si3 at 1300°C similar to its stabilisation at 1100°C as reported by Goldstein et al. (Reference Goldstein, Choi, Van Loo, Bastin and Metselaar1995), then the oxygen activity here could be above log a O2 = ‒19.7.
Implications
Given that mineral assemblages supposedly incompatible with one another are juxtaposed in the fragment, we suggest that the coesite–kyanite outer rim and the α-titanium inner rim and alloy core were only brought in contact relatively late in their respective histories. The time spent in juxtaposition allowed only limited exchange of Si and Ti. In contrast, nitrogen isotopes in ‘osbornite’ from the outer rim have a mantle signature although the assemblage of silicate minerals is characteristic of sedimentary rocks metamorphosed at ultrahigh pressures (Dobrzhinetskaya et al., Reference Dobrzhinetskaya, Wirth, Yang, Hutcheon, Weber and Green2009, Reference Dobrzhinetskaya, Wirth, Yang, Green, Hutcheon, Weber and Grew2014). If we assume that nitrogen originated in the alloy core, where ‘osbornite’ also occurs, then the period of juxtaposition was sufficient for a more substantial exchange of nitrogen than of Si and Ti. In other words, the silicate outer rim and the alloy core and inner rim have crustal and mantle origins, respectively, and had distinct histories prior to being joined. This interpretation more precisely defines the ‘mixed parentage’ that Dobrzhinetskaya et al. (Reference Dobrzhinetskaya, Wirth, Yang, Green, Hutcheon, Weber and Grew2014) attributed to qingsongite, cubic BN, in the outer rim, in which B is most likely to be of crustal origin and N is most likely to be of mantle origin with the mantle source being the alloy core and inner rim of the fragment itself. Figure 16b also shows that assemblages with α-Ti are more reduced than assemblages with SiO2, log a O2 = ‒23.4 versus ‒21.0, respectively, suggesting that the crustal fragment might have experienced reduction after its encountering the highly reduced mantle precursor to the alloy core. The fragment in sample M11843 could thus be an example of the interaction between crustal material and the mantle.
Supplementary material
The supplementary material for this article can be found at https://doi.org/10.1180/mgm.2025.10169.
Acknowledgements
We thank members of the IMA CNMNC for their comments on the new mineral proposals for maurogemmiite and paulrobinsonite and we are grateful to Guest Editor Robert F. Martin and the three reviewers for their insightful and detailed comments on the manuscript. We also thank Martin Yates for his assistance in preparing the figures, particularly in calculating the scale bar in Fig. 12(b). The authors thank the Center for Instrument Sharing of the University of Pisa (CISUP) for the access to the HR-TEM facility.
Funding statement
This research was co-supported by the National Natural Science Foundation of China (NSFC; Project Nos. U2344202, 42172069, 42272048), the National Key R&D Program of China (No. 2023YFF0804401), the Central Government Guided Local Scientific and Technological Development Funding Project (No. XZ202401YD0006) and the China Geological Survey (CGS; Project Nos. DD20240075, DD20243516, DD20242124, DD20221630).
Competing interests
The authors declare that none of them have a known competing financial interest or personal relationship that could have appeared to influence the work reported in this paper.


 Open access