


Significant outcomes
-
Juvenile FSL rats (irrespective of sex) may be a useful model to further investigate adolescent depression constructs.
-
MSEW is effective in inducing depressogenic bio-behavioural effects.
-
The bio-behavioural response of FRL offspring to MSEW was more significant.
Limitations
-
No neurochemical analyses were performed on PND21, limiting the understanding of the observed behaviour at this age.
-
Secondly, the current study did not measure any HPA-related markers, such as corticosterone, and therefore it remains unclear if the observed differences between the FSL and FRL rats are indeed related to two different stress responses.
-
Finally, because of the link between cardiovascular disease and depression, prospective studies should also consider measuring blood pressure or heart rate variability in the Flinders line rats to build on the anatomical differences observed and reported here.
Introduction
Childhood is a developmental period characterised by extensive neuroplasticity that renders the developing brain vulnerable to environmental insults and experiences (Heim et al., Reference Heim, Shugart, Craighead and Nemeroff2010). Such a disruption may contribute to the aetiology of various psychiatric disorders, including major depressive disorder (Andersen & Teicher, Reference Andersen and Teicher2008; Marco et al., Reference Marco, Macrì and Laviola2011), which is one of the most commonly diagnosed mental disorders in school-aged children (Centers for disease control and prevention, 2020). In fact, it is the fourth leading cause of global illness and disability amongst adolescents (15-19 years) and the fifteenth in those younger than 14 years of age (World Health Organization, 2022). Although mental health statistics in the South African paediatric population is limited, an estimated 13–21% of adolescents (14–26 years) experience depressive symptoms (Nduna et al., Reference Nduna, Jewkes, Dunkle, Jama Shai and Colman2013; Barhafumwa et al., Reference Barhafumwa, Dietrich, Closson, Samji, Cescon, Nkala and Gray2016). In the USA, almost two million children (3-17 years) have been diagnosed with depression (Centers for disease control and prevention, 2020; Ghandour et al., Reference Ghandour, Sherman, Vladutiu, Ali, Lynch, Bitsko and Blumberg2019), of which 17% of children (2–8 years), 5% of 12-year-olds and 17% of 17-year-olds have at least experienced a major depressive episode in the year before (Centers for disease control and prevention, 2020; Cree et al., Reference Cree, Bitsko, Robinson, Holbrook, Danielson, Smith and Peacock2018; Selph & McDonagh, Reference Selph and McDonagh2019). In 2016, 62 000 adolescents died because of self-harm (World Health Organization, 2022), making it the third leading global cause of death in this age group (World Health Organization, 2022).
Early-life adversity (ELA) refers to traumatic experiences, such as loss of a parent, abuse or neglect that can cause detrimental long-term effects. In this regard, a survey of 21 countries found that childhood adversities (i.e. neglect, abuse and parental mental illness) were accountable for 29.8% of debilitating juvenile disorders, including but not limited to mood, anxiety, behavioural and substance disorders (Kessler et al., Reference Kessler, McLaughlin, Green, Gruber, Sampson, Zaslavsky and Angermeyer2010), making early-life adversities one of the strongest contributing factors (LeMoult et al., Reference LeMoult, Humphreys, Tracy, Hoffmeister, Ip and Gotlib2020) and important antecedent to depression (Dube et al., Reference Dube, Anda, Felitti, Chapman, Williamson and Giles2001; Heim & Nemeroff, Reference Heim and Nemeroff2001; Vibhakar et al., Reference Vibhakar, Allen, Gee and Meiser-Stedman2019). Adding to this, being born into a family with a history of depression can increase a child’s risk of developing depression (Fihrer et al., Reference Fihrer, McMahon and Taylor2009; Thompson et al., Reference Thompson, Jiang, Hammen and Whaley2018; Tirumalaraju et al., Reference Tirumalaraju, Suchting, Evans, Goetzl, Refuerzo, Neumann and Cowen2020). In addition, perinatal and postnatal depression increases the offspring’s risk of developing depression later in life by as much as 70% (Tirumalaraju et al., Reference Tirumalaraju, Suchting, Evans, Goetzl, Refuerzo, Neumann and Cowen2020). Although the exact mechanism for this increase remains unclear, persistent maternal depression could lead to neglected parental engagement and an impaired ability to meet the child’s social and developmental needs (Dietz et al., Reference Dietz, Birmaher, Williamson, Silk, Dahl, Axelson and Ryan2008). Pathways that have been implicated in the bio-behavioural alterations associated with ELA include the redox, bio-energetic (i.e. mitochondrial function) (de Souza et al., Reference de Souza, da Silva, Costa, de Matos, de Farias Campina, do Amaral Almeida and de Souza2020), serotonergic (Lee et al., Reference Lee, Kim, Kim, Ryu, Kim, Kang and Jahng2007; de Souza et al., Reference de Souza, da Silva, Costa, de Matos, de Farias Campina, do Amaral Almeida and de Souza2020) and inflammatory (Wang et al., Reference Wang, Dong, Wang, Liu, Sun, Li and Li2017) pathways. Maternal separation is therefore a useful intervention, often used in animal studies to model maternal neglect (de Kloet et al., Reference de Kloet, Sibug, Helmerhorst and Schmidt2005) and investigate the neurodevelopmental aspects of neuropsychiatric conditions (Tractenberg et al., Reference Tractenberg, Levandowski, de Azeredo, Orso, Roithmann, Hoffmann and Grassi-Oliveira2016; Alves et al., Reference Alves, Portugal, Summavielle, Barbosa and Magalhães2020).
The Flinders sensitive line (FSL) rat is an accepted animal model of depression (Overstreet & Wegener, Reference Overstreet and Wegener2013), sensitive to the lasting effects of maternal separation (El Khoury et al., Reference El Khoury, Gruber, Mørk and Mathé2006; Wörtwein et al., Reference Wörtwein, Husum, Andersson, Bolwig and Mathé2006; Ellenbroek et al., Reference Ellenbroek, Angelucci, Husum and Mathé2016) and social isolation (Mncube et al., Reference Mncube, Möller and Harvey2021). Importantly, the effects of ELA or neglect are generally limited to long-lasting effects (i.e. into adulthood). For instance, male adult FSL rats, maternally separated for 3 h per day between postnatal day 02 (PND02) and 14, display increased depressive-like behaviour (El Khoury et al., Reference El Khoury, Gruber, Mørk and Mathé2006), altered inflammatory markers (Carboni et al., Reference Carboni, Becchi, Piubelli, Mallei, Giambelli, Razzoli and Domenici2010) and levels of neuropeptides associated with depression (Wörtwein et al., Reference Wörtwein, Husum, Andersson, Bolwig and Mathé2006; Ellenbroek et al., Reference Ellenbroek, Angelucci, Husum and Mathé2016). Expanding on the maternal separation model, George et al. (Reference George, Bordner, Elwafi and Simen2010) developed an early-life neglect model, adding early weaning to the maternal separation protocol to exacerbate the lasting effects. Early weaning has been shown to alter hippocampal glucocorticoid receptor levels (Kikusui et al., Reference Kikusui, Nakamura, Kakuma and Mori2006) and induce anxiogenic and aggressive behaviour (Kikusui et al., Reference Kikusui, Takeuchi and Mori2004). Based on the findings of George et al. (Reference George, Bordner, Elwafi and Simen2010), maternal separation and early weaning (MSEW) induced long-lasting behavioural changes akin to anxiety, despair and hyperactivity, without adversely impacting metabolic functions. In addition to the lack of short-term (i.e. pubertal) bio-behavioural data of maternal separation in the Flinders line rats, this MSEW protocol has to the best of our knowledge not been investigated in the offspring of this specific strain. Therefore, considering that the FSL rat is accepted to also accurately model childhood depression (Malkesman & Weller, Reference Malkesman and Weller2009), specifically genetically predisposed individuals, and that information regarding the short-term (i.e. pubertal) effects of ELA is limited, research into this topic is warranted. We therefore hypothesised that ELA (i.e. MSEW) would induce depressive-like behaviour in the Flinders resistant line (FRL) rat, while exacerbating the depressive-like phenotype of the FSL rat. Finally, we further expect these behavioural alterations to be supported by decreased hippocampal monoamine levels and mitochondrial function and increased markers of oxidative stress.
Materials and methods
Study design
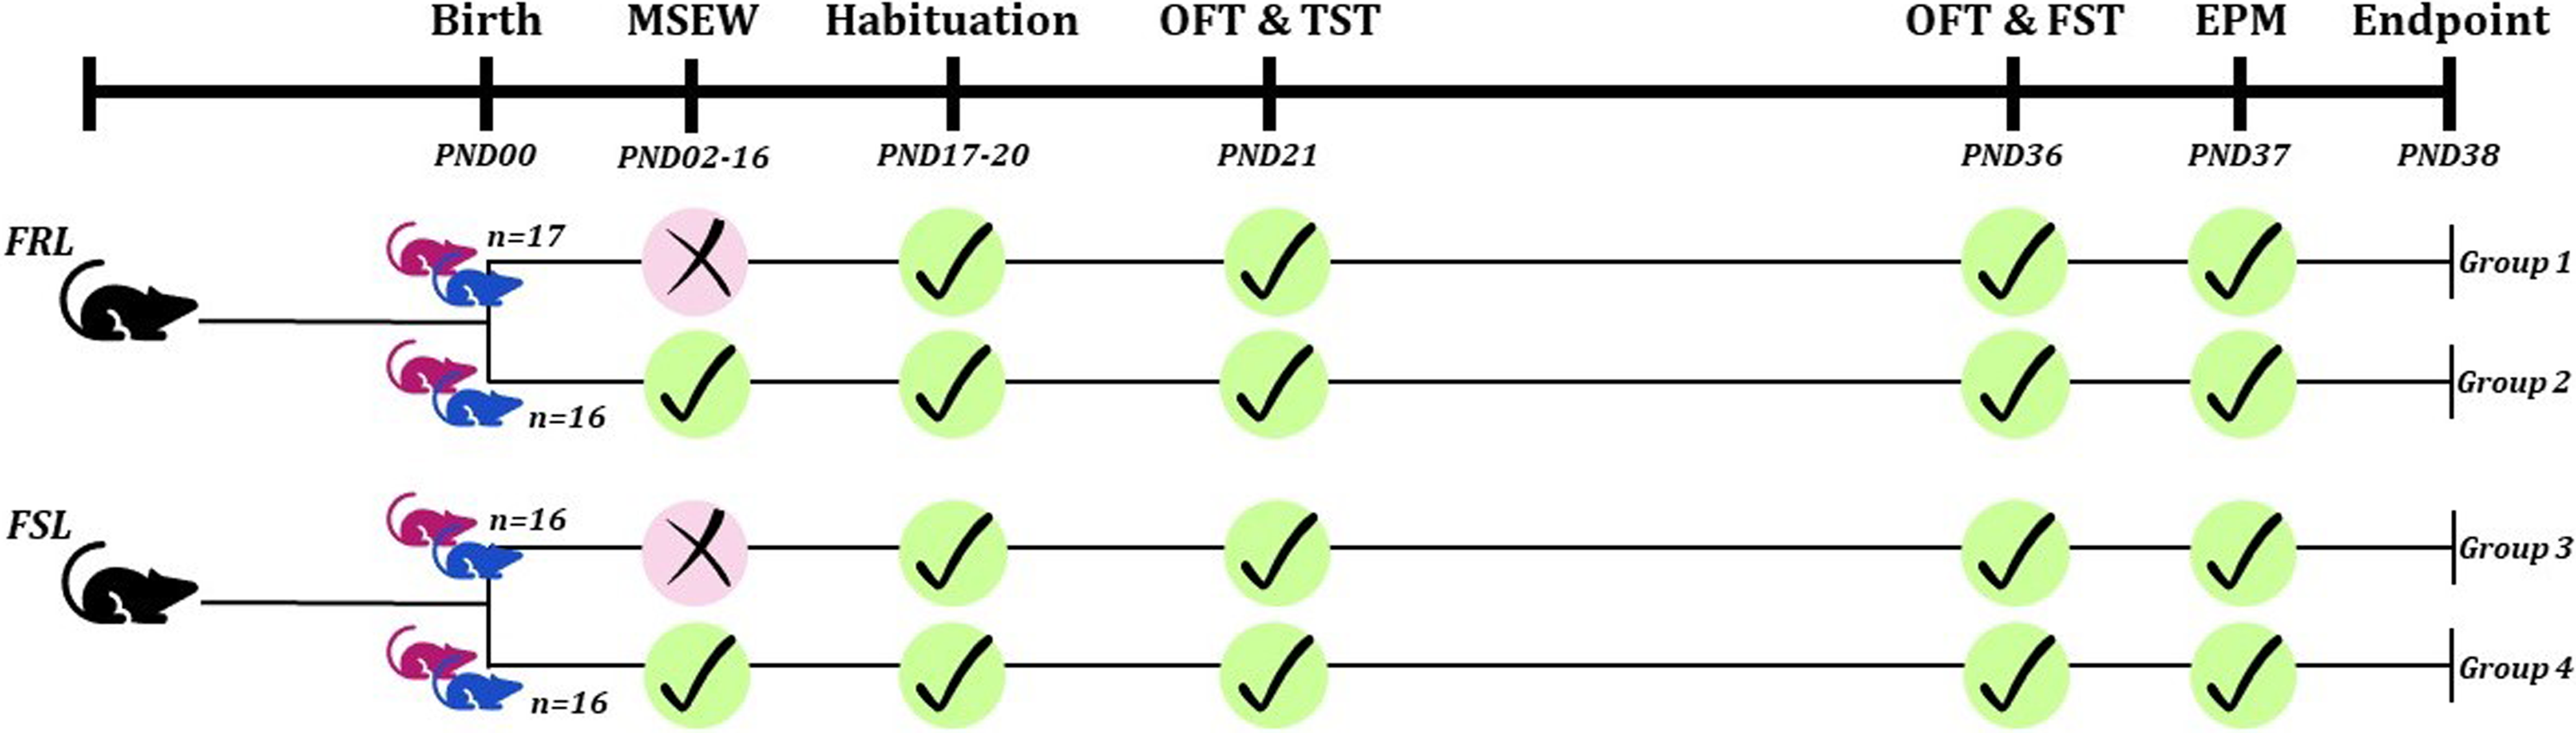
As summarised in Fig. 1, male and female FSL (n = 32) and FRL (n = 33) offspring were randomly and equally divided into the different intervention groups. Those undergoing MSEW were separated from the dam for 3 h every day from PND02 and weaned on PND17, instead of PND21, when the pups from the non-MSEW groups were weaned (George et al., Reference George, Bordner, Elwafi and Simen2010). Early-life depressive-like behaviour was analysed on PND21 and then reassessed on PND36 and 37, whereafter animals were euthanised by decapitation, hippocampi removed, and stored at -80°C for neuro- and biochemical analyses.
Graphical representation of the study layout. Pink rat icon: female rats. Blue rat icon: male rats. EPM: elevated plus maze. FRL: Flinders resistant Line. FSL: Flinders sensitive Line. FST: forced swim test. MSEW: maternal separation with early weaning. OFT: open field test. PND: postnatal day. TST: tail suspension test.
Animals
Animals were bred, supplied and housed at the Vivarium (SAVC no. FR15/13458; AAALAC accreditation international file #1717) of the Pre-Clinical Drug Development Platform, NWU, RSA. The study consisted of four experimental groups (16 rats/group; 50:50 female: male; Fig. 1). Male and female rats were grouped together as sex differences are not expected in prepubertal animals. Still, results were visually inspected to identify any obvious sex differences. Group sizes were calculated with a predicted effect size F of 0.40 (η p 2 = 0.14), α error of 5 and 80% power. Rats were housed 3–4 rats/cage, according to sex, with corncob bedding changed weekly and the environmental temperatures maintained at 22 ± 1 °C in a relative humidity of 55 ± 10%. A 12-h light/dark cycle was followed with food and water provided ad libitum.
Maternal separation and early weaning
The MSEW model was used as described previously (George et al., Reference George, Bordner, Elwafi and Simen2010). Briefly, from PND02 to 16, pups in the MSEW groups were left in their home cages, while the dams were relocated to separate cages with ad libitum access to food and water for 3 h per day during their wake cycle. The non-MSEW animals were left undisturbed. MSEW animals were also weaned on PND17, as opposed to the standard PND21, when the non-MSEW animals were weaned.
Behavioural analyses
On PND21, animals were subjected to the open field test (OFT) and tail suspension test (TST) to determine the immediate effects of MSEW on depressive-like behaviour. To investigate the long-term effects of MSEW, animals were subjected to the OFT and forced swim test (FST) on PND36, followed by the elevated plus maze (EPM) on PND37. The sequence of the behavioural analysis, specifically in terms of performing the FST before the EPM, was done to increase the chance of observing induced anxiety-like behaviour in FSL rats (Neumann et al., Reference Neumann, Wegener, Homberg, Cohen, Slattery, Zohar and Mathé2011; Rea et al., Reference Rea, Rummel, Schmidt, Hadar, Heinz, Mathé and Winter2014; Bay-Richter et al., Reference Bay-Richter, Petersen, Liebenberg, Elfving and Wegener2019). To ensure normal initial foraging and activity of nocturnal animals, testing only commenced 1 h after the start of the dark cycle. Behavioural parameters of the OFT and EPM were analysed with automated software (Ethovision XT14; Noldus Information Technology BV, Wageningen, NLD), whereas that of the TST and FST were manually scored with a continuous timer (FST scoreboard 2.0, NWU, RSA) by a researcher blinded to the experimental groups.
Tail suspension test
The TST is used to identify antidepressant-like behaviour (Cryan, Mombereau, et al., Reference Cryan, Mombereau and Vassout2005). Although the test is best known for its use in mice, it has been successfully used in rats as well (Izumi et al., Reference Izumi, Washizuka, Hayashi-Kuwabara, Yoshinaga, Tanaka, Ikeda and Oguchi1997; Zhang et al., Reference Zhang, Jia, Zhao, Tang, Guan, Wang and Zhu2013; Shinde et al., Reference Shinde, Yegnanarayan, Shah, Gupta and Pophale2015). The test was performed during the dark cycle under red light. As before (Castagné et al., Reference Castagné, Moser, Roux and Porsolt2010; Cryan, Mombereau, et al., Reference Cryan, Mombereau and Vassout2005), on the day of testing, each rat was suspended by the tail with adhesive tape, positioned three-quarters of the distance from the base of the tail from a suspension hook for 6 min. To avoid injury, the suspension hook went through the adhesive tape as close as possible to the tail to ensure the animal hangs with its tail in a straight line (Castagné et al., Reference Castagné, Moser, Roux and Porsolt2010). The total time spent immobile was recorded and interpreted as an indication of depressive-like behaviour.
Open field test
The OFT apparatus consisted of a 1 m2 test arena, surrounded by opaque black, vertical walls. As previously described (Steyn et al., Reference Steyn, Harvey and Brink2020), each rat was placed in the centre of the arena and allowed to freely explore for 5 min under red light. Total distance moved during the session was interpreted as a measure of general activity.
Forced swim test
The FST is widely used to screen for depressive-like behaviour and antidepressant activity in rodents (Cryan et al., Reference Cryan, Markou and Lucki2002). The test was performed on PND36, as previously described in our laboratories. As the FSL rat is a validated animal model of depression that displays depressive-like behaviour (increased immobility), no pre-conditioning swim trial 24 h prior to the testing swim trial was conducted (Overstreet et al., Reference Overstreet, Friedman, Mathé and Yadid2005; Overstreet & Wegener, Reference Overstreet and Wegener2013). During the dark cycle, under white light, animals were placed in an inescapable Perspex® cylinder [60 cm (h) × 24 cm (ø)], filled with 30 cm of water at a temperature of 25 ± 1°C for 6 min. During this time, behaviour was recorded by a camera mounted in front of the cylinders. The first minute of the test was discarded because animals generally engage in rapid bouts of active behaviour, during the first minute (Cryan, Mombereau, et al., Reference Cryan, Mombereau and Vassout2005). Behavioural analyses included immobility (floating with no active movements made, except those necessary to keep the rat’s head above water), swimming (horizontal movements throughout the cylinder that included crossing into another quadrant) and struggling (upward-directed movements of the forepaws along the inside of the swim cylinder) (Cryan et al., Reference Cryan, Markou and Lucki2002; Cryan, Valentino, et al., Reference Cryan, Valentino and Lucki2005). Increased immobility was considered an indication of learned helplessness or despair (depressive-like behaviour).
Elevated plus maze
The EPM is used to measure anxiety-like behaviour in rodents. The plus-shaped platform of the maze consisted of two closed [50 cm (l) × 20 cm (w) × 10 cm (h)] and two open arms [50 cm (l) × 20 cm (w) × 10 cm (h)], with a 1-cm transparent plexiglas border around the latter, to prevent animals from falling (Regenass et al., Reference Regenass, Möller and Harvey2018). The maze, constructed from black Perspex, is elevated 50 cm from the floor. On the day of testing, each rat was placed in the centre zone of the maze, facing the open arm opposite the investigator, and allowed to freely explore for 5 min under red light. Increased time spent in the closed arms was interpreted as anxiety-like behaviour. Entrance into an arm was deemed when the centre point, as defined by the automated scoring program, entered the arm zone.
Bio-analyses
Tissue collection and storage
On PND38, animals were euthanised by decapitation, whereafter brain and heart samples were harvested and weighed. Following the decapitation, right and left hippocampi were dissected on an ice-cooled dissection slab and stored separately. The right hippocampi were used for neurochemical analysis via LC–MS and snap-frozen in liquid nitrogen and stored at −80°C until the day of analysis and were analysed according to the methods described below. The left hippocampi were removed and immediately placed into an isolation buffer (mannitol 200 mM, sucrose 50 mM, potassium phosphate 5 mM, EGTA 1 mM, 3-(N-morpholino)propanesulfonic acid 5 mM and bovine serum albumin 0.10% pH 7.2) (Kim et al., Reference Kim, McGee, Czeczor, Walker, Kale, Kouzani and Tye2016), whereafter it was stored at −80°C until metabolic profiling was performed.
Quantitative analyses of hippocampal monoamines, GSH and GSSG
Each brain tissue sample was individually weighed prior to analyses. Hereafter, 250 µL of the internal standard solution was added to brain sample. The mixtures were homogenised by sonication (twice for 12 s, at an amplitude of 14 µ; MSE ultrasonic disintegrator, Nuaillé, FRA) and left on ice for 20 min to complete protein precipitation and centrifuged at 20 817 rcf for 20 min at 4 °C. The supernatant was transferred to a High-Performance Liquid Chromatography (HPLC) sample vail. The analytical HPLC column used was a Venusil ASB C18 (purchased from Agela Technologies, Torrance, CA, USA), 2.1 × 150 mm, a particle size 3 µm. Ultivo Triple Quadrupole LC/MS System is controlled by the MassHunter software from Agilent Technologies©, Inc. (Santa Clara, CA 95051 US). A gradient mobile phase consisting of 0.1% formic acid/HPLC grade water and 0.1% formic acid/methanol were prepared. Serotonin turnover was expressed as the ratio between the metabolite, 5-hydroxindoleacetic acid (5-HIAA) and serotonin (5-HT) levels, while the redox state was calculated as glutathione (GSH) over glutathione disulphide (GSSG).
Metabolic profiling
Untargeted gas chromatography time-of-flight mass spectrometry (GC-TOF-MS) was performed as previously described (Lindeque et al., Reference Lindeque, Hidalgo, Louw and van der Westhuizen2013; Terburgh et al., Reference Terburgh, Lindeque, Mason, Van der Westhuizen and Louw2019) on the left hippocampi of FSL rats. Of note, the storage buffer was used for the intended mitochondrial respiration assay, yet due to logistical reasons could not be performed and therefore influenced the metabolic results (i.e. reduced n-values).
A stepwise Bligh-Dyer extraction method (Wu et al., Reference Wu, Southam, Hines and Viant2008) was performed resulting in biphasic separation. Briefly, 400 µl of methanol, 75 µl of water and 50 µl of internal standard (50 ppm 3-phenylbutyric acid) were added to each hippocampus in safe-lock microcentrifuge tubes, together with a single steel bead (3 mm Ø). Thereafter, the brain tissue was homogenised for 2 min at 20 Hz using the Retch M400 vibration mill. Following the homogenisation of each tissue sample, 400 µl chloroform together with an additional 200 µl water was added to each sample and vortexed for 30 s. The samples were then centrifuged at 2000 × g for 5 min at 4°C to induce phase separation. Four hundred microlitre of the top polar phase and 300 µl of the bottom apolar phase of were transferred to glass vials and dried under nitrogen. The samples were stored at −80°C until derivatisation. In addition to this, quality control samples were also prepared from pooled aliquots of all sample extracts.
Prior to their analysis via GC-TOF-MS, all samples were derivatised via oximation and silylation as previously performed (Lindeque et al., Reference Lindeque, Hidalgo, Louw and van der Westhuizen2013; Terburgh et al., Reference Terburgh, Lindeque, Mason, Van der Westhuizen and Louw2019). For oximation, 50 µl of methoxyamine solution (200 mg methoxyamine dissolved in 10 ml of pyridine) was added to each glass vial containing the dried sample extract. Thereafter, each sample was vortexed for 30 s to dissolve the dried extract and incubated for 1 h at 60°C. After allowing the samples to cool to room temperature, silylation was performed by adding 50 µl of O-bis(trimethylsilyl)-trifluoro-acetamide, containing 1% trimethylchlorosilane to the oximated samples and vortexed for 30 s. The samples were then incubated for 40 min at 40°C. All liquids from each sample were individually transferred into a flat bottom insert and placed inside the same vial that was used for derivatisation. Each vial was then loaded onto an Agilent 7693 auto sampler for GC-TOF-MS analysis.
GC-TOF-MS analysis
The GC-TOF-MS system used comprises of an Agilent 7890A series gas chromatograph with Agilent 7693 auto sampler coupled to a LECO Pegasus HT time-of-flight mass analyser with an electron impact ionisation source. One microlitre of each sample was injected (using a 1:10 split ratio) into the front inlet which remained at a constant temperature of 250°C. Helium was used as the carrier gas at constant flow of 1.4 ml/min. Metabolites were separate in a Restek RXi-1MS column (30 m × 0.18 mm × 0.18 µm) using the following oven temperature gradient: the oven remained at 50°C for 1 min after injection and then increased 5°C/min until it reached 100°C. The temperature ramp then increased to 10°C/min until 160°C, where after the temperature increased further until 230°C at a rate of 13°C/min. During the final phase, the oven temperature increased 20°C/min until it reached 300°C, where it remained for 2 min before cooling for the next run. The transfer line and ion source temperature were kept constant at 225 and 200°C, respectively. The data were obtained at an acquisition rate of 20 spectra/s (50–800 m/z).
For data acquisition and extraction, the LECO Corporation ChromaTOF® software (version 4.5x) was utilised. Microsoft Office Excel was used for the pre-processing of the data. The NIST MS search program (version 0.2) using AMDIS (National Institute of Standards and Technology) was used to compare measured spectra to the NIST 11 mass spectral library to identify all the detected components and validate relevant metabolites. The sample sizes (indicated in Table 3) differ from that of the other analyses and may be due to the storage buffer used.
Statistical analyses
The Grubb’s test (α = 0.05) was performed to identify outliers with group sizes described in figure legends. Normality of distribution and homogeneity of variances were determined via the Shapiro–Whilk and Levene’s tests, respectively, and only reported where these assumptions were violated. Two-way ANOVAs (analysis of variances) and ANCOVAs (analysis of covariances) were used for analyses, with the latter correcting for locomotor activity. Groupwise comparisons are reported as Bonferroni-adjusted values (p < 0.05 accepted as significant). Partial eta squared (η p 2) and the unbiased Cohen’s d (d unb ) values (Cumming, Reference Cumming2014) were used to calculate effect magnitude, with large effect sizes defined as η p 2 ≥ 0.14 (Ellis, Reference Ellis2010) and d ≥ 0.8 (Sullivan & Feinn, Reference Sullivan and Feinn2012).
GC-MS data were pre-processed as before (Lindeque et al., Reference Lindeque, Hidalgo, Louw and van der Westhuizen2013) and normalised using the MSTUS normalisation method (Warrack et al., Reference Warrack, Hnatyshyn, Ott, Reily, Sanders, Zhang and Drexler2009). The data were log-transformed prior to ANOVA analyses, to ensure normal distribution of all variables. Statistical analysis was performed in MetaboAnalyst (version 5; www.metaboanalyst.ca).
All other statistical analyses were performed in IBM® SPSS® Statistics (version 28), assisted by Laerd Statistics® (https://statisticslaerd.com) and the NWU statistical consultation services. Effect magnitude indicators were calculated in Exploratory Software for Confidence Intervals (Cumming, Reference Cumming2014). All graphical representations were created in GraphPad Prism® (version 9), with the initial power analysis performed in G*Power (version 3; Universität Kiel, GER).
Results
Immediate effects of ELA
Body weight, distance moved in the OFT and immobility in the TST
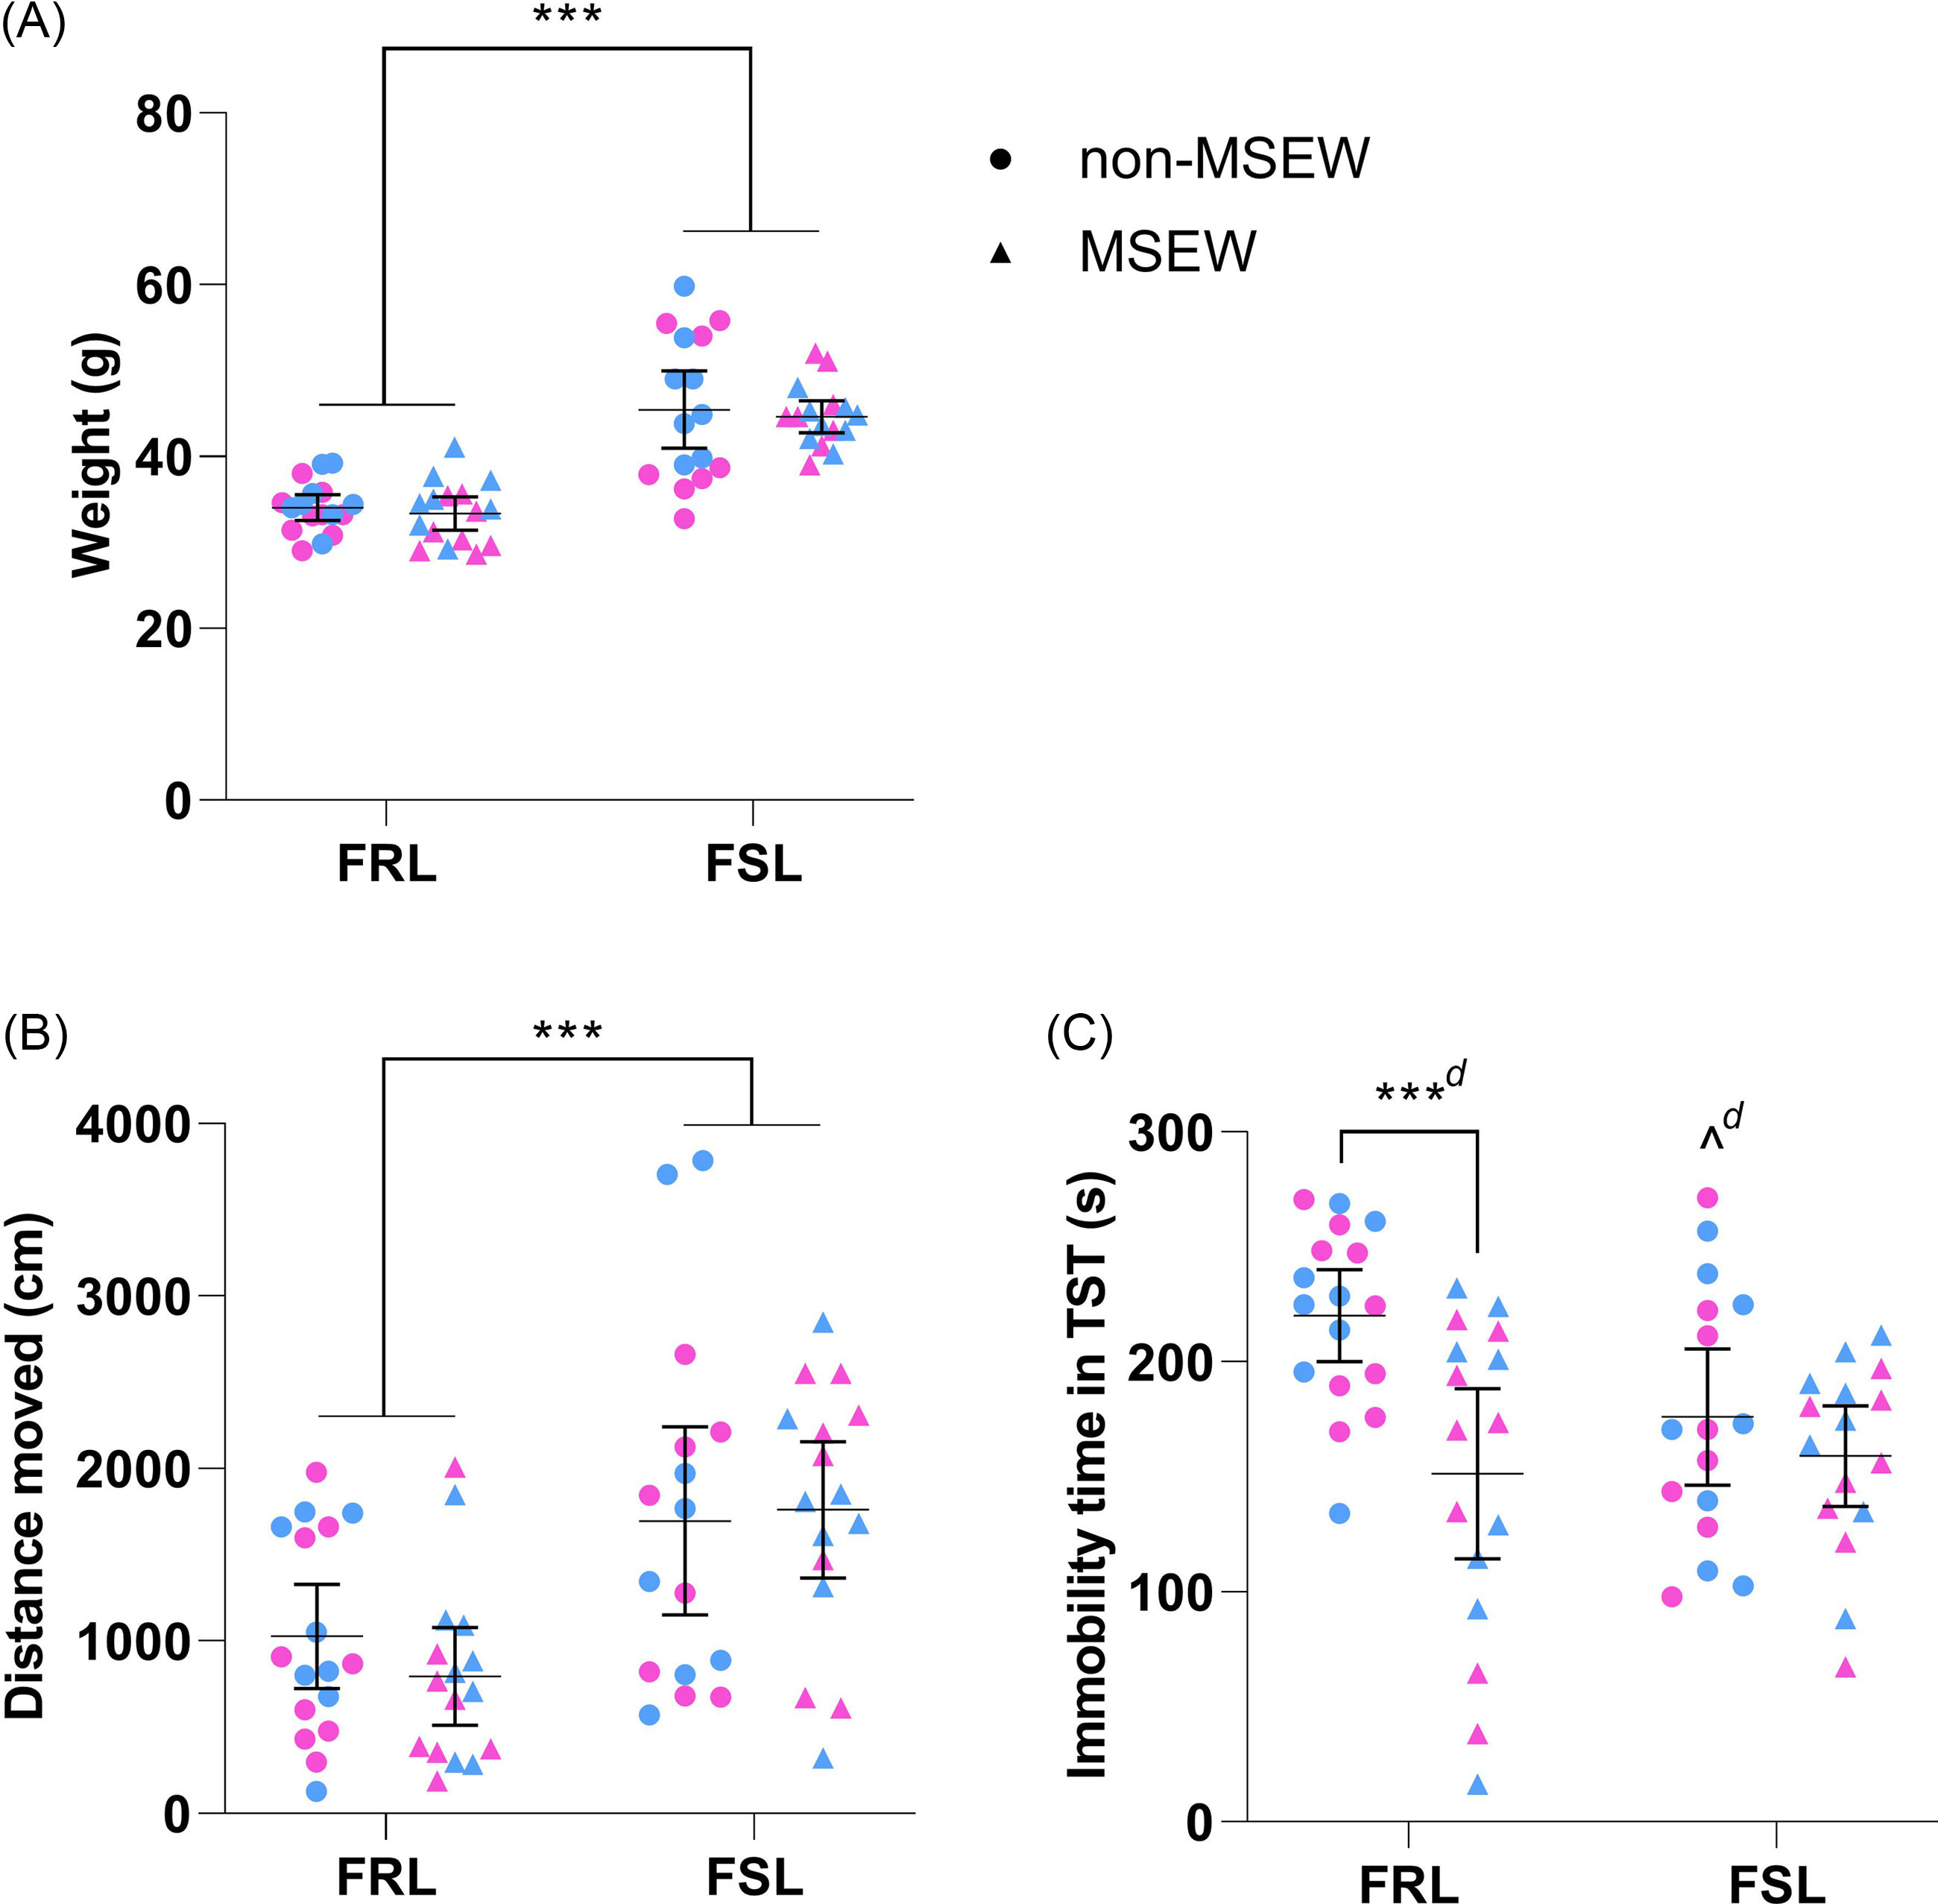
Only strain affected body weight (Fig. 2A; F 1,61 = 80.06, p < 0.001, η p 2 = 0.57) and distance moved (Fig. 2B; F 1,61 = 19.63, p < 0.001, η p 2 = 0.24) on PND21 so that FSL rats (irrespective of ELA) weighed 11 g [9; 14 g] more and covered 817 cm [448; 1186 g] more than FRL controls. Although distance moved in the OFT did not affect time spent immobile in the TST (Table 1; F 1,60 = 0.16, p = 0.69, η p 2 = 0.003), the strain*ELA interaction (F 1,60 = 4.03, p = 0.049, η p 2 = 0.06) and ELA alone (F 1,60 = 10.83, p = 0.002, η p 2 = 0.15) influenced TST behaviour (Fig. 2C). After correcting for distance moved, non-MSEW FSL rats spent less time immobile that their non-MSEW FRL controls (p = 0.036, d unb = 0.9 [0.2; 1.6]). Although ELA (regardless of strain) decreased TST immobility, this was only significant for FRL (p < 0.001, d unb = 1.2 [0.5; 2.0]), and not FSL (p = 0.37, d unb = 0.3 [−0.4; 1.0]) pups.
The immediate effects of maternal separation and early weaning on FRL and FSL rats on PND21. (A) Weighta, (B) distance moved (over 5 min) in the OFTa,b and (C) time spent immobile in the TSTa on PND21. Data points represent the mean±95% CI, with male and female indicated in blue and pink, respectively. Statistical analyses are reported in the text with *** p ≤ 0.001 vs. indicated group; ^ p < 0.05 vs. non-MSEW FRL rats, and d ≥ 0.8 (significant large effect) vs. indicated group (or non-MSEW FRL when presented with no line). a) Heterogeneity of variances. b) Not all data sets were normally distributed. FRL: Flinders resistant line. FSL: Flinders sensitive line. MSEW: maternal separation and early weaning. TST: Tail suspension test.
Original and ANCOVA-adjusted immobile times in the TST and FST
Values adjusted with the mean distance moved in the OFT on PND21 (for TST) and OFT on PND36 (for FST). All statistical findings are reported in text, with these values presented here for transparency. FRL: Flinders resistant line; FSL: Flinders sensitive line; FST: forced swim test; MSEW: maternal separation and early weaning; TST: tail suspension test.
Delayed effects of ELA
Distance moved in the OFT and swimming behaviour in the FST
In Fig. 3A, the strain*ELA interaction (F 1,61 = 7.88, p = 0.007, η p 2 = 0.11) was significant for distanced moved on PND36. FSL rats (regardless of ELA) covered 870 cm [582; 1158 cm] more in the OFT than FRL controls (p < 0.001, η p 2 = 0.07). However, MSEW only increased distance moved in the FSL (p = 0.001, d unb = 1.1 [0.4; 1.9]) and not FRL (p = 0.61, d unb = 0.2 [−0.9; 0.5]) rats.
The delayed effects of maternal separation and early weaning. (A) Distance moved in the OFTa. (B) Time spent immobilea,b, (C) swimminga,b and (D) struggling a.b,c in the FST. Data points represent the mean±95% CI, with male and female indicated in blue and pink, respectively. Statistical analyses are reported in the text with *** p ≤ 0.001 vs. indicated group; ^ p < 0.05, ^^ p ≤ 0.05 and ^^^ p ≤ 0.001 vs. indicated group, and d ≥ 0.8 (significant large effect). a) Not all data sets were normally distributed. b) Heterogeneity of variances. c) Outlier identified but not excluded. FRL: Flinders resistant line. FSL: Flinders sensitive line. FST: forced swim test. MSEW: maternal separation and early weaning.
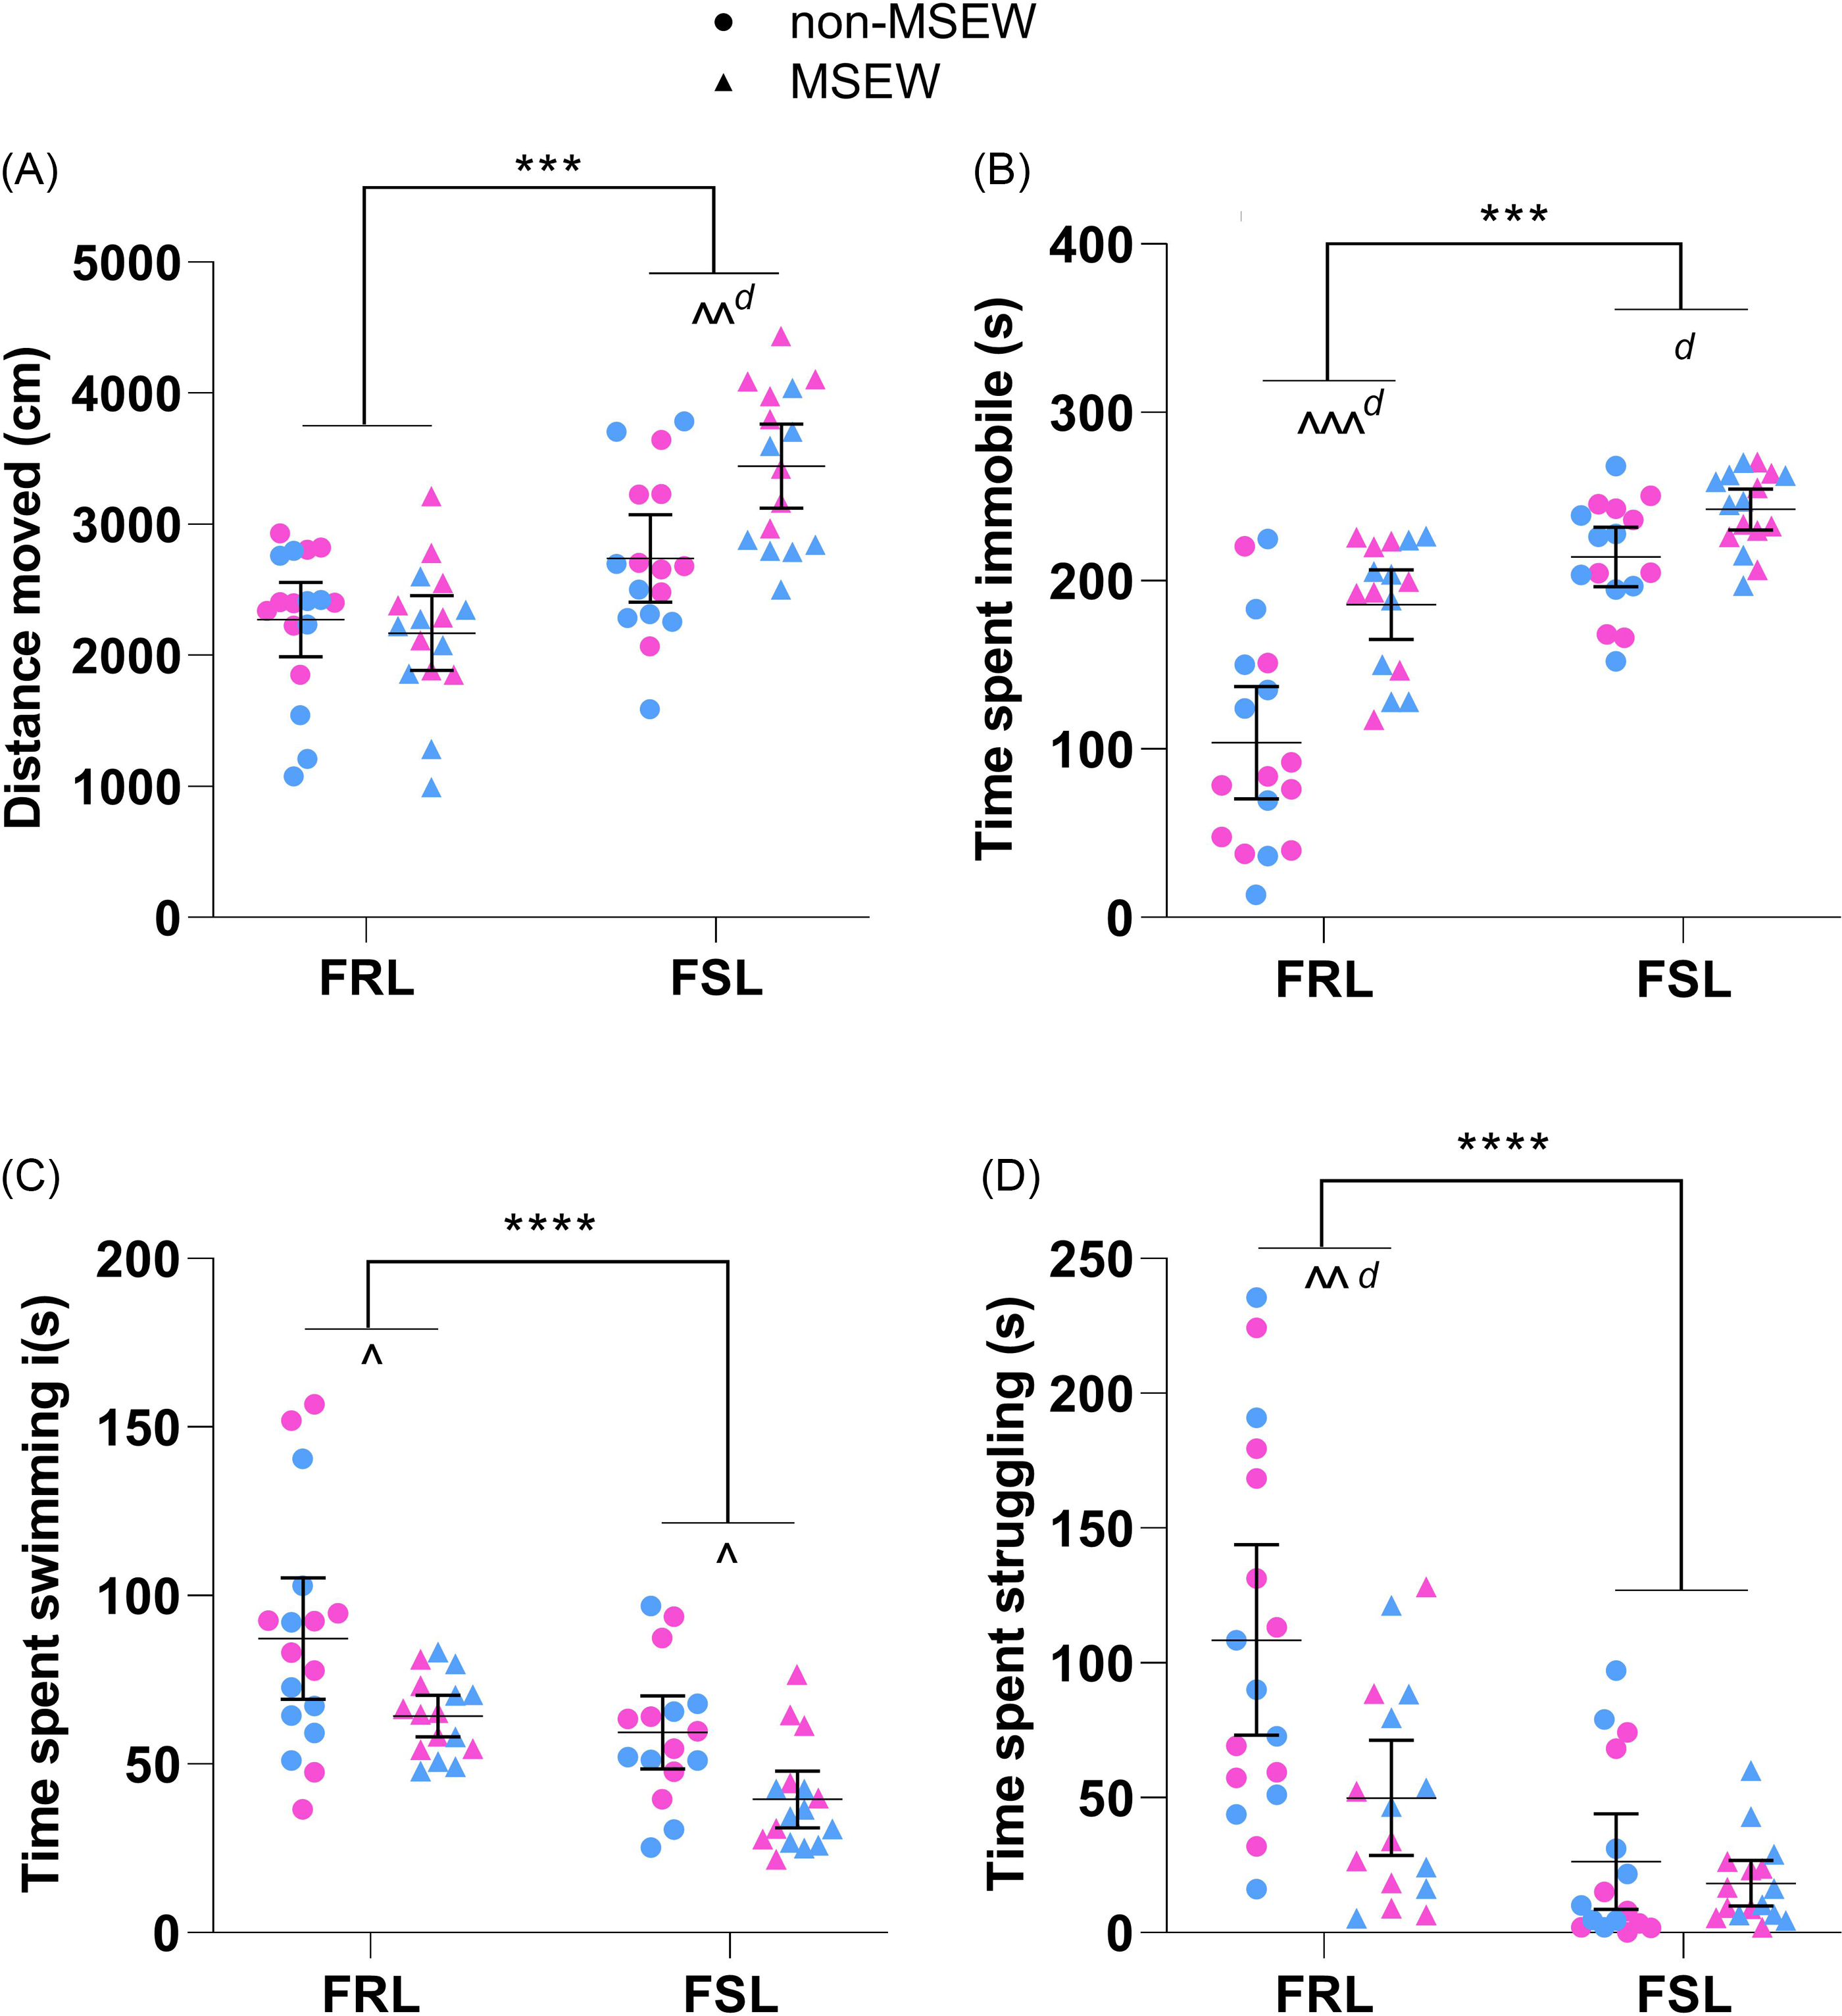
FST behaviour was unaffected by distance moved in the OFT (p > 0.05 in all instances; Table 1). After correcting for distance moved, only immobility (Fig. 3B) was influenced by the strain*ELA interaction (F 1,60 = 4.73, p = 0.03, η p 2 = 0.07). Of note, both strain (F 1,60 = 40.76, p < 0.001, η p 2 = 0.41) and ELA (F 1,60 = 25.36, p < 0.001, η p 2 = 0.30) independently also influenced immobility time so that FSL rats (regardless of ELA) were 88 s [60; 115 s] more immobile than FRL controls and that MSEW (regardless of strain) increased time spent immobile by 57 s [34; 79 s]. Interestingly, statistical significance between non-MSEW and MSEW was only reached in the FRL rats (p < 0.001, d unb = 1.5 [0.7; 2.3]), while a similar trend existed in the FSL rats (p = 0.07, d unb = 1.0 [0.2; 1.7]).
Time spent swimming and struggling was independently influenced by both strain (Fig. 3C; F 1,60 = 12.90, p < 0.001, η p 2 = 0.18 and Fig. 3D; F 1,60 = 19.39, p < 0.001, η p 2 = 0.24) and ELA (Fig. 3C; F 1,60 = 13.07, p < 0.001, η p 2 = 0.18 and Fig. 3D; F 1,60 = 9.31, p = 0.003, η p 2 = 0.13). After correcting for distance moved, FSL rats (regardless of ELA) swam 26 s [11; 40 s] less than FRL controls as did MSEW animals in relation to non-MSEW controls (Fig. 3C). For time spent struggling (Fig. 3D), FSL rats (regardless of ELA) struggled 62 s [34; 90 s] less than FRL controls, while MSEW animals struggled 35 s [12; 58 s] less than non-MSEW controls. Interestingly, this effect was only significant in FRL (p < 0.001, d unb = 1.0 [0.3; 1.8]) and not FSL (p = 0.49, d unb = 0.3 [−0.4; 1.0]) rats.
Anxiety-like behaviour in the EPM
There was no significant interaction (F 1,61 = 0.01, p = 0.91, η p 2 ≤ 0.0005) or any main effects identified for the percentage time spent in open arms of the EPM (data not shown).
Brain and heart weight
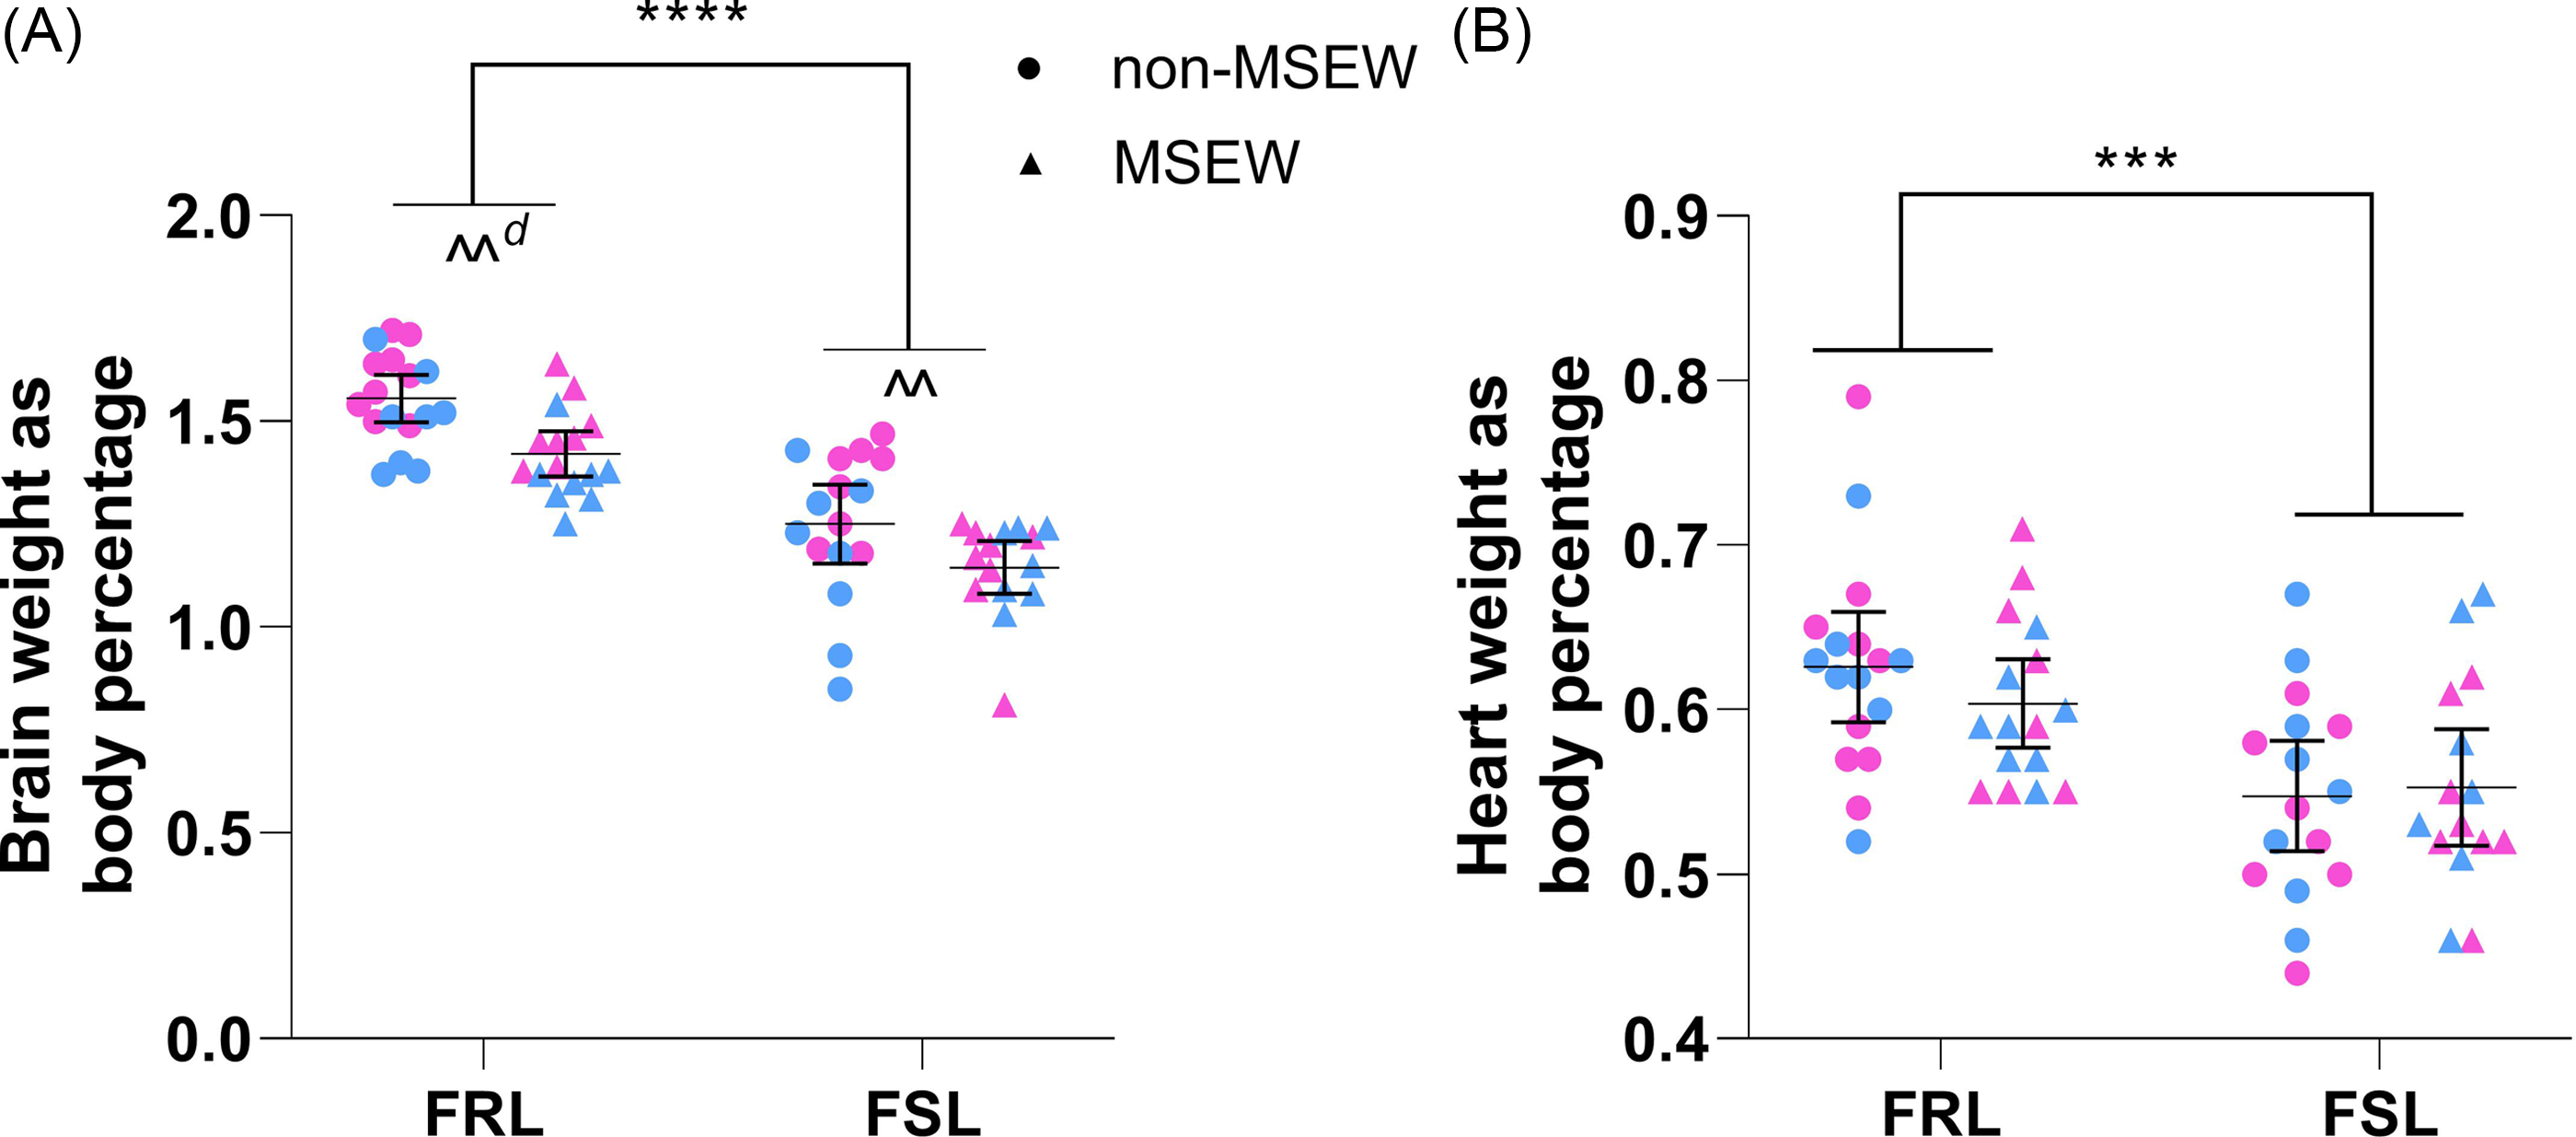
Brain weight (Fig. 4A) was influenced by strain (F 1,60 = 78.07, p < 0.001, η p 2 = 0.57) and ELA (F 1,60 = 13.41, p < 0.001, η p 2 = 0.18) independently so that the brain weight of FSL rats (regardless of ELA) was 0.29% [0.2; 0.4%] lower than FRL controls. Similarly, the brain weight of MSEW animals (regardless of strain) weighed 0.12% [0.5; 0.2%] less than non-MSEW counterparts. Heart weight (Fig. 4B), however, was influenced only by strain (F 1,60 = 18.09, p < 0.001, η p 2 = 0.23) so that those of FSL rats (regardless of ELA) weighed 0.07% [0.03; 0.1%] less than that of FRL controls.
The effects of maternal separation and early weaning on anatomical markers. (A) Braina and (B) heart weight of FSL and FRL rats, expressed as a percentage of body weight. Data points represent the mean±95% CI, with male and female indicated in blue and pink, respectively. Statistical analyses are reported in the text with *** p ≤ 0.001 vs. indicated group; ^^ p ≤ 0.01 vs. indicated group and d ≥ 0.8 (significant large effect). a) Outlier identified but not excluded. FRL: Flinders resistant line. FSL: Flinders sensitive line.
Hippocampal monoamine levels, metabolic markers and redox state
In Fig. 5A, significant main effects of strain (F 1,51 = 41.37, p < 0.001, η p 2 = 0.45) and ELA (F 1,51 = 11.12, p = 0.002, η p 2 = 0.18) were identified for hippocampal norepinephrine levels. Regardless of ELA, FSL rats had 231 ng/g [159; 303 ng/g] more hippocampal norepinephrine than FRL controls. Similarly, hippocampal norepinephrine levels of MSEW animals (regardless of strain) were 120 ng/g [48; 192 ng/g] higher than that of their non-MSEW counterparts.
Hippocampal monoamine levels and redox state markers. (A) Norepinephrine levelsa,c, (B) serotonin turnoverb,c and (C) redox statea,c (GSH/GSSG) of FRL and FSL rats on PND38. Data points represent the mean±95% CI, with male and female indicated in blue and pink, respectively. Statistical analyses are reported in the text with ** p ≤ 0.01, *** p ≤ 0.001 vs. indicated group; ^ p < 0.05 vs. indicated group, and d ≥ 0.8 (significant large effect). a) Not all data sets were normally distributed. b) Heterogeneity of variances. c) Outliers identified and excluded. FRL: Flinders resistant line. FSL: Flinders sensitive line. MSEW: maternal separation and early weaning.
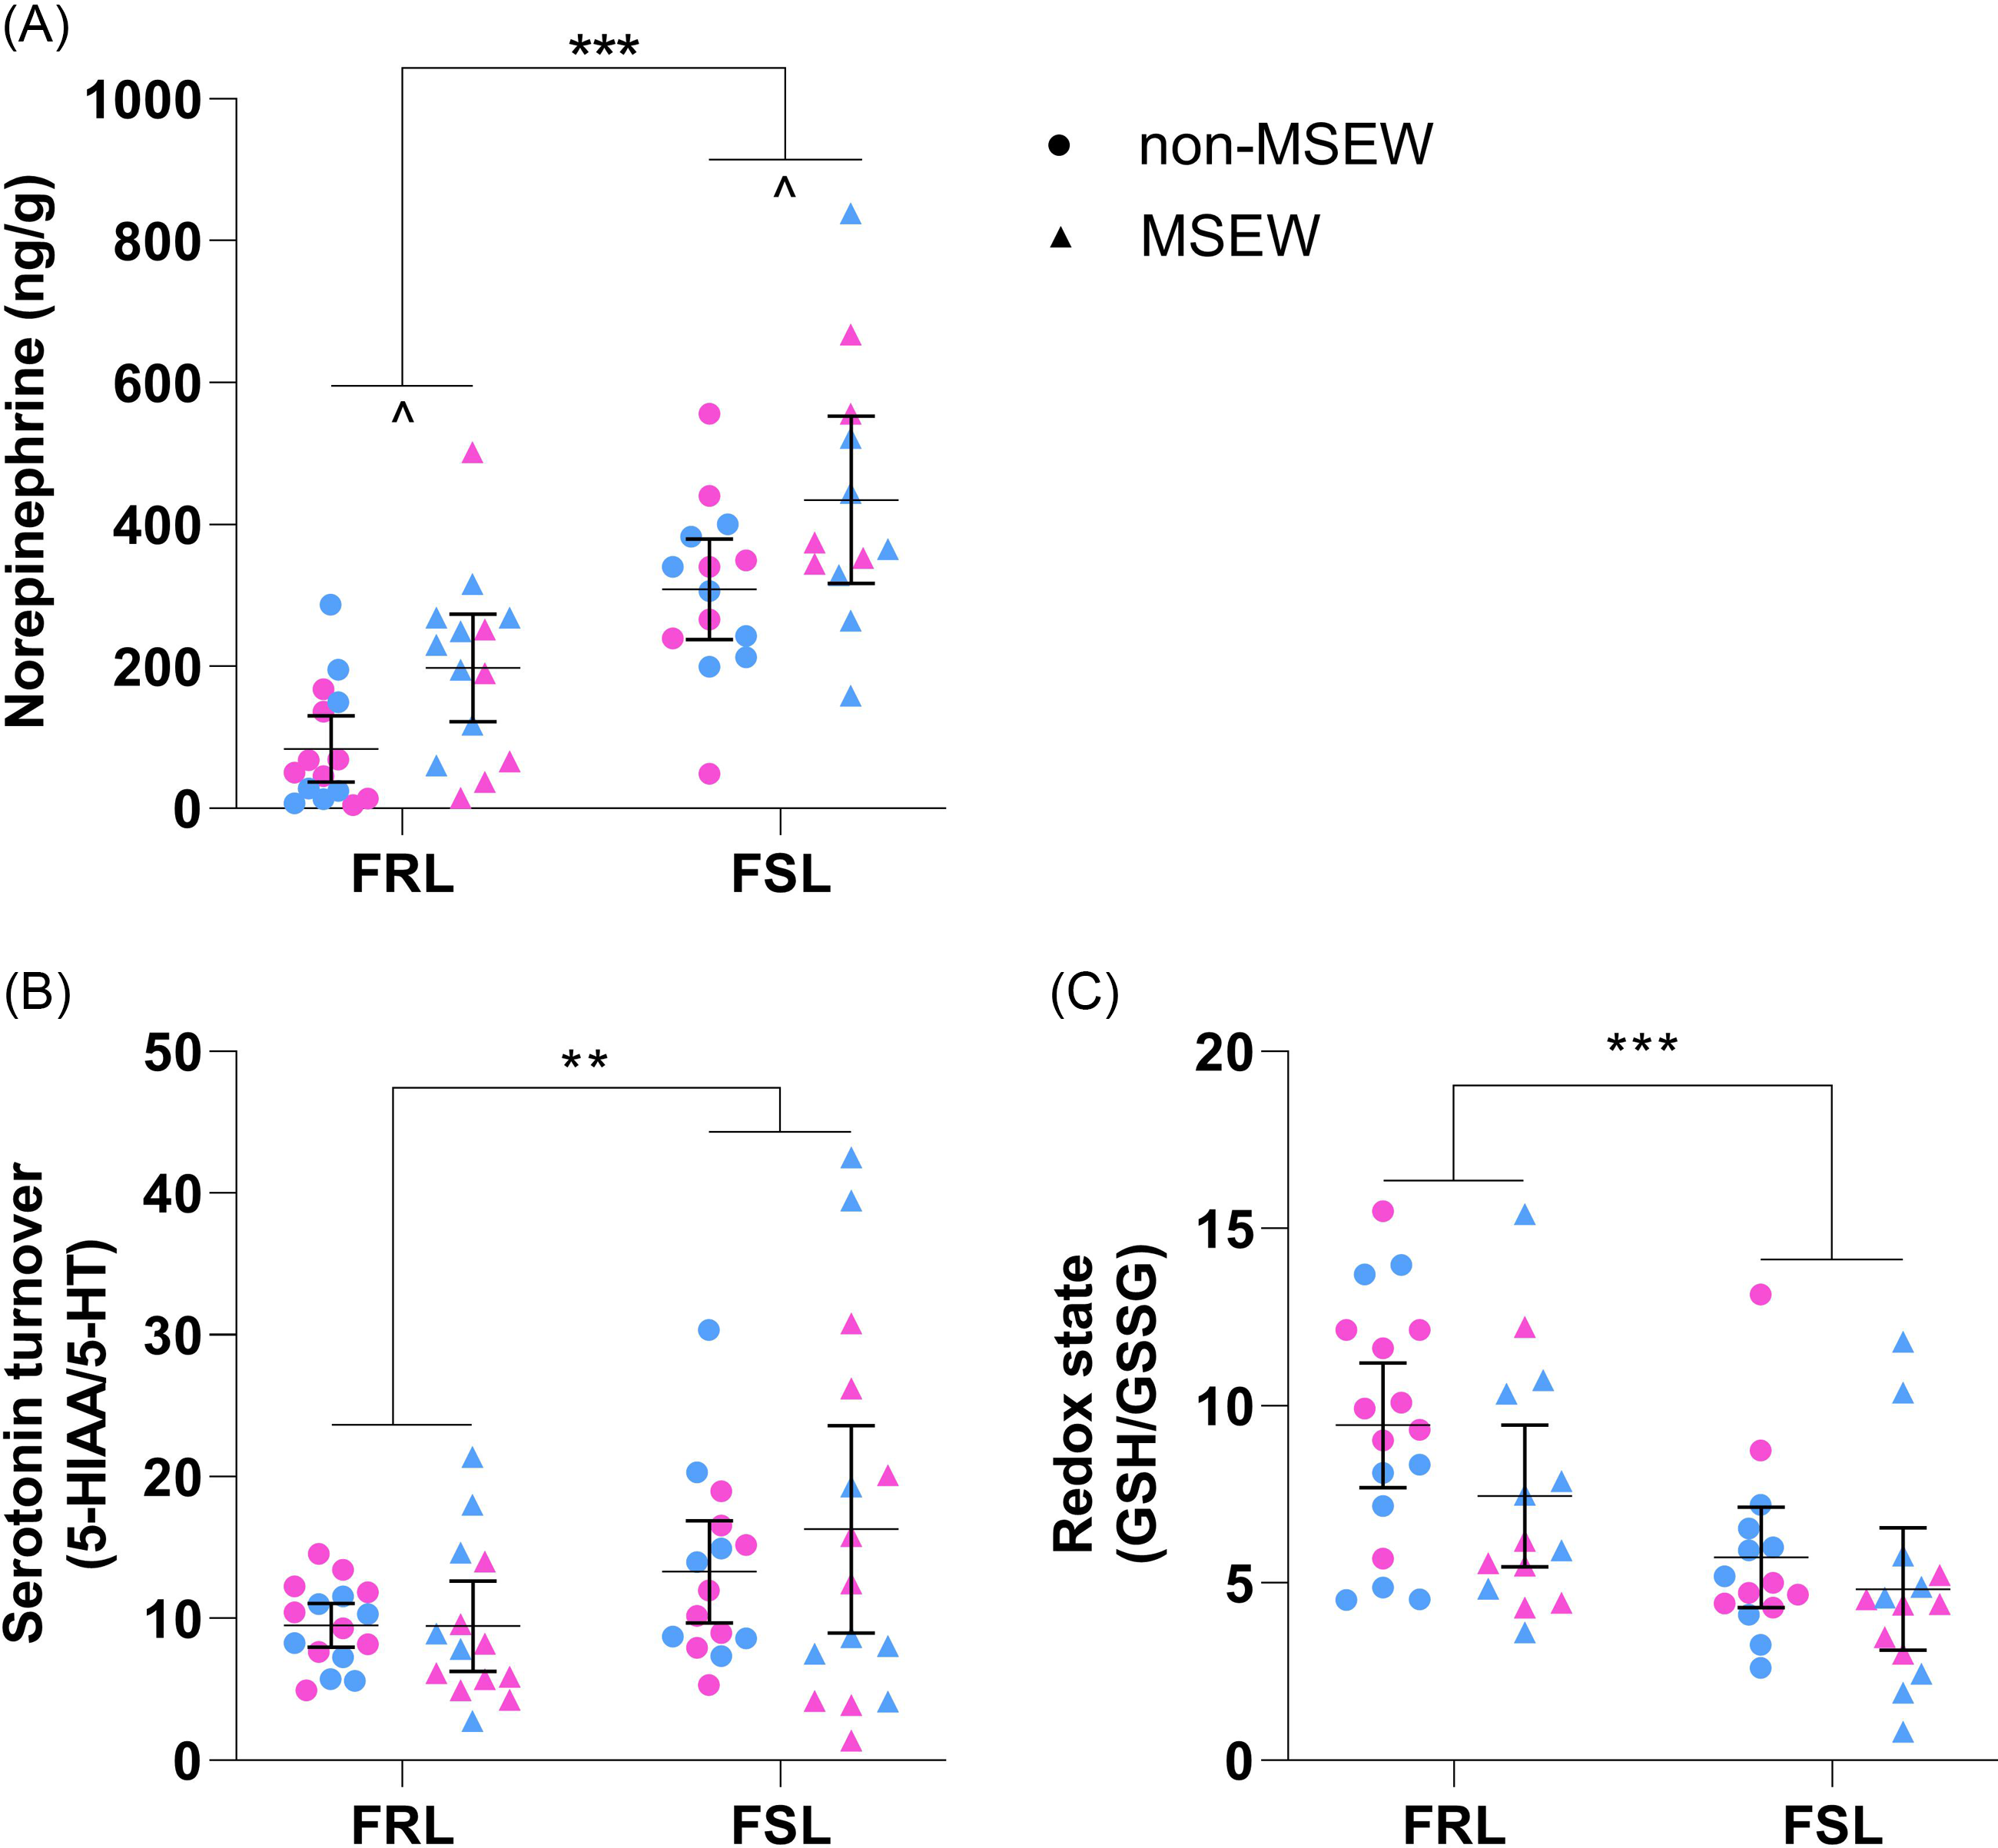
Hippocampal serotonin turnover (5-HIAA/5-HT) and redox state (GSH/GSSG) (Table 2) were only influenced by strain (Fig. 5B; F 1,56 = 6.63, p = 0.01, η p 2 = 0.11 and Fig. 5C; F 1,56 = 15.25, p < 0.001, η p 2 = 0.21) so that FSL rats (regardless of ELA) had higher serotonin turnover and lower GSH/GSSG values than FRL controls.
Hippocampal serotonin levels and redox state markers
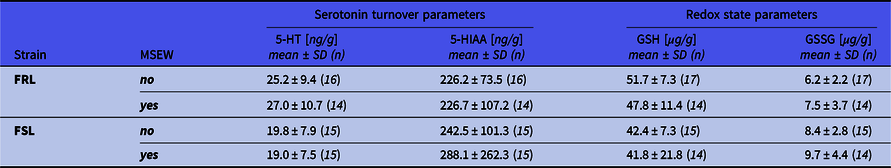
Because of the significant influence of main effects, all statistical findings are reported in text. 5-HT: 5-hydroxytryptamine (serotonin); 5-HIAA: 5-hydroxyindoleacetic acid; FRL: Flinders resistant line; FSL: Flinders sensitive line; GSH: glutathione; GSSG: glutathione disulphide; MSEW: maternal separation and early weaning.
Of the metabolic markers detected (palmitic acid, stearic acid, oleic acid, 1-monopalmitin, 1-monostearin and nicotinic acid), only 1-monopalmitin acid and nicotinic acid were significantly influenced by the investigated factors (Table 3). For 1-monopalmitin, there was a significant strain*ELA interaction (F 1,32 = 4.33, p = 0.046, η p 2 = 0.12) so that MSEW decreased hippocampal levels only in FSL rats relative to non-MSEW strain controls (p = 0.002; d unb = 1.6 [0.5; 2.9]). Secondly, hippocampal nicotinic levels were only affected by strain (F 1,23 = 4.83, p = 0.038, η p 2 = 0.17) so that FSL rats (regardless of ELA) had 98% higher levels than FRL controls.
Significant hippocampal metabolomic markers
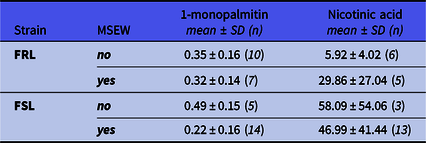
The values presented here are all log-transformed and therefore contain no SI unit. Group sizes differ from behavioural analyses and could be explained by the storage buffer used. Because of the significant influence of main effects, all statistical findings are reported in text. FRL: Flinders resistant line. FSL: Flinders sensitive line. MSEW: maternal separation and early weaning.
Discussion
Juvenile strain differences
The FSL rat is a validated rodent model of depression (Overstreet & Wegener, Reference Overstreet and Wegener2013), yet bio-behavioural data during the juvenile developmental period is limited. Based on the findings of Malkesman and Weller (Reference Malkesman and Weller2009), the FSL rat can be used to model childhood depression, as it already displays its characteristic depressive-like phenotype between PND31 and 40 (Malkesman, Braw, et al., Reference Malkesman, Braw, Maayan, Weizman, Overstreet, Shabat-Simon and Weller2006), despite having comparable monoaminergic levels across different brain regions at PND34 (Malkesman et al., Reference Malkesman, Shayit, Genud, Zangen, Kinor, Maayan and Yadid2007; Malkesman et al., Reference Malkesman, Braw, Ram, Maayan, Weizman, Kinor and Weller2008). Importantly, these findings were in reference to Sprague-Dawley rats and not FRL controls and were also measured during the pubertal onset period (i.e. PND35-45) (Murrin et al., Reference Murrin, Sanders and Bylund2007; Drzewiecki et al., Reference Drzewiecki, Willing and Juraska2020). Here, we screened behaviour in these animals at weaning age (i.e. prepubertal), which is useful to further validate this model as an appropriate rodent model for childhood depression. At PND21, FSL rats (regardless of sex) were heavier, displayed hyperlocomotor activity in the OFT and spent less time immobile in the TST (Fig. 2). These findings would therefore suggest that prepubertal male and female FSL rats do not display increased ‘behavioural despair’ or depressive-like behaviour, as measured in the TST on PND21. To the best of our knowledge, the TST has not yet been used to investigate the depressive-like phenotype of the FSL rat, and our findings therefore require confirmation, especially because body weight has been suggested to influence mobility (Bogdanova et al., Reference Bogdanova, Kanekar, D’Anci and Renshaw2013). This may be especially relevant here, as the larger body weight of the FSL rats on PND21 could have allowed for greater physical mobility in the TST (Fig. 2C), even after correcting for locomotor differences. Importantly, others have noted that the neuronal mechanisms involved in the TST differ from those in the FST (Renard et al., Reference Renard, Dailly, David, Hascoët and Bourin2003). Adrenergic neurotransmission has been found to influence TST behaviour more than the escape-directed behaviour in the FST (Hascoët et al., Reference Hascoët, Bourin and Bradwejn1991). In this regard, we observed increased hippocampal norepinephrine levels in the FSL rats on PND38 (Fig. 5A) that may explain the decreased immobility in the TST relative to age-matched FRL controls (Fig. 2C). Importantly, that we did not measure monoamine levels at PND21 is a limitation that must be confirmed in prospective studies. Interestingly, ‘irritable mood’ and ‘psychomotor agitation’ are key diagnostic symptoms of juvenile depression (American Psychiatric Association, 2013) that may have presented here as increased locomotor activity in the OFT and TST on PND21. In fact, Mitchell et al. (Reference Mitchell, Gould, Smolik, Koek and Daws2013) reported PND21 mice to be more mobile in the TST than PND28 or adult (PND62-90) controls. Still, this early-life hyperlocomotor activity was also present on PND36 (Fig. 3A) and therefore aligns our findings with that of others (George et al., Reference George, Bordner, Elwafi and Simen2010) and motivates for further investigation into the proposed psychomotor agitation-like behaviour. Importantly, this increased locomotor activity is not likely to be indicative of anxiety-like behaviour as no strain differences were observed for time spent in the open arms of the EPM, even following the FST. This is in line with the literature, describing the FSL rat as ‘a model of depression without comorbid anxiety’ (Overstreet & Wegener, Reference Overstreet and Wegener2013), even at a juvenile age (Malkesman & Weller, Reference Malkesman and Weller2009). Still, on PND36, FSL rats displayed increased depressive-like (i.e. time spent immobile; Fig. 3B) and decreased coping (i.e. swimming and struggling) behaviours (Figs. 3C and D) in the FST. Considered together, although the TST data may, on face value, be interpreted as representing antidepressive-like behaviour, it could in fact represent a psychomotor agitation phenotype that warrants further investigation. In contrast to this, the depressive-like behaviour observed in the FST (Fig. 3) may accurately represent behavioural despair at a young (pubertal onset) age. Although no significant sex differences were observed in the current study, it is important to note that pubertal onset in rats takes place between PND35 (females) and PND43 (males) (Murrin et al., Reference Murrin, Sanders and Bylund2007; Drzewiecki et al., Reference Drzewiecki, Willing and Juraska2020) and may therefore have influenced the outcome of the behavioural tests (Goodwill et al., Reference Goodwill, Manzano-Nieves, Gallo, Lee, Oyerinde, Serre and Bath2019) and therefore warrants further investigation.
Still, to corroborate these behavioural findings, we measured hippocampal neurochemical markers because of the region’s recognised role in depression (Campbell & MacQueen, Reference Campbell and MacQueen2004). In line with clinical findings (Barton et al., Reference Barton, Esler, Dawood, Lambert, Haikerwal, Brenchley and Wiesner2008; Zhuo et al., Reference Zhuo, Zhu, Wang, Qu, Ma and Qin2017), juvenile FSL rats, regardless of sex or ELA, had lower brain weights (Fig. 4A) and increased hippocampal serotonin turnover (Fig. 5B) and an altered redox state (Fig. 5C). The GSH/GSSG ratio is a valuable biomarker of cellular redox state (Enns & Cowan, Reference Enns and Cowan2017), with lower levels indicating increased oxidative stress (Chai et al., Reference Chai, Ashraf, Rokutan, Johnston and Thomas1994). GSH is a highly abundant and potent intra- and extracellular antioxidant (Zitka et al., Reference Zitka, Skalickova, Gumulec, Masarik, Adam, Hubalek and Kizek2012) that when oxidised to GSSG reduces antioxidant protection. Therefore, that the redox state in juvenile FSL rats appears dysfunctional suggests increased oxidative stress damage, specifically in the hippocampus that could have contributed to the observed brain atrophy (Fig. 4A). This finding supports increasing evidence suggesting depression to be a bio-energetic disorder, resulting from increased free radical production and an altered redox state, caused by dysfunctional mitochondria. To this end, clinical and preclinical evidence suggests mitochondrial function and numbers to be adversely affected by early-life stress (Hoffmann & Spengler, Reference Hoffmann and Spengler2018; Ridout et al., Reference Ridout, Khan and Ridout2018; Zitkovsky et al., Reference Zitkovsky, Daniels and Tyrka2021). Here, we unfortunately did not analyse any direct markers of mitochondrial function, such as respiration, yet still identified strain differences in terms of hippocampal nicotinic acid concentrations (Table 3). Nicotinic acid is a precursor for the mitochondrial electron carrier NAD+ that contributes to energy production and the redox state of the mitochondria (Crowley et al., Reference Crowley, Payne, Bernstein and Roe2000). That FSL rats (irrespective of sex and ELA) had significantly higher nicotinic levels may point towards a dysfunctional bio-energetic system in that FSL rats may have impaired nicotinic acid to NAD+ conversion pathways. This is at least somewhat supported by available literature reporting hippocampal synapse and mitochondria numbers of the FSL rat to be reduced (Chen et al., Reference Chen, Ardalan, Elfving, Wegener, Madsen and Nyengaard2018).
Next, that we observed increased serotonin turnover in FSL rats mirrors clinical findings (Barton et al., Reference Barton, Esler, Dawood, Lambert, Haikerwal, Brenchley and Wiesner2008) and further strengthens the validity of the FSL rat as a model for paediatric depression. Despite the limited neurochemical data on depressed children, Dahlström et al. (Reference Dahlström, Ahonen, Ebeling, Torniainen, Heikkilä and Moilanen2000) reported elevated serotonin transport activity in depressed juveniles (aged 7–17 years), proposing a compensatory mechanism for the hyposerotonergic state to be at play. That similar findings were observed in adult FSL rat (Hvilsom et al., Reference Hvilsom, Lillethorup, Iversen, Doudet, Wegener and Landau2019; Harvey et al., Reference Harvey, Uys, Viljoen, Shahid, Sonntag and Meyer2021) supports this idea and our current findings. As for norepinephrine levels, although others have reported comparable (Harvey et al., Reference Harvey, Uys, Viljoen, Shahid, Sonntag and Meyer2021) and reduced (Brand & Harvey, Reference Brand and Harvey2017) hippocampal levels in adult FSL rats, our findings (Fig. 5A) are supported by others (Zangen et al., Reference Zangen, Overstreet and Yadid1999; Roets et al., Reference Roets, Brand and Steyn2023) and could be explained by lower α2 receptor expression in the FSL rat (Landau et al., Reference Landau, Phan, Iversen, Lillethorup, Simonsen, Wegener and Doudet2015). Finally, a dysfunctional adrenergic system is implicated in depression and associated with comorbid impaired cardiovascular function (Alvares et al., Reference Alvares, Quintana, Hickie and Guastella2016). In this regard, it is interesting that juvenile FSL rats (regardless of sex or ELA) also had lower heart weights than their FRL controls (Fig. 4B), as the cardiovascular system is strongly regulated by the sympathetic nervous system, which has been shown to be impaired or dysfunctional in depressed patients (Määttänen et al., Reference Määttänen, Martikainen, Henttonen, Väliaho, Thibault and Palomäki2019). These results, however, invite confirmation.
The effect of an early-life stressor on bio-behavioural parameters
Because ELA is a significant contributor to the development of mood disorders later in life, we also investigated the effects of MSEW in the Flinders line rats to determine whether genetic susceptibility would exacerbate the effects of ELA on depressive-like behaviour. Here, MSEW did not affect the weight of either strain on PND21 (Fig. 2A), which is similar to the findings of George et al. (Reference George, Bordner, Elwafi and Simen2010). It should also be noted here that to the best of our knowledge, MSEW has not been investigated in the offspring FSL rat strain. Interestingly, we recently reported that MSEW unexpectedly induced antidepressant-like effects in the FSL postpartum dam (Roets et al., Reference Roets, Brand and Steyn2023). As for the offspring, MSEW in the current study did not affect the locomotor activity (Fig. 2B) of PND21 pups yet had an overall decreasing effect on time spent immobile in the TST (Fig. 2C). Surprisingly, this effect was more significant in the FRL rats. Although the exact reason for this is unknown, it may involve the animal’s response to a stressor. In this regard, it is worth noting that prolonged interference with maternal–offspring relationship is reported to induce a hypothalamic–pituitary–adrenal (HPA) axis hyper-responsiveness, evident by increased stress hormones (Pfeffer et al., Reference Pfeffer, Altemus, Heo and Jiang2007). The corticosterone response of early weaned C57BL/6 mice was prolonged in animals maternally separated for 3 h/day, whilst a blunted response was observed in animals separated for only 10 min/day (Parfitt et al., Reference Parfitt, Levin, Saltstein, Klayman, Greer and Helmreich2004; Kikusui et al., Reference Kikusui, Nakamura, Kakuma and Mori2006). This hypothesis is further supported by the findings of Malkesman, Maayan, et al. (Reference Malkesman, Maayan, Weizman and Weller2006) who concluded that the FSL rat may present with chronic HPA axis up-regulation following chronic stress, which may not be the case for the FRL strain. These reports, together with the increased mobility observed here, underlines the importance of investigating the corticosterone response of both strains at PND21.
Although the immediate effects of MSEW did not affect locomotor activity on PND21, our findings show that MSEW had a delayed effect on locomotor activity on PND36 (Fig. 3A), with a more prominent effect in FSL rats. Similar increased locomotor activity following maternal separation has been observed by others (George et al., Reference George, Bordner, Elwafi and Simen2010; Wang et al., Reference Wang, Li, Du, Shao and Wang2015; Jin et al., Reference Jin, Zhao, Jiang, Wang, Li, Zhang and Sun2018) and suggest that MSEW may result in or even worsen psychomotor agitation-like behaviour (Grønli et al., Reference Grønli, Murison, Fiske, Bjorvatn, Sørensen, Portas and Ursin2005; Linge et al., Reference Linge, Pazos and Díaz2013). Specifically, Sanders and Anticevic (Reference Sanders and Anticevic2007) reported similar findings in Wistar-Kyoto rats, following maternal separation from PND01-14, and noted that these pups also exhibited tachycardia during the stress period. This, together with the different norepinephrine levels reported here (Fig. 5A), again highlights the need for further investigation into the stress response and psychomotor agitation-like behaviour of these animals following an early-life stressor. That anxiety-like behaviour was unaffected by MSEW strengthens our hypothesis that the mentioned behaviour might be indicative of a psychomotor agitation-like behaviour rather than anxiety-like behaviour. After correcting for distance moved in the OFT, MSEW (regardless of strain) increased time spent immobile in the FST (Fig. 3B), thereby enforcing the hypothesis that ELA can result in depressive-like behaviour – even in non-susceptible individuals. It must however be highlighted that time spent immobile and struggling were more prominently affected in the FRL rats (Fig. 3B and D), suggesting the need to further explore the adverse effects of ELA in a population without a genetic susceptibility for depression. That only time spent swimming was adversely affected by MSEW (Fig. 3C) suggests that the depressive-like phenotype of the FSL rat may not be exaggerated by MSEW. Still, whether it affected their response to antidepressant treatment (i.e. treatment resistant depression) remains unknown and is worth investigating. Still, our findings are in line with clinical reports, showing ELA to have negative neurodevelopmental implications (Bick & Nelson, Reference Bick and Nelson2016). MSEW did however not influence cardiac weight in either strain, but further studies should investigate whether this (and other cardiovascular functions) is also the case at a later age, as maternal separation has the potential to influence autonomic outflow (Card et al., Reference Card, Levitt, Gluhovsky and Rinaman2005), which influences the cardiovascular system. To this point, childhood adversity is also strongly linked to increased risk for cardiovascular diseases, probably via an inflammatory-mediated mechanism (Obi et al., Reference Obi, McPherson and Pollock2019). Regardless, that MSEW increased hippocampal norepinephrine levels in both FSL and FRL rats points to an activated stress response and supports the notion of MSEW indeed being a stressor. That MSEW appeared to induce a more robust behavioural effect in FRL rats may again highlight different stress responses at play, which is in line with the clinical setting (Zorn et al., Reference Zorn, Schür, Boks, Kahn, Joëls and Vinkers2017). That hippocampal serotonin turnover and redox state (Fig. 5B and C) was unaffected by MSEW could point towards a different mechanism through which ELA induces depressive-like behaviour and should be explored in future studies. To this end, MSEW did cause a significant reduction in 1-monopalmitin hippocampal levels in FSL rats (Table 3). 1-Monopalmitin is a lipid responsible for amongst others, storing energy and acting as a structural component of cell membranes (Qin et al., Reference Qin, Shen, Wang, Gao, She and Li2021). Consequently, that MSEW induced a reduction in hippocampal 1-monopalmitin of FSL rats (Table 3) could suggest a negative effect on mitochondrial function and is strongly supported by the robust preoteomics analysis of Mallei et al. (Reference Mallei, Failler, Corna, Racagni, Mathé and Popoli2015) on the Flinders strain and recent findings linking stress-related pathways, stress reactivity and the effects on mitochondrial function (Rappeneau et al., Reference Rappeneau, Koti, Wilmes, Widner-Andrae, Busch and Touma2023). Nevertheless, it is worth noting that despite their not being any statistical strain differences in hippocampal 1-monopalmitin levels, O’Gorman et al. (Reference O’Gorman, Suvitaival, Ahonen, Cannon, Zammit, Lewis and Cotter2017) reported plasma 1-monopalmitin levels to be reduced in children and adolescents suffering from psychotic disorders. It must however be noted here that prospective studies should measure mitochondrial function to confirm our findings, specifically because the samples collected here were kept in a storage buffer used for respiration analyses (i.e. Seahorse assay). Taken together, the bio-behavioural effects caused by MSEW hints at a central role that the adrenergic nervous system, and perhaps mitochondrial function, may play in the long-term effects of early-life insults.
Conclusion
Our findings firstly support available literature, motivating the FSL rat as a suitable rodent model for juvenile depression, more specifically adolescent depression as it presents with altered early-life locomotor activity and increased depressive-like behaviour on PND35. These behavioural differences may be due to increased hippocampal norepinephrine levels and serotonin turnover, and a dysfunctional redox state, possibly caused by mitochondrial dysfunction. Next, our findings show that an early-life stressor, in the form of MSEW, is depressogenic and appears to be more prominent in the FRL rat. That MSEW also increased hippocampal norepinephrine levels and reduced rather than increased early-life immobility in the TST may point towards a central role of the stress response pathway in the behavioural alterations caused by early-life stress. Overall, our findings confirm that ELA can induce neuropsychiatric alterations but may follow a different course or mechanism in the presence or absence of genetic susceptibility.
Acknowledgements
The authors would like to acknowledge and thank Dr. Francois Viljoen for his assistance with neurochemical analyses. The authors would also like to acknowledge Mr Cor Bester, Mrs Antoinette Fick, Mr Kobus Venter and Sr Irene Serage for their support and assistance in overseeing the welfare of the animals and their technical support. This work emanated from a Masters (MSc) degree project (AJW)
Author contribution
SFS conceptualised, funded and designed the layout of the study. AJW performed all the experimental work and analysed and interpreted the data with SFS. AJW and SFS also wrote the original and amended versions of the manuscript, with ZL and RK collating and finalising the paper for submission and funded the metabolic analyses (ZL). All authors contributed to the various sections of this paper.
Financial support
This work was funded by internal North-West University research grants awarded to SFS.
Competing interests
None.
Animal welfare
All animal procedures were approved by the Animal Care, Health and Safety Research Ethics Committee of the North-West University (NWU-AnimCareREC; ethics approval number: NWU-00419-21-A5) and in accordance with the relevant code of ethics. All procedures complied with national legislation that pertains to experimental animal welfare (including the Department of Health’s Ethics in Health Research: Principles, Processes and Structures and the South African National Standard: The Care and Use of Animals for Scientific Purposes (SANS 10,386:2008)). This work also complied with the ARRIVE guidelines ensuring that all experimental data are reproducible, transparent, accurate comprehensive and logically ordered to promote well-written manuscripts.
Ethical standards
The authors assert that all procedures contributing to this work comply with the ethical standards of the South African National Standards and institutional guides on the care and use of laboratory animals.


 Open access