
Historic and cultural sites, like environmental resources, often provide benefits that are nonexcludable and nonrival to varying degrees and therefore are likely to be undervalued by traditional markets (Navrud and Ready Reference Navrud, Ready, Navrud and Ready2002). The failure of markets to appropriately value the services flowing from historic amenities leads to a less-than-efficient amount of historic preservation since the cost of preservation often falls to private property owners who thus incur private costs when preserving amenities that provide public benefits. Even when historical properties are publicly owned, there is potential pressure to use the areas for additional purposes unrelated to a site's historic importance. If those multiple uses impair the flow of historical services, then even publicly held resources may not be efficiently managed in terms of the economic benefits they provide. A growing body of literature has demonstrated that economic value arises from preservation of cultural heritage sites using environmental valuation techniques (e.g., Garrod and Willis Reference Garrod, Willis, Navrud and Ready2002, Riganti and Willis Reference Riganti, Willis, Navrud and Ready2002, Hansen Reference Hansen1997, Bille Reference Bille, Navrud and Ready2002, Chambers, Chambers, and Whitehead Reference Chambers, Chambers and Whitehead1998, Morey et al. Reference Morey, Rossmann, Chestnut, Ragland, Navrud and Ready2002, Bravi, Scarpa, and Sirchia Reference Bravi, Scarpa, Sirchia, Navrud and Ready2002, Carson, Mitchell, and Conaway Reference Carson, Mitchell, Conaway, Navrud and Ready2002, Mourato, Kontoleon, and Danchev Reference Mourato, Kontoleon and Danchev2002, Boxall, Englin, and Adamowicz Reference Boxall, Englin and Adamowicz2003, Alberini and Longo Reference Alberini and Longo2006, Van Duijn and Rouwendal Reference Van Duijn and Rouwendal2012, Melstrom Reference Melstrom2014, Pearce et al. Reference Pearce, Mourato, Navrud, Ready, Navrud and Ready2002). Most of the studies employed stated-preference methods because there is not enough observed variation in historical or cultural resources to estimate willingness to pay for preservation.
Although prior studies have primarily measured the value of historic areas and sites to visitors, the economic benefits of such sites are likely enjoyed by other groups, including nearby residents who may benefit both economically and aesthetically from residing close to historic areas. To date, this type of benefit from historical preservation has not been explored in the economic literature. Valuing benefits of historic resources using property-value models requires careful assessment of the types of services afforded by historic areas. For example, a historic battlefield of the American Revolution is valuable as an important historical site but also provides many open-space amenities known to be valuable to people (for example, see Irwin and Bockstael (Reference Irwin and Bockstael2001) and Irwin (Reference Irwin2002)). Disentangling the benefits of open space from historic service flows for cultural resources requires either stated-preference methods or a revealed-preference setting with sufficient variation in the landscape patterns of open-space and historic amenities.
We leverage the unique spatial geography of Williamsburg, Virginia, to measure homeowners' willingness to pay for a number of spatial amenities. We find that, when controlling for open-space amenities, there is a premium for residing closer to historical areas. Our specification of the services afforded by open space allows the historic areas to provide both open-space and historic amenities. In addition, the results show that being adjacent to a historical area is not, on average, considered a positive benefit, perhaps because of activity and congestion associated with tourism, while residing close to such areas is a valuable housing attribute to buyers. We test the robustness of our results by considering alternative functional forms and assumptions concerning the spatial error structure. This study is unique in that it uses hedonic valuation methods to assess the benefits of historical and cultural attributes to people living near historically and culturally interesting sites.
Literature on Valuing Historical Amenities
Van Duijn and Rouwendal (Reference Van Duijn and Rouwendal2012), the work closest to ours, investigated the value of cultural amenities using a revealed-preference hedonic method by aggregating their analysis at the city level and examining households' city choices as a function of cultural amenities. Their model characterized the housing-market equilibrium in a way similar to the one in Bayer, Keohane, and Timmins (Reference Bayer, Keohane and Timmins2009), which involved a sorting equilibrium model. The degree of spatial aggregation inherent in their approach can be useful for city planners as they attempt to “build” cultural resources such as museums and theaters but says little about the benefits that might accrue to residents of the city from preservation of localized historical or cultural amenities.
Numerous studies have combined revealed and stated preference approaches to value cultural heritage sites (Alberini and Longo Reference Alberini and Longo2006, Boxall, Englin, and Adamowicz Reference Boxall, Englin, Adamowicz, Navrud and Ready2002, Reference Boxall, Englin and Adamowicz2003). For example, Boxall, Englin, and Adamowicz (Reference Boxall, Englin, Adamowicz, Navrud and Ready2002) found that aboriginal rock drawings were seen as influencing quality for backcountry trips. The presence of these welfare effects provides evidence of the need to preserve cultural heritage sites. In addition, using travel-cost techniques, Melstrom (Reference Melstrom2014) examined the value of historic battlefields in the United States, and Van Loon, Gosens, and Rouwendal (Reference Van Loon, Gosens and Rouwendal2014) investigated the value of cultural amenities in cities in the Netherlands.
To date, most studies of the value of historical and cultural heritage sites have used contingent valuation. For example, Mourato, Kontoleon, and Danchev (Reference Mourato, Kontoleon and Danchev2002) used contingent valuation to estimate the average consumer's willingness to pay to preserve Bulgarian monasteries. They found that those cultural resources were well known by the population as evidenced by the fact that most visitation was due to interest in Bulgarian history and cultural heritage. As further evidence of the importance of these resources, Bulgarians, on average, attributed a significantly positive value (about 0.1 percent per capita in gross national product) to conservation and restoration of their Christian-Orthodox monasteries. In valuing a world heritage site in Morocco, Carson, Mitchell, and Conaway (Reference Carson, Mitchell, Conaway, Navrud and Ready2002) also used contingent valuation methods to examine tourists' willingness to pay a fee to help fund restoration and maintenance of the Fes Medina. That study acknowledged the benefits accruing to local residents, but its focus was clearly on visitors to the resource, which is common in prior studies.
Although most of the studies that estimated the value of cultural heritage sites were conducted in countries outside the United States, Morey et al. (Reference Morey, Rossmann, Chestnut, Ragland, Navrud and Ready2002) and Morey and Rossmann (Reference Morey and Rossmann2003) undertook studies in Washington D.C. to determine the value of reducing damage to marble monuments from acid deposition. Using choice experiments with a sample of residents from the Philadelphia and Boston metropolitan areas, they estimated the total value (combining the value of use and nonuse) of the cultural good. Their results indicated that households were willing to pay between $33 and $69 based on the preservation scenario presented to them. In a study related to the value of historical properties, Winfree, McCluskey, and Mittelhammer (Reference Winfree, McCluskey and Mittelhammer2006) examined properties purchased for historical and cultural reasons throughout the United States. The model used in the study is not hedonic in that it does not rely on market equilibrium in a housing market to measure the marginal value of the historic attributes through price appreciation of related parcels. Rather, data were collected on individual land transactions to see if characteristics of the land, including the value of future uses, drove the price associated with historic and open-space properties purchased by government agencies or foundations to some degree. Their results showed that the value of future uses not associated with preservation was the critical factor in determining price. This is further evidence that the market fails to capture the value of in situ services provided by historical and cultural resources.
Hedonic Methods for Valuing Spatial Amenities
This study uses the nonmarket valuation technique of hedonic analysis (Rosen Reference Rosen1974) and is, to our knowledge, the first application of this technique to valuing historical resources. The technique generally has not been used because few areas provide an adequate amount of spatial variation in historic and other urban amenities to identify the spillover benefits of in situ site services.
To understand the value of historic areas, it is important to consider carefully the benefits flowing from historic and cultural sites in those areas as they relate to other urban amenities such as open space. Some historical areas such as battlefields also deliver other attributes, most notably open space (an aesthetic amenity) while others, such as museums, do not. Consequently, a careful assessment of the geography must be undertaken to attribute benefits of spatial resources appropriately.
As noted in the literature on valuing urban amenities, the distinction between fixed open space and adjustable open space is important (Smith, Poulos, and Kim Reference Smith, Poulos and Kim2002, Irwin and Bockstael Reference Irwin and Bockstael2001). Historic areas are similar to open-space areas in general and to fixed open-space areas in particular. By fixed, we mean that an area's land uses are not likely to change over time, a category that includes parks, large bodies of open water, golf courses, and resource protection areas. Historic areas exhibit this same quality of constancy since it is highly unlikely that a national park, for example, will be converted to a different land use in the future. By contrast, adjustable open-space areas have adaptable land uses and include vacant and agricultural lands. While these areas may presently be considered open space, they have much greater potential for development in the near future. The three historic areas considered in this study have qualities consistent with fixed open space.
The value of a residential parcel is the capitalized value of all future services provided by the house. Consequently, the uncertainty associated with an adjustable open space's future provision of services has a smaller value than uncertainty associated with loss of services from fixed open space. For example, Irwin and Bockstael (Reference Irwin and Bockstael2001) in a study of the effects of open space found that the distinction between fixed and adjustable open space had a major impact in the hedonic model. As pointed out in Smith, Poulos, and Kim (Reference Smith, Poulos and Kim2002), fixed land uses should have a positive impact on property values, whereas adjustable land use's impact remains an empirical question. These two studies show that land uses perceived as fixed open space generate a positive value for private residential homes.
The importance of general equilibrium and sorting effects in housing markets has been studied using structural modeling approaches (see, for example, Klaiber and Phaneuf (Reference Klaiber and Phaneuf2010), Walsh (Reference Walsh2007), and Sieg et al. (Reference Sieg, Smith, Banzhaf and Walsh2004)) to deal with cases in which locally provided public goods are endogenously determined or localized supply constraints (due to changes in open space) induce endogenous price changes. As pointed out elsewhere (Irwin, Jeanty, and Partridge Reference Irwin, Jeanty and Partridge2014), these structural models can be quite useful but applicability depends on proper structural specification of the underlying objective functions of the decision-makers. The complexities of such models also tend to drive the resolution of the data set used. They often are applied at a spatially aggregated scale and therefore can mask highly localized effects of the spatial amenity of interest. For example, Walsh (Reference Walsh2007) aggregated housing and spatial features at a neighborhood level while Van Duijn and Rouwendal (Reference Van Duijn and Rouwendal2012) modeled choice alternatives at a city level.
In the same way that residing close to fixed open-space amenities can provide positive spillover benefits, we hypothesize that historic areas provide similar benefits to residential property owners. The benefits result from the residential parcel being located close to an amenity for which the owners do not directly pay. It is difficult to quantify all of the spillover benefits, but studies that have examined the effects of open space on property values have found positive benefits for residential parcels within specified proximity to open space areas (Geoghegan, Wainger, and Bockstael Reference Geoghegan, Wainger and Bockstael1997).
Econometric analyses employed to value historic areas present similar estimation problems. Irwin and Bockstael (Reference Irwin and Bockstael2001) examined problems associated with estimating the effects of open space using hedonic models. A problem arises because unobservable characteristics of housing parcels are likely correlated with nearby houses. In that case, the coefficients from classic regression analyses are biased. Spatial error models have been developed to account for heterogeneity of the error structure. In those models, the analyst must define the structure of the spatial problem by specifying a spatial weight matrix that defines how unobservable phenomena at one location impact outcomes in other locations.
Spatial heterogeneity is another problem encountered when analyzing geographically constructed data sets. Spatial heterogeneity occurs when there is no single relationship over the entire data set since parameters and even functional form can vary depending on where the property is situated (Anselin Reference Anselin1988). This often occurs in situations in which there are extreme demographic changes, such as in a model analyzing rich regions in the north and poor regions in the south (Anselin Reference Anselin1988). Simple ordinary least squares analyses are not accurate if spatial heterogeneity exists because the resulting coefficients are averages of the relationships across the entire data set rather than representing more-accurate distinct relationships that vary across space.
The Model
We extend the framework outlined in Smith, Poulos, and Kim (Reference Smith, Poulos and Kim2002) to include historical amenities. Consider an individual making choices regarding housing amenities associated with structural and community amenities (q) and fixed open-space, adjustable open-space, and historical areas (F, A, H), respectively. The individual's problem is to choose the housing attributes (q, F, A, H) and composite commodity (x) to maximize the individual's utility:
 $$U\lpar {x\comma\, {\rm} q\comma\, {\rm} f\lpar {F\comma\, {\rm} A\comma\, {\rm} H} \rpar\comma\, {\rm} H} \rpar$$
subject to
 $$m \ge x + p\lpar {q\comma\, {\rm} F\comma\,{\rm} A\comma\,{\rm} H} \rpar$$
where m is the individual's income and the function f (·) transforms various land-use types into open-space amenity-service flows. As Smith, Poulos, and Kim (Reference Smith, Poulos and Kim2002) pointed out, only A is directly affected by housing choices; F and H do not vary with future development and changes in land use.
The marginal value of an open-space amenity such as fixed open space is
 $$\displaystyle{{U_f} \over {U_x}} \,\displaystyle{{\partial f} \over {\partial F}} = \displaystyle{{\partial p} \over {\partial F}}$$
where U i is the partial derivative of the utility function with respect to the ith element. This condition shows that the amount the individual is willing to trade off for an additional housing amenity (like fixed open space) relative to the composite commodity must equal the ratio of the prices (where the price of x is normalized to 1).
While Irwin and Bockstael (Reference Irwin and Bockstael2001) and Smith, Poulos, and Kim (Reference Smith, Poulos and Kim2002) considered impacts on marginal values for open space when failing to differentiate adjustable open space from fixed open space (by aggregating over both types), we consider issues associated with failing to differentiate historic areas that provide open space from historic areas that do not. In this framework, we can specify the marginal value for historic areas as
 $$\displaystyle{{U_H} \over {U_x}} + \displaystyle{{U_f} \over {U_x}} \,\displaystyle{{\partial f} \over {\partial H}} = \displaystyle{{\partial p} \over {\partial H}}.$$
Historical amenities provide two types of benefits: (i) production of open space via the function f(·) and (ii) direct utility because of the value of historic resources. In addition, failing to differentiate historic areas from general definitions of open space by only allowing historic areas to enter the utility function via f(·) would lead to a mis-specified model. The estimation results would likely overstate the value of open space since premiums associated with sale prices of properties close to historic areas would be wholly attributed to open-space amenities.
Equations 3 and 4 outline the differences associated with historical areas relative to traditional open-space amenities, and a comparison reveals that the contributions of these two types of open space are equal (∂f/∂H = ∂f/∂F), providing insight into the empirical approach used in this study. We define fixed open space over several types of land use, including historical areas, to identify amenities of open space empirically. We then introduce another term in the regression that accounts for the historical amenities only. Since we have enough spatial variation to differentiate parcels that receive both historical and open-space amenities from a historical area from those that receive open-space services from nearby parks, golf courses, and resource protection areas, we can identify both of a historic area's contributions.
Our hedonic model is based on the premise that the value of a commodity is described by a bundle of valuable characteristics. For a residential property, those characteristics include structural features of the house, community characteristics, and spatial characteristics (e.g., spatial proximity to an amenity). Additionally, housing transactions are likely to be related spatially to other housing transactions. For example, parcels near a particularly unattractive building are likely to sell for less ceteris paribus. If the researcher is not aware of that factor and fails to account for potential correlation of the error term, the parameter estimates will be biased. We initially used ordinary least squares modeling but rejected it in favor of the spatial econometric approaches presented. To account for spatial dependence, we estimate the so-called spatial error model. Applying this to the hedonic framework, we can specify the hedonic regression as
 $${\bf p} = {\bf X}{\rm \beta} + {\rm \epsilon} $$
where p is an N × 1 vector of observed sale prices and X is an N × K vector of dependent variables comprised of structural, neighborhood, environmental, and historical characteristics of the parcel. To allow for spatial dependence, we define the error terms as ϵ = λWϵ + u. Notice that the error terms in the model are spatially related by way of the N × N spatial weight matrix (W) and that u is an N × 1 random error term distributed as N(0, σ2I N). λ governs the relationship of the spatial error structure. In the example of an unattractive building that reduces property values, the negative shock associated with the building likely spills over to all sales in its immediate vicinity, leading to an estimate of λ > 0.1.Footnote 1 Restricting λ to 0 yields the ordinary least squares model.
In our models, we allow both historical amenities and open-space amenities to enter the hedonic price equation as
 $$\eqalign{{\bf p} =&\,\, {\bf X}_s {\rm \beta} _s + {\rm \beta} _f {\min}\lpar {{\bi dist}_A\comma\, {\bi dist}_F\comma\, {\bi dist}_H} \rpar + {\rm \beta} _H {\bi dist}_H \cr & + \Sigma _{\,j \in A\comma\,F\comma\,H} {\rm \beta} _j ^A ({\bi dist}_j = = 0) + {\bf \epsilon}} $$
where we assume that a linear hedonic price equation is estimated. In this equation, Xs is a vector of structural and neighborhood characteristics, open-space services are a function of the three types of open space (fixed, adjustable, and historical), and distance to historical areas enters the hedonic price equation a second time because of the dual benefits afforded by historical areas. Spatial heterogeneity is introduced in the term
 $$\Sigma _{\,j \in A\comma\, F\comma\, H} {\rm \beta}_j^{A} \lpar {\bi dist}_j = = 0\rpar $$
where the marginal effect of being adjacent to an adjustable open space, fixed open space, or historical area is differentiated ( $\beta_j^A$ enters only if the distance to open-space-type j is zero). In applying this model, we tested numerous specifications that did not aggregate over the land types by way of the min function in equation 6 (to obtain parameter differences in adjacency and distance) and were surprised to find that the parameter estimates for the two types of open space differed little except for adjacency.
Setting and Data
The immediate vicinity of Williamsburg, Virginia, offers a plethora of historic sites well-known in the context of the American Revolution and founding of the first permanent English colony in the Americas. The area contains three major sites—Jamestown (the Virginia colony's first settlement), Yorktown (site of the siege of Yorktown and of British General Cornwallis' eventual surrender to George Washington), and Colonial Williamsburg (the first capital of Virginia and current site of re-enacted colonial life)—plus other smaller sites (e.g., the Wren Building at the College of William and Mary, the nation's oldest working farm and site of the Revolutionary War battle at Greensprings plantation, and numerous battlefields from the American Civil War). Both Jamestown and Yorktown are national parks and Colonial Williamsburg is a privately funded cultural site.Footnote 2 Connecting these sites is the 25-mile-long Colonial Parkway, a national scenic parkway maintained by the U.S. Park Service that follows the shores of the James and York Rivers near their confluence with Chesapeake Bay.
These sites provide interesting spatial variation in the types of historic and open-space services offered. For example, the Colonial Parkway offers vistas of two of Virginia's major rivers and portions of Chesapeake Bay, arguably providing more open-space amenities than historic ones. By contrast, Colonial Williamsburg is a large area of historic buildings with no automobile access where horse-drawn carriages can be seen alongside historical re-enactors practicing colonial methods of construction, ironwork, agriculture, and other daily activities.
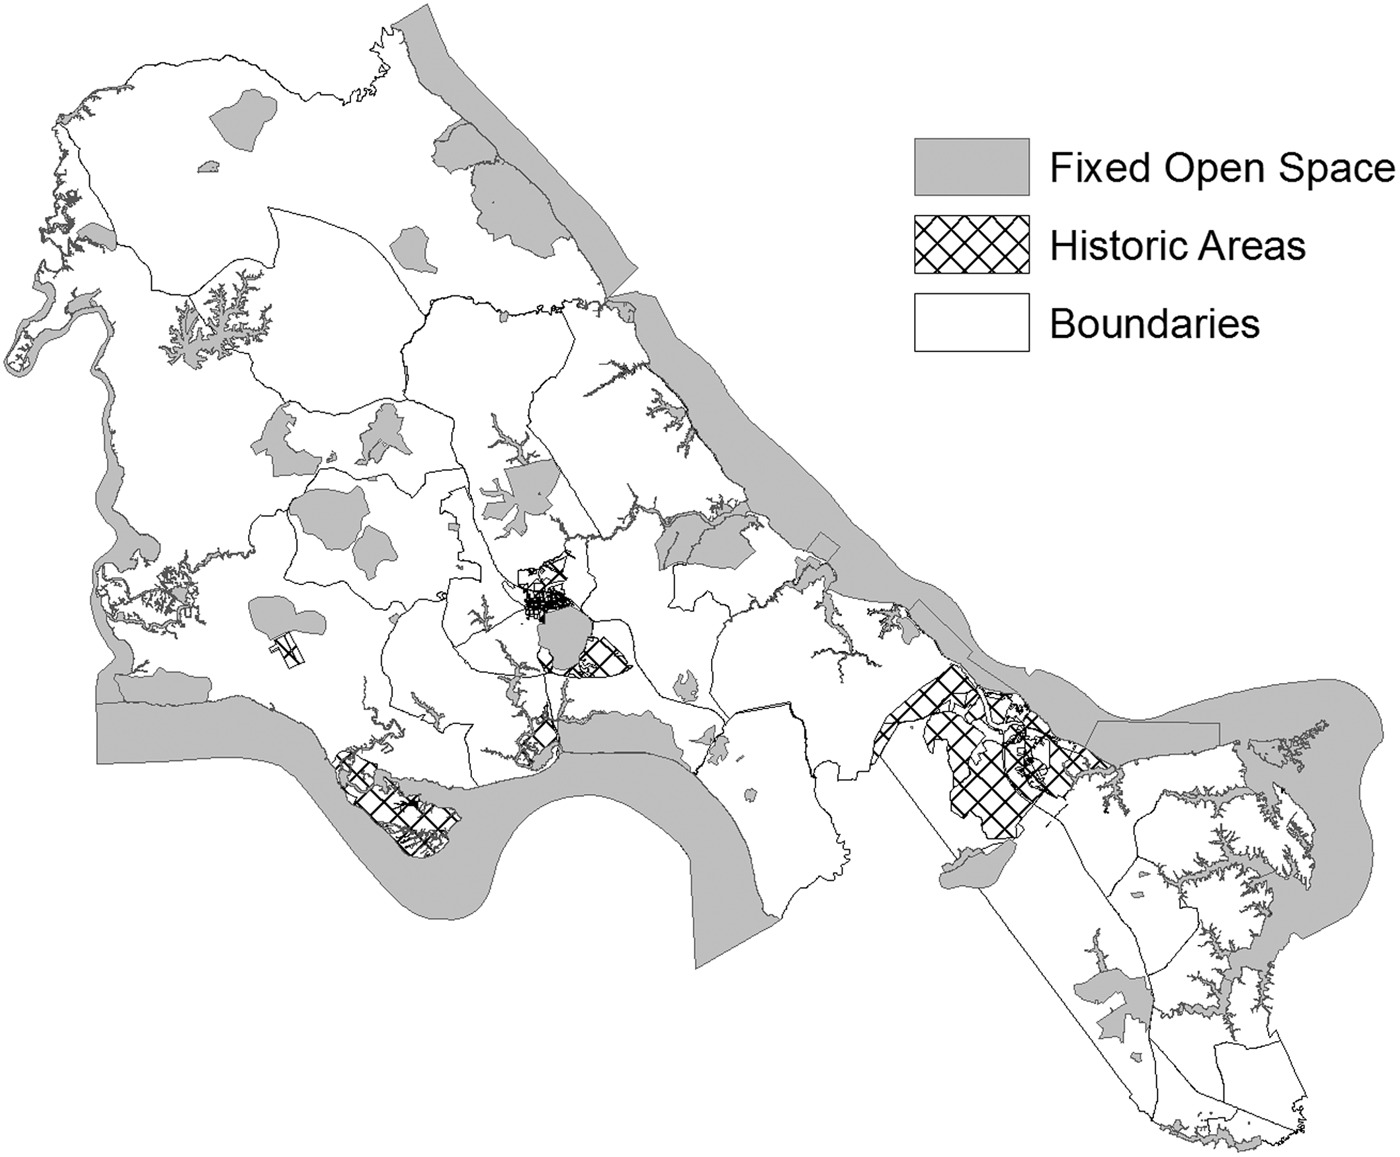
The study area lies in southeast Virginia and is comprised of three jurisdictions: York County, James City County, and the City of Williamsburg (see Figure 1). Land use varies considerably. Parts of James City County are largely agricultural; a large part of York County is occupied by the Yorktown Naval Weapons Station, CIA Camp Peary, and other government-owned property; and Williamsburg is a small city. In the past 30 years, large demographic changes have occurred. Overall, the population of Hampton Roads (the area south of the study area) increased by a little more than 42 percent. James City and York Counties are expected to grow faster than the rest of Hampton Roads over the next 30 years, increasing in population by 94 percent and 43 percent respectively. The City of Williamsburg's population is expected to grow by about 26 percent over the same period.Footnote 3 Interstate 64 and a major railroad spur run through the middle of the study area, making it an ideal place for commuters to Richmond and Newport News to reside.
Study Area

Our data set was confined to the jurisdictions of James City County, Williamsburg, and York County because (i) those areas defined the mid-peninsula housing market situated between Hampton Roads and Richmond and (ii) that market provided sufficient variation to ensure accurate hedonic and econometric analyses. A wide range of housing data was needed to explain variation in observed sale prices due to physical characteristics of the houses and other factors. This study used data provided by the mapping and assessment offices of York County, James City County, and City of Williamsburg. The coverage of the data varied because some of the departments were just beginning the transition to ArcView while others had completed the transition several years earlier. The data were current as of September 2003 for York and James City County and as of December 2004 for Williamsburg.
The housing data provided an extensive record of residential sales beginning in 1980. Parcels were included in the final data set only if they had been sold between January 1, 1998, and December 31, 2004.Footnote 4 Existing homes that were sold more than once during that period were included, and we used only the most recent transaction for each of those houses.
Most relevant housing variables were included in the analysis (e.g., number of bedrooms, number of bathrooms, year built, sale price, square footage, presence of central air conditioning, presence of a dock) but some potentially explanatory variables were omitted due to multicollinearity (e.g., the presence/number of fireplaces). The dependent variable in the model, sale price, was adjusted to 2004 dollars using a housing deflator provided by the U.S. Bureau of Labor Statistics.
The analysis also required construction of a data set relating parcels to spatial amenities. To accomplish this, we conducted a spatial analysis in ArcView. The ArcView shapefiles detailed areas of open water, resource protection areas, railroads, major roads, adjustable open space, historic areas, parks, airports, and fire stations. We calculated the minimum distance of each type of amenity from the parcels and included those distances in the statistical analysis to determine how proximity to a spatial amenity affects the overall sale price of a house.
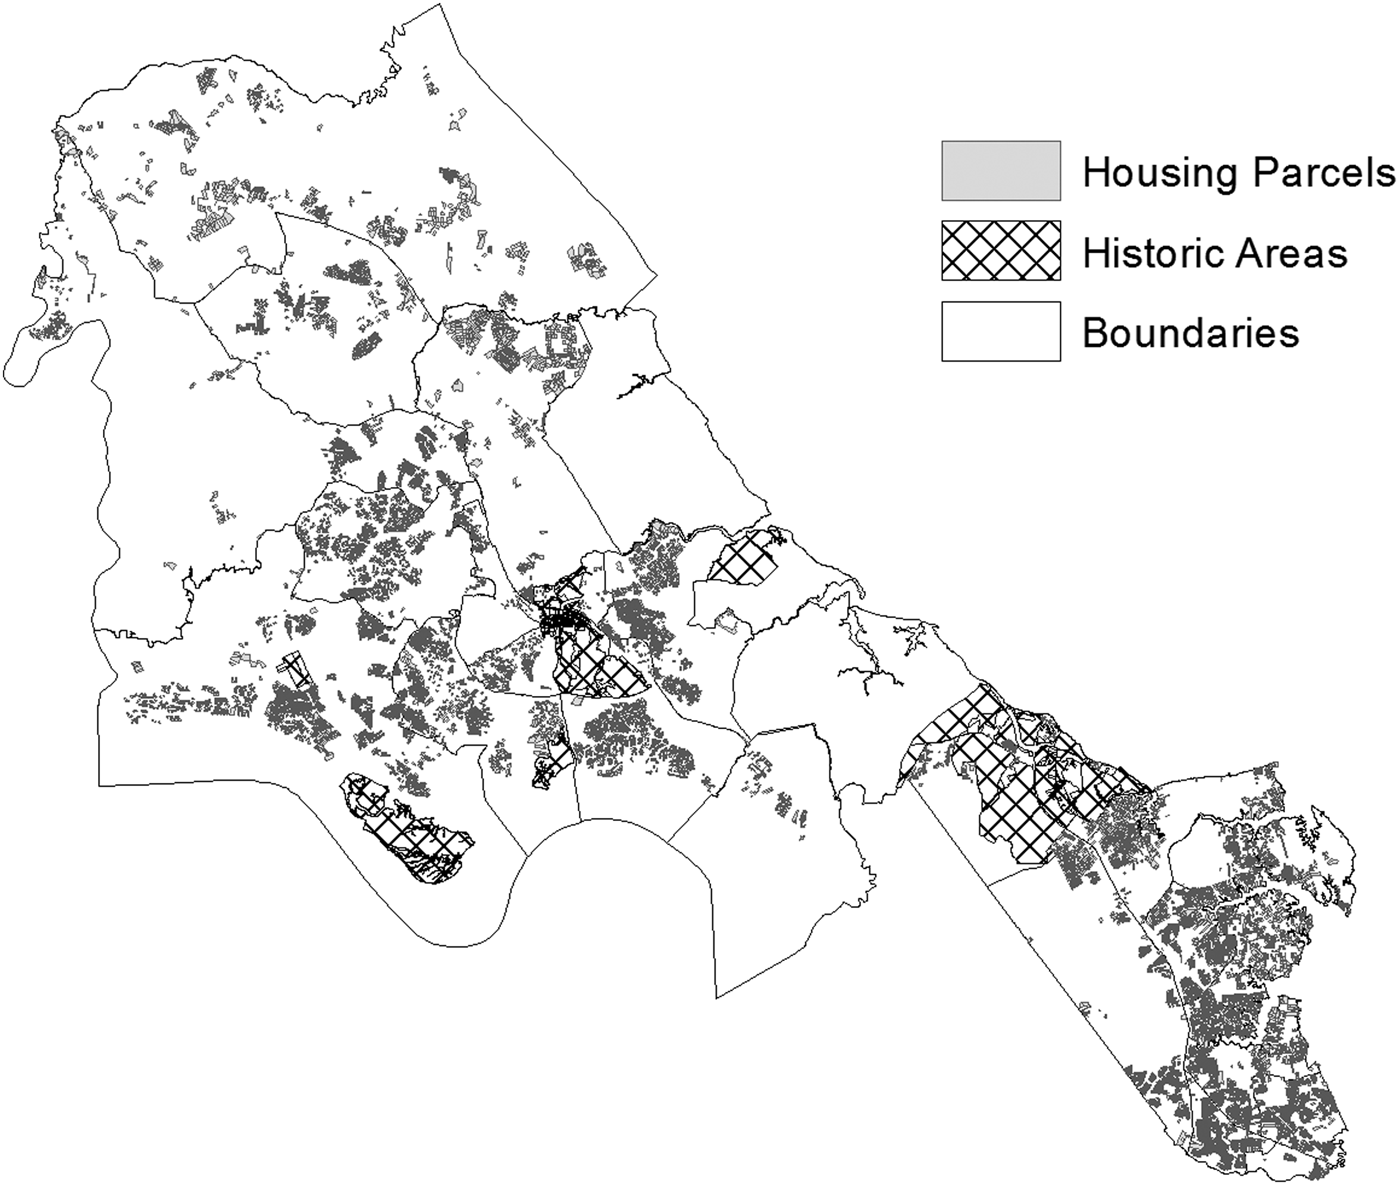
We needed to control for open space to differentiate consumer valuations for fixed open space, adjustable open space, and historic areas and followed the existing literature. Adjustable open space was defined as including vacant land, agricultural land, and developable acreage. We followed the recursive method introduced by Smith, Poulos, and Kim (Reference Smith, Poulos and Kim2002) to reconstruct annual valuations for adjustable open space beginning with parcels classified as adjustable open space in 2003 and creating new files for each prior year. The distance from a residential parcel to adjustable open space was calculated with a one-year time lag. So, for example, the distance to adjustable open space for a home sold in 2002 was calculated by measuring its distance to adjustable open space in 2001. This was done to account for property owners' likely expectations concerning development (see Figure 2).
Parcels and Historical Areas
We sought to maintain the delineation between fixed open space and adjustable open space because property owners likely had diverse valuations for such areas. Prior studies (e.g., Smith, Poulos, and Kim (Reference Smith, Poulos and Kim2002) and Irwin and Bockstael (Reference Irwin and Bockstael2001)) suggest that the coefficient on adjustable open space likely reflects ambivalent expectations of homeowners concerning development and that their expectations regarding the constancy of fixed land uses lead to higher valuations for fixed open space. The distance between a home and the nearest fixed open space was calculated by identifying discrete types of fixed land uses, including parks, large bodies of open water, and golf courses. Using a geographic information system (GIS) analysis, we also calculated adjacency measures for these land-use types.
The study analyzed 12,337 residential parcels. Apartments, duplexes, carriage homes, condominiums, and townhouses were excluded from the analysis. The average sale price was $199,310 in 2004 dollars and ranged from $10,868 to $999,787. The average home was built in 1988. The number of bedrooms ranged from 1 to 10 with the average falling at 3.3. Williamsburg contributed the smallest share of parcels, 4 percent (830), and the smallest number and proportion of residential properties. The largest share of parcels came from York County (50 percent), followed closely by James City County (46 percent).
Results
To estimate the value of historic areas from a homeowner's perspective, we estimated numerous models involving different assumptions about how people value open-space amenities. We originally planned to differentiate the source of open-space amenities into uses such as parks, resource protection areas, golf courses, adjustable open space, and historic areas. However, after identifying coefficients for those land uses, we noted an unexpected degree of homogeneity across uses with respect to proximity. When considering adjacency, we found significant heterogeneity across open-space types. Thus, in the final models, we aggregated land-use types with respect to proximity (measured by distance) and disaggregated with respect to adjacency, which was defined as two parcels sharing a common border, for land-use types.Footnote 5
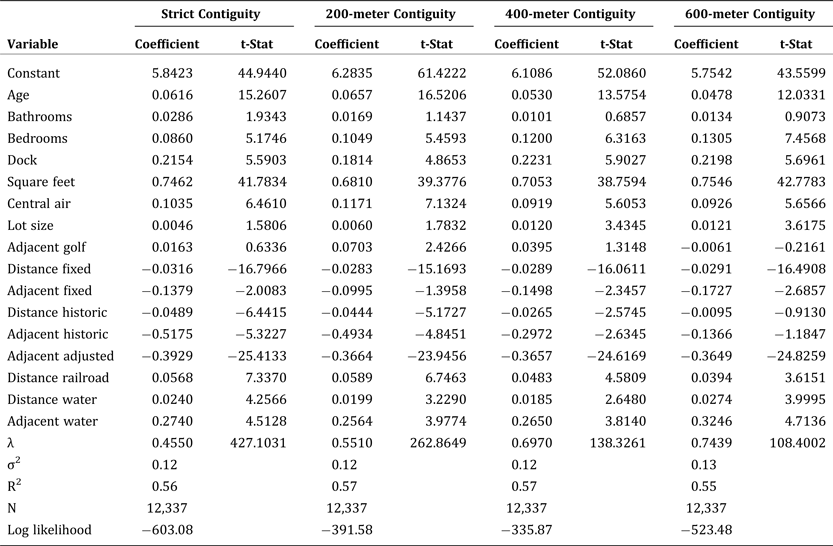
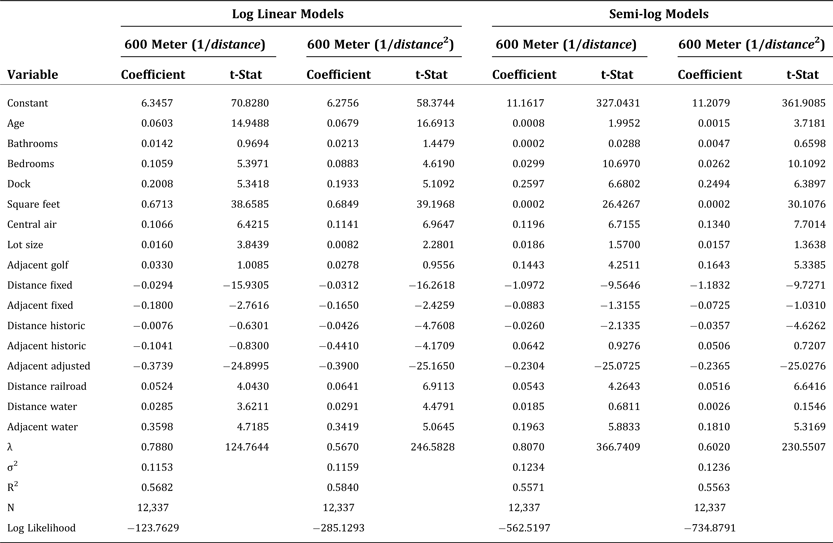
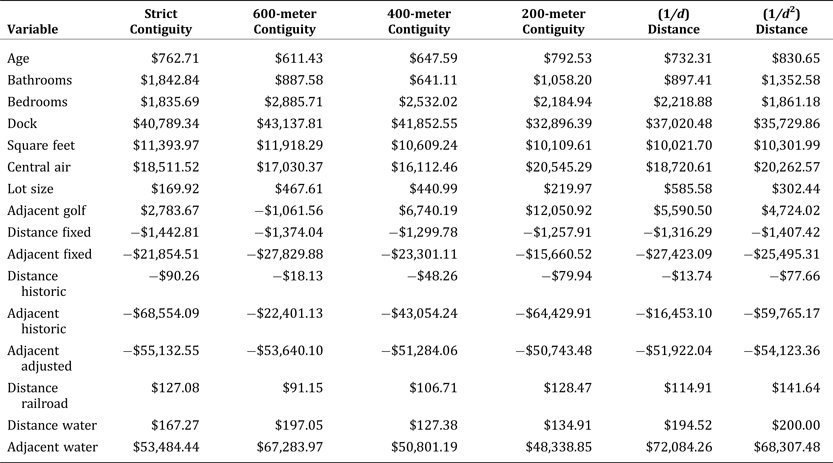
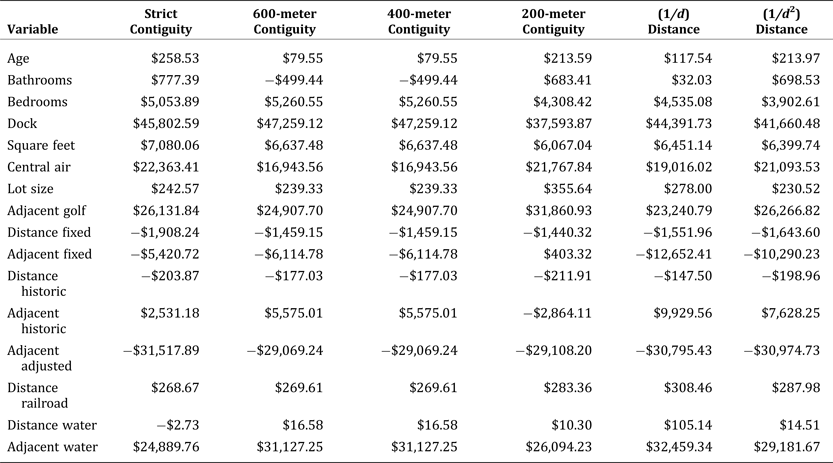
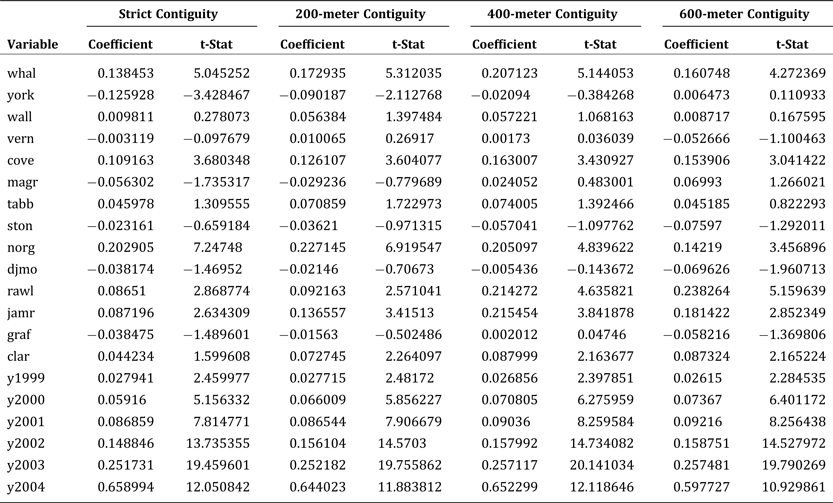
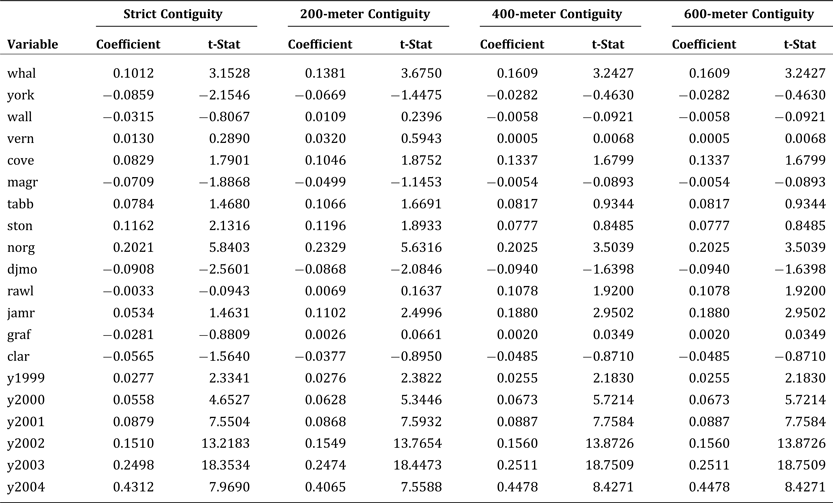
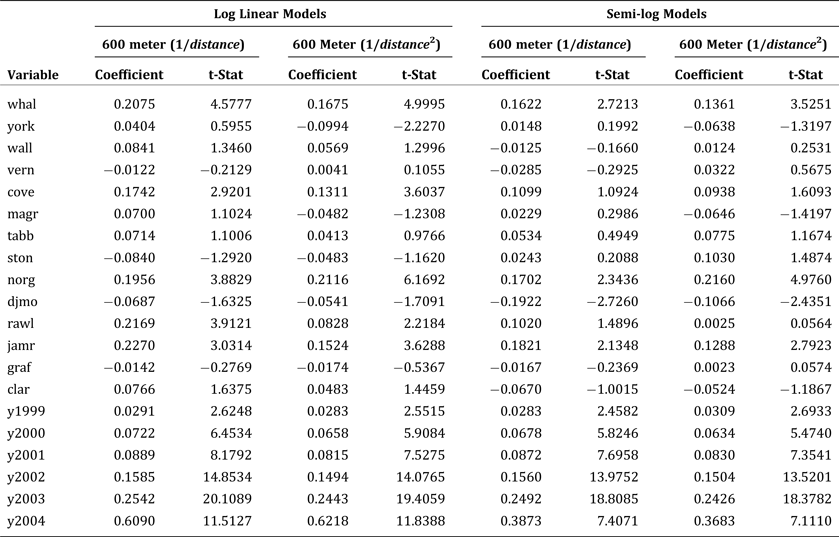
Tables 1, 2, and 3Footnote 6 show results for the models that differed solely in the assumptions regarding the functional form (log linear or semi-log) and spatial weighting matrix (contiguity and distance-based). For the contiguity-based weight matrices, we defined the elements as equal to 1 if a parcel was within a specified distance of another parcel and zero otherwise.Footnote 7 The distances were defined as strict contiguity (parcels shared a common border so the distance is zero) and distances of 200, 400, and 600 meters. All parcels within the specified distance were assumed to affect the given parcel's hedonic price function equally and with equal weight. We also considered two distance-based weight matrices that allowed all parcels within 600 meters to have declining influence on the given parcel by defining the elements as 1/d ij and 1/d 2ij where d ij is the distance between the parcels. We assumed that there was no spatial dependence in the errors for parcels more than 600 meters away and therefore set d ij = 0 for those parcels.
Log Linear Models with Contiguity-based Spatial Weight Matrices
Semi-log Models with Contiguity-based Spatial Weight Matrices
Models with Distance-based Spatial Weight Matrices
The results generally confirmed our hypotheses for the structural, neighborhood, and spatial classes of attributes. For example, larger houses in terms of square feet and number of bedrooms tended to sell for higher amounts. Similarly, houses with docks and central air conditioning systems garnered price premiums. In most of the models, the coefficients on the size of the lot and number of bathrooms had the expected signs but were not significantly different from zero. Standardized coefficient estimates are provided in Tables 4 and 5. For each structural characteristic, we computed a baseline sale price and a new sale price in response to the given change in the characteristic of interest.Footnote 8 An additional bedroom was worth approximately $2,000 and an additional 200 square feet was worth $6,000 to $11,000. The presence of a dock was the single most valuable structural amenity, reflecting the Williamsburg area's emphasis on boating and access to navigable waterways.Footnote 9
Estimated Price Changes for Log Linear Models
Estimated Price Changes for Semi-log Models
Increasing distance to fixed open-space amenities led, on average, to lower sale prices. Even a small increase in distance led to a large decrease in the average house's sale price ($1,400 to $2,000). Thus, being located near a fixed open space is considered a benefit. Being adjacent to a fixed open space (a golf course, resource protection area, or park) had a slight negative effect on home sale prices that was not significant. As expected, houses farther from railroads were associated with higher sale prices ($150 to $250). Being close to water was also a positive amenity even after controlling for parcels that were adjacent to water (which command tens of thousands of dollars more). The only adjacency measure that was significant in all of the models was adjustable open space. Parcels abutting an adjustable open space sold for an average of $30,000 to $50,000 less than similar nonadjacent parcels.
Companion for Table 1
Companion for Table 2
Companion for Table 3
Being located adjacent to a historic area had no significant effect on sale prices. As with adjacency to fixed open spaces, some buyers may consider a shared border with a historic area as a disamenity, perhaps because of heavy tourist traffic (from both pedestrians and cars). Decreasing distance from the average parcel to a historic area when controlling for fixed open-space amenities led to higher sale prices ($50 to $200). While the gains from service flows generated by all forms of fixed open space (including historical areas) are modest, these results show that proximity to historical and cultural amenities yields benefits unrelated to provision of open space.
The models we estimate demonstrate the robustness of our core finding that historic areas provide economic benefits to nearby residents. In addition, when we consider the results for all other parameters (excluding historical and open space amenities), we find a remarkable degree of consistency across models.Footnote 10 The differences are in the magnitudes of the coefficients, the signs, and the significance levels. When we focus on the set of models that are most consistent with prior studies (strict contiguity, 200-meter contiguity, and 1/d 2 weight matrices), the results are even more robust in terms of estimating the value of historical and other spatial amenities.
Conclusion
This study is the first to demonstrate economic benefits from local historical and cultural resources beyond drawing visitors to historic sites, and the results confirm that owners of nearby residential properties also benefit from historic amenities. Quantification of these benefits using revealed-preference nonmarket valuation techniques is an important step in addressing the public-policy problem of prioritizing and choosing appropriate levels of historic preservation. Our results show that, for historic areas such as Williamsburg, Virginia, policies should consider the benefits provided by both open space and historical resources to account fully for the flow of services.
We find significant spatial dependence in the error structure in our model, a problem that is common when analyzing spatial amenities. The ordinary least squares model was rejected in all of the specifications considered. By using several types of spatial weighting matrices, we determine that historic amenities are valuable resources for homebuyers and that the amenity value is not particularly sensitive to specification of the functional form or the error structure. Our results also confirm the presence of spatial heterogeneity in estimating the value of historic areas. In particular, the average homeowner does not consider sharing a border with a historic area as beneficial but does value living near one. This result is consistent with the large volume of visitors and traffic associated with historic sites in the Williamsburg area at certain times of year.
By carefully considering the services offered by historic areas, we isolate the marginal value of the flow of services solely from historical amenities from other types of amenities such historic areas may also provide, such as open space. We find weak evidence that properties adjacent to a historic area are valued less by buyers, indicating that living in a tourism district is viewed as a disamenity. We find strong evidence that buyers value living near a historical area rather than directly next to one.


 Open access