


Nomenclature
- ADP
-
Aerodynamic Design Point
- AUSM+ FVS
-
Advection Upstream Splitting Method, Flux Vector Splitting
- BPR
-
Bypass Ratio
- BWB
-
Blended Wing Body
- ${C_D}$
-
Drag Coefficient
- CFD
-
Computational Fluid Dynamics
-
${C_L}$
-
Lift Coefficient
- CRM
-
Common Research Model
- CST
-
Class-Shape Transformation
- DoE
-
Design of Experiments
- EI
-
Expected Improvement
- EOC
-
End of Cruise
- ERA
-
Environmentally Responsible Aviation
- ESP
-
Engineering Sketch Pad
- FEM
-
Finite Element Modelling
- FLOPS
-
Flight Optimization System
- FPR
-
Fan Pressure Ratio
- HPCPR
-
High Pressure Compressor Pressure Ratio
- HT
-
Horizontal Tail
- ICAO
-
International Civil Aviation Organization
- ITD
-
Integrated Technology Demonstrations
-
$L/D$
-
Lift-over-Drag ratio
- LPCPR
-
Low Pressure Compressor Pressure Ratio
- MDP
-
Multi-Design Point
- MIT
-
Massachusetts Institute of Technology
- MUSCL
-
Monotonic Upstream-centered Scheme for Conservation Laws
- NASA
-
National Aeronautics and Space Administration
- NPSS
-
Numerical Propulsion System Simulation
- OPR
-
Overall Pressure Ratio
- PRSEUS
-
Pultruded Rod, Stitched, Efficient, Unitized Structure
- RANS
-
Reynolds-Averaged Navier Stokes
- SLS
-
Sea-Level-Static
- SOC
-
Start of Cruise
- SST
-
Shear Stress Transport
- TKO
-
Takeoff
- TOC
-
Top of Climb
- TNW
-
Tube-and-Wing
- TSFC
-
Thrust Specific Fuel Consumption
- VT
-
Vertical Tail
- WATE
-
Weight Analysis of Turbine Engine


1. Introduction
The aviation sector avidly seeks novel approaches for increasing fuel efficiency to lower operational costs and meet emissions reduction targets. The International Air Transport Association has set a target to halve net aviation carbon dioxide emissions by 2050 relative to 2005 levels [1]. Of the numerous ideas put forward by industry and academia for sustainable aviation, the blended wing body (BWB) concept targets the fundamental performance deficiencies of the ubiquitous tube-and-wing (TNW) configuration. The TNW primarily produces lift through its wings, with the fuselage being a rather inefficient lifting body with a meagre lift-over-drag ratio ( $L/D$
). In contrast, the entire BWB airframe is a lifting surface, making it more aerodynamically efficient than the TNW. Furthermore, the BWB’s gradual blend of wing and body, lack of an empennage, and smaller wetted area decrease drag relative to a TNW of similar passenger capacity. An additional benefit of the BWB is the ability to mount engines above the airframe, which has the potential to increase aerodynamic efficiency, reduce noise emissions by shielding engine noise [Reference Hooker and Wick2–Reference Guo, Burley and Thomas4], and allow for higher bypass ratio engines with increased propulsive efficiency [Reference Hall and Crichton5].
$L/D$
). In contrast, the entire BWB airframe is a lifting surface, making it more aerodynamically efficient than the TNW. Furthermore, the BWB’s gradual blend of wing and body, lack of an empennage, and smaller wetted area decrease drag relative to a TNW of similar passenger capacity. An additional benefit of the BWB is the ability to mount engines above the airframe, which has the potential to increase aerodynamic efficiency, reduce noise emissions by shielding engine noise [Reference Hooker and Wick2–Reference Guo, Burley and Thomas4], and allow for higher bypass ratio engines with increased propulsive efficiency [Reference Hall and Crichton5].
One of the early comprehensive studies on the BWB was conducted in the late 1990s as a collaboration among Boeing, NASA, and university partners [Reference Liebeck, Page and Rawdon6]. It focused on a BWB featuring boundary layer ingesting engines with a passenger capacity of 800, a range of 7,000 nmi, and a cruise speed of Mach 0.85. The study showed a 15% reduction in takeoff weight, a 27% reduction in fuel burn, and a 20% higher $L/D$
compared to a conventional TNW sized for the same payload and range. Boeing conducted a follow-up study in the early 2000s [Reference Liebeck7], where the Boeing BWB-450 was designed for a reduced payload of 468 passengers with a 7,750 nmi range, more in line with market forecast data. This concept used pylon-mounted engines to reduce the technological risk. Compared to the Airbus A380-700 for the same payload and range, the BWB-450 showed an 18% reduction in takeoff weight and a 32% reduction in fuel burn per seat. These promising results would encourage future studies into the BWB as the next evolution in commercial passenger aircraft.
$L/D$
compared to a conventional TNW sized for the same payload and range. Boeing conducted a follow-up study in the early 2000s [Reference Liebeck7], where the Boeing BWB-450 was designed for a reduced payload of 468 passengers with a 7,750 nmi range, more in line with market forecast data. This concept used pylon-mounted engines to reduce the technological risk. Compared to the Airbus A380-700 for the same payload and range, the BWB-450 showed an 18% reduction in takeoff weight and a 32% reduction in fuel burn per seat. These promising results would encourage future studies into the BWB as the next evolution in commercial passenger aircraft.
The Silent Aircraft Initiative studies by Cambridge University-MIT in the mid-2000s focused on designing a BWB concept to reduce noise and carried a design payload of 215 passengers. Featuring embedded boundary layer ingesting engines, the resulting design had a roughly 25% improvement in passenger miles flown per gallon of fuel compared to existing commercial aircraft [Reference Hileman, Spakovszky, Drela and Sargeant8], although the reference aircraft were not identical in terms of payload and range. This aircraft would then become the starting point of the work conducted by Boeing and NASA in the late 2000s to design realistic BWB aircraft that significantly reduced noise and fuel burn with technologies projected to be available in 2020; these would become the N2A and N2B [Reference Kawai9]. The N2A had podded engines whereas the N2B retained the boundary layer ingesting engines from its predecessor. Both aircraft had a maximum payload of 103,000 lb, a range of 6000 nmi, and a cruise speed around Mach 0.8 [Reference Kawai9]. The N2A achieved a 29% reduction in fuel burn and the N2B achieved a 25% reduction in fuel burn compared to the A330-200FX conventional TNW freighter [Reference Kawai9].
In more recent work, researchers from Delft University of Technology compared optimised BWB and TNW designs for the same design requirements [Reference Brown and Vos10]. They designed three BWB baselines for 150, 250, and 400 passengers, then optimised them using an in-house program. The TNWs were designed based on specifications from the A320-300, B767-300ER, and B777-300 and then optimised with the same program. They compared the aerodynamic performance of the BWB and TNW aircraft using low-fidelity semi-empirical methods for drag prediction coupled to a vortex lattice solver. Their results showed the BWB having a 12–23% higher aerodynamic efficiency for the 250 and 400-passenger categories. No mission analysis was conducted to estimate fuel burn. Around the same time, DZYNE Technologies Inc. published papers regarding their design of the Ascent 1000, a 112–120 passenger BWB for regional jet markets with a design range of 3,200 nmi [Reference Yang, Page and Smetak11, Reference Page, Smetak and Yang12]. The Ascent 1000 claims an over 60% fuel burn reduction and an 80% emissions reduction compared to the 2005 best-in-class ERJ-190 regional jet [Reference Yang, Page and Smetak11]. The current state-of-the-art BWB, encapsulating the past three decades of BWB design experience and knowledge, is the concept proposed by JetZeroFootnote 1 . Their planned entry into service is in the 2030s, with a full-scale demonstrator scheduled to take flight in 2027. The aircraft is intended to fill the same niche as the Boeing 767 and is claimed to reduce fuel burn by about 50%Footnote 2 .
All previous work demonstrates that the BWB is likely to outperform the TNW and is a rather promising solution for a greener future. However, the unique configuration itself poses certain challenges. For instance, scaling the airframe for a family of aircraft with different payload capabilities is not as straightforward as it is for a TNW, where the fuselage can just be extended or shortened [Reference Liebeck13]. Similarly, the non-circular cross-section of the BWB centrebody and its associated cabin pressurisation requirements necessitate advances in composite materials research to produce lightweight materials that are able to withstand the unique loading conditions of the BWB. [Reference Liebeck7, Reference Velicki and Thrash14] As a consequence of the structural material requirements and non-circular shape, there are also manufacturing challenges associated with the BWB, which require new equipment and processes, and thus a significant upfront expenditure and workforce training for an airframe manufacturer. The BWB concept is also more challenging to analyse than conventional TNW aircraft, especially at the conceptual level owing to the lack of historical data that has benefited TNW conceptual design over the years. For example, drag build-up and 2D or strip type methods commonly employed for TNWs are not adequate for BWBs, missing the unique flow physics of the BWB, like 3D relief, potentially leading to a drastic misestimation of drag. [Reference Liebeck7, Reference Roman, Alien and Liebeck15–Reference Wakayama and Kroo17] Navier Stokes solvers have been proposed as a well-suited option for this configuration [Reference Roman, Alien and Liebeck15]. The lack of an empennage also makes stability and control more important for BWBs at the conceptual level, especially when designing the internal layout and planform outline.
Focussing solely on conceptual level vehicle performance however, a few deficiencies in past work warrant a fresh look at the performance comparison between the BWB and the TNW. For starters, the early work by Boeing-NASA on the BWB looked at passenger capacities that are no longer as relevant in today’s market. Although later work looked at smaller passenger capacities, many failed to provide an equivalent comparison between the BWB and the TNW by enforcing the same payload-range requirements, optimizing both airframes, and considering similar levels of technology on the airframe/propulsion system. Also, the impacts of the configuration change, i.e. the difference in performance solely due to the airframe change, for the same engine, were not quantified in these past studies. Detailed mission analysis and high-fidelity aerodynamics modelling were also missing in some previous efforts. Many early BWB studies also included boundary layer ingesting engines which favoured performance, but this technology is unlikely to mature sufficiently to be featured on aircraft by 2030. This study addresses the aforementioned shortcomings and provides the latest perspective on quantifying the benefit of the BWB configuration over the TNW. Specifically, this study looks at payloads, ranges, and technologies in line with the industry’s vision for 2030. The following section outlines the work plan.
2. Problem formulation
The primary objective behind this study is to quantify the performance benefit of the BWB configuration over a conventional TNW. Specifically, the aerodynamic efficiency of an optimised BWB airframe to an optimised TNW airframe is compared at the same Mach number and altitude that best represents cruise conditions for both. A mission analysis is also performed and system-level metrics like block fuel and ramp weight between the two aircraft configurations are compared.
A common design and analysis procedure for both aircraft is established to accomplish these tasks and provide a fair comparison between the two vehicles. A baseline geometry is designed for both airframes, discussed in Sections 3.1 and 3.2. The airframes are sized to accommodate 225 passengers, in a three-class layout, and carry enough fuel for a 5,000 nmi design mission followed by a 200 nmi reserve mission. The nacelles and pylons are not included in either geometry, but their drag contributions and interference effects are estimated separately and included in the mission analysis. Subsequently, both geometries are optimised using computational fluid dynamics (CFD) to improve their aerodynamic performance, as discussed in Section 3.4. Following this step, aerodynamic data are generated to form mission drag polars for each optimised geometry, as discussed in Section 3.5. These mission polars are a set of drag polars spanning the expected operating envelope of both vehicles.
For mission analysis, an engine model is also defined for each vehicle. To isolate the impacts of the TNW to BWB airframe change on the performance metrics, the same engine must be used on both vehicle models. This implies an engine that is identical in all respects, i.e. in mechanical and thermodynamic characteristics. Any differences in cycle, engine lapse rate, component design and weight, and thrust class will influence the performance disparity between the two vehicles, thus making it harder to isolate the airframe’s contributions. As such, a common engine model is developed that is suitable to power both configurations throughout their design mission without severely compromising the performance of either concept. This engine design process is discussed in Section 3.6. The authors also acknowledge the criticism that a common engine for both the TNW and BWB is unlikely to be optimal for either. To get the best possible performance for each configuration, the engine should be re-sized and the cycle should be re-designed to best match the airframe. As such, another comparison point between the two vehicles is included, where the engine is specifically optimised for each configuration. The engine design process for this comparison is also presented in Section 3.6.
Once the engine and aerodynamics models are complete, mission analysis is conducted for both the BWB and TNW, as presented in Section 3.7. Two variants of the TNW are modelled in our mission analysis with different structural materials to represent different technology levels. The mission assumptions and modelling fidelity are ensured to be consistent to avoid any biases in the comparison. In addition to comparing block fuel and gross weight for the design mission, a shorter economic mission of 900 nmi is also considered. Weight breakdowns of the aircraft are also compared. Section 4 presents and discusses these results in detail.
3. Methodology
The following section goes over the development of both baseline airframes. Details on the aerodynamic modelling, optimisation strategy, and drag polar generation are also presented. The engine design that will be used for both configurations is discussed. Finally, the system analysis procedure is outlined, which will provide the key results of our comparison.
3.1 Blended wing body baseline development
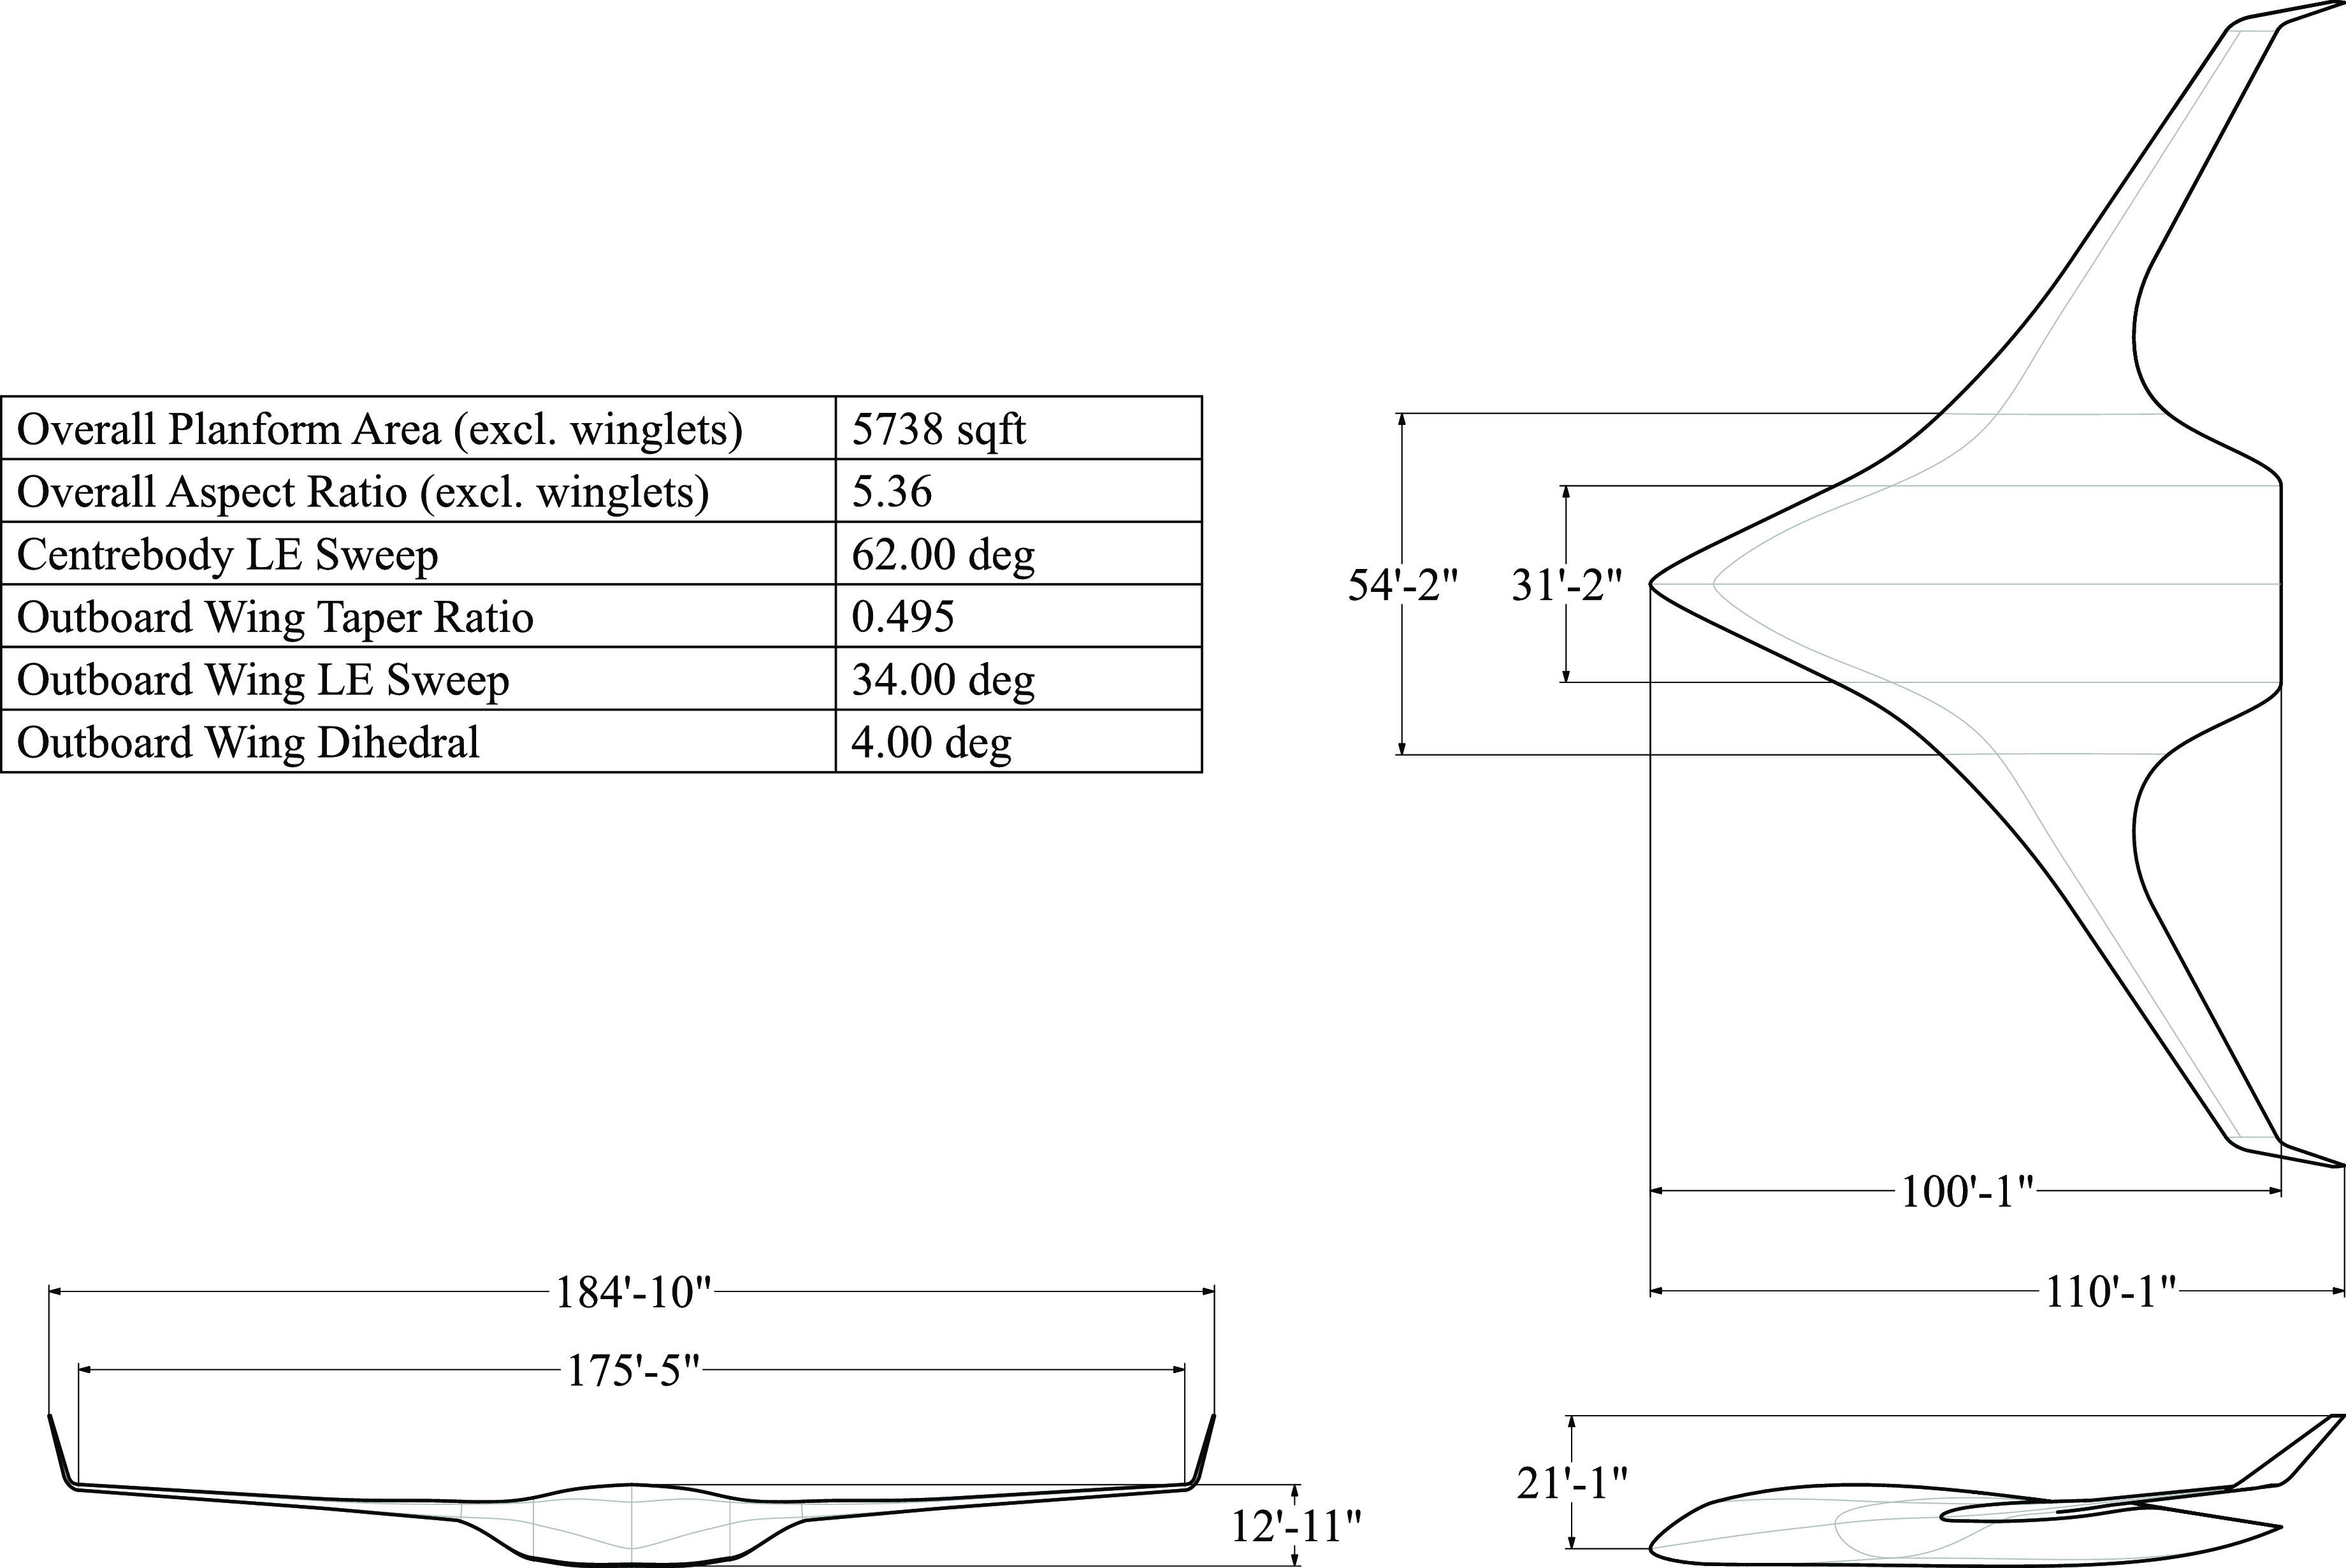
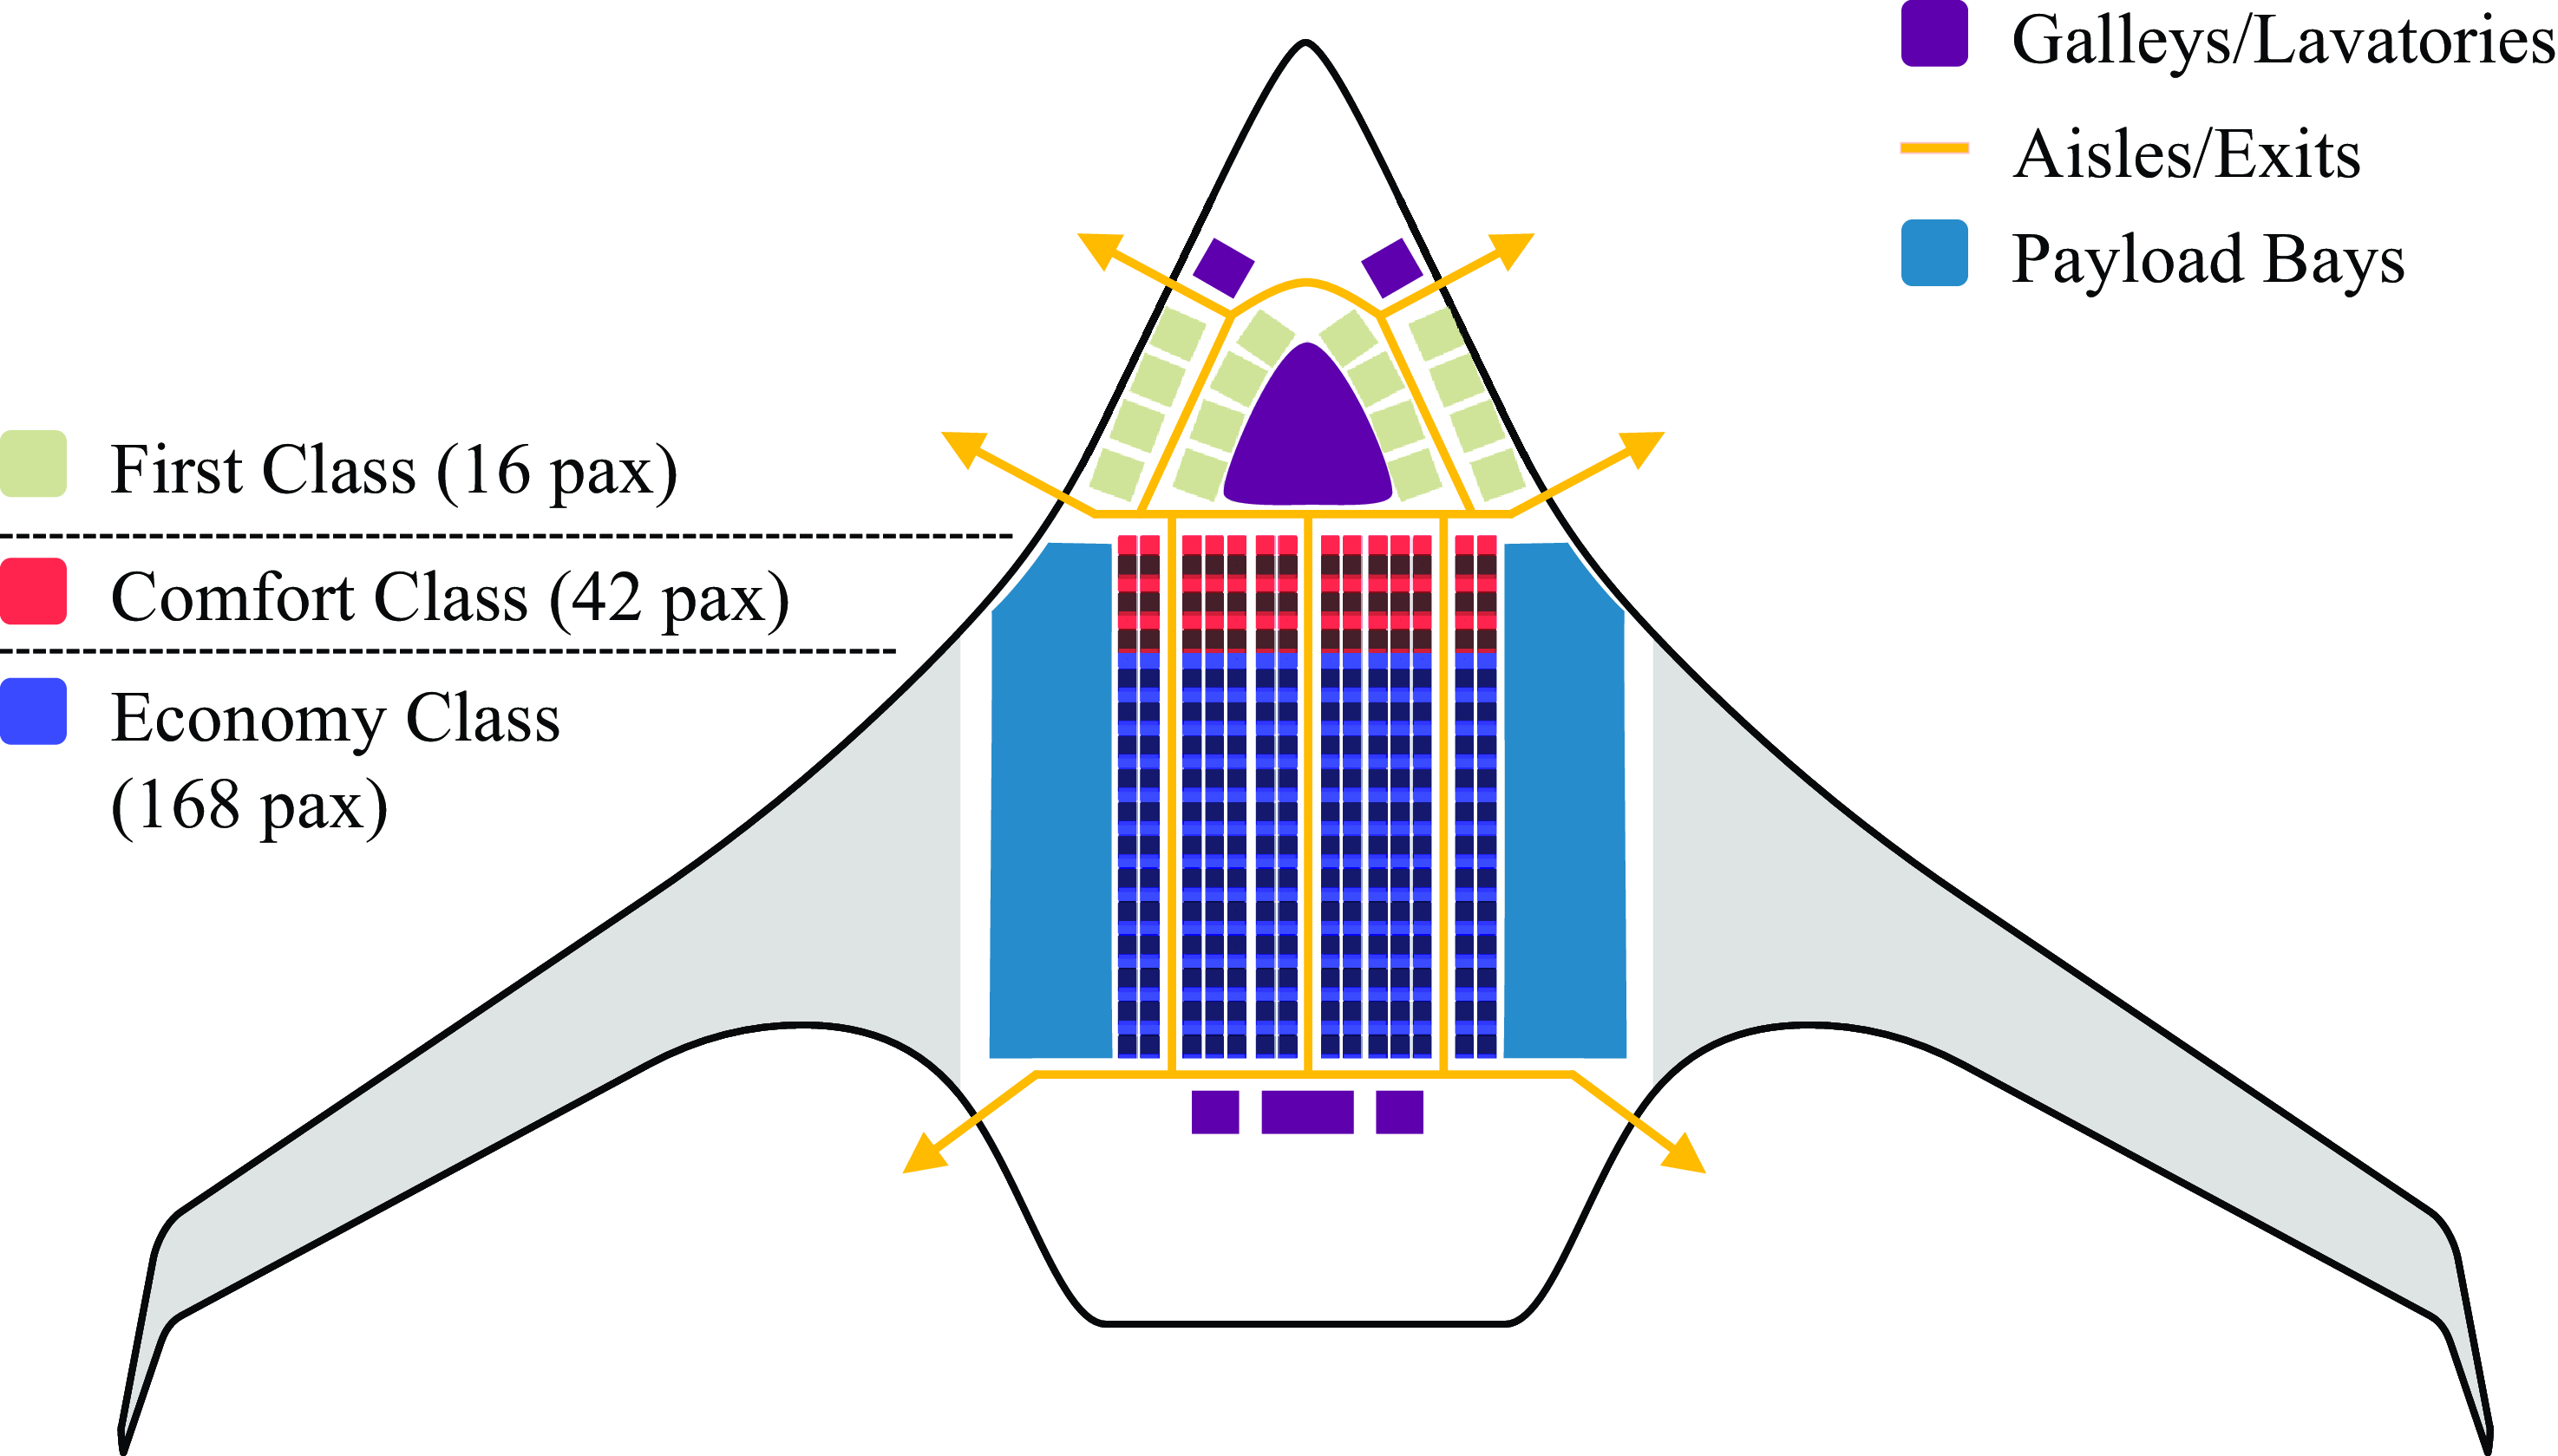
As outlined previously, the BWB concept has been studied for decades, but a full-scale prototype has yet to be manufactured and flown. Therefore, the current BWB baseline is derived from recent concepts in the literature. This design takes inspiration from JetZero’s aircraft concept as it represents the latest development of BWB technology and is arguably the closest to a physical demonstrator. Figure 1 presents our BWB baseline geometry as well as some key geometric information. This geometry is parametric and was created using Engineering Sketch Pad (ESP), an open-source geometry modelling tool [Reference Haimes and Dannenhoffer18]. The internal volume of the vehicle is sufficient to carry 225 passengers in a three-class layout with luggage stored in LD-2 containers carried within the shoulders of the aircraft, i.e. the transition regions between the centrebody and the wing, as shown in Fig. 2. The overall planform outline is loosely based on images, press releases, and news articles,Footnote 3
,
Footnote 4 that were available in the public domain at the time of writing. The shape of the centrebody is created with an intricate set of splines whereas the wing aerofoil stack is parameterised with the class/shape transformation (CST) method [Reference Kulfan19]. The SAX-40 [Reference Hileman, Spakovszky, Drela and Sargeant8] published aerofoils and twist distribution are used to establish the baseline wing and winglet shapes. The wing twist was then further adjusted manually to initialize the aerodynamic optimisation process with a solution having a higher $L/D$
.
$L/D$
.
Baseline blended wing body aircraft inspired by recent aircraft concepts.
Notional internal layout for the current BWB baseline aircraft.
3.2 Tube and wing baseline development
The TNW baseline geometry is notionally inspired by a Boeing 767-300ER. This aircraft, using the “76Z” three-class seat layout from Delta Air Lines,Footnote
5
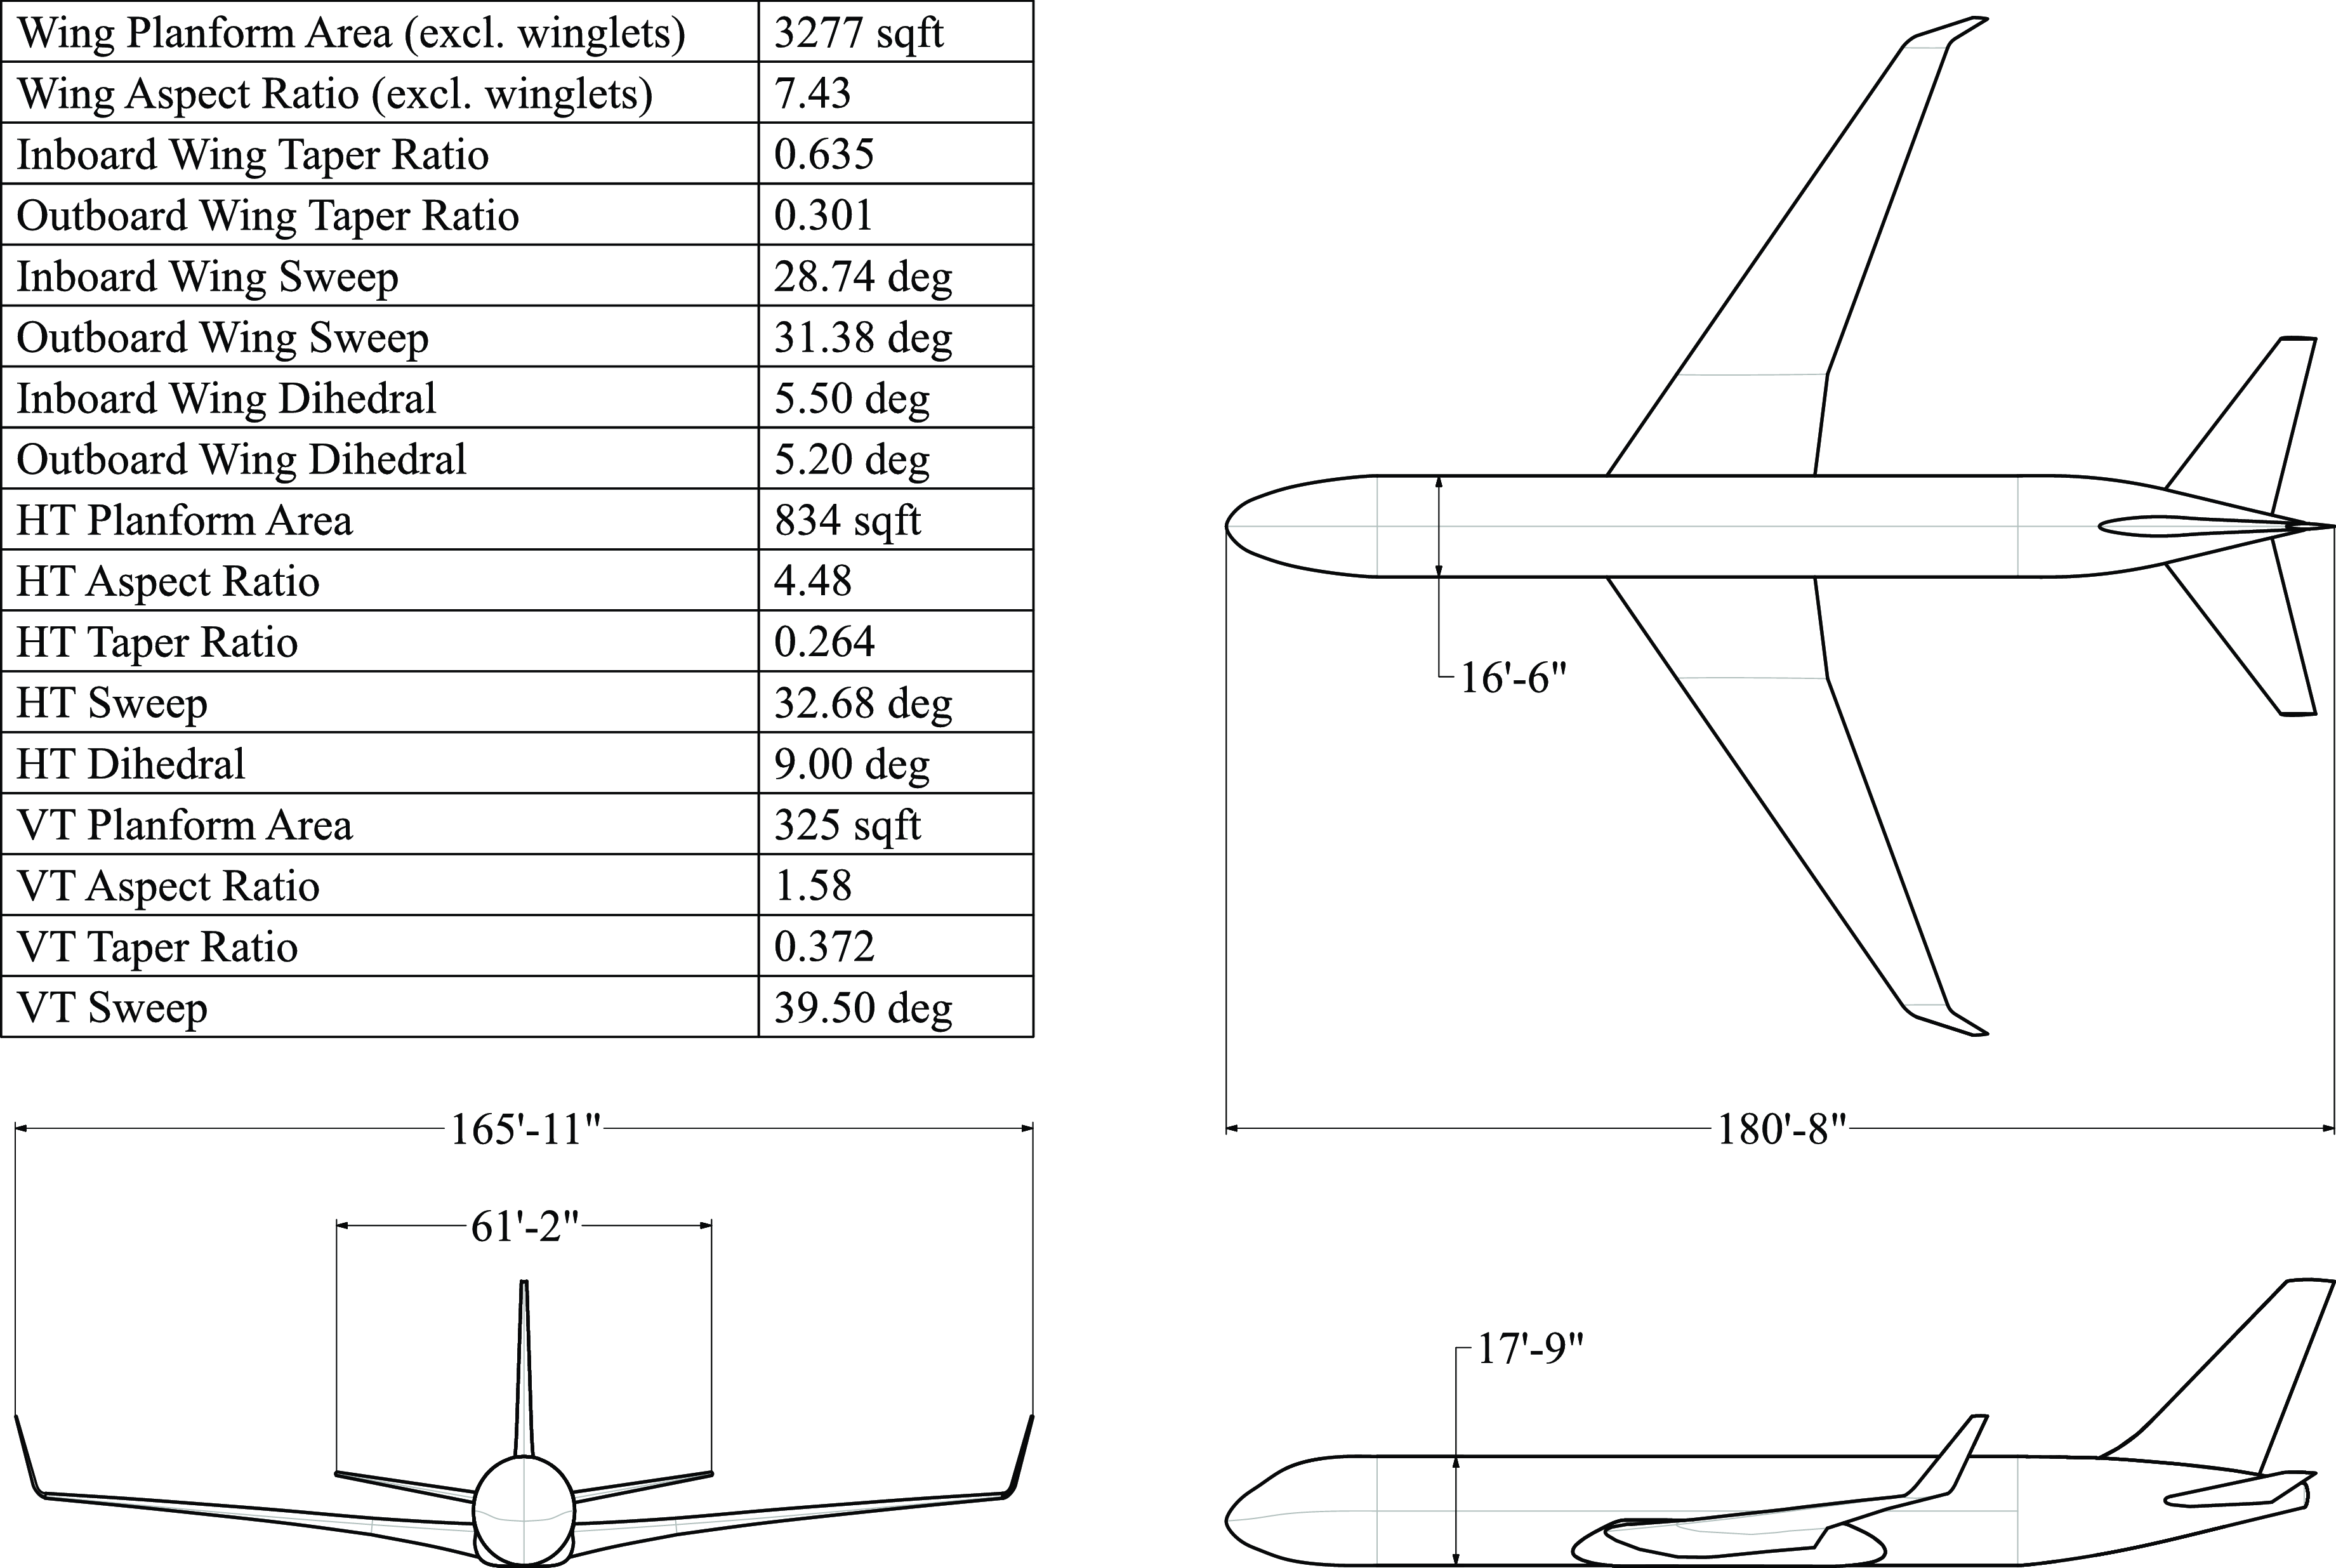
can accommodate 225 passengers. The TNW geometry is created in ESP using dimensions derived from the three-views in the Boeing 767 series airport planning manual [20]. Figure 3 shows the three-views of the geometry along with some key design characteristics. The Boeing 767-300ER wing was originally designed without winglets, however, some models have since been retrofitted to include them. Winglets have been included in the TNW geometry since most modern TNW aircraft have them for enhanced aerodynamic performance. Excluding the winglets would unfairly penalize the TNW relative to the BWB, which also features such components. The TNW baseline wing geometry aerofoil stack was initially derived from the NASA Common Research Model (CRM) [Reference Vassberg, Dehaan, Rivers and Wahls21], but then the twist distribution was manually modified to get a higher $L/D$
for the initialisation of the optimisation process. The vertical tail uses a NACA 64A011 aerofoil, like the ONERA CRM vertical tail [Reference Atinault and Hue22], whereas the horizontal tail aerofoil is based on a CRM horizontal tail section extracted near the root.
$L/D$
for the initialisation of the optimisation process. The vertical tail uses a NACA 64A011 aerofoil, like the ONERA CRM vertical tail [Reference Atinault and Hue22], whereas the horizontal tail aerofoil is based on a CRM horizontal tail section extracted near the root.
Baseline tube and wing aircraft notionally inspired by the Boeing 767-300ER with winglets.
3.3 CFD modeling
To minimise the computational expense of this study without significantly impacting accuracy, a combination of inviscid and viscous CFD simulations is used for optimisation and drag polar generation. Siemens STAR-CCM+ is used for both the Euler and Reynolds-Averaged Navier Stokes (RANS) CFD simulations, assuming steady-state conditions. An implicit time integration scheme is selected with a third-order Monotonic Upstream-centered Scheme for Conservation Laws (MUSCL) central difference spatial discretisation, with the advection upstream splitting method, flux vector splitting (AUSM+ FVS) [Reference Liou23] and the Venkatakrishnan limiter [Reference Venkatakrishnan24] for evaluating the inviscid fluxes. For the RANS cases, standard atmosphere conditions and fully turbulent flow are assumed. The $k$
-
$k$
- $\omega $
shear stress transport (SST) turbulence model [Reference Menter25] is chosen. The stopping conditions for both the Euler and RANS cases are defined as follows: the change in drag coefficient (
$\omega $
shear stress transport (SST) turbulence model [Reference Menter25] is chosen. The stopping conditions for both the Euler and RANS cases are defined as follows: the change in drag coefficient ( ${C_D}$
) is less than one drag count and the change in lift coefficient (
${C_D}$
) is less than one drag count and the change in lift coefficient ( ${C_L}$
) is less than 0.001 over 1000 iterations. Both conditions need to be satisfied for termination. A hemispherical domain is set up for the farfield with a radius that is roughly 50 times the half-span of each configuration. The overall planform area and the wing planform area, shown in Figs 1 and 3, are used as the reference area for the aerodynamic coefficients of the BWB and TNW respectively.
${C_L}$
) is less than 0.001 over 1000 iterations. Both conditions need to be satisfied for termination. A hemispherical domain is set up for the farfield with a radius that is roughly 50 times the half-span of each configuration. The overall planform area and the wing planform area, shown in Figs 1 and 3, are used as the reference area for the aerodynamic coefficients of the BWB and TNW respectively.
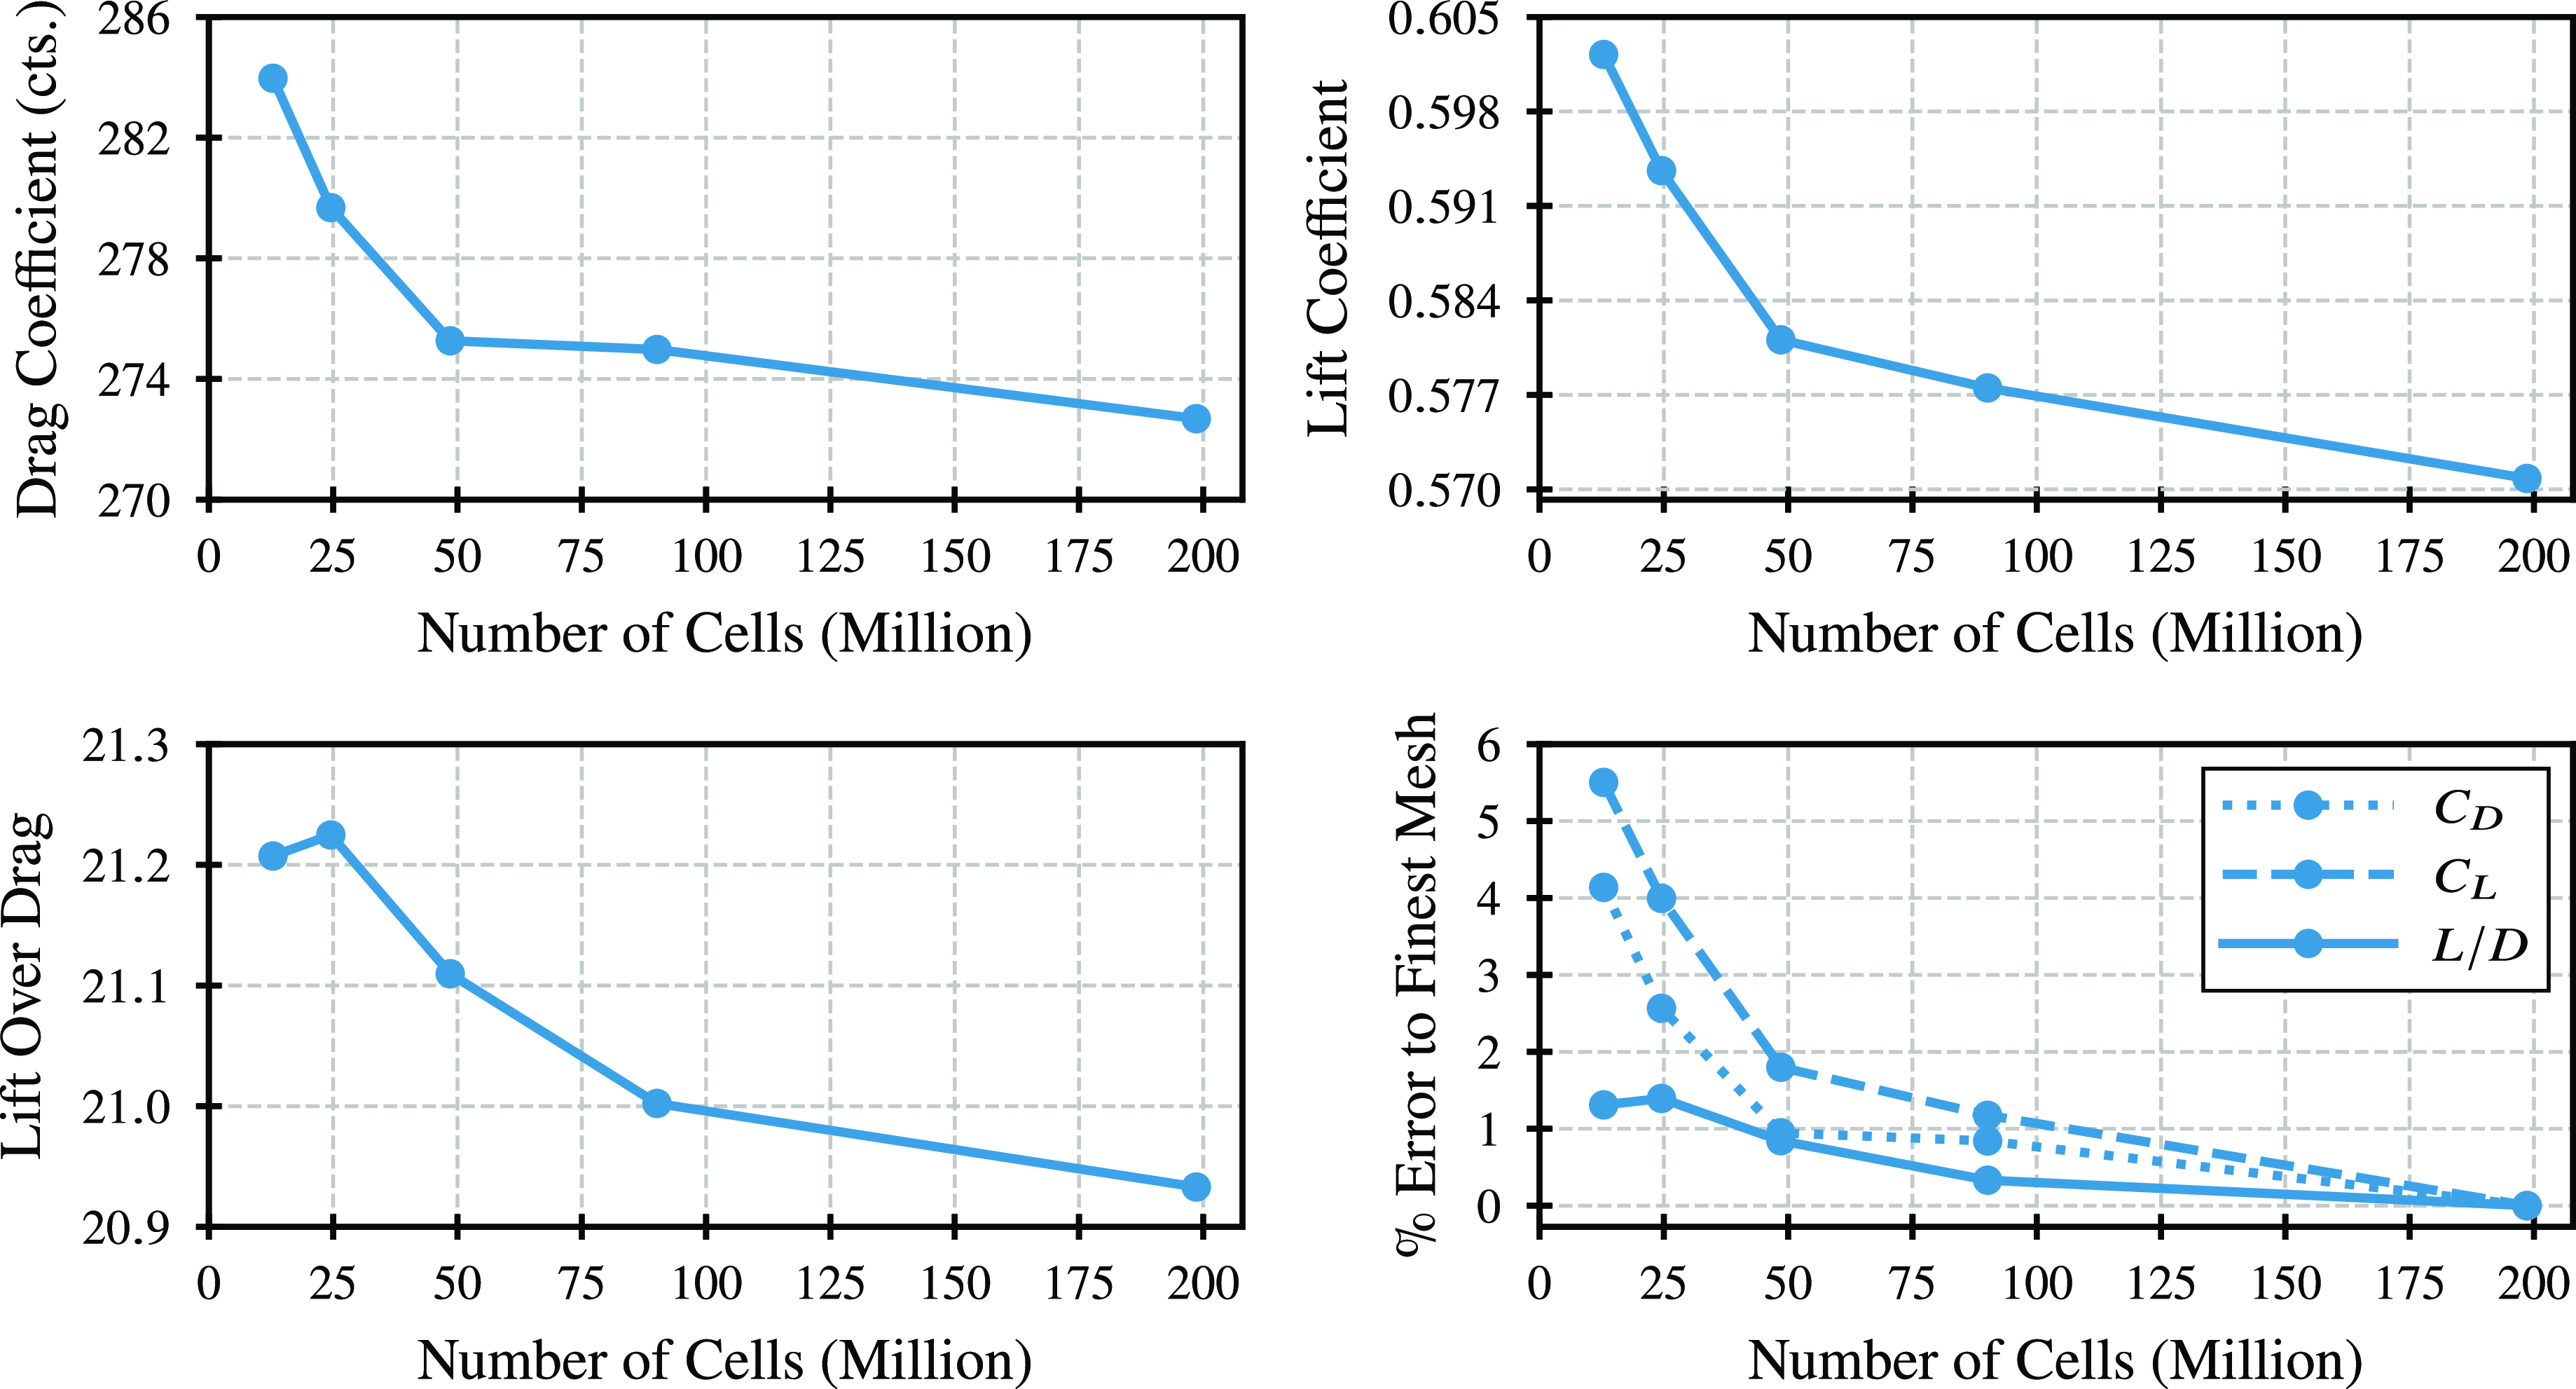
An unstructured polyhedral grid is used, which includes prism layers for the RANS cases to capture the boundary layer gradients over the surfaces. Through simple turbulent flat plate relations, the total boundary layer thickness, near wall spacing, and the number of prism layers required to maintain a wall ${y^ + } \lt 1$
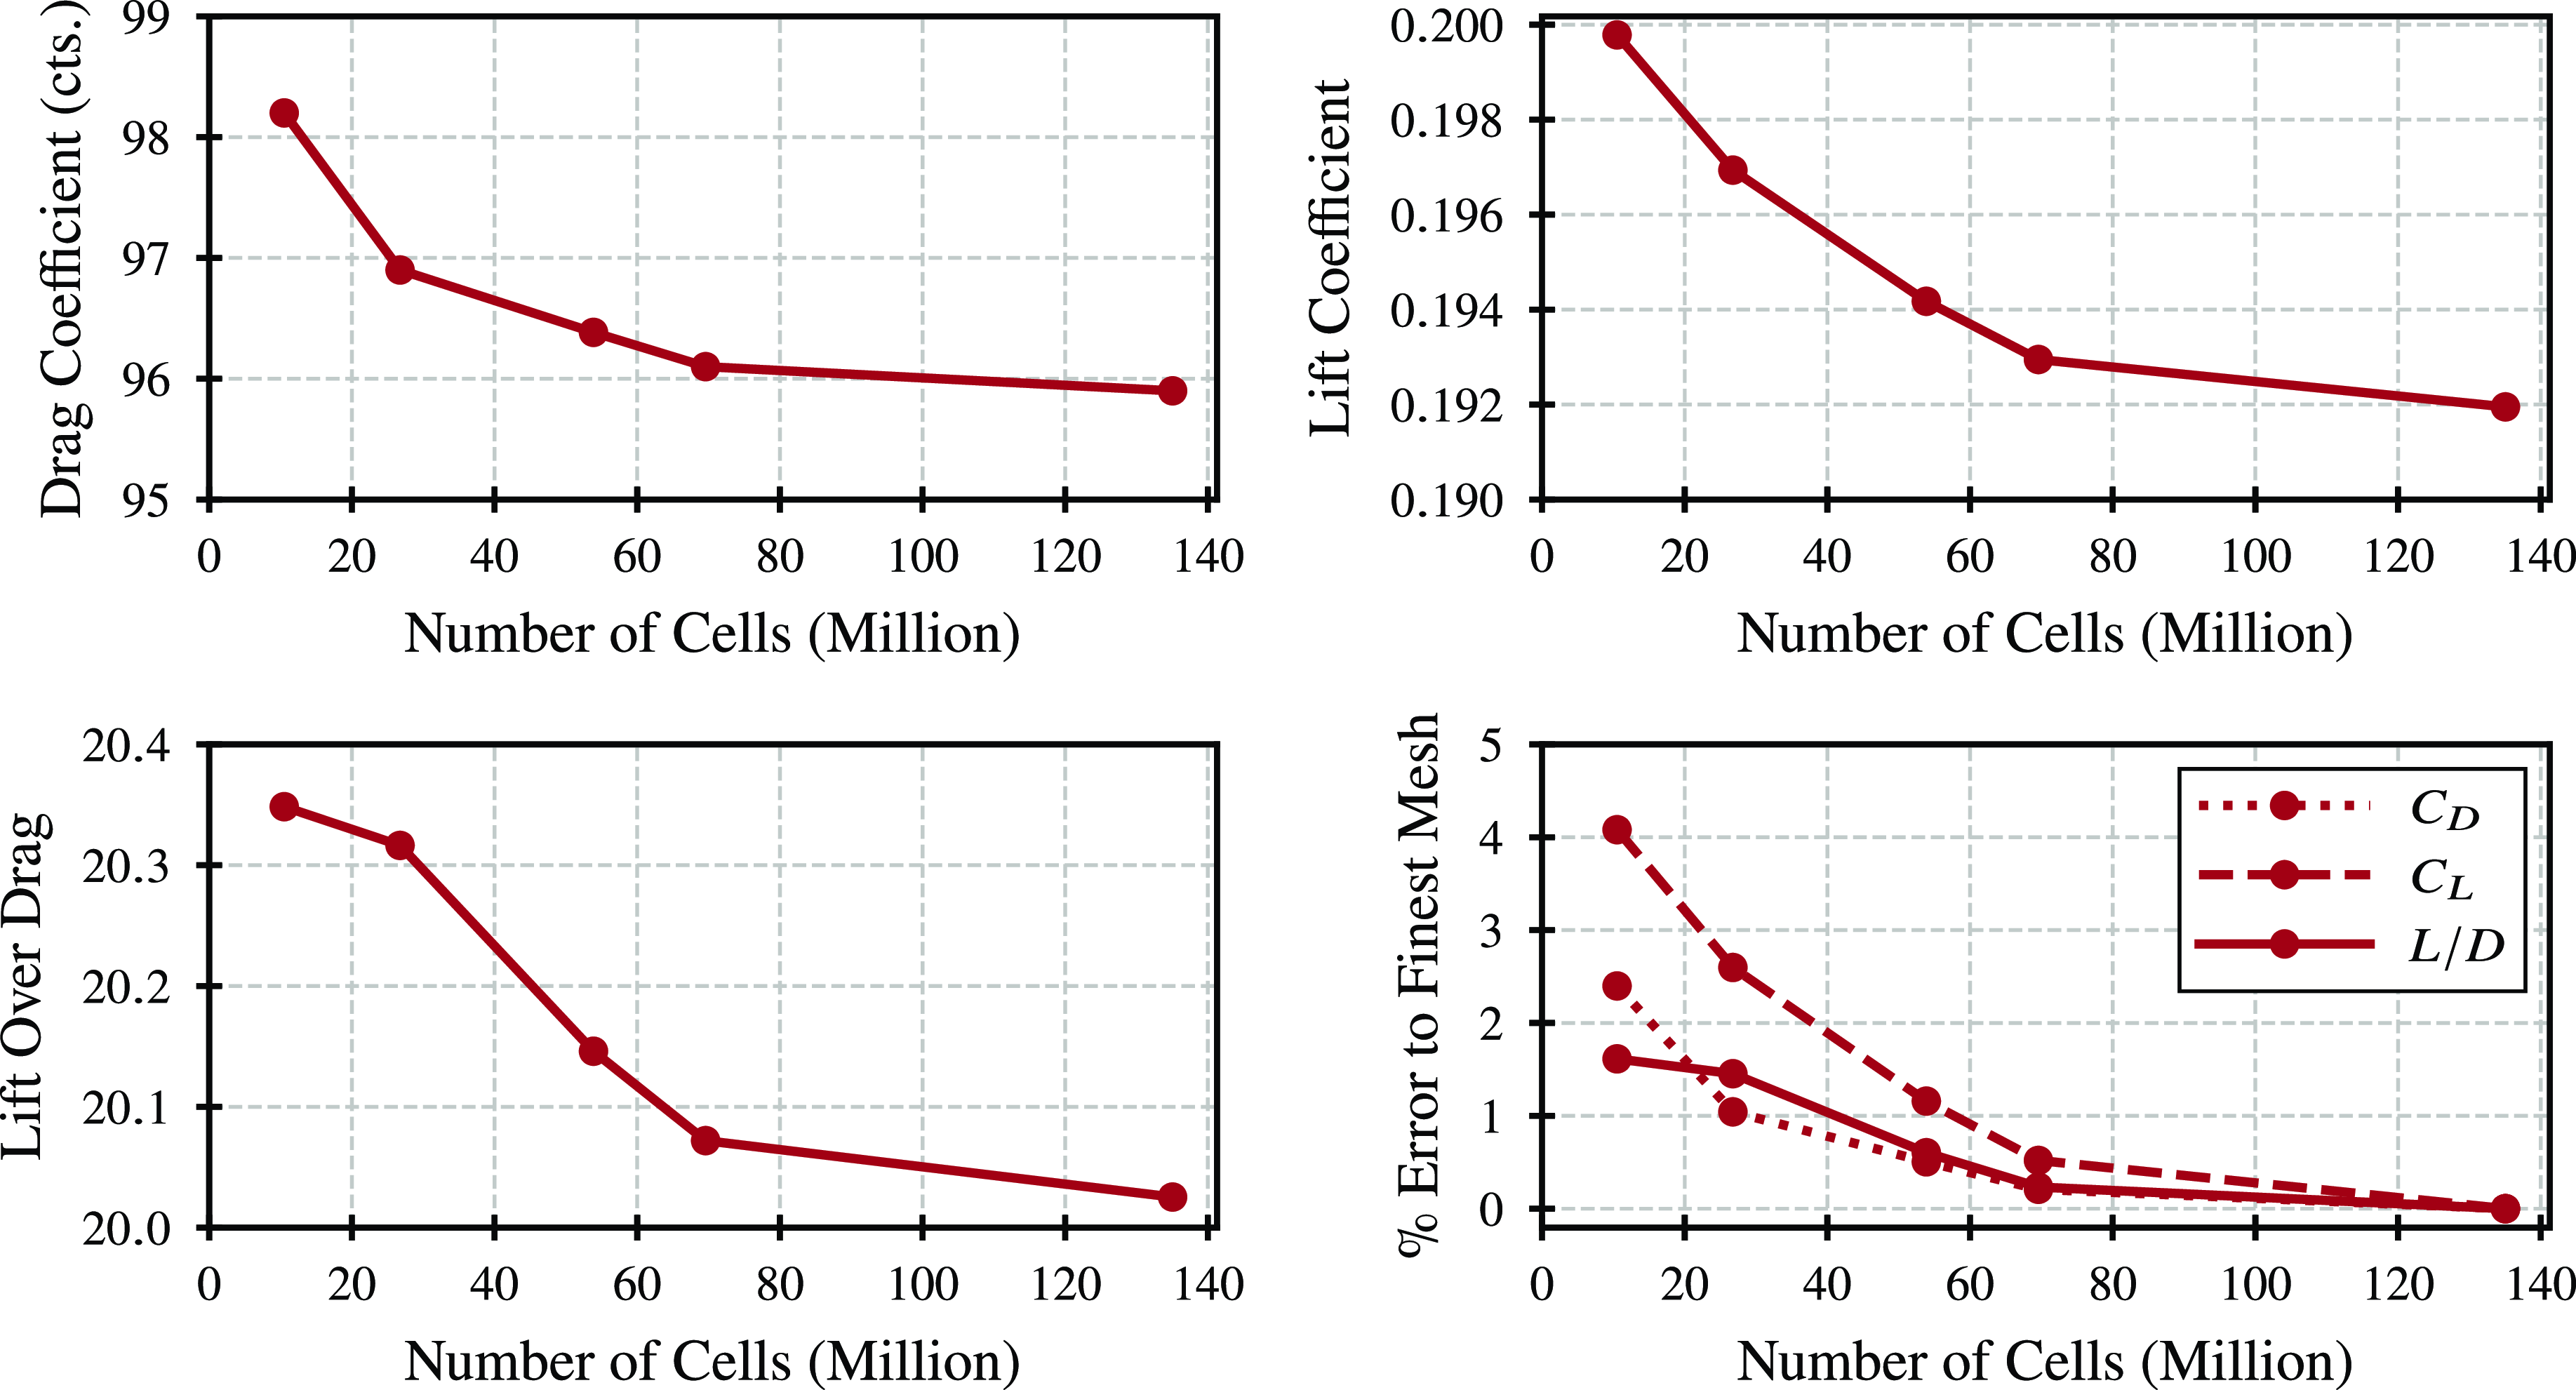
over most of the airframe surface are estimated. A RANS grid sensitivity study is conducted for both configurations, run at Mach 0.8, 40,000 ft altitude, and a fixed angle-of-attack of 3 degrees. Figure 4 presents the mesh sensitivity results for the BWB cases whereas Fig. 5 shows the TNW results. For both the BWB and the TNW, the grid settings that yield a mesh size of about 50M cells were chosen in an effort to balance cost and accuracy. The difference in lift-over-drag for the selected grid compared to the finest mesh is about 1% for the TNW and approximately 0.5% for the BWB and was thus deemed acceptable.
${y^ + } \lt 1$
over most of the airframe surface are estimated. A RANS grid sensitivity study is conducted for both configurations, run at Mach 0.8, 40,000 ft altitude, and a fixed angle-of-attack of 3 degrees. Figure 4 presents the mesh sensitivity results for the BWB cases whereas Fig. 5 shows the TNW results. For both the BWB and the TNW, the grid settings that yield a mesh size of about 50M cells were chosen in an effort to balance cost and accuracy. The difference in lift-over-drag for the selected grid compared to the finest mesh is about 1% for the TNW and approximately 0.5% for the BWB and was thus deemed acceptable.
BWB RANS grid refinement study results.
TNW RANS grid refinement study results.
3.4 Optimisation strategy
While the baseline BWB and TNW aircraft described in Sections 3.1 and 3.2 provide a reasonable outline of their respective airframe, some details were defined arbitrarily and could easily skew the results. To fairly compare both configurations, these details must then be perfected and the airframes optimised to give each concept the best potential for success. Specifically, the camber and twist of the main lifting surfaces are focussed on, which can substantially affect the aerodynamic efficiency of the aircraft. The planform shapes were fixed in the optimisation process. Since many aspects of this study are conceptual, the goal of this optimisation is not to be final, but rather to provide credible performance estimates for the subsequent mission analysis.
3.4.1 Problem formulation
The objective of the current optimisation is to maximise the vehicle lift-over-drag ratio at the design cruise conditions (Mach number of 0.8 and altitude of 40,000 ft). The outboard wing of the BWB baseline is defined by six span-wise stations with an additional two stations for the winglets. Similarly, the wing of the TNW is defined with seven span-wise stations with two more for the winglets. At each station, the aerofoil shape is controlled by eight CST coefficients for both the upper and lower surfaces, for a total of 16 coefficients per station. Only the camber lines of the baseline aerofoils are modified, leaving their thickness distribution untouched since the latter has strong consequences on the wing structural weight, which is calculated using a decoupled low-fidelity model based on semi-empirical relations (see Section 3.7). In doing so, the degrees of freedom of the aerofoil shape are cut in half (see Ref. [Reference Kulfan19] for a relation between CST coefficients and camber) and only eight design variables are needed per station. Additionally, each wing and winglet station is given a twist angle, and the vehicle angle-of-attack is controlled independently. The above camber, twist, and angle-of-attack, parameters amount to 73 and 82 design variables for the BWB and TNW aircraft respectively. Each design space is centred around their baseline geometry and angle-of-attack for max $L/D$
, with specified bounds of
$L/D$
, with specified bounds of $ \pm $
0.075 for the camber CST coefficients,
$ \pm $
0.075 for the camber CST coefficients, $ \pm $
2 degrees for the station twist, and
$ \pm $
2 degrees for the station twist, and $ \pm $
2 degrees for the angle-of-attack.
$ \pm $
2 degrees for the angle-of-attack.
3.4.2 Bayesian adaptive sampling
The optimisation process is performed using a Bayesian adaptive sampling method. A similar process, as in Ref. [Reference Ahuja, Lee, Perron and Mavris26], is used for an aeropropulsive optimisation problem and it has been an effective, and robust approach for the optimisation of expensive analyses such as CFD. Previous sources describe this method in depth [Reference Jones, Schonlau and William27, Reference Forrester, Sóbester and Keane28], and so only a summary is provided. The optimisation starts with training a Kriging surrogate model using a set of initial samples. These first samples are uniformly selected from the design space and form what can be referred to as the “warm start”. In this study, a sample size of 100 designs is considered. The Kriging model allows one to predict the performance of a new unsampled design with some measure of uncertainty. This information is combined into an infill criterion, and specifically, the expected improvement (EI) criterion described by Jones et al. [Reference Jones, Schonlau and William27] is used for this study. By minimizing this criterion in a sub-optimisation problem, the next design to evaluate can be known, thereby progressing toward the optimum while exploring the unsampled regions of the design space. Normally, a new Kriging model is trained every time a new design is evaluated, and the process is repeated until convergence. However, in this study, the next five candidate designs are selected and evaluated concurrently. This selection is done using the “Kriging believer” process as explained by Ginsbourger et al. [Reference Ginsbourger, Le Riche and Carraro29]. By choosing multiple designs at once, one can better utilize available computing resources and find the optimum faster. The optimisation is stopped once the EI value reaches a small threshold, indicating the chances of finding a better design are low.
3.4.3 Active subspace method
Generally, the Bayesian adaptive sampling method tends to struggle with problems having many design variables such as in this study. This is mostly related to high-dimensional phenomena described as the “curse of dimensionality” [Reference Koch, Simpson, Allen and Mistree30] and the “concentration of distances” [Reference Kumari and Jayaram31]. To overcome these issues, the active subspace method [Reference Constantine, Dow and Wang32] is employed to compress the design space into a lower-dimensional one.
Unlike a screening method, where individual variables are either included or excluded based on their statistical relevance, the active subspace method does not eliminate any variables. Instead, the variation of all design variables is limited to a lower-dimensional subspace. This subspace is defined by basis vectors, called active variables, that are a linear combination of the original design variables. The optimisation is then performed using these active variables, thus greatly reducing the effective dimension of the problem, but without explicitly discarding any variables.
In this study, the 73 and 82 design variables of the BWB and TNW respectively, are reduced to only six active variables each. Unlike the original active subspace method from Constantine et al. [Reference Constantine, Dow and Wang32] which requires the gradient information, a gradient-free variant described in Refs. [Reference Rajaram, Gautier, Perron, Pinon-Fischer and Mavris33, Reference Gautier, Pandita, Ghosh and Mavris34] is used for this study. This avoids the challenge and the computational cost of computing the gradient of the objective function, which is also not required for the optimisation. This process involves the manifold optimisation of a Gaussian process and produces a set of orthonormal vectors spanning the uncovered active subspace. For the sake of brevity, the reader is directed to Refs. [Reference Rajaram, Gautier, Perron, Pinon-Fischer and Mavris33, Reference Gautier, Pandita, Ghosh and Mavris34] regarding the details of this technique. To further reduce the computational effort, the active subspace is extracted using lower-fidelity results from an inviscid simulation. Previously Ref. [Reference Bilal Mufti, Perron and Mavris35] demonstrated that this multi-fidelity approach provided a good approximation of the actual active subspace, yet at a substantially lower cost. Some of the authors previously used a similar approach in Ref. [Reference Ahuja, Lee, Perron and Mavris26] for a different aeropropulsive problem.
3.5 Mission drag polar generation
Given the cruise point optimised BWB and TNW geometries, estimates are needed for their aerodynamic performance over the entire expected operating envelope. Specifically, the mission analysis requires a drag polar for different Mach and altitude combinations for each configuration. Although low-fidelity semi-empirical methods, such as those described in Ref. [Reference Feagin and Morrison36], are appropriate for conventional tube-and-wing aircraft sizing and mission analysis, they are less so for more unconventional configurations such as the BWB. Compared to the TNW, the BWB historical, experimental, and computational data are scarce, which must be compensated by higher-order physics modelling. However, differences in aerodynamics model fidelity would be a source of bias when comparing the TNW and BWB. Thus, both vehicles need the same level of fidelity for the mission drag polars. This exercise, if conducted entirely using fine grid RANS CFD simulations, would be quite costly and time-consuming. As such, multi-fidelity techniques are leveraged to lower the computational cost without significantly compromising accuracy.
Lower fidelity analyses, such as Euler CFD, capture most of the physics of interest and thus the general shape of the polar fairly accurately. Euler CFD is also significantly cheaper than RANS and many more cases can be run for the same computational budget. Therefore, the expected flight envelope can be sampled extensively using Euler CFD to get an initial drag polar set. Then, a small subset of this low-fidelity data is also evaluated with fine grid RANS CFD. In doing so, the high-fidelity RANS data augments the accuracy of the drag polars by accounting for viscous effects. The merging of these two datasets can be accomplished through a multi-fidelity surrogate modelling technique, specifically using Hierarchical Kriging [Reference Han and Görtz37].
For each of the BWB and TNW geometries, a Latin hypercube design of experiments (DoE) is generated on Mach and angle-of-attack containing 500 samples, which are evaluated using Euler CFD. Then, 35 points from this DoE are selected based on how significantly they affect the predictions of the inviscid drag polar surrogate model. A uniform sampling on the expected Reynolds number range is then assigned to these 35 Mach and angle-of-attack combinations in a way that maximises the distance between samples. The resulting DoE on Mach, angle-of-attack, and Reynolds number is then run in RANS CFD to obtain the viscous component of the multi-fidelity drag polars.
Once the Hierarchical Kriging surrogate models are created for each vehicle, these models are used to generate drag polar tables containing Mach, altitude, ${C_L}$
, and
${C_L}$
, and ${C_D}$
in a structured format, from sea-level all the way to 50,000 ft. These drag polars are then used by the mission analysis tool as lookup tables.
${C_D}$
in a structured format, from sea-level all the way to 50,000 ft. These drag polars are then used by the mission analysis tool as lookup tables.
3.6 Engine sizing and cycle selection
As mentioned previously, this study focuses on quantifying the airframe configuration change impact on the performance difference between the BWB and the TNW. As such, both vehicles need to have identical engines. The Boeing 767-300ER is powered by engines such as the CF6-80C2B7F1 and the PW4062 [20] with a sea-level-static (SLS) thrust of about 62,000 lb. For the BWB, the JetZero demonstrator is allegedly planning on using the PW2040 engineFootnote 6 with a SLS thrust of 40,000 lbFootnote 7 . Both the PW4062 and the PW2040 engines were introduced in the 1980s and thus are highly unlikely to feature on a 2030 variant of the TNW and BWB. If the 2030 time frame will have an aircraft fleet that is a mixture of both TNWs and BWBs for the 225 pax capacity, there is no off-the-shelf modern engine that can power both aircraft and thus a new engine will be required for these vehicles.
The PW2000 series engine comes in three thrust class variants: 37,000, 40,000, and 43,000 lb. Assuming engine manufacturers will target both the 2030 TNW and BWB aircraft with the same new engine for economic reasons, a 43,000 lb SLS thrust class engine seems like the best compromise. This engine should have more than enough thrust for the BWB, assuming the PW2040 is deemed adequate for the JetZero demonstrator. Although the SLS thrust rating is about 19,000 lb lower than the current engines powering the Boeing 767-300ER, it is expected that technological advancements of the 2030 engine will result in substantially higher fuel efficiency and thus lower fuel burn. The fuel weight savings will be augmented by reductions in engine weight from a reduced size and lighter materials. It is also reasonable to assume that the engine lapse rate will improve relative to 1980 levels resulting in substantially more thrust at higher altitudes. Thus, any climb and takeoff performance penalty that may occur by reducing the SLS thrust class for the TNW from 62,000 lb to 43,000 lb is likely to be offset, at least partially, by the improvements due to 2030 technology.
In the hypothetical scenario that an engine manufacturer is to develop a brand new engine in the 43,000 lb SLS thrust class for 2030, how would they go about doing so? To mimic such a development path, the logical starting point for this new engine is assumed to be the current state of the art in the nearest thrust class, which is the PW1133 geared turbofan. The authors believe that to obtain a 10,000 lb increase in SLS thrust, a new core and fan design is preferable, as a re-fan option, i.e. an increase in the fan size with the same core as the PW1133, may not be sufficient to produce the extra SLS thrust needed.
The notional engine model of the PW1133 is developed using the Numerical Propulsion System Simulation (NPSS) [Reference Lytle38] code for engine cycle analysis and the Weight Analysis of Turbine Engine++ (WATE++) [Reference Tong and Naylor39] code for engine weights and flow path estimation. The mechanical, thermodynamic, and geometric characteristics of this engine are modelled using public sources of information such as the European Union Aviation Safety Agency’s International Civil Aviation Organization (ICAO) engine emissions data bank [40] and type-certificate data sheet [41]. A multi-design point (MDP) process [Reference Schutte, Tai, Sands and Mavris42, Reference Schutte43] is used to design this engine given a set of requirements. The design points are: 1) the turbomachinery aerodynamic design point (ADP), where the cycle parameters are specified; 2) top of climb (TOC), which sets the maximum mass flow and corrected speed, and thus sizes the fan; 3) hot day takeoff (TKO) where the maximum temperature conditions are established; 4) SLS installed and 5) SLS uninstalled where the sea level static thrust target is specified.
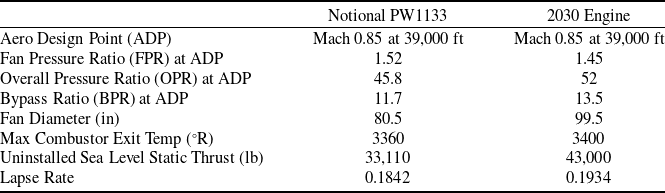
With the baseline model established, a few design characteristics are perturbed to model a realistic set of changes that would be achievable in the next five years. Table 1 presents the differences between the current notional PW1133 model to a 2030 variant with higher SLS thrust. Additional design characteristics of this engine are presented in Table 4 in Section 4.2. A larger fan with a lower FPR is decided on, thereby increasing the BPR. OPR and maximum combustor exit temperature are also increased to generate more thrust. Lastly, the lapse rate of the engine is decreased by 5% assuming that by 2030, the thrust loss at higher altitudes will be lower. The lapse rate in this context is defined as the ratio of the top-of-climb thrust to the uninstalled sea-level-static thrust.
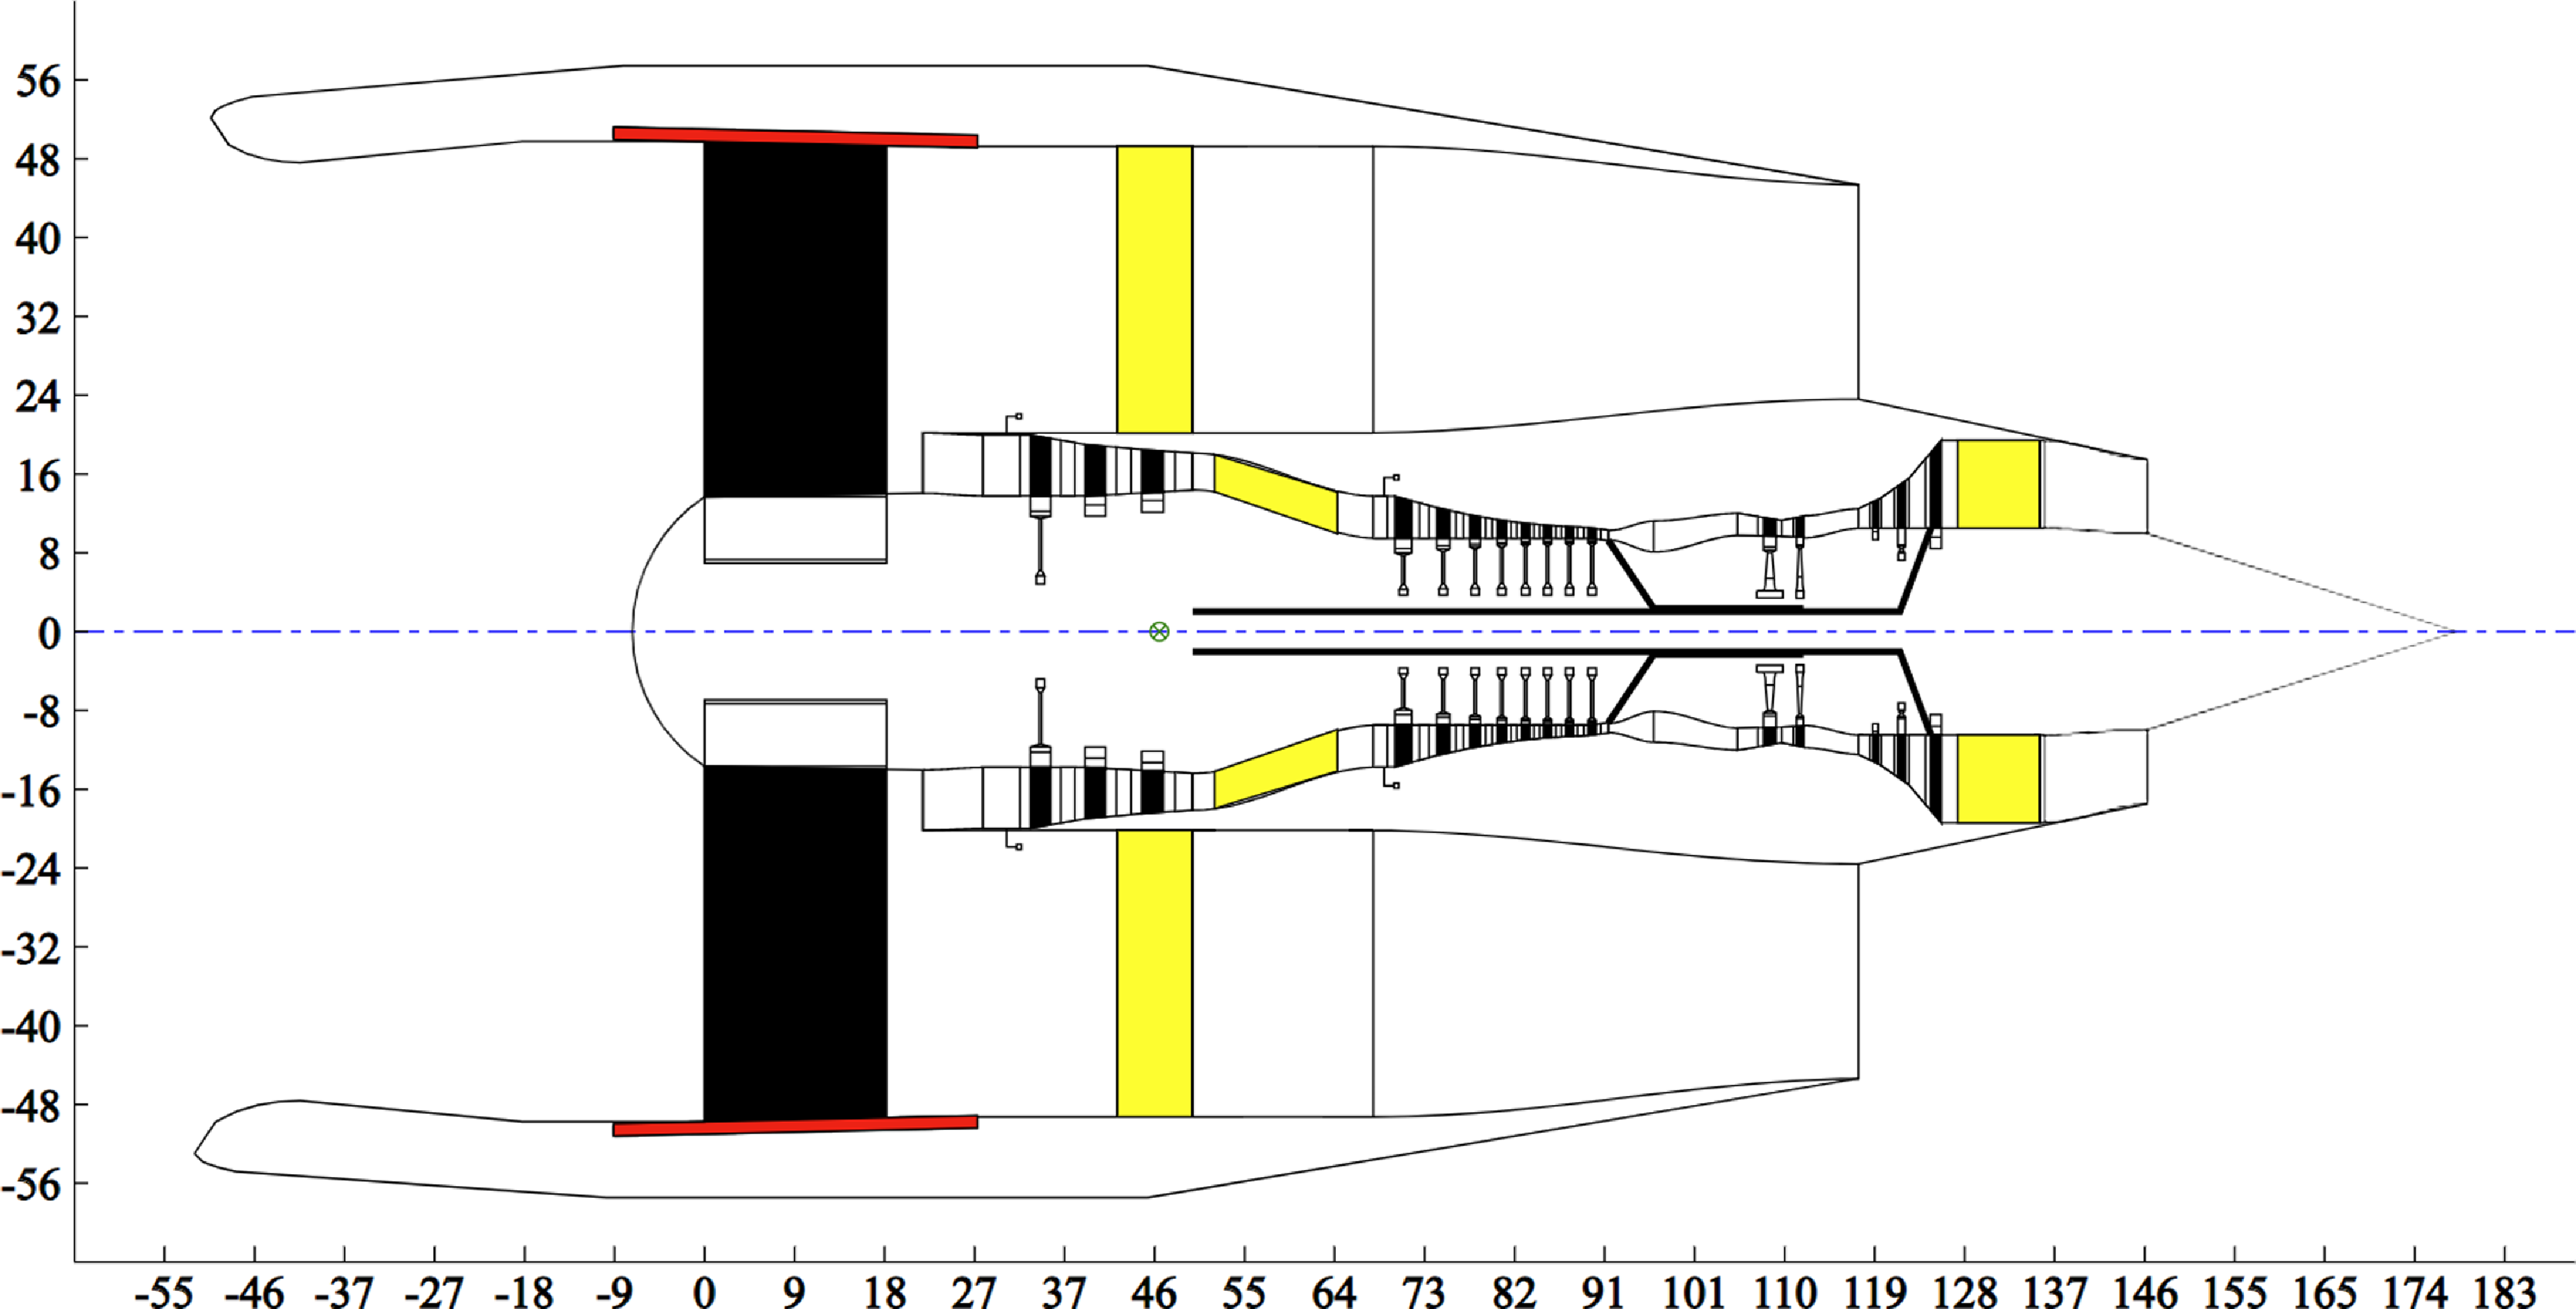
Figure 6 presents the 2030 engine architecture, featuring a three-stage low-pressure compressor, an eight-stage high-pressure compressor, a two-stage high-pressure turbine, and a three-stage low-pressure turbine.
Comparison between the notional PW1133 geared turbofan and the 2030 upgraded variant with higher SLS thrust
Cycle optimisation variables and bounds, starting with the notional PW1133 engine model
WATE++ output of the 2030 engine architecture (axes represent dimension in inches).
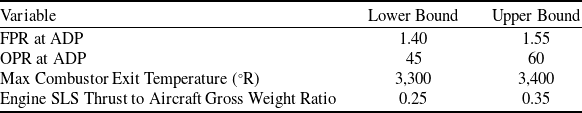
In an idealised scenario, both aircraft would have potentially different engines that best match the airframe they power. In fact, the initial 800pax BWB design showed a 27% reduction in the thrust requirement [Reference Liebeck, Page and Rawdon6] whereas the BWB-450 showed a 19% reduction in thrust [Reference Liebeck7] relative to the reference TNW aircraft. It is therefore reasonable to assume that the optimum engines for each vehicle will end up with different thrust levels and cycle designs. To ascertain the performance difference between the BWB and TNW in such a scenario, a cycle optimisation exercise is also conducted. Table 2 shows the engine design variables and their ranges considered for this study, starting with the notional PW1133 engine model. A 5,000 case DoE that samples this design space is prepared, and then for every engine design perturbation, the vehicles are sized and a mission analysis is conducted. Mission block fuel burn, the resulting fan diameter of the engine, and the combustor inlet temperature are tracked. A maximum limit on the fan diameter of 99.5 inches is set for both vehicles, the same as the 43,000 lb thrust class engine, to account for ground clearance limits for the TNW and aerodynamic performance limits on the BWB. An upper limit on the combustor inlet total temperature is also set at a value of 1,800 ${ ^\circ }$
R. The engine designs that had the lowest fuel burn while satisfying the constraints were picked. These designs are presented in Section 4.3.
${ ^\circ }$
R. The engine designs that had the lowest fuel burn while satisfying the constraints were picked. These designs are presented in Section 4.3.
3.7 System analysis
Flight Optimization System (FLOPS) [Reference McCullers44] is used to model the system-level performance of the BWB and TNW. The propulsion system performance is integrated into FLOPS through engine decks that contain fuel flow rate and net thrust at different Mach-altitude combinations for varying engine throttle settings. As discussed in Section 3.5, CFD-generated drag polars are used for the aerodynamics component of the tool, but these do not include the nacelles and pylons in the model. Therefore, FLOPS empirical relations are used to estimate the nacelle drag addition, which is a function of the length, max diameter, and flight conditions. A small constant amount of parasitic drag for the pylons and excrescence is then added.
Notional mission profile for the BWB and TNW.
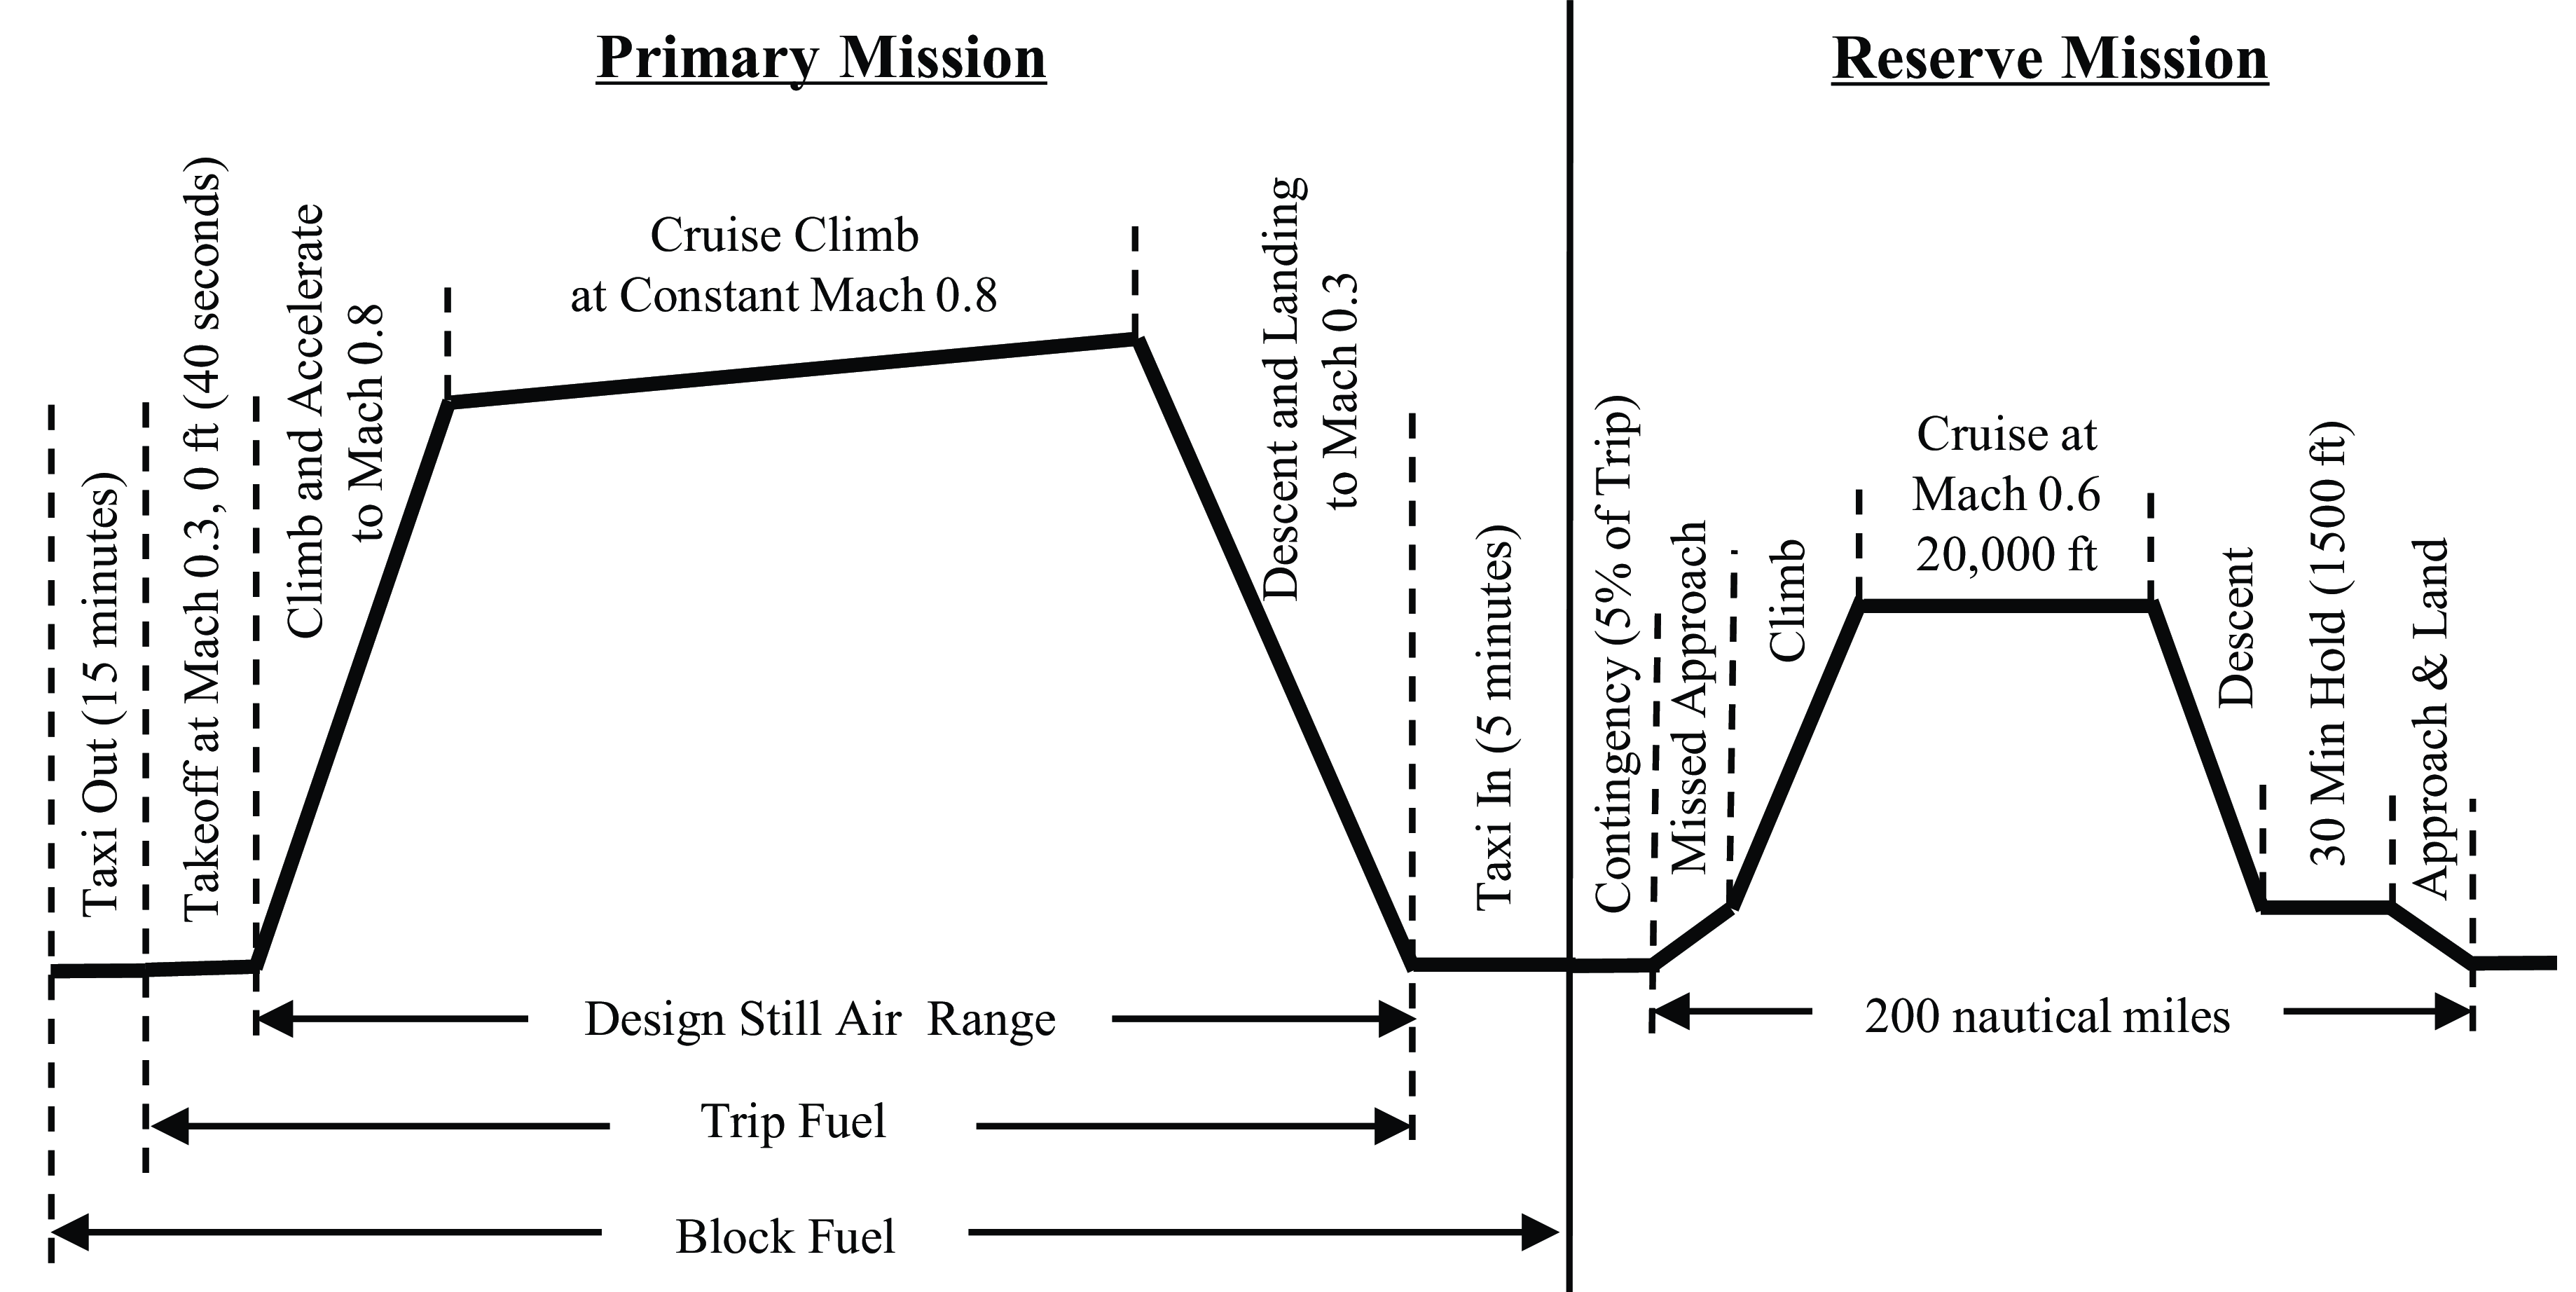
The notional profiles for the primary and reserve missions for both the BWB and TNW are shown in Fig. 7. The climb segment is optimised for minimum time to climb in FLOPS. The cruise climb segment for the design mission is optimised for a specific range, whereas the descent segment is run at the maximum vehicle $L/D$
. The start and end of cruise altitudes for the primary mission are a fallout of the converged aircraft weight, SLS thrust, engine lapse rate, and aerodynamic performance. A design mission range of 5,000 nmi is specified, with a reserve mission range of 200 nmi to an alternate airport. The reserve mission also includes a 30 minute hold at 1,500 ft altitude and Mach 0.4. The total reserve fuel is the value required to fly the reserve mission plus an additional 5% of the trip fuel for contingencies. The primary mission profile is also evaluated for a 900 nmi range to represent an economic mission. The economic mission is paired with the same reserve mission as the design mission case. The design payload is 225 passengers, assuming a 250 lb weight per passenger including baggage, for a total of 56,250 lb. Six flight attendants (roughly one per 40 passengers) and two pilots are also assumed for both aircraft.
$L/D$
. The start and end of cruise altitudes for the primary mission are a fallout of the converged aircraft weight, SLS thrust, engine lapse rate, and aerodynamic performance. A design mission range of 5,000 nmi is specified, with a reserve mission range of 200 nmi to an alternate airport. The reserve mission also includes a 30 minute hold at 1,500 ft altitude and Mach 0.4. The total reserve fuel is the value required to fly the reserve mission plus an additional 5% of the trip fuel for contingencies. The primary mission profile is also evaluated for a 900 nmi range to represent an economic mission. The economic mission is paired with the same reserve mission as the design mission case. The design payload is 225 passengers, assuming a 250 lb weight per passenger including baggage, for a total of 56,250 lb. Six flight attendants (roughly one per 40 passengers) and two pilots are also assumed for both aircraft.
WATE++ is used to compute the propulsion weights. FLOPS internal weight equations are used [Reference Wells, Horvath and McCullers45] for predicting the structural weight and most of the other non-structural operating empty weight components. These weight equations are derived based on a database of TNW transport and fighter aircraft using non-linear programming optimisation techniques to formulate curve fits for the different component weights as a function of physically meaningful parameters. [Reference Wells, Horvath and McCullers45] Each component weight equation is also associated with a scaling factor, which, depending on its value either overrides or acts as a multiplicative factor on the predicted weight. These factors are useful when calibrating to known weight values, or when modelling applied technologies with known weight savings, otherwise the default values of one should be used. Both the TNW and BWB share the same component weight regression models, with the exception of the structural weights for the centrebody and aft-body, indicated with dark and light grey shading respectively in Fig. 8. The structural weights for these components are also obtained from a regression model which was fit using finite element modelling (FEM) data on representative double deck BWB configurations between 250-450 passengers. [Reference Bradley46] The centrebody weight regression is a function of the cabin floor area and gross weight, while the aft-body weight is a function of the number of engines, along with the planform area and taper ratio of the aft-body. [Reference Bradley46]
Assumed weight savings going from FLOPS default assumptions to applied material technologies.

For the BWB, the default FLOPS assumption is a composite centrebody and a metal outboard wing and aft body. However, a pultruded rod, stitched, efficient, unitized structure (PRSEUS) [Reference Velicki and Thrash47–Reference Jegley and Corman50] centrebody and aft-body, and a conventional composite outboard wing are instead modelled. The specified weight savings from PRSEUS and conventional composite technologies relative to the default FLOPS assumptions are indicated in Fig. 8. FLOPS has wing and centrebody weight calibration factors, i.e. FRWI 1-4 and FRFU respectively, that can correct the weight predictions from its internal equations. The values of these factors are adjusted to reflect the assumed weight benefits of conventional composites and PRSEUS. The weight savings factors are derived from the nominal values for the final milestone in previous work associated with NASA Environmentally Responsible Aviation Integrated Technology Demonstrations (ERA ITDs), documented in [Reference Jegley and Corman50]. A weight savings of 15% is assumed when considering baseline composites over a conventional metallic structure. Additionally, the weight reduction values of PRSEUS compared to baseline composites are multiplicative. For example, the ERA ITD study shows a weight savings of 9.3% using PRSEUS instead of baseline composites for the aft body. Assuming the 15% savings from metal to baseline composite, the cumulative weight savings going from metal to PRSEUS is 22.9%.
It should be acknowledged that there is some uncertainty regarding the feasibility of PRSEUS on a BWB for a 2030 timeframe. The ERA project, which funded a significant amount of research into PRSEUS, assessed the readiness level of the technology Footnote 8 at five [Reference Jegley and Corman50], implying that the technology is in the “breadboard validation in relevant environment” stage as of 2015. As such, substantial research and funding is still required to mature the technology for use in the 2030s. The U.S. Air Force has shown appreciable interest in JetZero’s BWB concept, and the U.S. Department of Defense is planning to invest over $200M to help develop a full-scale demonstrator.Footnote 9 With such support, it is reasonable to assume that a successful demonstration will spearhead research and funding into materials for the production version in an accelerated timeline.
As mentioned previously, two variants of the TNW are modelled with different structural materials. The first, a “conventional” TNW, is intended to represent an older airframe that is still in service by 2030, but will be re-engined for better efficiency, As such, this airframe still has a metallic structure. The second version is an “advanced” TNW with composites for the wing and fuselage. This variant is reflective of a more modern airframe that is likely to be flown in the 2030 time frame. For the advanced TNW, a 15% savings is assumed on the fuselage and wing weight relative to FLOPS predictions, which by default assume metallic structures. For the BWB and TNW, all other weight scaling factors in FLOPS were left at their default values of one.
It should be noted that FLOPS has been used extensively for TNW component weight build-ups with reasonable accuracy. As for the BWB, no such aircraft were considered in the development of most of FLOPS’ weight models, with the exception of the centrebody and aft-body models. Barring these two components, it is reasonable to initially assume that the BWB and TNW can be treated similarly from a weight breakdown perspective and can thus use the same regression models. Even though the semi-empirical nature of the component weight equations will naturally result in some degree of error in the predicted weights, by using the same level of fidelity for both the BWB and the TNW, the difference in performance between the two configurations should be fairly insensitive to this error. The biggest sources of uncertainty, however, are the centrebody and aft-body, which are also some of the heaviest components in the BWB. This uncertainty primarily stems from the limited data used for developing the regression models and the dual-deck configurations of the source data versus the single-deck BWB assumed for this study. The BWB centrebody weight is also rather sensitive to the pressurised cabin floor area definition. Factors like including the cargo bays inside the pressurised cabin area definition can impact the centrebody weight predictions by up to 10%. There is also a degree of uncertainty in the values of the weight savings factors used for PRSEUS. As the PRSESUS technology matures in the future, there is a possibility that the quoted weight savings will change. As such, the assumed values here are meant to represent current state-of-the-art knowledge, as opposed to a prediction of future weight savings of a fully mature technology. A formal uncertainty quantification and detailed FEM were not part of the scope of this study due to time and cost considerations. Future work that focuses on higher fidelity estimations of the structural weight of the BWB, and by extension the TNW to maintain an equivalent and fair comparison, along with a quantification of the associated uncertainty, should alleviate some of the concerns that arise from using lower order weight estimations like those in FLOPS.
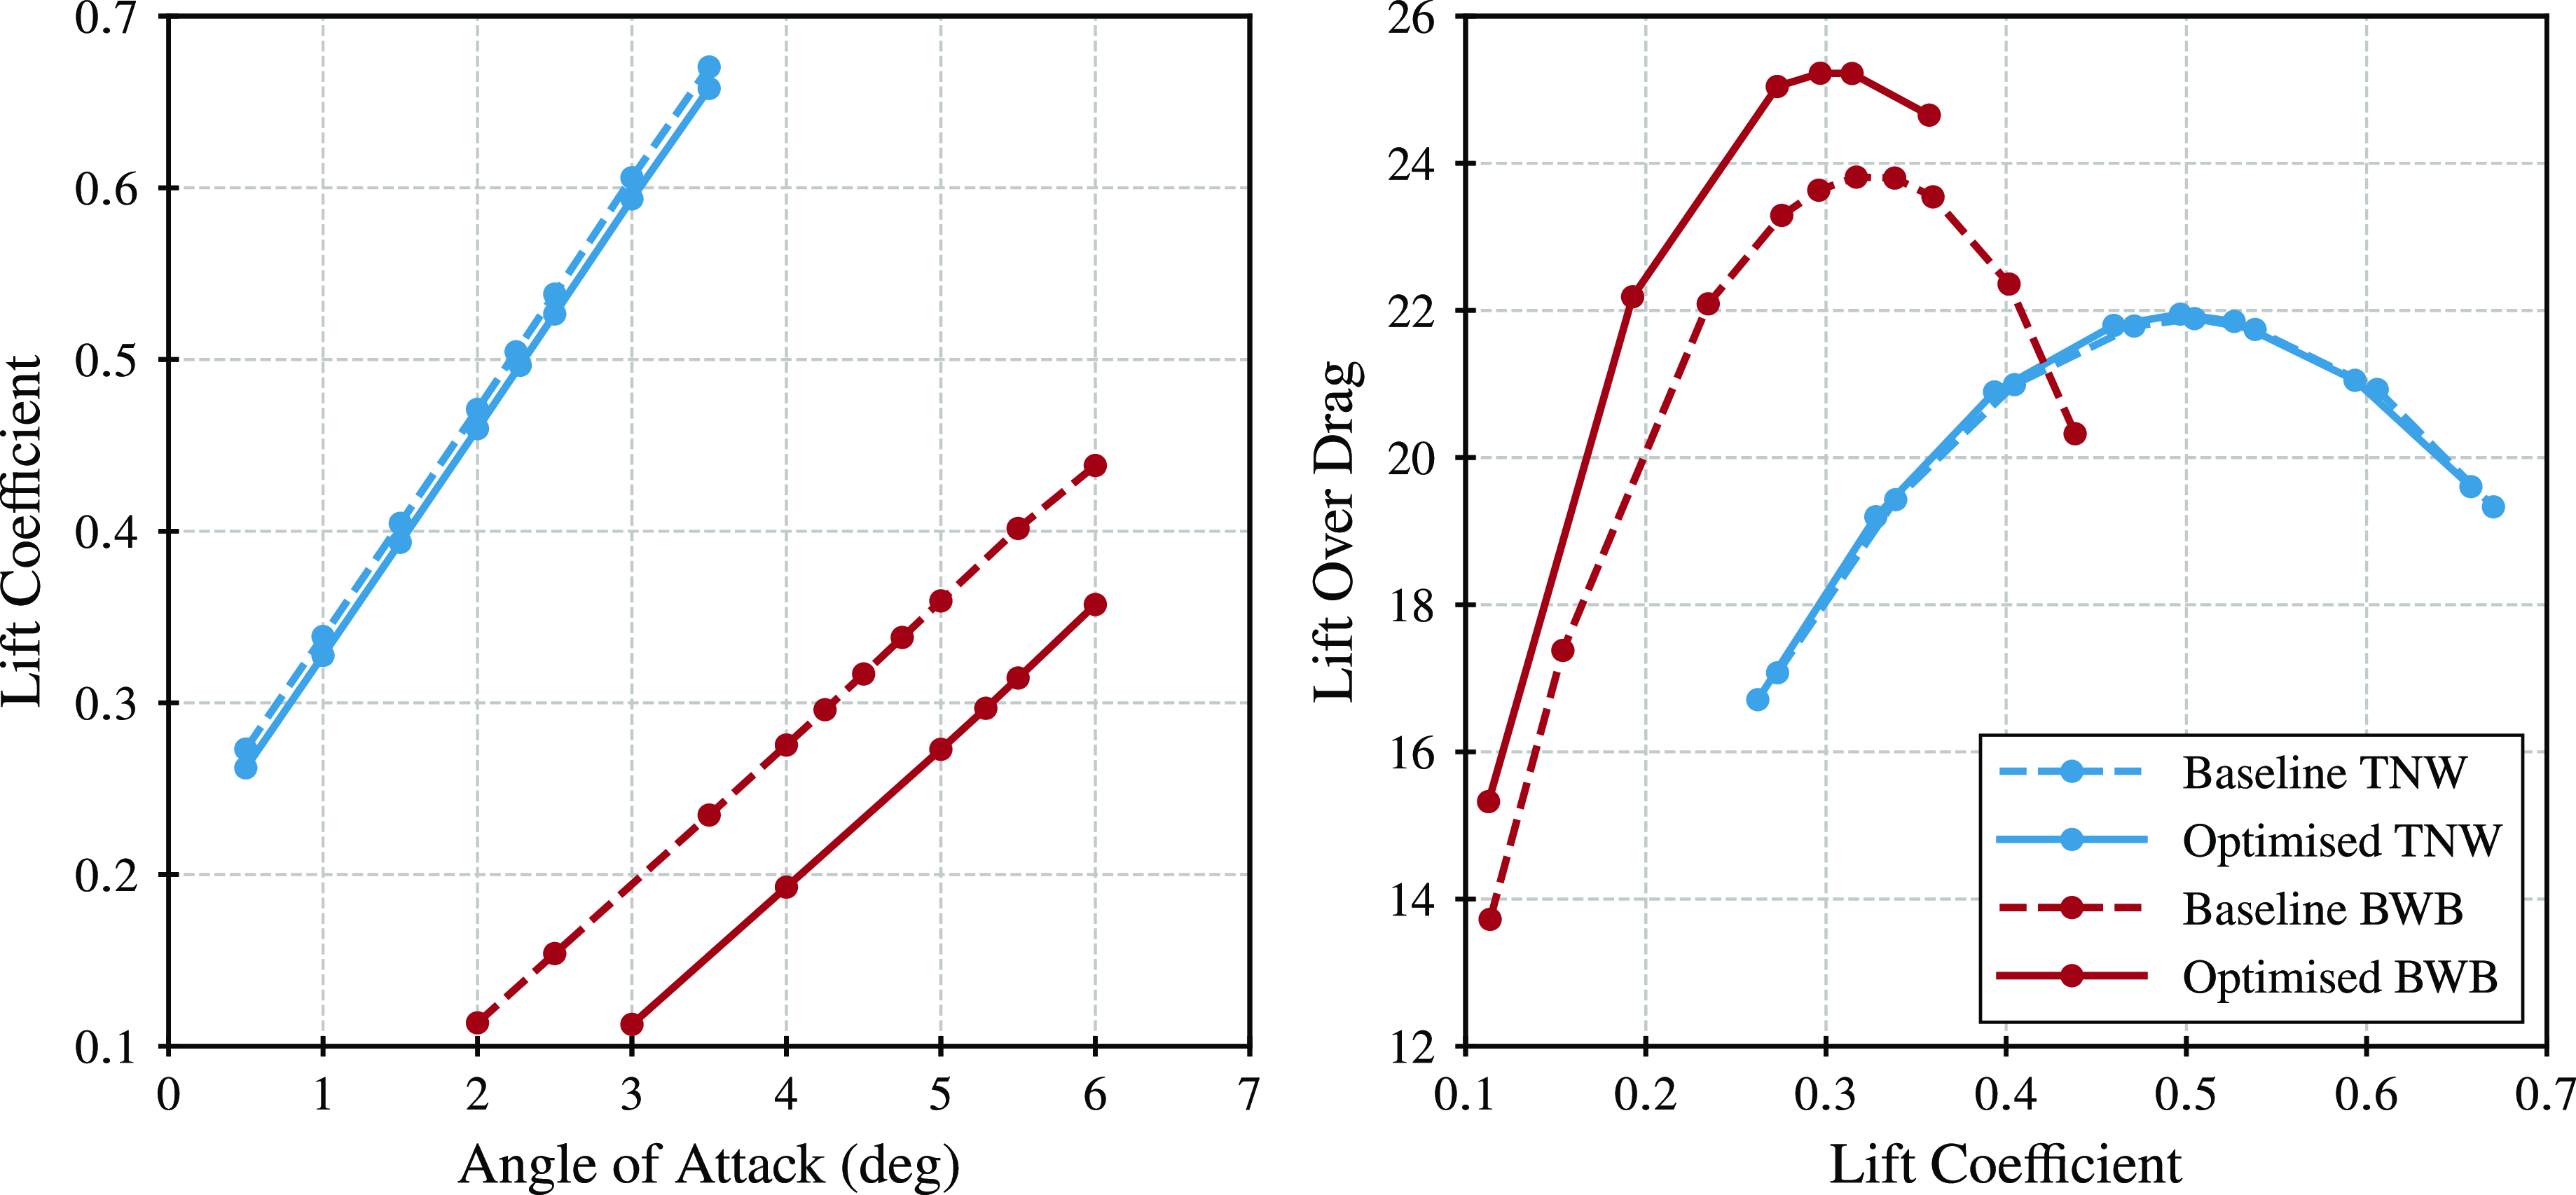
Comparison of the lift curve (left) and lift-over-drag (right) for the baseline and optimised TNW and BWB configurations (does not include nacelle, pylon, and excrescence drag).
4. Results and discussion
4.1 Optimization results and cruise performance comparison
Figure 9 compares the baseline and optimised TNW and BWB aerodynamic performance at Mach 0.8 at an altitude of 40,000 ft. For the BWB, optimization improves the peak $L/D$
from 23.8 to 25.2, a roughly 6% increase relative to the baseline. For the TNW, the difference in the maximum
$L/D$
from 23.8 to 25.2, a roughly 6% increase relative to the baseline. For the TNW, the difference in the maximum $L/D$
between the two is rather small, with a peak
$L/D$
between the two is rather small, with a peak $L/D$
of 21.95 at a
$L/D$
of 21.95 at a ${C_L}$
of 0.497 for the optimised configuration and a peak
${C_L}$
of 0.497 for the optimised configuration and a peak $L/D$
of 21.89 at a
$L/D$
of 21.89 at a ${C_L}$
of 0.504 for the baseline. The small improvement in peak
${C_L}$
of 0.504 for the baseline. The small improvement in peak $L/D$
after optimization for the TNW can likely be attributed to the preliminary work done in improving the twist distribution of the baseline geometry relative to the CRM twist, as mentioned in Section 3.2. For both the BWB and TNW, there is a consistent downward shift in the lift curve for the optimised configuration relative to the baseline, albeit smaller for the TNW. This result is primarily a consequence of the increased downward twist of the outboard wing root section for the BWB and the increased downward twist past the 45% span-wise location for the TNW. Note that these results do not include any contributions for nacelle, pylon, interference, and excrescence drag. The clean optimised BWB airframe at these flight conditions exhibits a 15% higher peak
$L/D$
after optimization for the TNW can likely be attributed to the preliminary work done in improving the twist distribution of the baseline geometry relative to the CRM twist, as mentioned in Section 3.2. For both the BWB and TNW, there is a consistent downward shift in the lift curve for the optimised configuration relative to the baseline, albeit smaller for the TNW. This result is primarily a consequence of the increased downward twist of the outboard wing root section for the BWB and the increased downward twist past the 45% span-wise location for the TNW. Note that these results do not include any contributions for nacelle, pylon, interference, and excrescence drag. The clean optimised BWB airframe at these flight conditions exhibits a 15% higher peak $L/D$
compared to the clean optimised TNW airframe.
$L/D$
compared to the clean optimised TNW airframe.
4.2 Mission performance comparison (same engine)
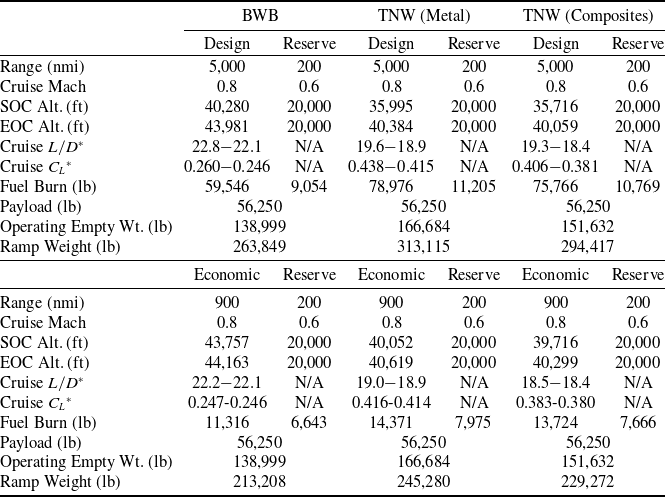
This section provides different quantitative metrics for comparing the configuration change impact on the performance difference between the BWB and the TNW powered by the same engine. Table 3 compares the system level performance for the design, economic, and associated reserve missions. The performance characteristics at the different engine design points of the common engine powering both configurations are detailed in Table 4. For this engine, ADP and TOC are defined at Mach 0.85, 39,000 ft whereas TKO is at Mach 0.25, sea-level, with a $ + $
27
$ + $
27 ${ ^\circ }$
R deviation from standard atmosphere.
${ ^\circ }$
R deviation from standard atmosphere.
Comparison of the system level results for the design and reserve, and economic and reserve missions for the same engine case
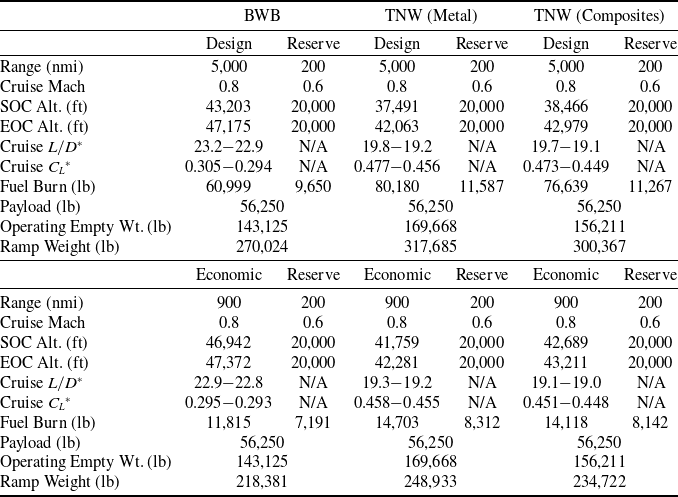
*Values are presented from SOC to EOC.
For the design mission, the BWB shows a 17-18% higher peak operating cruise $L/D$
compared to the TNW variants. For all three vehicles, as fuel is burnt over the cruise segment, the weight of the aircraft and thus
$L/D$
compared to the TNW variants. For all three vehicles, as fuel is burnt over the cruise segment, the weight of the aircraft and thus ${C_L}$
decrease, resulting in a monotonic reduction in
${C_L}$
decrease, resulting in a monotonic reduction in $L/D$
from start of cruise (SOC) to end of cruise (EOC). Both the TNW metal and composite variants share the same drag polars, but the lower operating
$L/D$
from start of cruise (SOC) to end of cruise (EOC). Both the TNW metal and composite variants share the same drag polars, but the lower operating $L/D$
range for the composite variant is solely due to the lighter airframe and thus lower
$L/D$
range for the composite variant is solely due to the lighter airframe and thus lower ${C_L}$
. The same reasoning explains the lower
${C_L}$
. The same reasoning explains the lower $L/D$
operating ranges of the economic mission compared to the design mission. The aircraft carry less fuel for a shorter range and thus operate at lift coefficients that are much lower than the value required for peak aerodynamic efficiency.
$L/D$
operating ranges of the economic mission compared to the design mission. The aircraft carry less fuel for a shorter range and thus operate at lift coefficients that are much lower than the value required for peak aerodynamic efficiency.
The BWB design mission fuel burn is 24% lower than the TNW with metallic structures and 20% lower than the TNW composites reference aircraft. The ramp weight of the BWB is also lighter, showing a 15% reduction over the TNW metal variant and a 10% reduction over the TNW composite reference case. Since both aircraft are powered by the same engine, the lighter and more aerodynamically efficient BWB can operate at higher altitudes compared to the TNW reference aircraft. Note that the BWB SOC altitude is higher than the EOC altitude of both TNW variants. The high cruise altitudes also suggest that this BWB model may not need a 43,000 lb SLS thrust engine. Lower fuel burn can likely be achieved for the BWB by downsizing the engine, albeit at the cost of takeoff performance, which was not modelled.
Design characteristics of the 43,000 lb thrust class common engine used for the BWB and the TNW aircraft

For the economic mission, the BWB shows a 19-20% improvement in operating cruise $L/D$
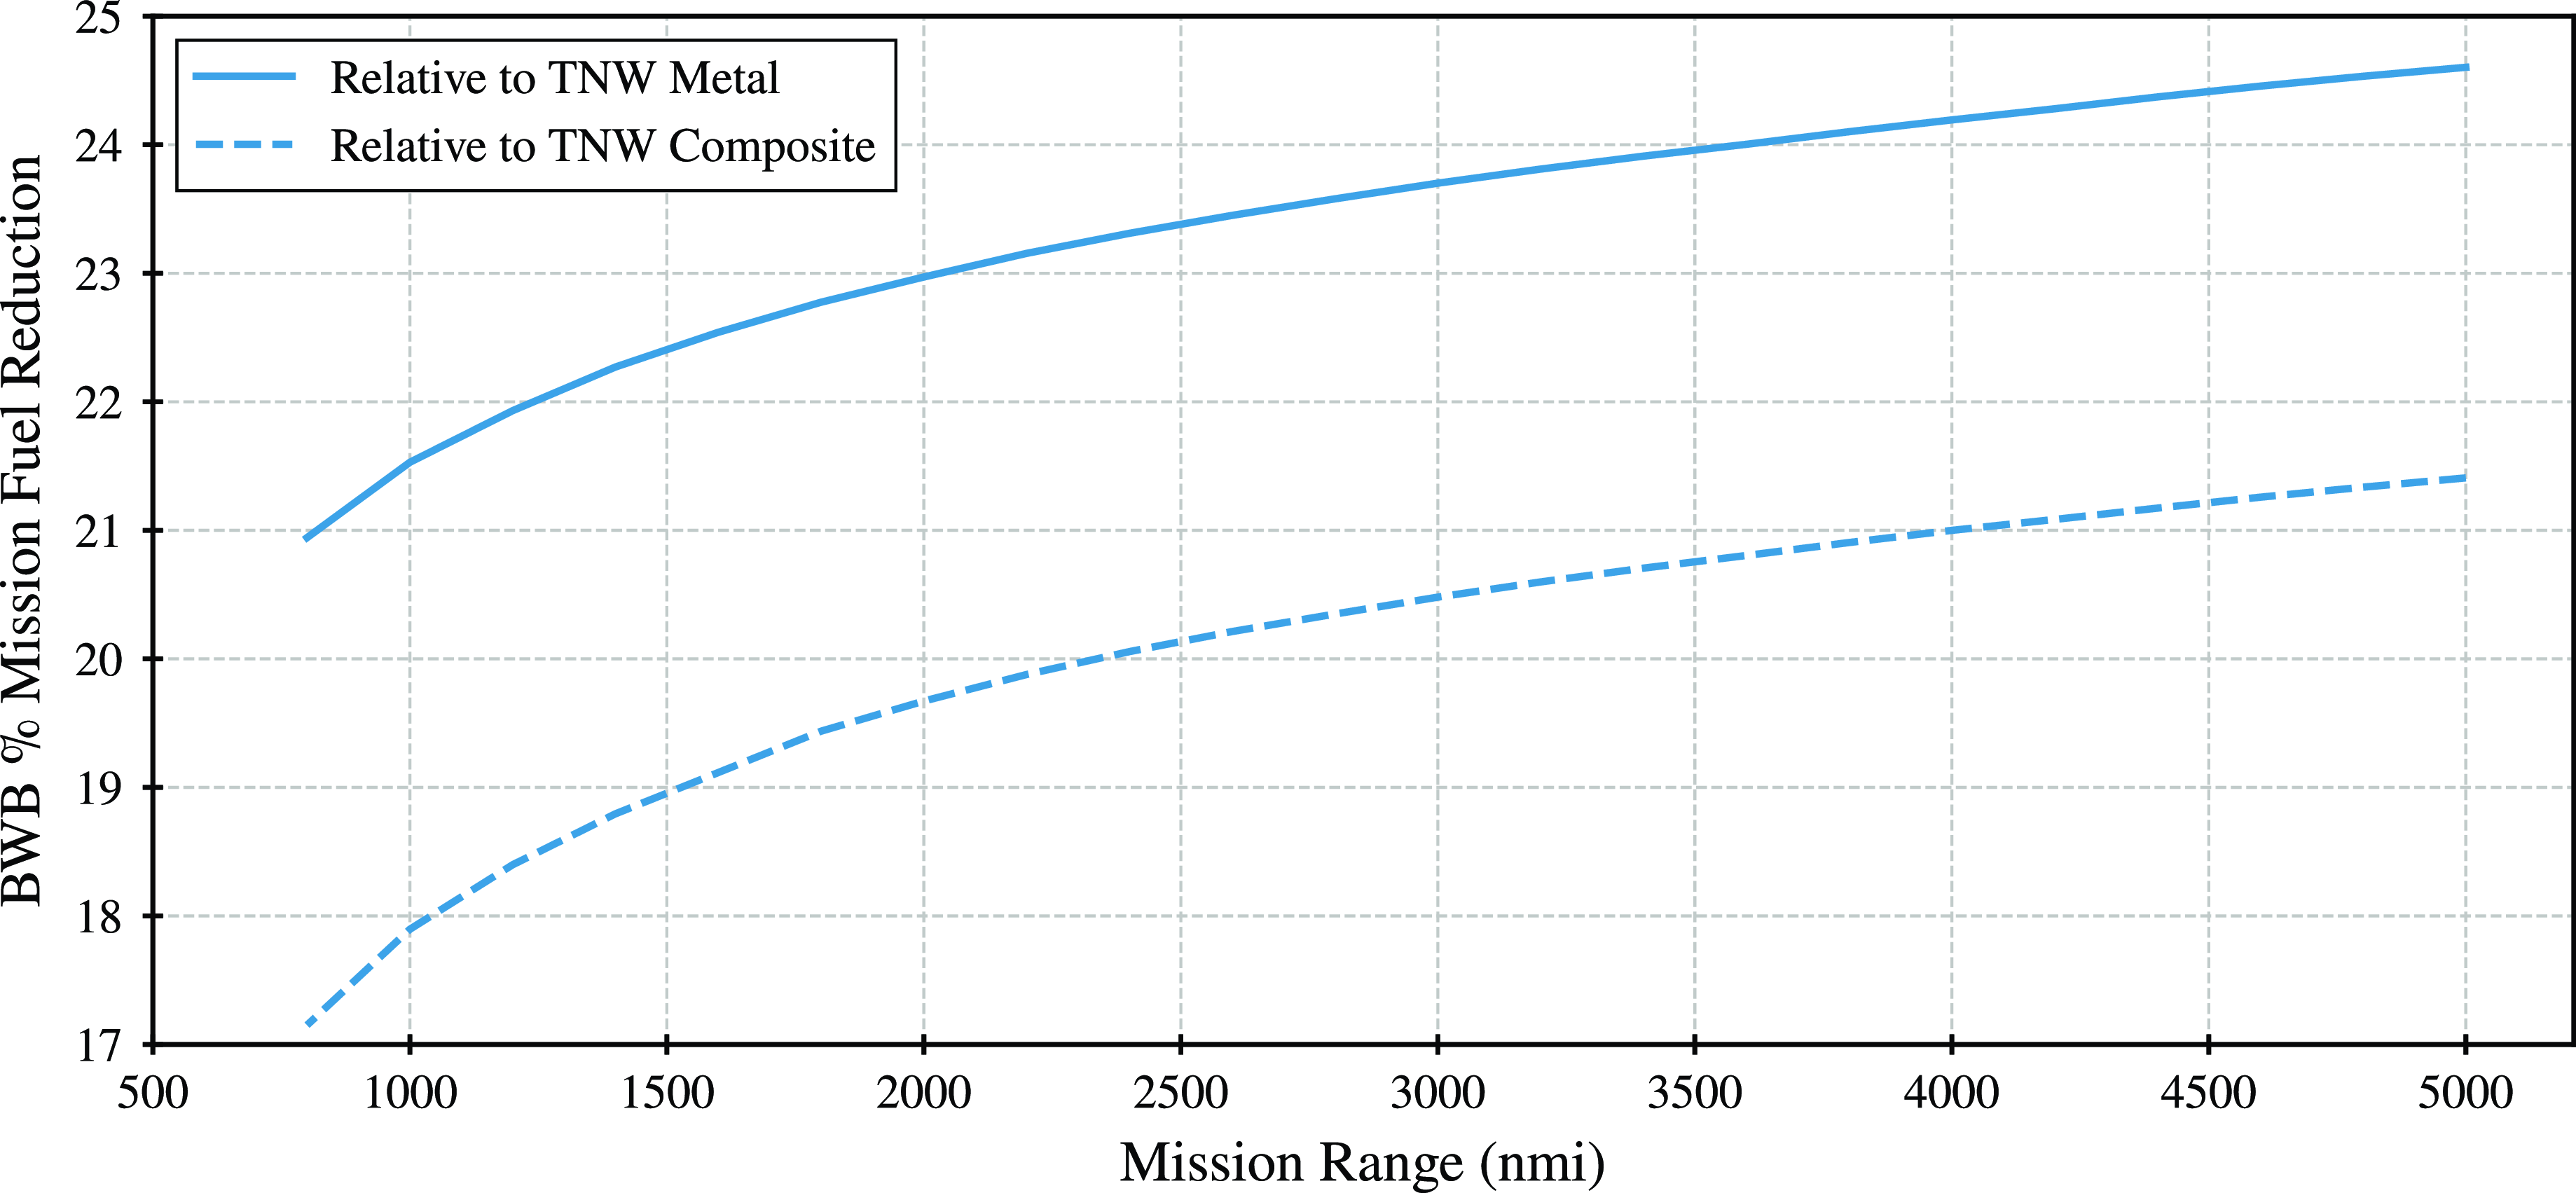
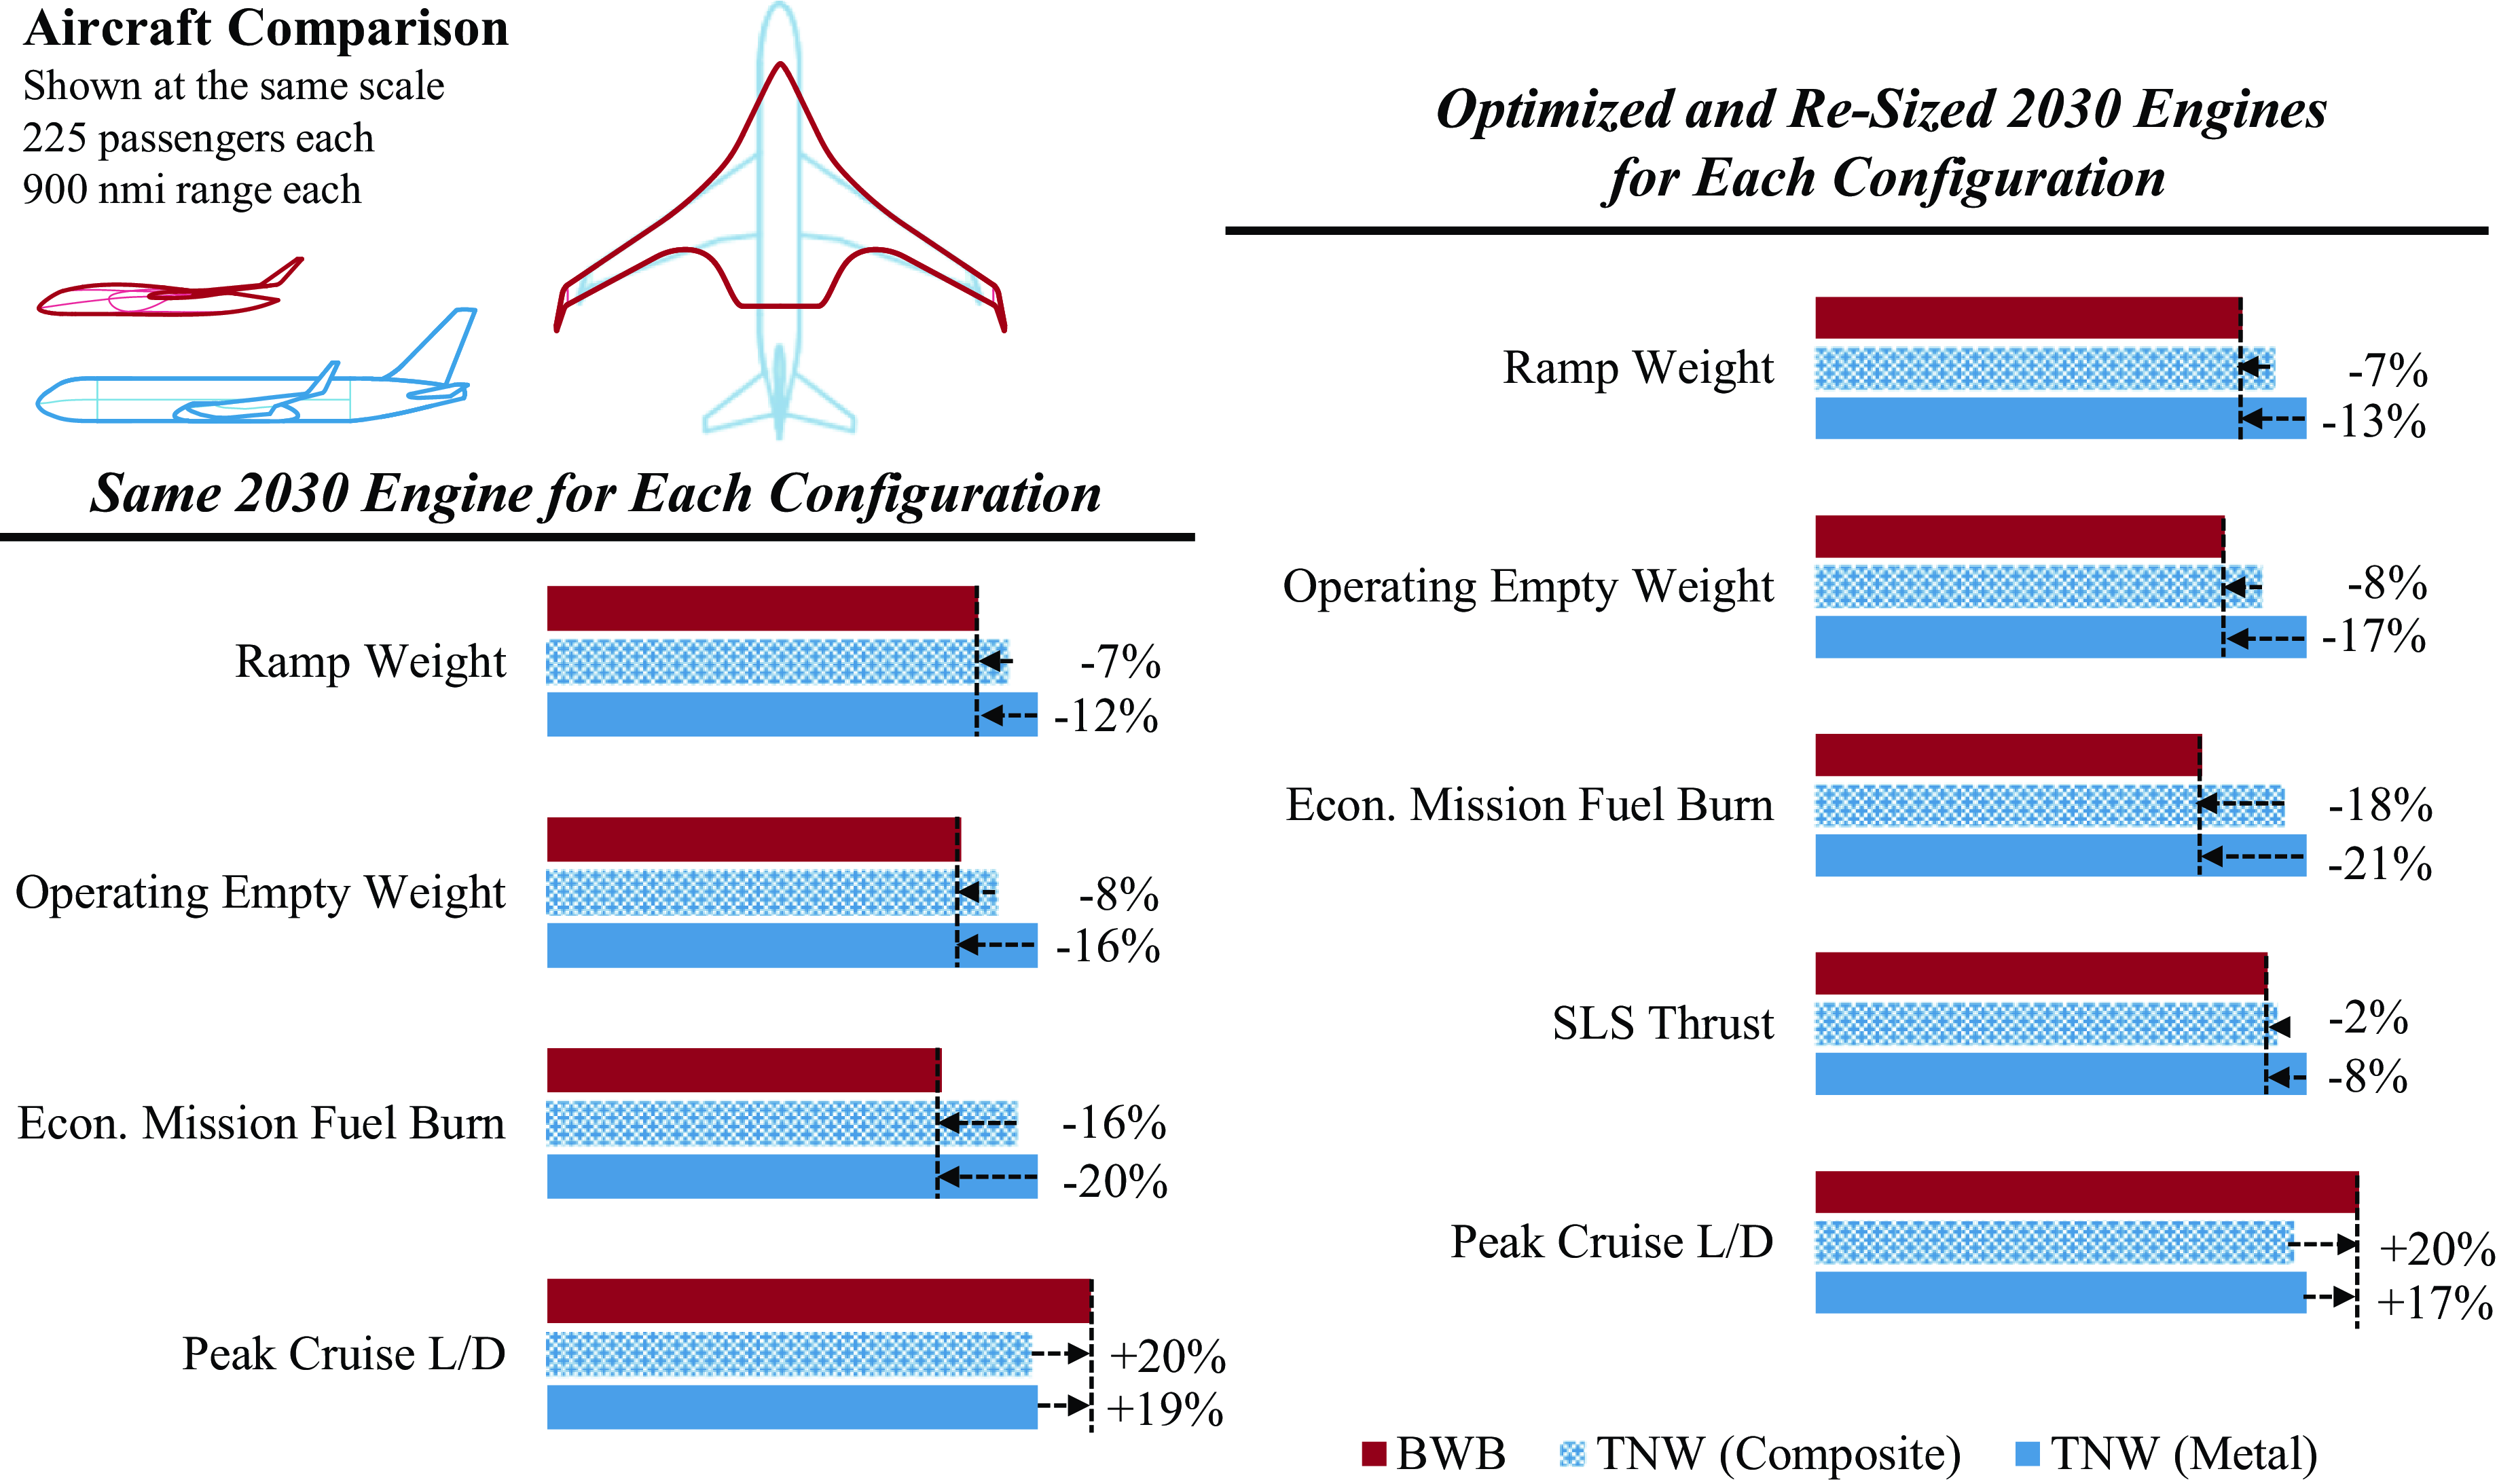
, but only a 16-20% improvement in fuel burn and a 7-12% reduction in ramp weight relative to the TNW variants. Coupled with the 5,000 nmi design mission results, these findings suggest that the efficiency of this BWB relative to reference TNW tends to improve for longer mission ranges. This observation is further supported by the trends shown in Fig. 10. Here, the BWB fuel burn savings relative to the TNW metal and composite configurations are presented for a sweep of off-design mission ranges from 5,000 nmi down to 800 nmi. The payload is the same as before. The fuel burn savings of the BWB drop from 20-24% to about 16-19% relative to both TNW variants as the mission range is shortened to 800 nmi.
$L/D$
, but only a 16-20% improvement in fuel burn and a 7-12% reduction in ramp weight relative to the TNW variants. Coupled with the 5,000 nmi design mission results, these findings suggest that the efficiency of this BWB relative to reference TNW tends to improve for longer mission ranges. This observation is further supported by the trends shown in Fig. 10. Here, the BWB fuel burn savings relative to the TNW metal and composite configurations are presented for a sweep of off-design mission ranges from 5,000 nmi down to 800 nmi. The payload is the same as before. The fuel burn savings of the BWB drop from 20-24% to about 16-19% relative to both TNW variants as the mission range is shortened to 800 nmi.
BWB percent fuel burn savings relative to the TNW variants for a sweep of mission ranges.
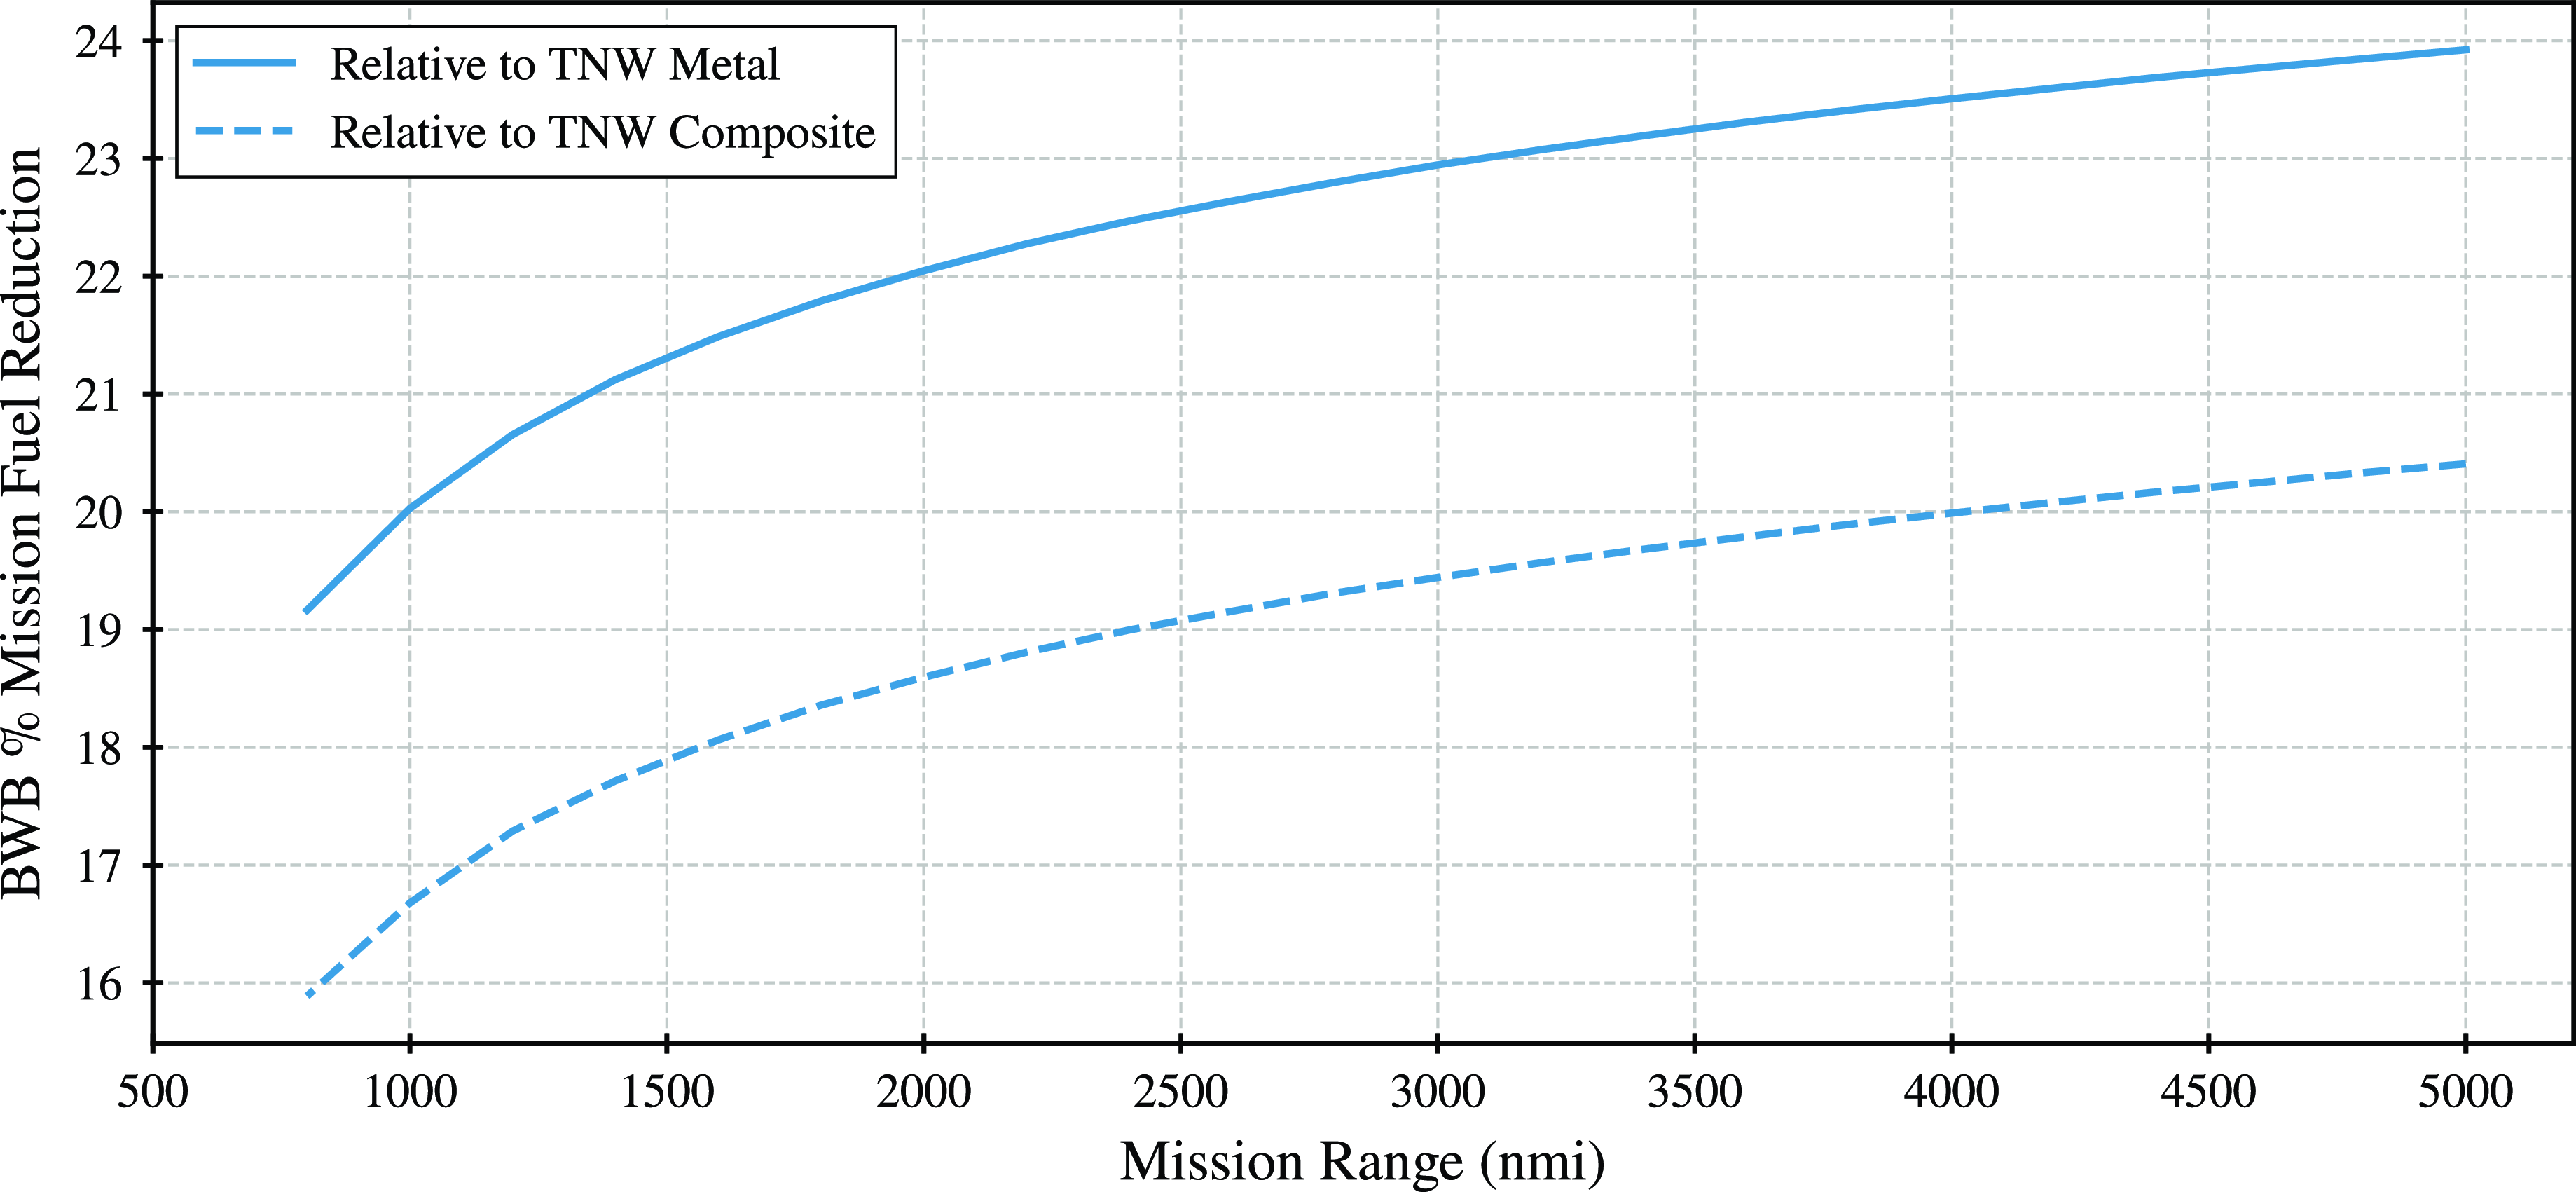
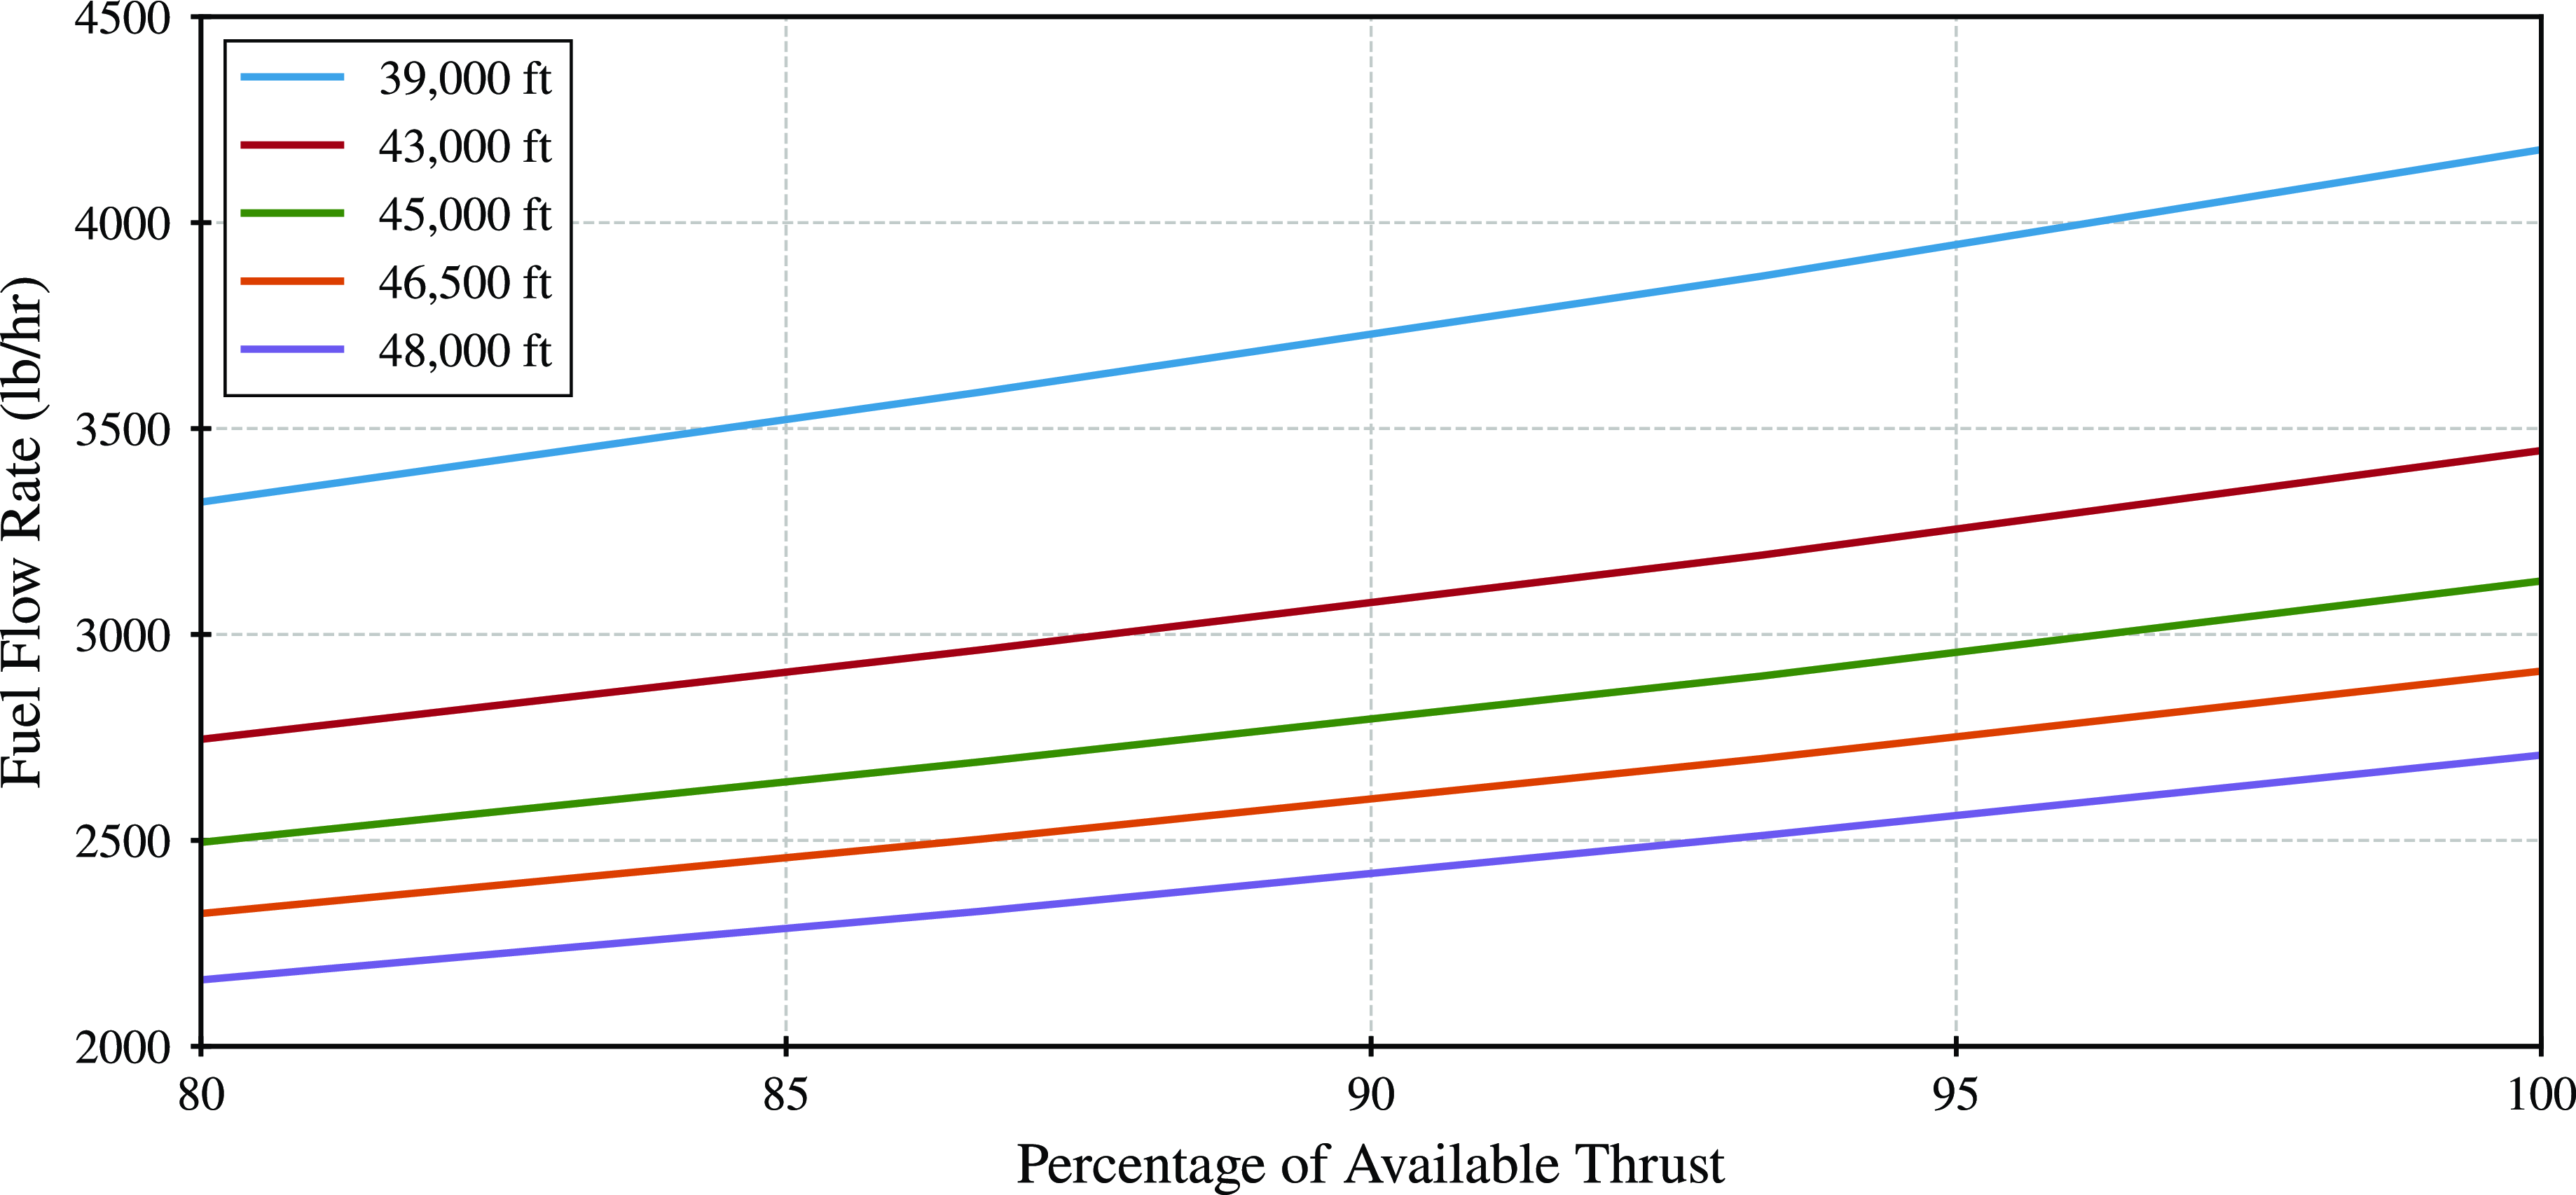
This behaviour is a consequence of the common engine’s performance sensitivity to operating altitude. As the mission range and required fuel decrease, the lighter TNW and BWB cruise at higher altitudes, as evident in Table 3. With the increase in operating altitude, the engine fuel flow rate for a given throttle setting decreases, as indicated in Figure 11. Therefore, the operating cruise fuel flow rate is lower for the shorter missions, as shown in Fig. 12. However, there appear to be diminishing returns in fuel savings with altitude. While the TNW shows a decrease in fuel flow rate by about 700 lb/hr per engine with the start of cruise altitude going up from 37.5 kft to 41.8 kft, the BWB only shows a drop of about 480 lb/hr per engine going from a start of cruise altitude of 43.2 kft to 46.9 kft. Therefore, within the constraints of this study, the BWB’s fuel efficiency relative to the TNW decreases with mission range.
Comparison of the common engine fuel flow rate vs. percentage of available thrust for different altitudes.
Comparison of the fuel flow rate per engine along the cruise segments for the BWB and TNW design and economic missions.
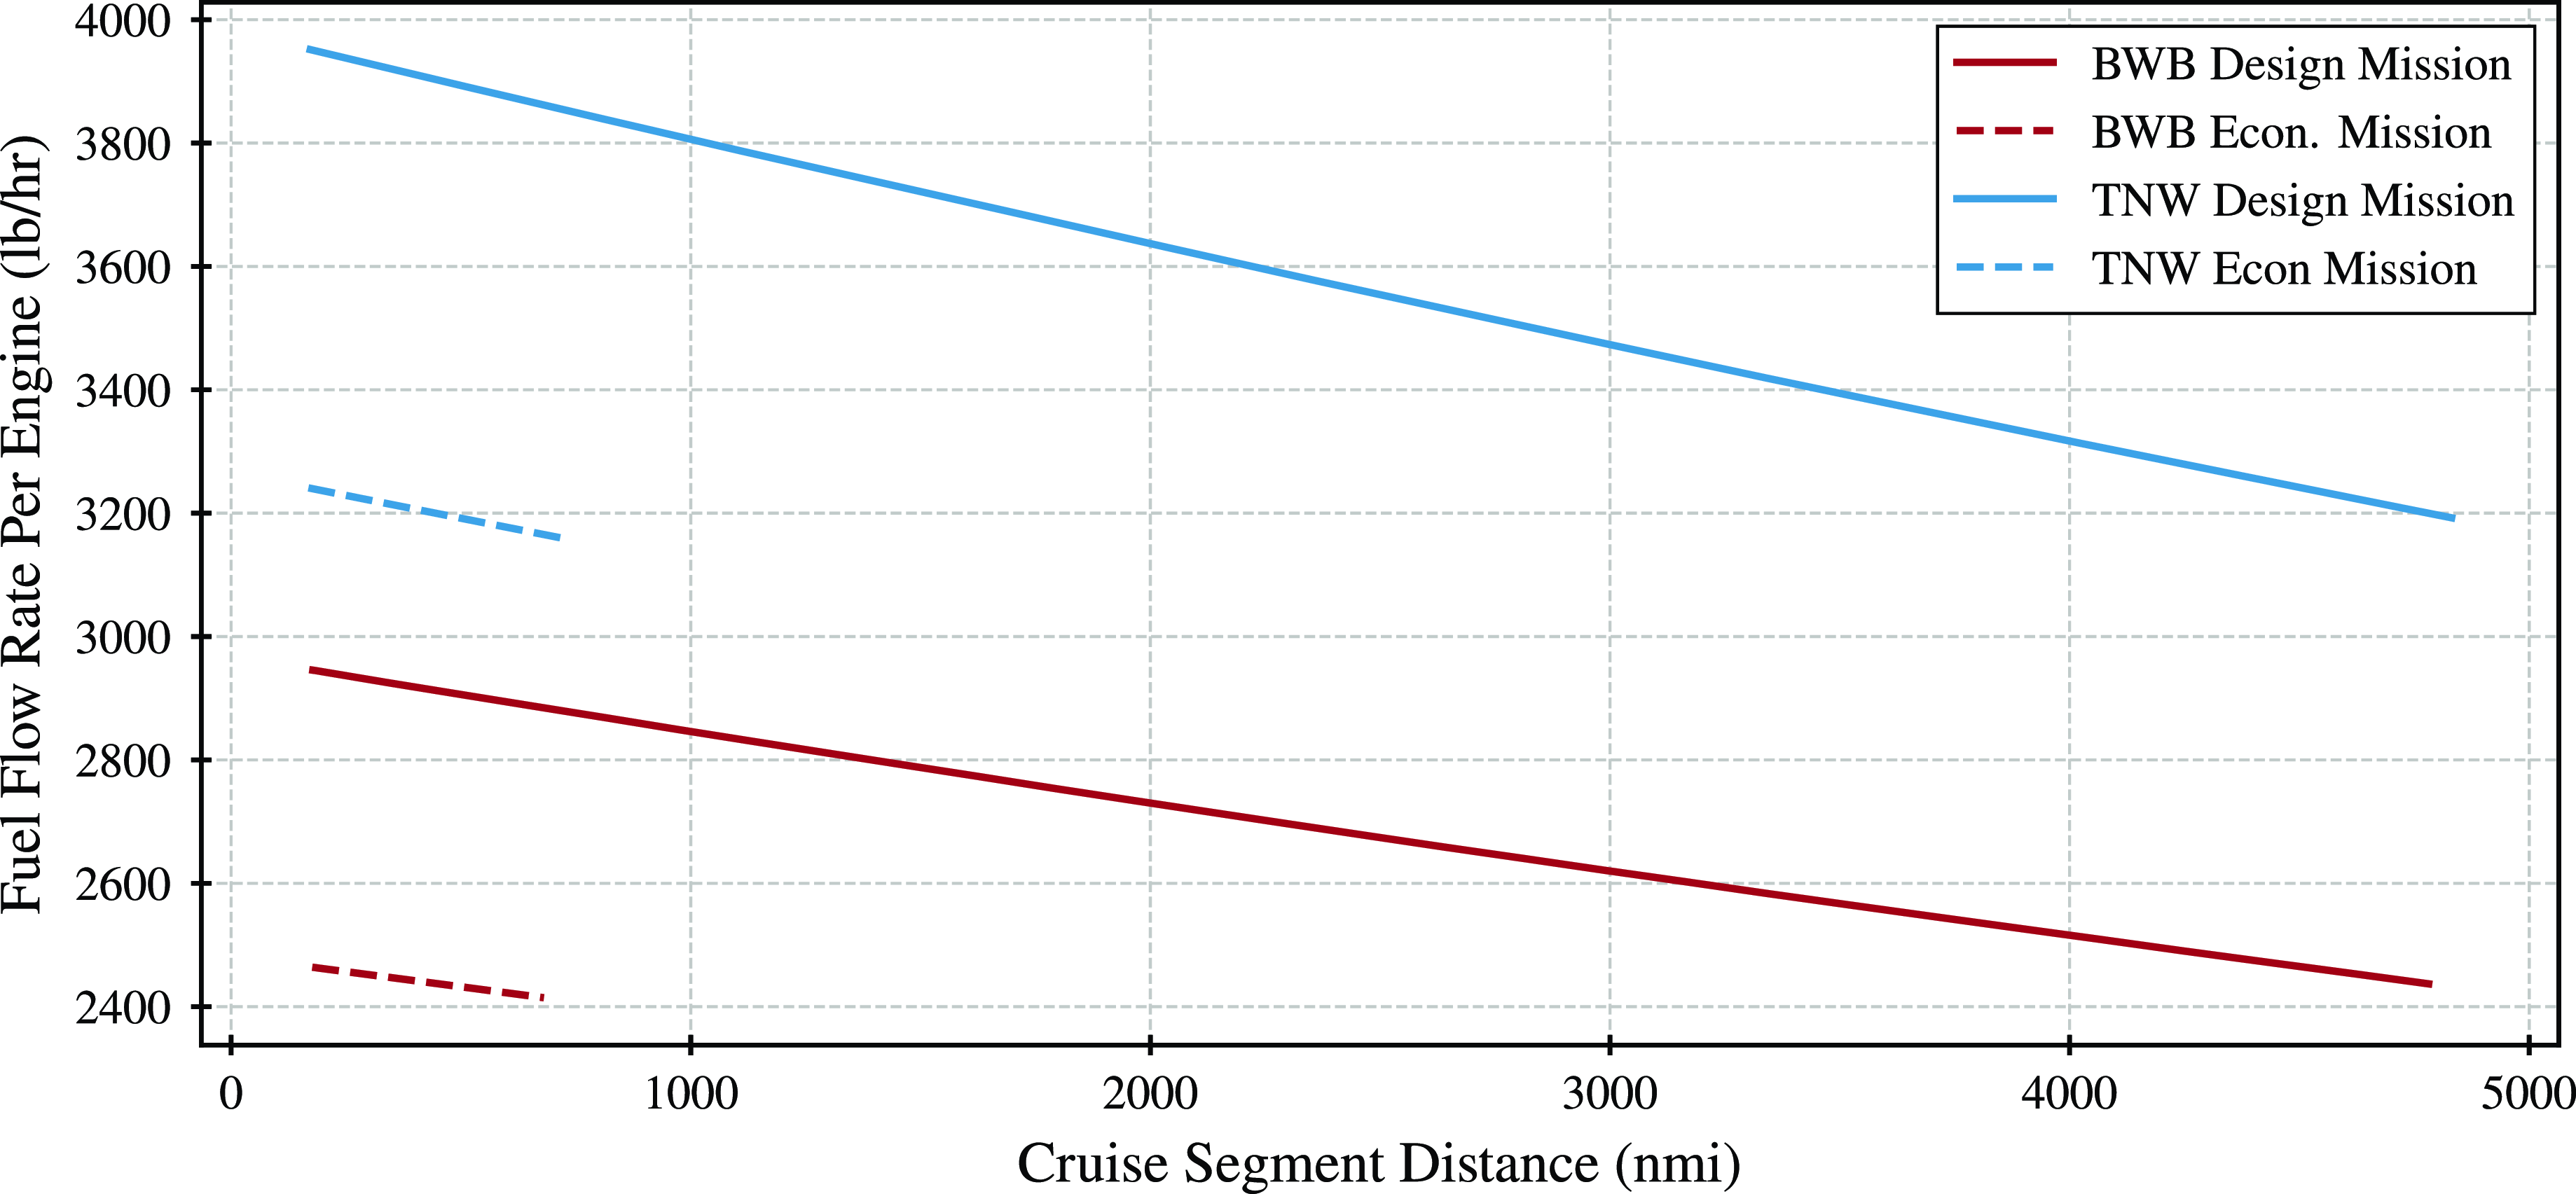
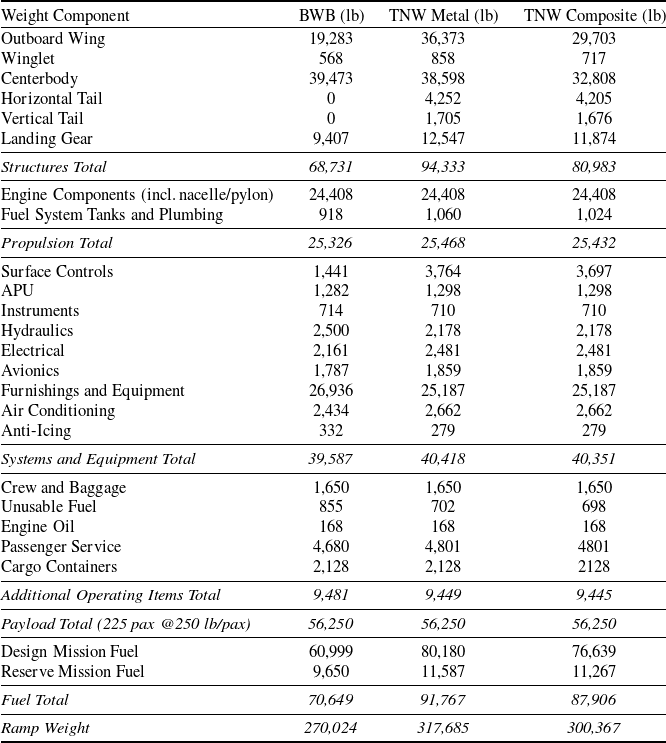
Table 5 compares the detailed component weight breakdowns. The lower operating empty weight of the BWB over the TNW largely stems from the reduced structural weight. PRSEUS is a key enabling technology in reducing the BWB airframe weight, and the lack of empennage for the BWB is also beneficial. The lower ramp weight also means that the landing gear for the BWB does not have to be as heavy as the TNW landing gear. The systems and equipment weight and operating items weight are similar for all three variants. As such, the reduced fuel burn for the BWB is due to the superior aerodynamic efficiency and the lighter structural weight of the airframe compared to the TNW.
Detailed weight breakdown comparison between the BWB and TNW for the design plus reserve missions for the common 43,000 lb engine case
The BWB and TNW performance differences quoted above are comparable to those published in the literature, as presented in the introduction. In particular, these performance changes are only a few percent lower than Liebeck et al. [Reference Liebeck, Page and Rawdon6, Reference Liebeck7] numbers on the configuration change benefit. The 50% and 60% fuel burn savings numbers quoted by DZYNE and JetZero, as mentioned in the introduction, are against reference TNW aircraft with older technology levels, in particular, the engines. Since the same engine constraint is deliberately enforced in the above comparison, the engine technology benefits are not a factor in the fuel burn differences.
4.3 Mission performance comparison (Different optimised Engines)
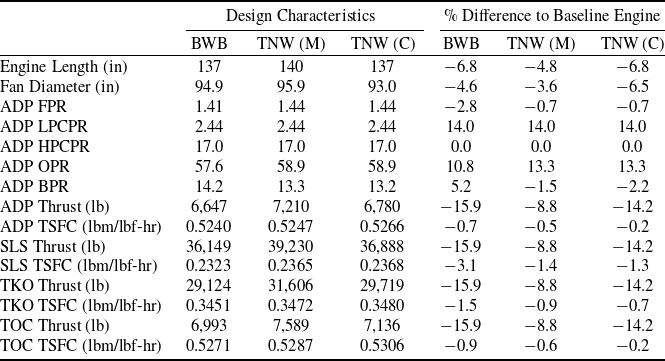
If previous assumptions are relaxed, allowing the 2030 technology-level engines for both the TNW and BWB to re-size while optimizing the cycle to best pair the engine with a given configuration, what do the performance differences look like in this scenario? Table 6 compares the system-level performance for the design, economic, and associated reserve missions. The performance characteristics for the three re-sized and optimised engines are detailed in Table 7, which also presents percentage differences of these values relative to the common 43,000 lb baseline engine used previously. The design points for these three engines are the same as before. The TNW variants share the same cycle, but the engine thrust was allowed to re-scale based on the aircraft ramp weight. Table 8 compares the detailed component weight breakdowns.
Comparison of the system level results for the design and reserve missions, and economic and reserve missions for the different optimised engines case
*Values are presented from SOC to EOC.
Design characteristics of the optimised and re-sized engines for the BWB, the TNW Metal (M), and TNW Composites (C) configurations, compared to the 43,000 lb baseline common engine
Detailed weight breakdown comparison between the BWB and TNW for the design plus reserve missions for the optimised engines case

In general, the performance differences between the BWB and TNW are similar or slightly better than those in the same engine comparison. For the design mission, the BWB shows a 16-18% higher peak operating cruise $L/D$
compared to the TNW variants. Although the drag polars between the common engine and optimised engine cases for a given configuration are the same, the operating cruise
$L/D$
compared to the TNW variants. Although the drag polars between the common engine and optimised engine cases for a given configuration are the same, the operating cruise $L/D$
values are lower than before for the same vehicle. This reduction stems from a lower aircraft weight and thus lower operating cruise
$L/D$
values are lower than before for the same vehicle. This reduction stems from a lower aircraft weight and thus lower operating cruise ${C_L}$
range for each variant. The BWB design mission fuel burn is 25% lower than the TNW metal variant and 21% lower than the TNW composites reference aircraft. The ramp weight of the BWB is still lighter, showing a 16% reduction over the TNW metal variant and a 10% reduction over the TNW composite reference case. For the economic mission, the BWB shows a 17-20% improvement in operating cruise
${C_L}$
range for each variant. The BWB design mission fuel burn is 25% lower than the TNW metal variant and 21% lower than the TNW composites reference aircraft. The ramp weight of the BWB is still lighter, showing a 16% reduction over the TNW metal variant and a 10% reduction over the TNW composite reference case. For the economic mission, the BWB shows a 17-20% improvement in operating cruise $L/D$
, a 17-21% improvement in fuel burn, and a 7-13% reduction in ramp weight relative to the TNW variants. Figure 13 shows the off-design fuel efficiency trends of the BWB relative to the TNW variants. Although the BWB still presents a lower fuel efficiency compared to the TNW variants for lower mission ranges, the loss in performance is smaller, with a difference of 17-21% at the 800 nmi range as opposed to 16-19% previously.
$L/D$
, a 17-21% improvement in fuel burn, and a 7-13% reduction in ramp weight relative to the TNW variants. Figure 13 shows the off-design fuel efficiency trends of the BWB relative to the TNW variants. Although the BWB still presents a lower fuel efficiency compared to the TNW variants for lower mission ranges, the loss in performance is smaller, with a difference of 17-21% at the 800 nmi range as opposed to 16-19% previously.
All three vehicles favour smaller thrust class engines, which results in a reduction in their operating cruise altitude. Compared to the TNW metal configuration, the BWB shows an 8% reduction in SLS thrust, which drops to 2% relative to the TNW composite configuration. The length and diameter of all three engines are smaller than the common engine used previously. As expected, optimization decreased FPR and increased OPR, resulting in lower thrust-specific fuel consumption (TSFC) for all three engines at all design points compared to the common engine. All three vehicles have a lower operating weight as a consequence of the lighter engines. The other component weight changes relative to the previous scenario are a consequence of re-sizing the airframes for the new engines.
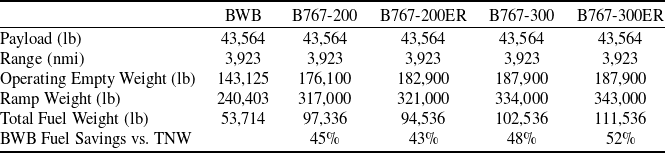
Although not part of the original problem scope, it is still informative to compare the total fuel required for the BWB design and reserve mission to the currently flying variants in the Boeing 767 family, with existing engines, for the same payload and range requirements. Sections 3.2.1 to 3.2.4 in Ref. [20] show the payload-range diagrams for the Boeing 767-200, 200ER, 300, and 300ER respectively. The Boeing 767-200 cannot fly the design payload-range point considered previously in this study. As such, another common point had to be determined to compare the aircraft performance. The payload-range diagram for the 767-200 quotes an operating empty weight of 176,100 lb. As a crude approximation, this operating empty weight is assumed to be the same regardless of range. The sum of the operating empty weight and payload is also provided in this diagram from which the payload is estimated to be 43,564 lb. The maximum range that can be flown for this particular payload and empty weight is estimated to be 3,923 nmi with a maximum design taxi weight (ramp weight) of 317,000 lb. The maximum design taxi weights are then estimated for the other 767 variants from their respective diagrams for the 43,564 lb payload and 3.923 nmi range pair. The total fuel weight is then calculated as the maximum design taxi weight minus the operating empty weight and payload. Table 9 compares the BWB with the 43,000 lb SLS thrust engine to the Boeing 767 variants. The BWB’s overall 43-52% fuel savings over the 767 family is consistent with JetZero’s publicly quoted fuel burn savings for their BWB. In this instance, it is both the airframe and 2030 engine upgrades on the BWB, relative to the existing 767s, that contribute towards this larger fuel savings.
5. Conclusions
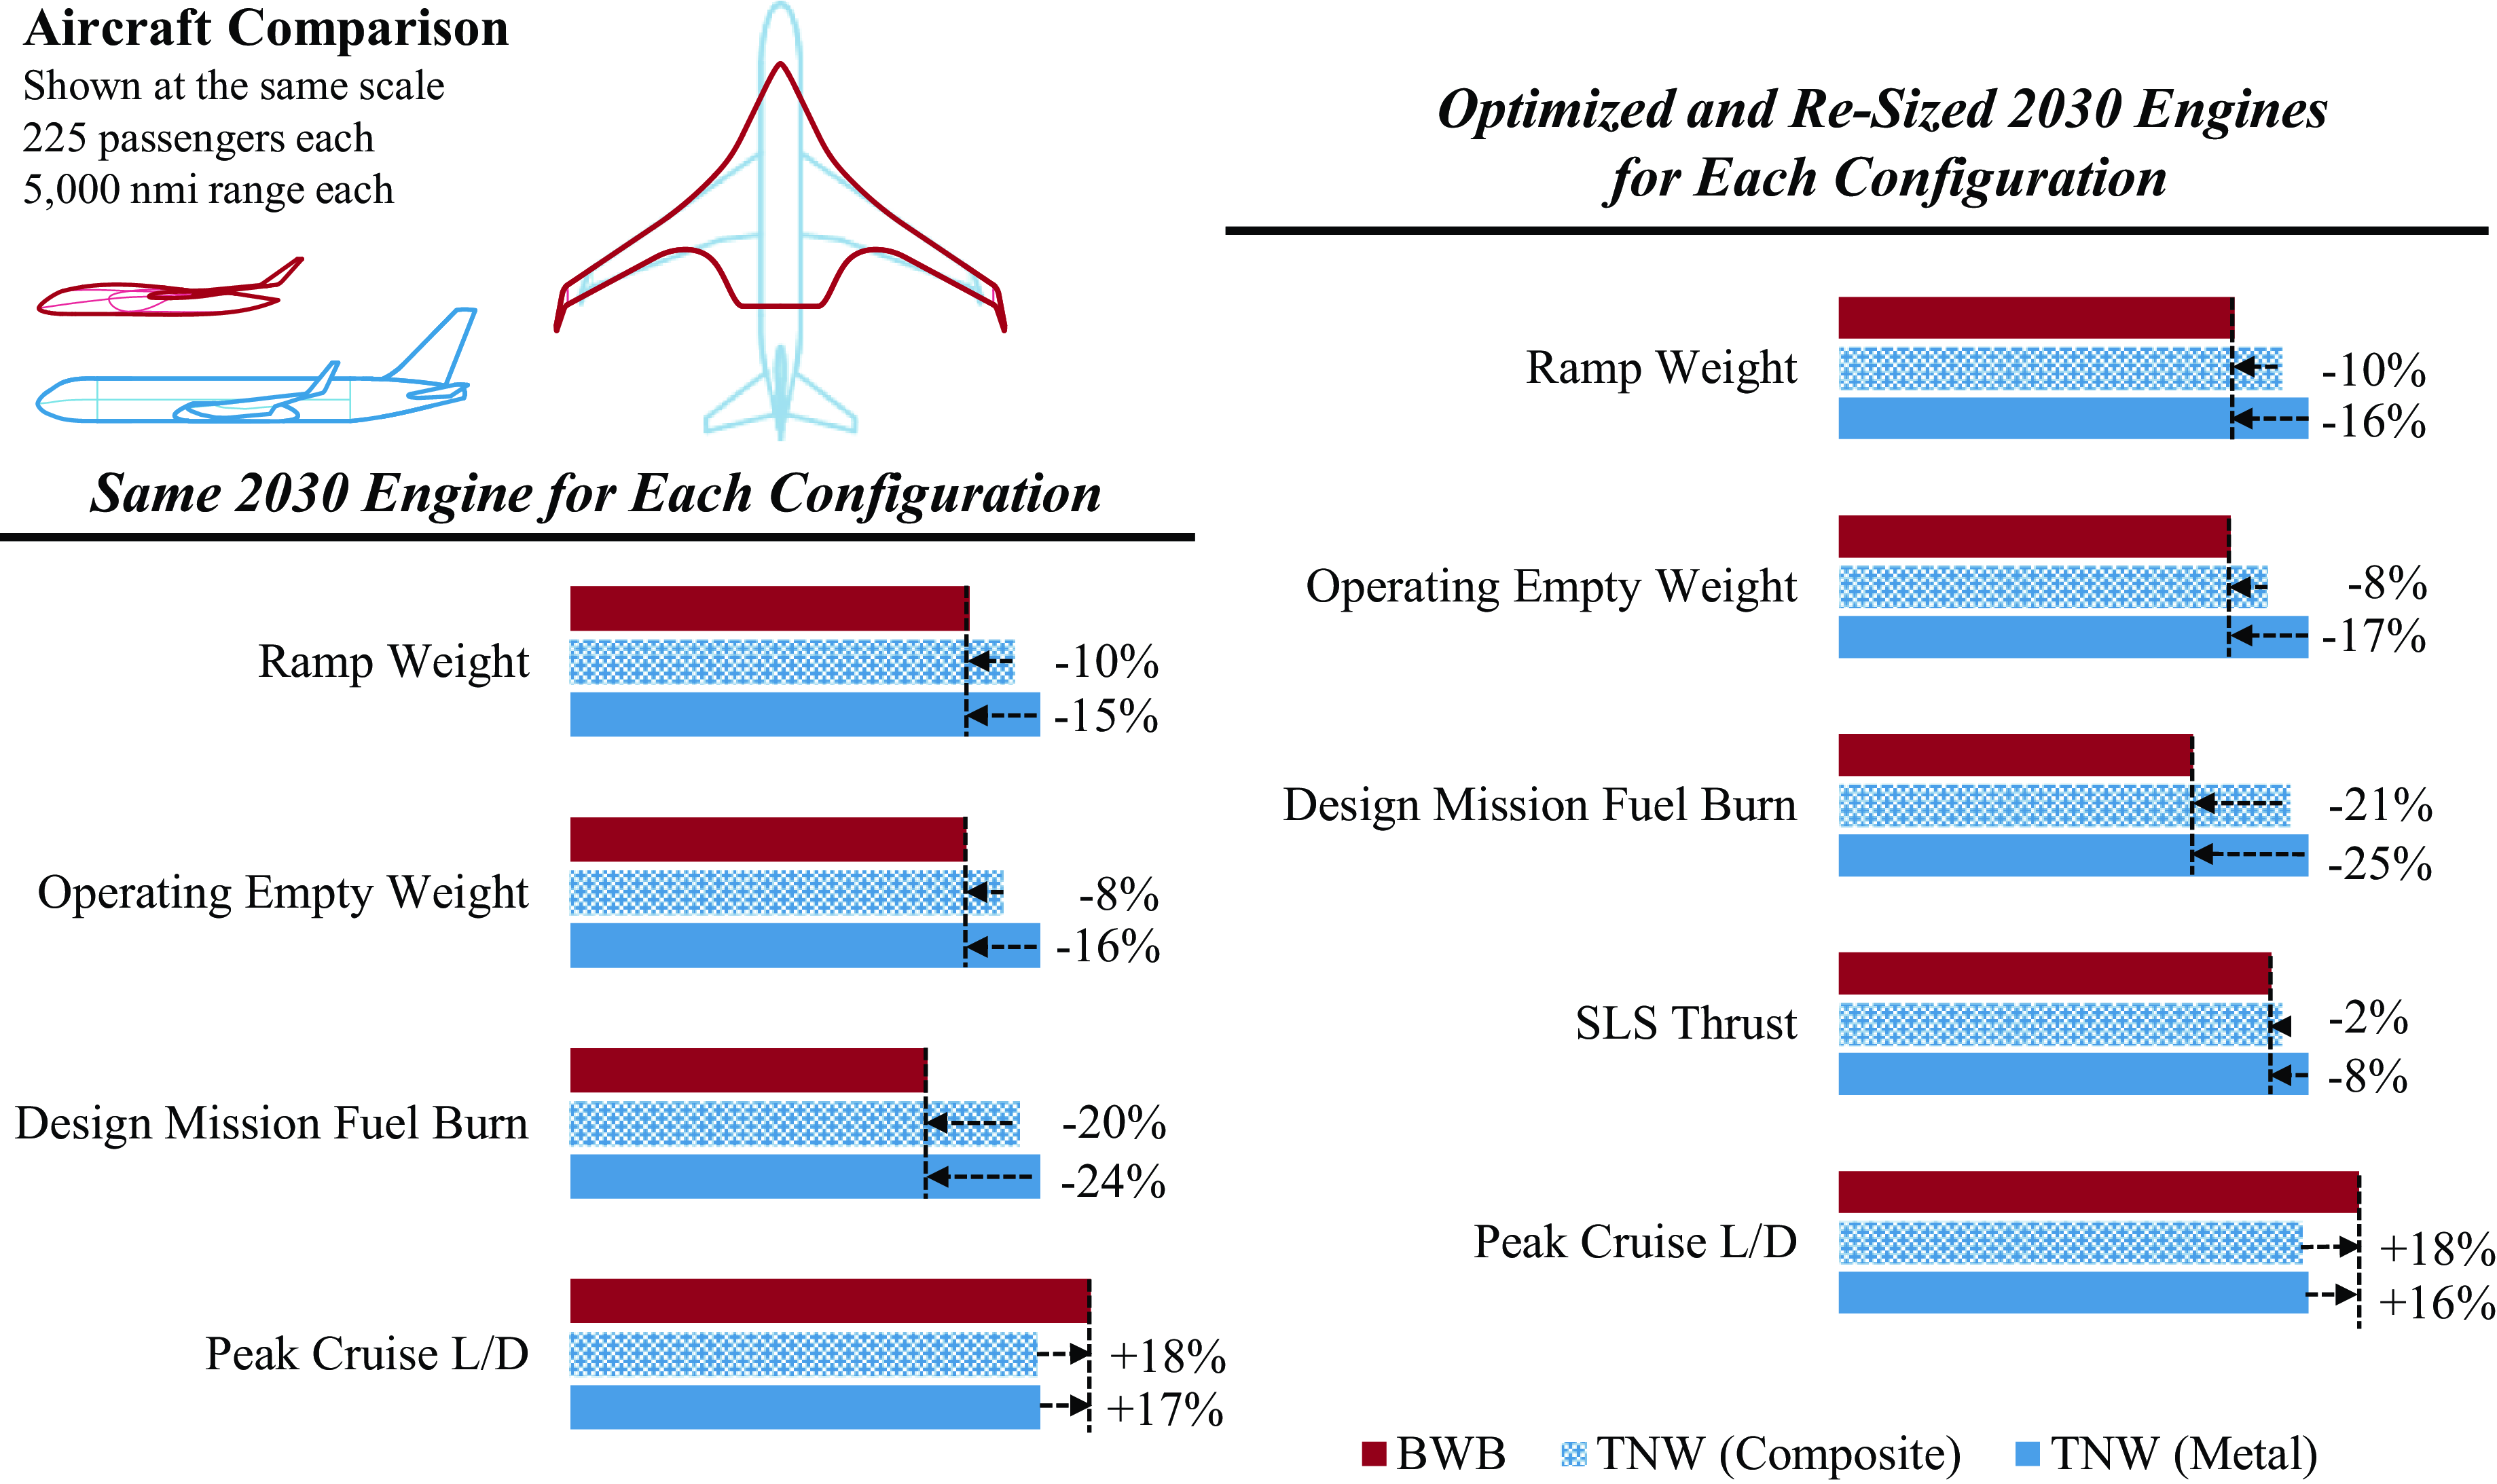
This study aimed to quantify the benefit of the BWB configuration over the TNW. To ensure an equivalent comparison, both aircraft were designed to carry 225 passengers and fly a 5,000 nmi design mission range. A reserve mission with a 200 nmi range to an alternate airport was also included. Both aircraft used the same engines, designed for a 2030 time frame with a 43,000 lb SLS thrust. Starting with internally developed parametric geometry models, both the BWB and TNW were optimised using CFD simulations, multi-fidelity techniques, and gradient-free approaches. CFD was then used to generate a set of drag polars spanning the flight envelope for both the BWB and TNW to use with the mission analysis. A second comparison was also performed where the engines for the BWB and TNW were allowed to re-size while optimizing the engine cycle for each configuration. Two variants of the TNW were modelled, one with metallic structures and one that uses composites. Figure 14 summarizes the design mission performance differences between the BWB and TNW for these two comparisons, whereas Fig. 15 summarizes the 900 nmi economic mission performance differences. The results demonstrate that the BWB airframe outperforms the TNW configuration, with the benefits stemming from the aerodynamically superior and structurally lighter airframe.
Comparison of the BWB to the Boeing 767 family for a 3,923 nmi mission range and a 43,564 lb payload
BWB percent fuel burn savings relative to the TNW variants for a sweep of mission ranges for the different engines case.
It is important, however, to note that the performance differences presented in this paper are subject to a certain degree of uncertainty, as a consequence of the scope of this effort and the resulting assumptions made in the analysis. The goal of future research studies should be to minimize this uncertainty by addressing the multidisciplinary design aspects not considered within the scope of this work.
For example, a natural extension to this work would be to incorporate a detailed structural layout and size the structural members for both the BWB and TNW subject to different loading conditions, using a coupled aero-structural methodology. The goal is to use FEM to estimate the structural weights of both the BWB and the TNW, for different materials, thereby elevating the structural weight estimations to a similar level of fidelity as the aerodynamic analysis. Although this study uses low-fidelity structural weight estimates from FLOPS for both the BWB and the TNW, these models have a higher degree of uncertainty for the BWB, as discussed previously. Using FEM instead for both configurations would be consistent with the spirit of an equivalent comparison between both vehicles, while also reducing the potential errors that may have been previously introduced by using lower fidelity models that miss key physics considerations.
On the aerodynamics side, a logical progression would be to focus on propulsion-airframe integration. This matter is not trivial and interference effects due to poorly integrated engines can result in a substantial performance penalty. Although the integration of engines in a conventional under-wing mounted position for TNWs is well established and understood, this integration for BWBs is more challenging. Future work should focus on obtaining CFD-level estimates of the aerodynamic performance of the airframe plus engines, optimising the OML of the airframe and nacelle/pylon to minimize adverse interference effects. Ideally, this propulsion-airframe integration effort should be extended towards obtaining a model of the drag difference due to the integration of the engines, as a function of flight conditions and engine size. This model can then be incorporated in tools like FLOPS and NPSS where vehicle/engine sizing exercises can benefit from the inclusion of parametric higher-fidelity physics information such that aerodynamic performance constraints on the engine size can be better captured in the design process.
Summary of the performance differences between the BWB and the TNW for the design mission.
Summary of the performance differences between the BWB and the TNW for the economic mission.
Lastly, rather than constraining the planform shapes to known public designs and optimising just the aerofoil stack, the design space can be expanded to include planform variables such as aspect ratio, taper, sweep, wing root location, etc. There is a potential for unlocking improved levels of performance by expanding this design space. However, the stability characteristics of the planforms then become even more important in the design process, especially for BWBs. As such, aspects like static margin, static longitudinal stability characteristics, directional control, and to a certain extent even some dynamic stability characteristics like roll rates and damping frequencies need to be considered early on in addition to aerodynamic performance. Doing so will ensure the feasibility and adequate controllability of the resulting designs. Important trades between performance and stability characteristics can be uncovered through this multi-objective design study.
The work presented in this paper presents an initial quantification of the differences between the BWB and TNW configurations, taking great care to maintain a state of equivalency with respect to the modelling fidelity, mission requirements, and assumptions made for the two configurations, for a fair comparison. This effort serves as a foundation that other more detailed comparative studies can build upon, further improving the confidence in the quantified differences.
Competing interests
The authors declare that they have no competing interests.


 Open access