


1. INTRODUCTION
Ionospheric disturbances, caused mainly by space weather processes, are the single most important cause of Global Navigation Satellite System (GNSS) positioning performance deterioration (Klobuchar, Reference Klobuchar1987; Davis, Reference Davis1990; Parkinson and Spilker, Reference Parkinson and Spilker1996; Filjar, Reference Filjar2008). Considering the growing importance of GNSS as an underlying foundation for numerous technological, social and economic systems, forecasting and mitigation of the ionospheric effects on GNSS performance have become an essential task in protection of national infrastructure. The extremely high population density in mid-latitudes adds to the importance of reliable ionospheric disturbances forecasting and mitigation.
The Disturbance storm-time (Dst) index (Hamilton et al., Reference Hamilton, Gloeckler, Ipavich, Wilken and Stuedemann1988), one of the parameters describing the condition of the geomagnetic field, has been considered for some time to be in direct relation with the causes of the ionospheric storms (Cerrato et al., Reference Cerrato, Saiz, Cid and Hidalgo2003; Srivastava, Reference Srivastava2006). Although related to geomagnetic phenomena by measuring the variations of geomagnetic field at (mostly) low- and (some) mid-latitude reference stations (Hamilton et al., Reference Hamilton, Gloeckler, Ipavich, Wilken and Stuedemann1988), Dst has been sometimes considered a potential indicator of the ionospheric storms elsewhere, mid-latitudes in particular (Hamilton et al., Reference Hamilton, Gloeckler, Ipavich, Wilken and Stuedemann1988). The argument for that has been found in the role of the globally symmetrical equatorial electro jet (so-called ring-currents) forming around the equator but with possible extensions of their effects to mid-latitudes (Cerrato et al., Reference Cerrato, Saiz, Cid and Hidalgo2003; Anh et al., Reference Anh, Yu, Wanliss and Watson2005). This has led to a hypothesis of Dst's potential use in indication of the approaching ionospheric storm (Cerrato et al., Reference Cerrato, Saiz, Cid and Hidalgo2003; Anh et al., Reference Anh, Yu, Wanliss and Watson2005), as well as possible deterioration of GNSS performance.
Here we provide a contribution to validation of this hypothesis by analysing the correlation between time series of three-dimensional Global Positioning System (GPS) positioning samples observed at the reference station Medicina, Italy, and Dst values, both taken during the severe space weather event in late October 2003 (also known as the Halloween 2003 space weather event). In an approach to relate directly the Dst and GPS positioning error observables, we have found no evidence of direct relation between the Dst index dynamics and the appearance of the GPS positioning error.
This paper provides a brief overview of the previous research on the subject, followed by the outline of the hypothesis of the Dst index as a potential indicator of approaching deterioration of GNSS performance in mid-latitudes. A case study of the severe space weather disturbance in late October 2003 is presented, and a methodology used for examination of a potential relationship between Dst index and GPS positioning performance degradation at a mid-latitude site presented. The results of the analysis are presented and discussed. The paper concludes with the summary of findings and an outline of the following near-term activities.
2. PREVIOUS RESEARCHES
The GNSS ionospheric delay, a single-frequency group delay for single-frequency commercial GNSS receivers, is the major single source of GNSS positioning error. It can be expressed as shown in Equation (1).
 $$\Delta t_{iono} = \displaystyle{1 \over c} \cdot \int_0^{h_\max} {(1 - n) \cdot dh} $$
where:
Δt iono is the GPS ionospheric delay.
c is the velocity of radio wave propagation.
n is the index of radio wave refraction.
h is the height above sea level.
h max is the height of the upper limit of the ionosphere.
Magneto-ionic theory yields the Appleton-Hartree equation for the index of radio wave refraction n as presented in Equation (2).
 $$n^2 = 1 - \displaystyle{X \over {1 - i \cdot Z - \displaystyle{{Y_T ^2} \over {2 \cdot (1 - X - i \cdot Z)}} \pm \sqrt {\displaystyle{{Y_T ^4} \over {4 \cdot (1 - X - i \cdot Z)^2}} + \mathop Y\nolimits_L^2}}}} $$
where:
 $$X = \displaystyle{{N(h) \cdot \mathop e\nolimits^2} \over {\varepsilon _0 \cdot m \cdot \omega}} = \displaystyle{{\,f_N ^2} \over {\,f^2}} $$
 $$Y_L = \displaystyle{{e \cdot B_L} \over {m \cdot \omega}} = \displaystyle{{f_H \cdot \cos \Theta} \over f}$$
 $$Y_T = \displaystyle{{e \cdot B_T} \over {m \cdot \omega}} = \displaystyle{{\,f_H \cdot \sin \Theta} \over f}$$
 $$Z = \displaystyle{\upsilon \over \omega} $$
and:
f is the system operating frequency.
N(h) is the vertical ionospheric profile.
e is the electron charge.
ε 0 is the permittivity of free space.
m is the rest mass of electron.
υ is the electron collision frequency.
Θ is the ray angle with the geomagnetic field.
f H is the electron gyro frequency.
f N is the plasma frequency.
B L is the longitudinal component of the induced magnetic field with reference to the direction of wave normal (phase propagation) (Davis, Reference Davis1990).
B T is the transverse component of the induced magnetic field with reference to the direction of wave normal (phase propagation) (Davis, Reference Davis1990).
 $$i = \sqrt { - 1} $$
Abandoning the negligible factors, the index of radio wave refraction can be approximated as follows:
 $$n \approx 1 - \displaystyle{X \over 2}$$
thus practically defining the GNSS ionospheric delay as:
 $$\Delta t = \displaystyle{{40\! \cdot\! 3} \over {c \cdot f^2}} \cdot \int_{h_{\min}} ^{h_{\max}} {N(h) \cdot dh} $$
where:
h min … lower limit of the ionosphere
The vertical ionospheric profile N(h) i strongly determined by the ionisation processes in the upper atmosphere, and related to space weather, geomagnetic and ionospheric activity. The integral component of Equation (9) is also known as the Total Electron Content, as presented in Equation (10).
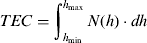 $$TEC = \int_{h_{\min}} ^{h_{\max}} {N(h) \cdot dh} $$
The Disturbances storm-time (Dst) index belongs to the essential set of parameters that describe the ionospheric and geomagnetic conditions, along with the Total Electron Content (TEC), and geomagnetic Kp, A and Ap indices. Dst index is defined to describe the global ring-currents forming above the sub-equatorial region, and probably affecting the ionospheric regions in mid-latitudes.
Although (Campbell, Reference Campbell1996) warned over the possibly over-simplistic approach in considering Dst as a single parameter describing the approaching geomagnetic disturbances, a growing number of references (Cerrato et al., Reference Cerrato, Saiz, Cid and Hidalgo2003; Anh et al., Reference Anh, Yu, Wanliss and Watson2005) have emphasised the role of Dst not only for description of the geomagnetic conditions over equatorial and sub-equatorial regions, but also for mid-latitudes.
Respecting the evident complexity of the process, some authors have taken a different approach in modelling ionospheric storms using several geomagnetic and ionospheric parameters (Tsagouri et al., Reference Tsagouri, Belehaki and Cander2005; Gulyaeva and Stanislawska, Reference Gulyaeva and Stanislawska2008; Gulyaeva et al., Reference Gulyaeva, Stanislawska and Filjar2009).
3. DST AS AN INDICATOR OF GNSS PERFORMANCE DETERIORATION
The Dst index is defined as a descriptor of geomagnetic activity, especially the condition of the ring-currents taking place in sub-equatorial ionospheric regions during geomagnetic and ionospheric storms (Davis, Reference Davis1990; Campbell, Reference Campbell1996; Anh et al., Reference Anh, Yu, Wanliss and Watson2005; Gulyaeva and Stanislawska, Reference Gulyaeva and Stanislawska2008). The effects of ring-currents have been thought of as being capable of manifesting themselves at mid-latitudes (Hamilton et al., Reference Hamilton, Gloeckler, Ipavich, Wilken and Stuedemann1988; Anh et al., Reference Anh, Yu, Wanliss and Watson2005), thus extending the coverage of the ionospheric storm and affecting technology systems over an extended area. This led to a hypothesis of potentially using the Dst index as an additional single indicator of geomagnetic and ionospheric storms in mid-latitude regions (Cerrato et al., Reference Cerrato, Saiz, Cid and Hidalgo2003; Anh et al., Reference Anh, Yu, Wanliss and Watson2005). Observing the Dst dynamics may result in reliable forecasting of the occurrence of the ionospheric storms (Cerrato et al., Reference Cerrato, Saiz, Cid and Hidalgo2003; Anh et al., Reference Anh, Yu, Wanliss and Watson2005; Gulyaeva and Stanislawska, Reference Gulyaeva and Stanislawska2008), potentially threatening events for satellite navigation performance and operation (Parkinson and Spilker, Reference Parkinson and Spilker1996; Filjar, Reference Filjar2008), since the storms can induce a variety of the effects that can deteriorate the positioning performance of a satellite navigation system, and affect the integrity of the system itself. The GPS ionospheric delay, causing later than expected arrival of the GPS positioning signal at the GPS aerial, is directly related to the Total Electron Content and the vertical profile of the ionosphere, determined by the ionospheric and geomagnetic conditions, and the impact of the space weather (Klobuchar, Reference Klobuchar1987; Parkinson and Spilker, Reference Parkinson and Spilker1996; Filjar, Reference Filjar2008).
The confirmation of the correlation between the two supposedly linked parameters (GPS positioning error and Dst index) is essential in verification of their link.
4. CASE-STUDY VALIDATION
In order to challenge the hypothesis, our team conducted an analysis of GPS positioning samples taken at the mid-latitude International GNSS Service (IGS) reference station at Medicina, Italy during the Halloween 2003 ionospheric storm (29 October, 2003–1 November, 2003). Single-frequency positioning samples were obtained by post-processing of the pseudo-range observables, stored on the International GNSS Service web-archive (IGS, 2012) in the standardised Receiver Independent Exchange Format (RINEX) files (Gurtner and Estey, Reference Gurtner and Estey2009). The RINEX is a data exchange format that allows users for raw GNSS data (observed pseudo-ranges and carrier-phase data, broadcast navigation message, meteorological conditions during observation etc.) collection, seamless interchange and post-processing. Single-frequency positioning samples were obtained using the common position estimation algorithm described elsewhere (Parkinson and Spilker, Reference Parkinson and Spilker1996).
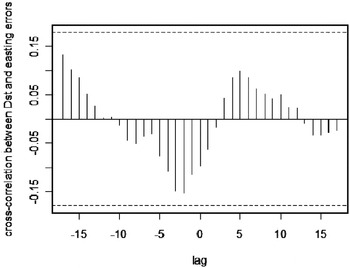
The rationale for performing the single-frequency GPS positioning lies in our intention to assess the impact on commercial GPS users, who overwhelmingly use the single-frequency receivers. The samples were not corrected for the GPS ionospheric delay (Klobuchar model, [Klobuchar, Reference Klobuchar1987], had not been applied). The GPS positioning samples obtained from RINEX files were normalised to the actual position of the reference station, and the related positioning error (northing, easting and height) were obtained. Time series of related positioning errors were used for further correlation analysis with the time series of hourly Dst observations (Figure 1). Comparison with northing- (Figure 2), easting- (Figure 3), and height-error (Figure 4) time series yielded a series of cross-correlation diagrams, presented on Figures 5–7, respectively, with the significance bounds presented as dotted lines.
The large ionospheric storm occurred in the period between 27 October 2003 (day 300) and 1 November 2003 (day 305), a phenomenon known as the Halloween 2003 event.

Northing error observed at the reference station Medicina, Italy during the Halloween 2003 event.

Easting error observed at the reference station Medicina, Italy during the Halloween 2003 event.

Height error observed at the reference station Medicina, Italy during the Halloween 2003 event.

Cross-correlation between time series of hourly Dst observations and GPS positioning northing errors.

Cross-correlation between time series of hourly Dst observations and GPS positioning easting errors.
Cross-correlation between time series of hourly Dst observations and GPS positioning height errors.

As shown on Figures 5–7, not a single GPS positioning error component shows a significant level of correlation between the dynamics of Dst index time series. This leads to the conclusion that no evidence has been found for a direct relation between the Dst time series and the time series of GPS positioning errors for the event in consideration. A conclusion can be drawn that the huge ionospheric storm in late October 2003 was not driven directly by the possible occurrence of the ring-currents in sub-equatorial region.
5. DISCUSSION
Late October 2003 and early November 2003 brought the most severe solar storms recorded (Evans et al., Reference Evans, Lautenbacher, Rosen and Johnson2004). Time series of Dst values observed from 27 October 2003 to 1 November 2003 show a common pattern of a strong and somewhat extended ionospheric storm. Considerable ionospheric disturbance reportedly affected GNSS (GPS) performance around the world, including the mid-latitudes. Solar storms of such magnitudes reportedly cause significant geomagnetic and ionospheric storms, and the other related phenomena, including the ring-currents.
Observed single-frequency GPS positioning samples and the time series of related GPS positioning error components (northing, easting and height) were carefully analysed. Simple Moving Average (SMA) procedure of the order 120 was performed on the GPS positioning error components time series in order to identify the leading trends (Figure 8, Figure 10, Figure 12, respectively). Finally, a decomposition process was conducted on all three time series, with the results provided on Figure 9, Figure 11, Figure 13. In all three cases, the seasonal component was negligible, and occasional random spikes clearly visible.
Simple Moving Average (SMA) smoothed time series of northing error observations.

Decomposition of northing error time series.

Simple Moving Average (SMA) smoothed time series of easting error observations.

Decomposition of easting error time series.
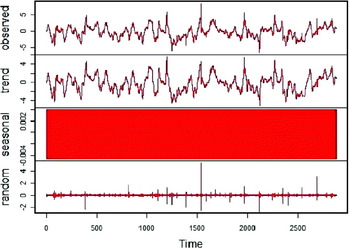
Simple Moving Average (SMA) smoothed time series of height error observations.

Decomposition of height error time series.

It has been presumed that the occurrence of very strong solar, geomagnetic and ionospheric storms would amplify the relation between the parameters of geomagnetic and ionospheric activity including Dst, making them more visible and easier to identify.
Still, the results of our correlation analysis show no evidence to support the hypothesis of the relation between Dst index and formation of mid-latitudes ionospheric storms and deterioration of the GPS positioning performance.
6. CONCLUSION AND FUTURE WORK
Extreme space weather in late October 2003 brought a series of severe solar storms that generated global geomagnetic and ionospheric storms. A number of indices, including the Disturbances storm-time (Dst), confirmed the severity and intensity of the storms that caused considerable deterioration of Global Positioning System (GPS) positioning performance worldwide.
However, detailed analysis of the correlation between deterioration of GPS positioning performance at mid-latitudes and Dst index dynamics revealed no evidence in support of the hypothesis of a direct link between Dst index values and parameters of GPS positioning performance deterioration for the event under consideration.
This leads to the conclusion that, at least in the case of the particularly strong ionospheric storm in October 2003, the sub-equatorial ring-currents did not cause significant effects in the mid-latitude ionospheric regions, and, consequently, no impact on GPS positioning performance.
Further activities related to the assessment of the role of the Dst index in forecasting of the ionospheric-induced GNSS performance degradation effect will be concentrated on a validation of the complex models, where the Dst index will be combined with the other indices of the geomagnetic and ionospheric activity.
ACKNOWLEDGEMENTS
Research activities presented in this paper were conducted in part under the research projects ‘Research into the correlation of maritime-transport elements in marine traffic’ and ‘Environment for Satellite Positioning’ supported by the Ministry of Science, Education and Sports, Republic of Croatia.



