


INTRODUCTION
Worldwide, infection with Neisseria meningitidis continues to be an important cause of morbidity and mortality [Reference Stephens, Greenwood and Brandtzaeg1]. The overall case-fatality rate varies from 5% to 15% in developed and developing countries. Increased age, delayed treatment and septicaemia are risk factors for death and sequelae [Reference Stephens, Greenwood and Brandtzaeg1–3]. Within the last decade, certain meningococcal serogroups, serotypes and serosubtypes (collectively named phenotypes throughout this paper), have been associated with increased risk of death. In a large study, Trotter et al. showed in 11 459 meningococcal disease (MD) cases from the UK in the period 1993–2000 that C:2a and B:2a (serogroup:serotype) gave an almost threefold greater risk of death than group B:1; however, B:15 was also found to be significantly associated with increased risk of death [Reference Trotter4]. In a similar study, Jensen et al. found in 413 cases from one Danish county in the period 1980–1999, that B:15:P1.7,16 and C:2a:P1.2,5 were significantly associated with increased risk of death, compared to all other phenotypes combined [Reference Jensen5].
It has been found that crowded domestic living conditions and intensive mixing of people from various locations are associated with increased carriage of N. meningitidis and the risk of falling ill with MD. This has been shown in households [Reference Purcell6–Reference Moodley, Coetzee and Hussey9], first-year college students living in dormitories or residence halls [Reference Froeschle10, Reference Harrison11], campus bars [Reference Imrey12], and military recruits entering the military for the first time at large recruitment training centres [13–Reference Kadlubowski15]. The most likely person-to-person transmission of N. meningitidis is by direct transfer of upper respiratory tract droplets, whereas indirect transmission via fomites occurs less frequently [Reference Swain and Martin16]. Swain et al. have shown that certain strains of N. meningitidis can survive and stay viable from hours up to days after drying on glass and plastic, with a significant better survival on glass than on plastic [Reference Swain and Martin16]. Subsequently, we were interested in analysing whether persons living in densely populated areas are at a higher risk of falling ill with MD.
In the present study, we combined and analysed comprehensive information on Danish MD cases over more than 30 years in order to identify determinants and time trends of death from MD. A specific objective was to address whether certain N. meningitidis serotypes and serosubtypes are associated with increased risk of morbidity and mortality. Additionally, the aim was to analyse the spatial distribution of MD, including rural and urban differences, and whether residing at an increased distance from a hospital comprised a risk factor for death.
METHODS
The present study was designed as a cohort study, and was based on registry data from four different national registries: (1) The Neisseria and Streptococcus Reference Laboratory registry of N. meningitidis isolates, (2) The National Notification System for MD, (3) The Danish Civil Registration System, and (4) The National Patient Discharge Registry. Serogroup C meningococcal vaccine is not part of the Danish Vaccination Programme.
The Neisseria and Streptococcus Reference Laboratory Registry of N. meningitidis isolates
This registry has held laboratory information on serogroups since 1974 and serotype/serosubtypes since 1992 on all N. meningitidis isolates received from all clinical microbiology departments in Denmark [Reference Lind and Berthelsen17]. The methods and antisera used to determine serogroup, serotype and serosubtype have been described elsewhere [Reference Lind and Berthelsen17, Reference Andersen18] We defined groups of serotype and serosubtypes similarly to the grouping used by Jensen et al. [Reference Jensen5] (see notes to Fig. 2).
The National Notification System for MD
This registry has held information on all mandatory notifications of MD from clinicians since 1 January 1980. We previously showed that the notification system captured >90% of cases annually in the period 1994–2002 [Reference Howitz19–Reference Samuelsson21]. Clinicians include date of disease onset and date of hospital admission on the notification forms. For 1980, we previously found that the median time from disease onset until samples of blood or CSF were obtained from the patients was 1 day. Thus, 1 day was subtracted from the date of sampling during the period 1974–1979, to make disease onset dates comparable throughout the period 1974–2007 [Reference Howitz19].
The Danish Civil Registration System
This registry holds the assigned personal identification number and corresponding civil information on all persons living in Denmark. The registry is updated nightly, e.g. with individual information on emigration, date of death and home address for all persons registered [22, Reference Pedersen23]. The identification number enables linkage of individuals between registries.
The National Patient Discharge Registry
This registry has held information on all admissions and discharge diagnoses issued by Danish hospitals since January 1977. In the period 1977–1993, the International Classification System for Diseases – revision 8 (ICD-8) was used, and by January 1994, updated to the present ICD-10 system. The two systems are not entirely compatible and hence we have only included selected severe neurological sequelae as outcome, i.e. cerebral palsy and plegias of one or more limbs (ICD-8: 34300-34499; ICD-10: G80-G839), epilepsy (ICD-8: 34500-34528, 34530-34599; ICD-10: G40-G409) and perceptive hearing loss (ICD-8: 38800-38999; ICD-10: H903-H910, H912-H919).
Statistical analyses
Data were analysed using unconditional logistic regression with the outcome dead or alive at day 31 after MD onset. The age groups (<1, 1–4, 5–9, 10–19, 20–49, >50 years) were chosen by scrutinizing the case-fatality rates over a continuous age span, and the calendar periods were grouped in ~5-year intervals (1974–1979, 1980–1984 up to 2000–2004, and 2005–2007). The best fits of the logistic regression model were approached by removing one variable at a time from the model with the higher number of explanatory variables, including serogroup, serotype and serosubtype of isolate, age groups, calendar periods, sex, and county of residence. Likelihood-ratio tests were applied to determine whether the variable altered the model markedly, defined as P<0·2. In all models we adjusted for age group, sex and calendar period.
In the analyses with selected severe neurological sequelae, we applied a Cox regression model, adjusting for clinical manifestation, age group, sex, calendar period and county of residence. Patients who had diagnoses within the same diagnostic group prior to the MD incident were censored, as were patients who emigrated, died or were lost-to-follow-up.
For the analyses of spatial distribution, we retrieved the x,y-coordinates for the home address of cases at the time of MD onset as well as the x,y-coordinates for hospitals receiving patients with suspected bacterial meningitis. In the spatial analyses, hospital distances were calculated as the ‘beeline’ distance to the nearest hospital from the patient's home address and divided into the following categories (in km): 0–4, 5–9, 10–14, 15–19, ⩾20, with 0–4 km as the reference category. For the population density analyses we placed a grid of 500×500 m cells covering the entire country and placed cases in a 1×1 km cell, hence the home address of the case had a distance to the cell border of at most 250 m. The number of persons living in each 1-km2 cell at the time of the case's MD onset was counted and five population density levels were chosen: >2000, 1001–2000, 351–1000, 26–350, and 1–25 persons/km2 categories. The above methods have been used previously to illustrate the spatial distribution of Campylobacter infections in Denmark [Reference Ethelberg24].
The logistic regressions and survival analyses concerning outcome were performed in Stata version 9.2 (Stata Corp, USA) while the distance and population density analyses were carried out using SAS version 9.2 (SAS Inc., USA).
Approval of study
The study was a registry linkage study, and no patients were contacted. Registry-based studies do not require scientific-ethical approval. The study was notified to and approved by the Danish Protection Agency, record number 2005-41-5689.
RESULTS
In the period 1974–2007, 5924 cases of N. meningitidis were registered. Of these, 3237 (55%) cases were due to serogroup B, 1041 (18%) to serogroup C, 280 (5%) to serogroup A, 68 (~1%) to serogroup W135, 53 (~1%) to other known serogroups (Y, X and 29E), and for 1245 (21%) cases the serogroup was unknown.
In the mid-1970s, serogroup A isolates were most prevalent in Denmark, but by the end of the 1970s the incidence rate of this serogroup had declined markedly and since then it has been a rare cause of MD (Fig. 1). Serogroup B and C isolates increased during the 1980s to peak for serogroup B in the period 1986–1988 with an incidence rate of 3·2/100 000 population and for serogroup C in 1993 with an incidence rate of 1·1/100 000 population (Fig. 1). The incidence rates in 2007 for serogroup B were 0·8/100 000 population and for serogroup C 0·4/100 000 population.
Number and incidence rate of meningococcal disease (MD) cases distributed by serogroup in Denmark, 1974–2007 (n=5924).
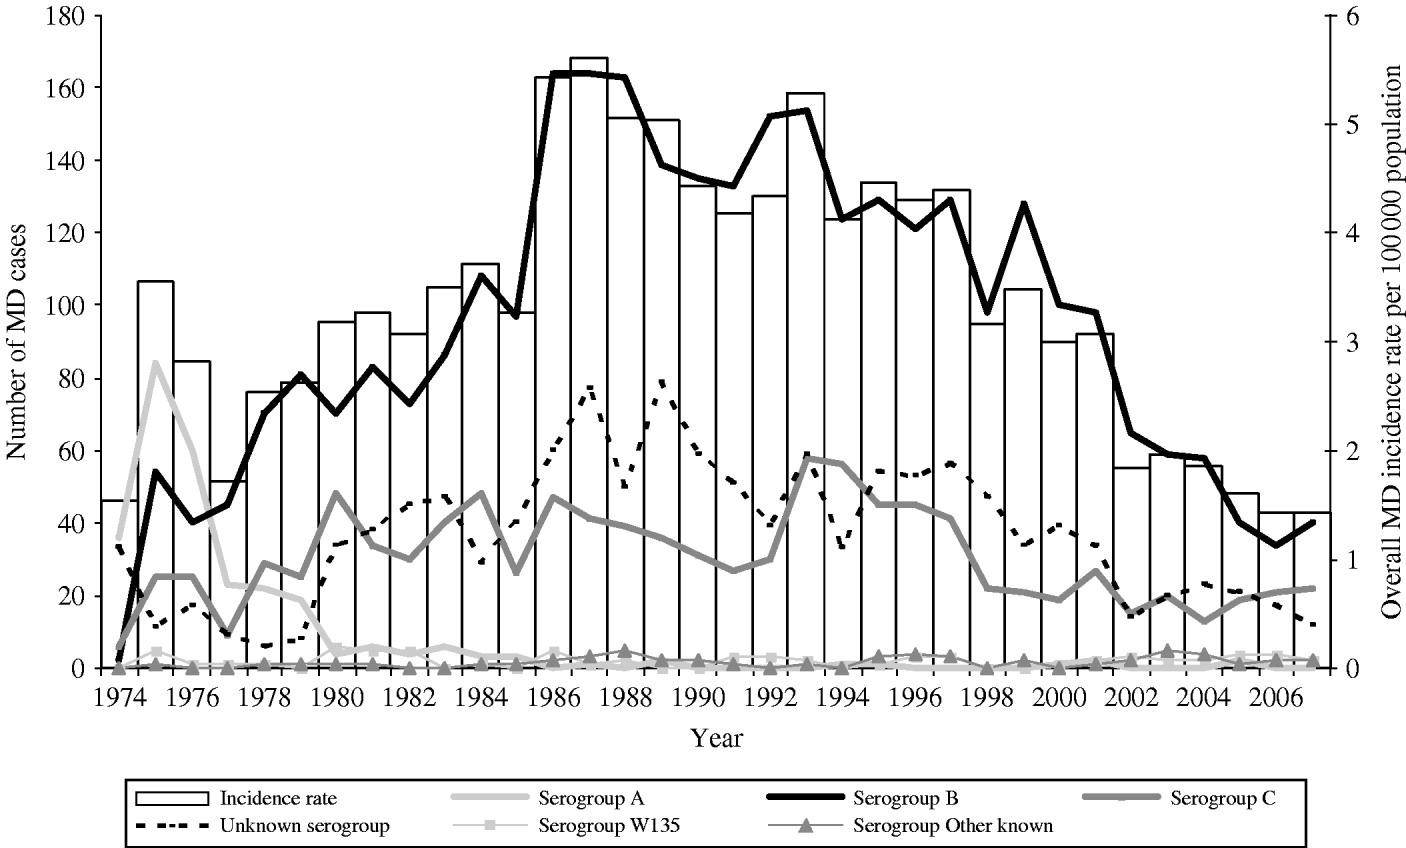
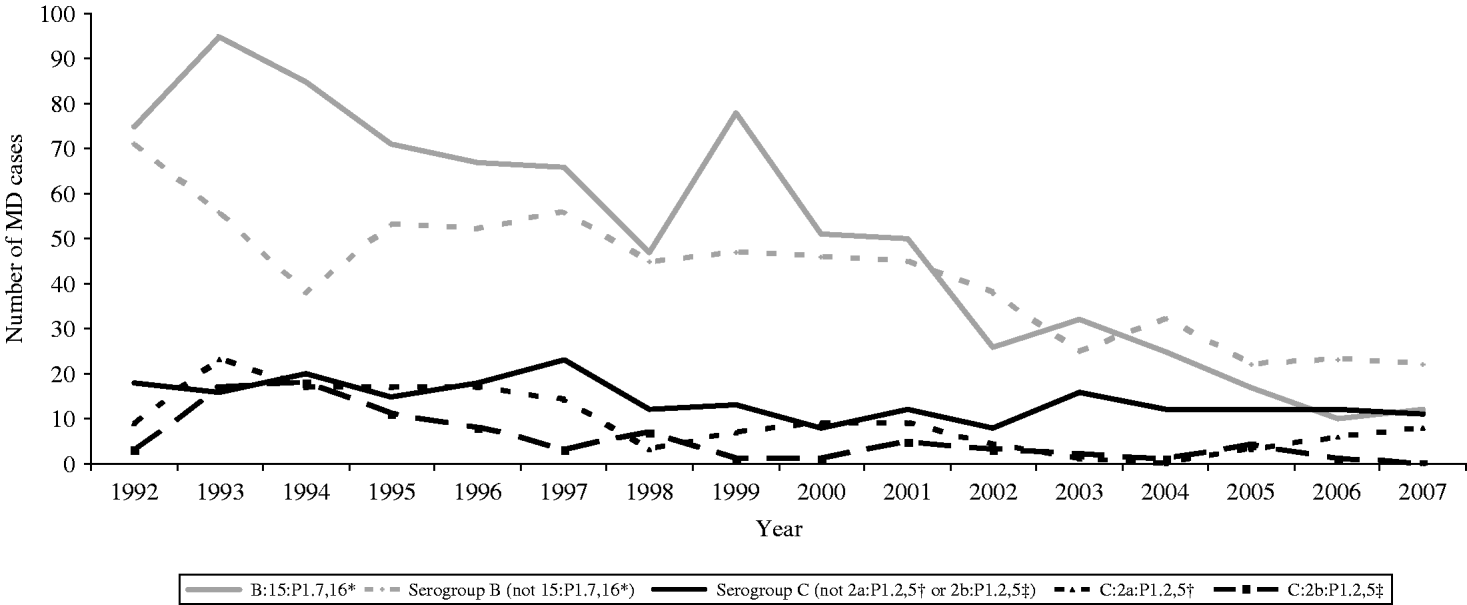
The overall decline in MD cases in the period 1993–1998 was caused both by a decline in cases of serogroups B and C, while only serogroup B cases declined in the following period 1999–2006 (Fig. 1). In the period 1992–2007, B:15:P1.7,16 (n=807) was the most prevalent phenotype, followed by C:2a:P1.2,5 (n=147) and C:2b:P1.2,5 (n=85) (Fig. 2). The decline of serogroup B MD cases is mainly due to a decline in the previous prevalent phenotype B:15:P1.7,16, with almost 100 cultured cases in 1993 to <10 cultured cases in 2007. However, a decline in an array of other phenotypes within serogroup B, from 70 cultured cases in 1992 to 20 cases in 2007, is also evident (Fig. 2). The decline of serogroup C cases has been due to a decline of phenotypes C:2a:P1.2,5 and C:2b:P1.2,5 cases and other serogroup C phenotypes (Fig. 2).
Number of meningococcal disease (MD) cases distributed by serogroup, serotype and serosubtype in Denmark, 1999–2007 (n=2627). * B:15:P1.7,16 includes B:15:P1.7,16; B:15:P1.7; B:15:P1.16; B:NT:P1.7,16; B:NT:P1.7; B:NT:P1.16. † C:2a:P1.2,5 includes C:2a:P1.2,5; C:2a:P1.2; C:2a:P1.5. ‡ C:2b:P1.2,5 includes C:2b:P1.2,5; C:2b:P1.2; C:2b:P1.5. (Cases of other known and unknown phenotypes are excluded from the figure to enhance legibility.)
From information on all cases with MD we found that the male/female ratio for serogroups B and C isolates were 1·18 (P<0·01) and 0·93 (P=0·87), respectively. The median age for all MD cases was 10 years, whereas it was 8 years (range 0–96) for serogroup B cases, 15 years (range 0–95) for serogroup C, 20 years for serogroup W135 (range 0–94), 37 years (range 0–91) for other known serogroups and 8 years (range 0–83) for cases with an unknown serogroup. The overall number of cases per age group in years had a characteristic double peak, with the highest incidence in children aged <5 years and a second peak in adolescence.
In the population density analyses, we found no overall significant difference or trend in the MD incidence rate in the five population density levels (P=0·17). Choosing the most populated areas, >2000 persons/km2, as the reference population, odds ratios (OR) for MD were: 1001–2000 persons/km2 (OR 0·98, 95% CI 0·86–1·11); 351–1000 persons/km2 (OR 0·86, 95% CI 0·75–0·99); 26–350 persons/km2 (OR 1·00, 95% CI 0·87–1·16); and 1–25 persons/km2 (OR 0·99, 95% CI 0·81–1·21).
We analysed whether MD patients admitted to hospital during weekends [Saturday (00:00 hours) to Sunday (23:59 hours)] compared with weekdays (Monday–Friday) had a higher risk of dying from the infection; this was not the situation (χ2 test, P=0·85). Similarly, we found no difference in the number of patients admitted to hospital each day at weekends compared to weekdays (P=0·38).
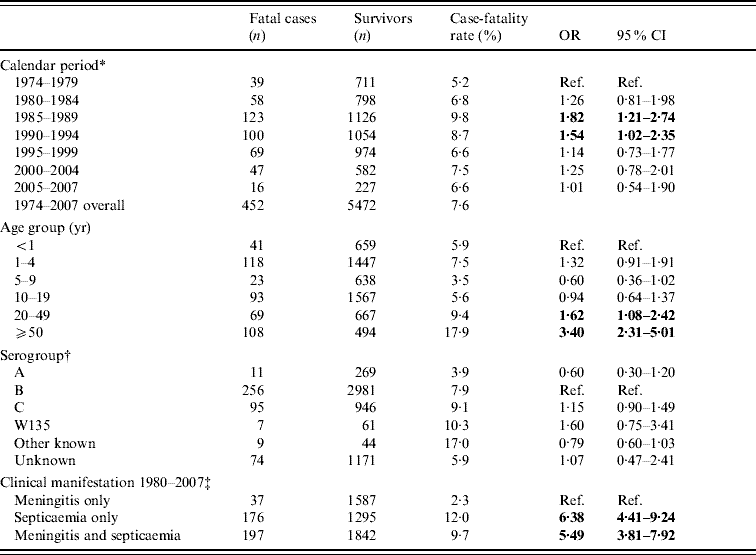
Factors related to fatal outcome for cases with MD were analysed. The case-fatality at 31 days after onset of MD was 7·6% and increased with age (Table 1). Sixty-eight percent of deaths occurred within 3 days from MD onset, 88% within 1 week after onset and 96% within 2 weeks from MD onset. Septicaemia with or without meningitis vs. meningitis only was associated with an increased risk of death (Table 1). The case-fatality rates were highest for those admitted to hospital on the day (9·7%) or the following day (8·7%) after disease onset, and lower for days 2–4 (range 0·8–2·7%) following disease onset.
Case-fatality rates and odds ratio for a fatal outcome within 31 days of meningococcal disease per calendar period, age group and serogroup, Denmark 1974–2007 (n=5924)
OR, Odds ratio; CI, confidence interval.
Bold values represent values significantly different from the reference value.
* Adjusted for age group, sex and serogroup.
† Adjusted for age group, sex and calendar period.
‡ Available information for the period 1980–2007. Adjusted for age group, sex, calendar period and serogroup.
Analysed according to meningococcal serogroup, the case-fatality rate for serogroup C was 9·1%, serogroup B 7·9%, and serogroup A 3·9%. The differences between serogroups were not significant for the entire period when controlled for age group, gender and calendar period (Table 1). The case-fatality rate was significantly higher in the period 1985–1994; the period with the highest incidence of MD (Fig. 1). These observations were not significantly altered when including the interaction term ‘calendar period×serogroup’ for the entire period or ‘calendar period×phenotype’ for the period 1992–2007.
The hospital distance analysis indicated a trend towards increased case-fatality rate up to a direct ‘beeline’ distance of 20 km between the patient's home address and the hospital. Choosing 0–4 km as the reference population, age, sex and clinical manifestation adjusted OR for death were: 5–9 km (OR 1·08, 95% CI 0·82–1·42); 10–14 km (OR 1·17, 95% CI 0·87–1·57); 15–19 km (OR 1·32, 95% CI 0·91–1·92); >20 km (OR 0·94, 95% CI 0·52–1·71). In a trend test, omitting patients living >20 km from the hospital, we found a significant increase in OR with 1·02 (95% CI 1·00–1·04) per km (P=0·038).
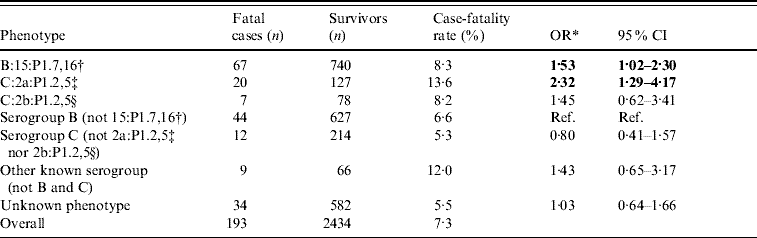
Including information on the phenotypes, both B:15:P1.7,16 (OR 1·53, 95% CI 1·02–2·30) and C:2a:P1.2,5 (OR 2·32, 95% CI 1·29–4·17) were significantly associated with an increased risk of fatal disease outcome compared with other known serogroup B phenotypes in the period 1992–2007 (Table 2). Furthermore, when adjusted for age, C:2a:P1.2,5 was significantly more associated with the clinical manifestation sepsis with or without meningitis vs. meningitis only than B:15:P1.7,16 (OR 1·71; 95% CI 1·06–2·76). When adjusting for the possible confounding effect of sepsis in the model, the associations between the two common phenotypes and fatal outcome remained; B:15:P1.7,16 (OR 1·50, 95% CI 0·99–2·27) and C:2a:P1.2,5 (OR 2·02, 95% CI 1·12–3·67).
Odds of death within 1 month from disease onset for the three most common phenotypes (serogroup, serotype and serosubtype) in Denmark, 1992–2007 (n=2627)
OR, Odds ratio; CI, confidence interval.
Bold values represent values significantly different from the reference value.
* Adjusted for age group, calendar period and sex.
† B:15:P1.7,16 includes B:15:P1.7,16; B:15:P1.7; B:15:P1.16; B:NT:P1.7,16; B:NT:P1.7; B:NT:P1.16.
‡ C:2a:P1.2,5 includes C:2a:P1.2,5; C:2a:P1.2; C:2a:P1.5.
§ C:2b:P1.2,5 includes C:2b:P1.2,5; C:2b:P1.2; C:2b:P1.5.
In survival analyses with selected neurological sequelae, we found that phenotype B:15:P1.7,16 gave a significantly higher risk of a perceptive hearing loss (hazard ratio 2·57, 95% CI 1·16–5·71) (Table 3). B:15:P1.7,16 was no more associated with the clinical manifestation ‘meningitis and no sepsis’ vs. ‘sepsis and no meningitis’ than other serogroup B phenotypes (OR 0·99, 95% CI 0·73–1·35). We found no difference between other phenotypes with respect to perceptive hearing loss, epilepsy, cerebral palsy and plegias of one or more limbs (Table 3).
Cox regression on association between N. meningitidis serogroup, serotype, serosubtypes and selected neurological sequelae in Denmark, January 1992–July 2005 (n=2286)
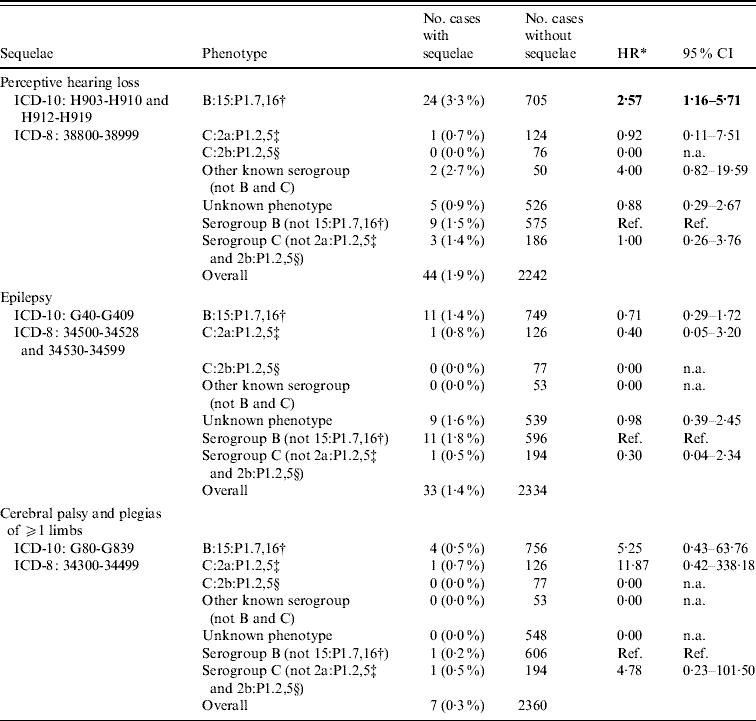
HR, Hazard ratio; CI, confidence interval.
Bold values represent values significantly different from the reference value.
* Adjusted for age group, calendar period and sex.
† B:15:P1.7,16 includes B:15:P1.7,16; B:15:P1.7; B:15:P1.16; B:NT:P1.7,16; B:NT:P1.7; B:NT:P1.16.
‡ C:2a:P1.2,5 includes C:2a:P1.2,5; C:2a:P1.2; C:2a:P1.5.
§ C:2b:P1.2,5 includes C:2b:P1.2,5; C:2b:P1.2; C:2b:P1.5.
DISCUSSION
With >30 years of epidemiological data and laboratory characterization of MD cases we consider our material to be comprehensive and unique because it is based on the combination of national registries with data primarily collected for other purposes. Our analyses confirm known risk factors for a fatal MD outcome: septicaemia, high age (>50 years) and admission to hospital within 48 h from disease onset (as a likely proxy for a more rapid disease course). As an interesting new observation, we found that phenotype B:15:P1.7,16, besides being associated with excess risk of death, is also associated with increased risk of perceptive hearing loss.
Our findings are in line with observations of Jensen et al. [Reference Jensen5] on one out of 15 counties in Denmark in the period 1980–1999. They found that phenotypes B:15:P1.7,16 and C:2a:P1.2,5 were associated with increased risk of death. However, the material in our study is nationwide and includes a longer period, which improves the precision [Reference Jensen5]. In a UK study on 11 459 cases, Trotter et al. presented an association between the serogroup and serotypes: cases infected with serogroup C isolates had a significantly higher odds of death than serogroup B (OR 1·71, 95% CI 1·48–1·98) and cases with B:15, B:2a and C:2a had significantly higher odds of death than B:1 [Reference Trotter4]. In 556 MD cases in France, Brassier et al. identified that serotype 2a and serosubtype P1.1,2 were significantly associated with death, while serotype 4 was associated with a lower rate of death [Reference Brassier25]. In 293 MD patients in Norway, Smith et al. found that C:15:P1.7,16/ST-32 and C:2a/ST-11 were highly virulent isolates, but no significant association between B:15:P1.7,16 and death was found [Reference Smith26]. The third most prevalent phenotype in Denmark in the period, C:2b:P1.2,5, was not significantly associated with death, this is in accord with a Catalonian study from the period 1990–1997 and with findings from a UK study [Reference Trotter4, Reference Dominguez27].
Although phenotypes B:15:P1.7,16 and C:2a:P1.2,5 were independent determinants of mortality, the excess risk of death associated with the phenotypes were less pronounced than, e.g. septicaemia and age >50 years. In line with other studies the phenotypes B:15:P.1.7,16 and C:2a:P1.2,5 therefore appear to be surface antigen markers of hypervirulent clones [Reference Trotter4, Reference Jensen5, Reference Brassier25, Reference Smith26].
We found that the case-fatality rates from MD within 1 month from disease onset in the 5-year calendar periods remained in the range 5·2–9·8%, and were not significantly diminished over the study period. The significant higher case-fatality rates in the period 1985–1994 are probably explained by the circulating N. meningitidis phenotypes, i.e. in Denmark B:15:P1.7,16 and C:2a:P1.2,5, since there was no interaction between calendar period and serogroup in the regression model [Reference Lind and Berthelsen17, Reference Andersen18]. The fact that the case-fatality rates remain stable underlines the severity of MD and that control of MD remains a concern for public health.
In addition to case fatality, we observed an interesting significant association between phenotype B:15:P1.7,16 and perceptive hearing loss. We have no obvious explanation for this finding, and we realize that the present analyses of complications to MD do have limitations, e.g. we do not known the sensitivity and specificity of the diagnoses cerebral palsy and plegias of one or more limbs, epilepsy and perceptive hearing loss in the National Patient Discharge Registry. Furthermore, sequelae and complications not resulting in a hospital discharge diagnosis will not be included in the present analyses. It will be of interest if our observations can be confirmed by other studies and if a phenotype-specific pathogenesis can justify the association. Overall, it does seem conceivable that MD phenotypes associated with increased case-fatality rates are similarly associated with a higher risk of sequelae, i.e. in our study, perceptive hearing loss.
The observation that the case-fatality rate was significantly higher for admission to hospital on day 0 or day 1 from disease onset is in line with the understanding that MD has different paths of severity; from the very rapid disease courses with high case-fatality rates to the slower courses with better survival chances [Reference Stephens, Greenwood and Brandtzaeg1].
We found a significant trend towards increased risk of death from MD of 2% per kilometre up to a distance of 20 km between home address and hospital. A presumption for the calculation is that we exclude patients in geographical areas more distant than 20 km from the hospital. The reason is that we assume that physicians in these areas are more likely to institute antibiotic treatment before admission to hospital due to the prolonged transportation time, than on-call physicians in areas nearer to hospitals. Institution of oral antibiotic treatment before admission to hospital has been shown to reduce risk of death and complications from MD in some studies [Reference Nonell, Sobrino and Torres28–Reference van Deuren and Brandtzaeg32]. On the other hand, a Danish study found an increased risk of death from MD in patients who received pre-hospital parenteral antibiotic treatment [Reference Norgard33]. Information on administration of pre-hospital antibiotics is probably available from general practitioners' referral cards; however such information is not computerized and consequently we refrained from attempting to adjust for administration of pre-hospital antibiotics.
To our surprise, we found no difference in the incidence rate of MD in different population density areas, i.e. a proxy for rural and urban settings. Since household contacts, military recruits living in dormitories and freshmen living in residence halls have an increased risk of falling ill with MD [Reference Purcell6, Reference Froeschle10, Reference Harrison11, 13–Reference Kadlubowski15, Reference Andersen18, Reference Andersen34–Reference Knights36], we expected a higher risk of MD in areas with higher population densities. However, differences in population density in Denmark may be a poor proxy for crowded domestic living conditions, duration of contact, mixing patterns and physical contact which are probably more important parameters in terms of transmission of respiratory droplets than living in a densely populated area [Reference Mossong37]. A recent transnational European study suggested that 80% of all person-to-person contacts are to be found in the home, school, workplace and leisure settings [Reference Mossong37]. We are not aware of any other studies which may have investigated the incidence rate of MD in similar settings. Our study was not designed to observe carriage rates in different-density populated areas, we were therefore unable to take effect of carriage into account.
In conclusion, we have presented epidemiological data on >30 years of surveillance of MD in a well-defined population, with an excellent surveillance system. The previous common phenotypes in Denmark, B:15:P1.7,16 and C:2a:P1.2,5 were associated with higher risk of death, and we have shown an association between B:15:P1.7,16 and perceptive hearing loss. Additionally, we found that the population density in a case home-address area is apparently not an independent risk factor for falling ill with MD. In contrast, patients living further from a hospital were at higher risk of dying from MD. Finally, hospital admission during weekends was not a risk factor for a fatal disease outcome.
To improve control of MD, it is important to understand the epidemiology and pathogenicity of virulent ‘successful clones’ such as C:2a:P1.2,5 and B:15:P1.7,16, and ultimately to develop safe and effective vaccines against serogroup B MD.
ACKNOWLEDGEMENTS
This work was supported by the Graduate Research School in International Health, University of Copenhagen. We thank the Department of Clinical Microbiology in Denmark for consistent referral of N. meningitidis isolates to the Neisseria and Streptococcus Reference Laboratory at Statens Serum Institut. Furthermore, we are grateful for the constructive comments and ideas from Martin Rudbeck Jepsen, Sabrina Bacci and Mark Muscat, all affiliated to the Department of Epidemiology, Statens Serum Institut during the preparation of this manuscript.
DECLARATION OF INTEREST
None.



