

1. Introduction
Stem cell differentiation is derived by gene expression changes that are regulated by epigenetic changes that take place prior or during transcription (Bernstein et al., Reference Bernstein, Mikkelsen, Xie, Kamal, Huebert, Cuff, Fry, Meissner, Wernig, Plath, Jaenisch, Wagschal, Feil, Schreiber and Lander2006). In eukaryotes, DNA methylation is the addition of the methyl group to the fifth carbon on the pyrimidine or the purine ring by DNA methyltransferases, usually within CpG dinucleotides (Bird, Reference Bird2002).
During stem cell commitment transcription factors (TFs) and DNA methylation play crucial regulatory roles where TFs help activate or suppress lineage-specific genes during stem cell commitment and demethylation of proximal promoter regions initiate transcription. At the early phase of blood cell development, promoter regions of genes lose methylation (hypomethylated) allowing direct binding of TFs to their recognized motifs. DNA methylation changes at intergenic regions, regulate transcription by affecting TF binding to enhancers (Yu et al., Reference Yu, Mo, Ebenezer, Bhattacharyya, Liu, Sundaravel, Giricz, Wontakal, Cartier, Caces, Artz, Nischal, Bhagat, Bathon, Maqbool, Gligich, Suzuki, Steidl, Godley, Skoultchi, Greally, Wickrema and Verma2013).
Studies show a gradual decrease in DNA demethylation during erythroid differentiation (erythropoiesis). They found hypomethylation of CpG islands (CGI) tend to correlate with gene expression (Shearstone, et al., Reference Shearstone, Pop, Bock, Boyle, Meissner and Socolovsky2011; Hogart et al., Reference Hogart, Lichtenberg, Ajay, Anderson, Margulies and Bodine2012); however, data also confirmed the importance of non-CGI methylation (Irizarry et al., Reference Irizarry, Ladd-Acosta, Wen, Wu, Montano, Onyango, Cui, Gabo, Rongione, Webster, Ji, Potash, Sabunciyan and Feinberg2009). Although previous erythropoiesis whole-genome methylation data analyses were able to detect general methylation patterns, their findings were controversial regarding the nature of correlation between DNA methylation and gene expression (Lou et al., Reference Lou, Lee, Qin, Li, Gao, Liu, Chan, KI Lam, So, Wang, Lok, Wang, Ma, Tsui, Chan, Chan and Yip2014).
Distinct TF binding patterns have been found to be associated with the different stages of cell differentiation (Sandmann et al., Reference Sandmann, Jensen, Jakobsen, Karzynski, Eichenlaub, Bork and Furlong2006). Thus, designing differential analysis to detect common methylation patterns of different time points during erythroid development is expected to contribute in resolving such uncertainty. A previous differential methylation study had split data samples into two phases only: early and late (Yu et al., Reference Yu, Mo, Ebenezer, Bhattacharyya, Liu, Sundaravel, Giricz, Wontakal, Cartier, Caces, Artz, Nischal, Bhagat, Bathon, Maqbool, Gligich, Suzuki, Steidl, Godley, Skoultchi, Greally, Wickrema and Verma2013). In our differential analysis, the differential test for each phase included all samples grouped accordingly to test for five different phases. The CpG loci lgFC of each phase shows maximum absolute value at only a specific stage of erythropoiesis with regard to all other stages. Considering the time factor between gene expression and CpG loci, differential methylation might help to avoid correlating a late hypomethylation loci to the promoter of early expressed genes.
Chromosomes are natural partitions of the genome that can represent the whole genome with fewer outliers and less genomic variation of DNA methylation, gene expression levels and gene regulation elements than whole-genome data. Whole-chromosome data are expected to include the regulatory sequence elements of genes located in the specific chromosome. Chromosome-specific methylation that involves large chromosomal domains of tissue-specific differentially methylated regions (DMRs) was detected in chromosomes 5 and 22 (Zhang et al., Reference Zhang, Zhou, Lin, Lowdon, Hong, Nagarajan, Cheng, Li, Stevens, Lee, Xing, Zhou, Sundaram, Elliott, Gu, Shi, Gascard, Sigaroudinia, Tlsty, Kadlecek, Weiss, O'Geen, Farnham, Maire, Ligon, Madden, Tam, Moore, Hirst, Marra, Zhang, Costello and Wang2013). In addition, chromosome-specific DNA methylation was identified as a major factor in chromosome X inactivation (Zhang et al., Reference Zhang, Zhou, Lin, Lowdon, Hong, Nagarajan, Cheng, Li, Stevens, Lee, Xing, Zhou, Sundaram, Elliott, Gu, Shi, Gascard, Sigaroudinia, Tlsty, Kadlecek, Weiss, O'Geen, Farnham, Maire, Ligon, Madden, Tam, Moore, Hirst, Marra, Zhang, Costello and Wang2013). Thus, DNA methylation of each chromosome is expected to show a distinct, tissue-specific pattern.
DNA methylation is known for its tissue and cell-type specificity, thus, we selected chromosome 16 for our analysis which includes the well-studied erythroid-specific alpha-globin genes cluster. Despite the availability of biological and genomic knowledge of this cluster, we expected to establish biological relevance to our findings. The alpha-globin gene cluster consists of five functional genes on the positive strand (HBA1, HBA2, HBM, HBQ1 and HBZ) and two pseudogenes (O'Leary et al., Reference O‘Leary, Wright, Brister, Ciufo, Haddad, McVeigh, Rajput, Robbertse, Smith-White, Ako-Adjei, Astashyn, Badretdin, Bao, Blinkova, Brover, Chetvernin, Choi, Cox, Ermolaeva, Farrell, Goldfarb, Gupta, Haft, Hatcher, Hlavina, Joardar, Kodali, Li, Maglott, Masterson, McGarvey, Murphy, O'Neill, Pujar, Rangwala, Rausch, Riddick, Schoch, Shkeda, Storz, Sun, Thibaud-Nissen, Tolstoy, Tully, Vatsan, Wallin, Webb, Wu, Landrum, Kimchi, Tatusova, DiCuccio, Kitts, Murphy and Pruitt2016).
Our chromosome 16 analysis involved all loci at the different genomic regions (not only for differentially expressed genes) since parts of non-differentially expressed genes can hold a regulatory element for distal genes that are differentially expressed. As an example of this indirect correlation, a master regulator of the alpha-globin cluster is known to be located at a distal upstream region of the cluster genes at an intron of a different gene (Vernimmen, Reference Vernimmen2014).
In this study, we analyzed the only human DNA methylation raw data available for all six stages of erythropoiesis (Yu et al., Reference Yu, Mo, Ebenezer, Bhattacharyya, Liu, Sundaravel, Giricz, Wontakal, Cartier, Caces, Artz, Nischal, Bhagat, Bathon, Maqbool, Gligich, Suzuki, Steidl, Godley, Skoultchi, Greally, Wickrema and Verma2013). Differential analysis of the DNA methylation pattern of chromosome 16 has not been studied previously for erythroid-differentiating cells. Understanding the tissue-, cell type- and stage-specific methylation patterns of select genomic regions could enhance the predictive power of crucial, yet unknown sites in the genome.
2. Materials and methods
(i) Datasets
All data were from previous studies and were deposited in the public GEO database. To perform our differential analysis, we used three datasets.
(a) GSE44054 (Yu et al., Reference Yu, Mo, Ebenezer, Bhattacharyya, Liu, Sundaravel, Giricz, Wontakal, Cartier, Caces, Artz, Nischal, Bhagat, Bathon, Maqbool, Gligich, Suzuki, Steidl, Godley, Skoultchi, Greally, Wickrema and Verma2013)
Methylation profiling was carried out by a genome-tiling array of samples related to human erythropoiesis. The dataset contained 12 adult bone marrow samples that were collected at six-time points during differentiation: days 0, 3, 7, 10, 13 and 16.
(b) GSE36994 (Xu et al., Reference Xu, Shao, Glass, Bauer, Pinello, Van Handel, Hou, Stamatoyannopoulos, Mikkola, Yuan and Orkin2012)
Gene expression was analyzed during erythropoiesis using the Affymetrix GeneChip Human Genome U133 Plus 2.0 Array. Twelve human adult bone marrow samples were collected on days 0, 3, 5 and 7 of erythroid differentiation.
(c) GSE40243 (Madzo et al., Reference Madzo, Liu, Rodriguez, Vasanthakumar, Sundaravel, Caces, Looney, Zhang, Lepore, Macrae, Duszynski, Shih, Song, Yu, Yu, Grossman, Raumann, Verma, He, Levine, Lavelle, Lahn, Wickrema and Godley2014)
Gene expression was analyzed during human erythropoiesis by high-throughput sequencing. RNA-Seq data were derived from five human adult bone marrow samples, collected on days 0, 3, 7, 10 and 13 of erythroid differentiation.
(ii) Data processing, filtering and normalization
In our analysis, all genomic data were filtered to include the genomic positions in the positive strand of chromosome 16 and related genes prior to normalization. We identified 422 genes from chromosome 16 out of 2095 total genes in RefGene mapped to the positive strand of chromosome 16 (indicated in the NCBI Gene database).
Methylation raw-intensity files were imported, assessed, filtered, normalized and combined as HpaII and MspI log2 ratios using the ‘HELP Microarray Analytical Tools’ bioconductor package. The total number of CpG loci included in our analysis was 55,561. Raw gene expression. CEL files from the Affymetrix array were read and normalized using the ‘affy’ bioconductor package.
(iii) Differential analysis design
(a) Differential methylation
Statistical analysis was performed using the empirical Bayes (EB) method implemented in the ‘limma’ bioconductor package (Ritchie et al., Reference Ritchie, Phipson, Wu, Hu, Law, Shi and Smyth2015). We identified five phases, they were, the start, early, intermediate, late and last phase, and performed separate EB tests for each phase. To identify DMRs, we grouped the 12 sets of methylation data as follows: start phase (day 0 versus days 3, 7, 10, 13 and 16), early phase (days 0 and 3 vs. days 7, 10, 13 and 16), intermediate phase (days 0, 3 and 7 vs. days 10, 13 and 16), late phase (days 0, 3, 7 and 10 vs. days 13 and 16) and last phase (days 0, 3, 7, 10 and 13 vs. day 16). As a second parameter for differential selection, –log2 fold-change (–lgFC) values for CpG loci were calculated for each phase as the mean difference of the log2 ratio between groups, as follows:
 $$\eqalign{-{\rm LgFC} =& {\rm mean} \left( {{\rm group}\,\, 1 \,\, {\rm log}2 \,\, {\rm ratio}} \right)\cr & -{\rm mean}\left( {{\rm group} \, \,2 \,\, {\rm log}2 \,\, {\rm ratio}} \right)}$$
where a negative –lgFC value indicates hypomethylation and a positive –lgFC value indicates hypermethylation.
(b) Differential gene expression datasets
After filtering and normalizing the data, we were left with 401 genes in chromosome 16 to test for differential expression (DE), using the EB method implemented in the ‘limma’ package. The five samples were grouped as follows to test for the DE in the four phases: start phase (day 0 vs. days 3, 7, 10 and 13), early phase (days 0 and 3 vs. days 7, 10 and 13), intermediate phase (days 0, 3 and 7 vs. days 10 and 13) and late phase (days 0, 3, 7 and 10 vs. day 13). lgFC values were also calculated by the EB procedure, where a negative lgFC value indicated downregulation and a positive lgFC indicated upregulation.
For our analysis, we used RNA-Seq gene expression data because these data covered more phases of differentiation than Affymetrix data. The latter data were used for missing genes in the RNA-Seq data.
(iv) Building a CpG loci annotation table
The annotation table comprised all information needed for our analysis. All gathered genomic information from different public databases or published studies were mapped to the human genome (hg18), with position ranges for each CpG fragment in the processed methylation data. To prepare the table, specific data filtration was applied to the imported information. In the following section, we will describe the information shown in each column of the table (Table S1).
(a) Basic gene annotations
Entrez Gene IDs, common names, transcription start sites (TSSs) and transcription end positions were imported from USCS. The source table was filtered to include only RefSeq genes with unique gene names that were located on the positive strand of chromosome 16. In total, 440 genes were mapped using the transcription start and end positions and the ‘IRange’ bioconductor package.
(b) Promoters and gene bodies
The ‘Offset’ column shows the distance from each TSS to the start location of each CpG loci, such that negative offset values indicate promoter regions. We defined the promoter region as the region from the TSS to 1500 bp upstream. Any interval located within the gene body, but not within an exon was defined as an intron. An additional ‘Exon Overlap’ column was added to include the exon/locus overlap as follows:
 $$\eqalign{& {\hbox{Nonoverlapping sequence}} \cr & = {\hbox{absolute value}} \; \left( {\hbox{exon start}}\ndash {\hbox{CpG start locus}} \right) \cr & + {\hbox{absolute value}} \; \left( {\hbox{exon end}}\ndash {\hbox{CpG end locus}} \right)} $$
 $$ \eqalign{{\hbox{Exon overlap}} =\,& \left( {\left[ {\hbox{exon length}} + {\hbox{loci length}} \right]}\right. \cr & \left. - {\hbox{non-overlapping sequence}} \right)/2} $$
where any region of exon that overlaps by less than 30% of its length with CpG loci is defined as an intron.
(c) Enhancers
The genomic positions of erythroid-specific enhancers were reported in a previous study of erythropoiesis in adult humans (Xu et al., Reference Xu, Shao, Glass, Bauer, Pinello, Van Handel, Hou, Stamatoyannopoulos, Mikkola, Yuan and Orkin2012). The study defined an enhancer as any motif that consisted of H3k4me1, H3k9ac, and H3k27ac and could bind acetyltransferase p300 (Xu et al., Reference Xu, Shao, Glass, Bauer, Pinello, Van Handel, Hou, Stamatoyannopoulos, Mikkola, Yuan and Orkin2012). If an enhancer range spanned to the next CpG loci, both loci were reported as having the ‘Enh@H3’ enhancer.
(d) Gene expression
The differential EB test results for the gene expression data are summarized in the following three columns in the annotation table: Min p-value (the minimum p-value of the differential EB tests), Differentially expressed (DE) stage (reports the differentiation phase of the greatest absolute lgFC value for each gene [i.e., ‘start,’ ‘early,’ ‘intermediate’ or ‘late’]), and Gene expression (reports gene regulation as either ‘UP’ or ‘DOWN,’ based on the sign of greatest absolute lgFC value for the gene).
For any DE gene, we noticed that all phases of a single gene followed the same expression status, either being upregulated or downregulated during the differentiation phases. In the annotation table, the expression data of each gene were repeated for all CpG probes located within gene promoter and body.
(e) DNA methylation
Differential methylation results are also summarized in three columns. The Min p-value contains the minimum EB differential test values for each CpG locus. The Differentially methylated (DM) stage column reports the phase that shows the greatest change in methylation intensity (i.e., the greatest absolute lgFC, for each CpG locus). The cs contains the entries ‘start,’ ‘early,’ ‘intermediate,’ ‘late’ and ‘last.’ The Methylation column shows the methylation status based on the sign of greatest absolute value of –lgFC, where negative values indicate hypomethylation and positive values indicate hypermethylation. For all differentially methylated CpG loci, we noticed that the methylation status during erythroid developmental phases was either all hypomethylated or all hypermethylated.
DE genes and differentially methylated loci were selected independently since parts of non-DE genes may contain a regulatory element for distal genes that are DE. As an example of this indirect correlation, a master regulator of the alpha-globin cluster is located at a distal region upstream of the gene cluster in an intron of a different gene (Vernimmen, Reference Vernimmen2014). Our thresholds for defining DE and methylation were chosen to only include values in the fourth quartile.
(f) Enrichment analysis of transcription factor binding sites
Motif discovery within our CpG locus ranges was performed using the Hypergeometric Optimization of Motif EnRichment (HOMER) suite. We used the ‘findMotifsGenome.pl’ program to search for known transcription factor binding sites (TFBSs) enriched during each phase. DMRs were grouped based on their differential phase into five different (.bed) files. The starting and ending genomic positions of our DMRs were used as inputs, with the following restrictions: (a) Hg18: the genome studied for the DNA methylation data, (b) -norevopp: search only in the positive strand, (c) -size: 200 bp up and down stream of our CpG loci (peaks), and (d) known motifs: a HOMER file that included 332 known motif matrices.
3. Results
We designed an annotation table (Table S1) that combined all filtered and normalized information for all 55,561 CpG loci studied. For each CpG locus, the table defines the genomic region (intergenic, exon, intron or promoter), erythroid-specific enhancers, and multiple-TFBS overlap with CpG locus sequences. Data related to DNA methylation, methylation at different stages, p-values and –lgFC values were included. For each gene in the table, we provided the gene name, gene ID, stage where differential gene expression was observed (start, early, intermediate or late), the DE p-value and the lgFC value.
(i) Differential methylation
We combined five EB tests in to the annotation table where each CpG loci has a differential phase based on its maximum logFC among the five EB tests. CpG loci with an EB p-value of less than 0.002 (less than 0.02 after FDR adjustment) and a –lgFC fold change of more than 1 were considered differentially methylated.
Within coding-related regions (promoters and gene bodies), we identified 1449 DMRs out of 17,063 CpG loci. At intergenic regions, 5601 DMRs were found in 38,498 intergenic CpG loci. All DMRs showed loss of methylation, except for 11 DMRs that were hypermethylated. A summary of the results is shown in Table 1. As expected, our chromosome-specific differential analysis and method to define the differential phase of each CpG locus is representative of previous whole-genome findings in general.
Number of differentially methylated regions that were differentially methylated during each stage of differentiation.

The first row presents the distribution of gene body and promoter differentially methylated regions, and second row presents the intergenic differentially methylated region distribution during erythroid differentiation.
Differentiation during the intermediate phase (days 7–10) seems to represent the major differentiation phase, as ~43% of all DMRs showed maximum methylation changes between these days. This finding confirmed previous data showing that CD34 expression reflected erythroid commitment on day 7.
(ii) DE genes
We identified 34 DE genes (out of 422) using the RefGene database in the positive strand of chromosome 16. We found more DMRs in downregulated genes (lgFC < –3) than in upregulated genes (lgFC > 3) during all phases.
The logFC values of the DE EB test showed consistent gene expression patterns for genes that were either upregulated or downregulated through all erythroid differentiation phases. Most erythroid-specific genes, including HBA1, HBA2, HBM, HBQ1 and AHSP (alpha-globin-related genes), were DE during the start phase (between days 0 and 3) and the early phase (days 3 to 7). The intermediate phase (between days 7 and 10) showed the least number of DE genes (Table S2). However, differential methylation results revealed the most DMRs during the intermediate phase, suggesting an indirect negative correlation between gene expression and DNA methylation during the intermediate phase.
(iii) Erythroid-specific enhancers
It has always been challenging to define enhancers because they are cell-type specific. A previous study showed that adult erythroblasts contained 362 erythroid-specific enhancers in chromosome 16 (Xu et al., Reference Xu, Shao, Glass, Bauer, Pinello, Van Handel, Hou, Stamatoyannopoulos, Mikkola, Yuan and Orkin2012). We found 50 enhancers in coding regions (i.e., either located within a gene body or 1.5 kbp upstream of a TSS) and 44 enhancers in intergenic regions that overlapped with DMRs (Table 2). When comparing the distribution of DMRs in the genome, we found that all DMRs in enhancers showed differential hypomethylation before day 7 of differentiation, except for two DMRs.
Number of differentially regulated genes during each phase of erythropoiesis, based on their maximum differential lgFC value of the empirical Bayes differential expression test.

Note that expression data for day 16 were not available to test for differentially expressed genes during the last phase (days 13–16).
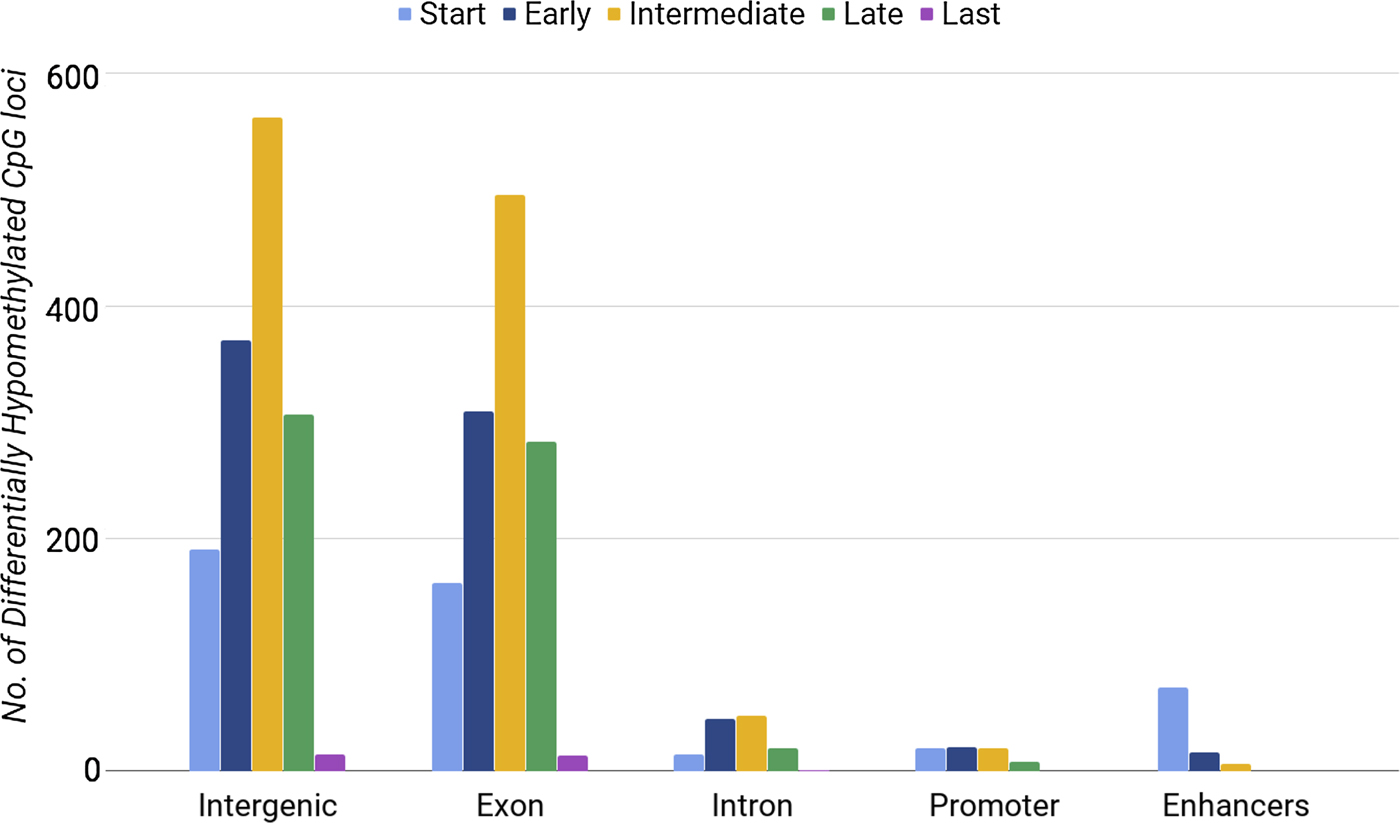
Methylation of CpG loci in exons was distinguishably high during the intermediate stage (between days 7 and 10) (Fig. 1). We also found a lower number of DE genes in the intermediate phase. By considering the phases of differentiation, we noticed that enhancers had the highest number of hypomethylated loci at the start phase, when 15 out of 34 genes were DE. Our results showed that both the highest number of DE genes (Table 3) and the highest number of hypomethylated DMRs at enhancers (Fig. 1) occurred during the start phase. When comparing differential gene expression with differential DMRs at enhancers, we found consistent results only for enhancers within upregulated genes. Promoters and introns with differential methylation showed no significant correlations with gene expression. Our analysis did not show that CpG loci hypomethylation correlated directly with gene expression. Next, we tested whether hypermethylated loci were associated with gene expression.
Number of differentially hypomethylated CpG loci in different regions of chromosome 16 during the five developmental phases of erythrocytes.
Number of differentially hypo/hyper methylated CpG loci at promoters (1.5 kbp upstream of transcription start sites) and gene body of chromosome 16 genes.

(iv) Differentially hypermethylated regions
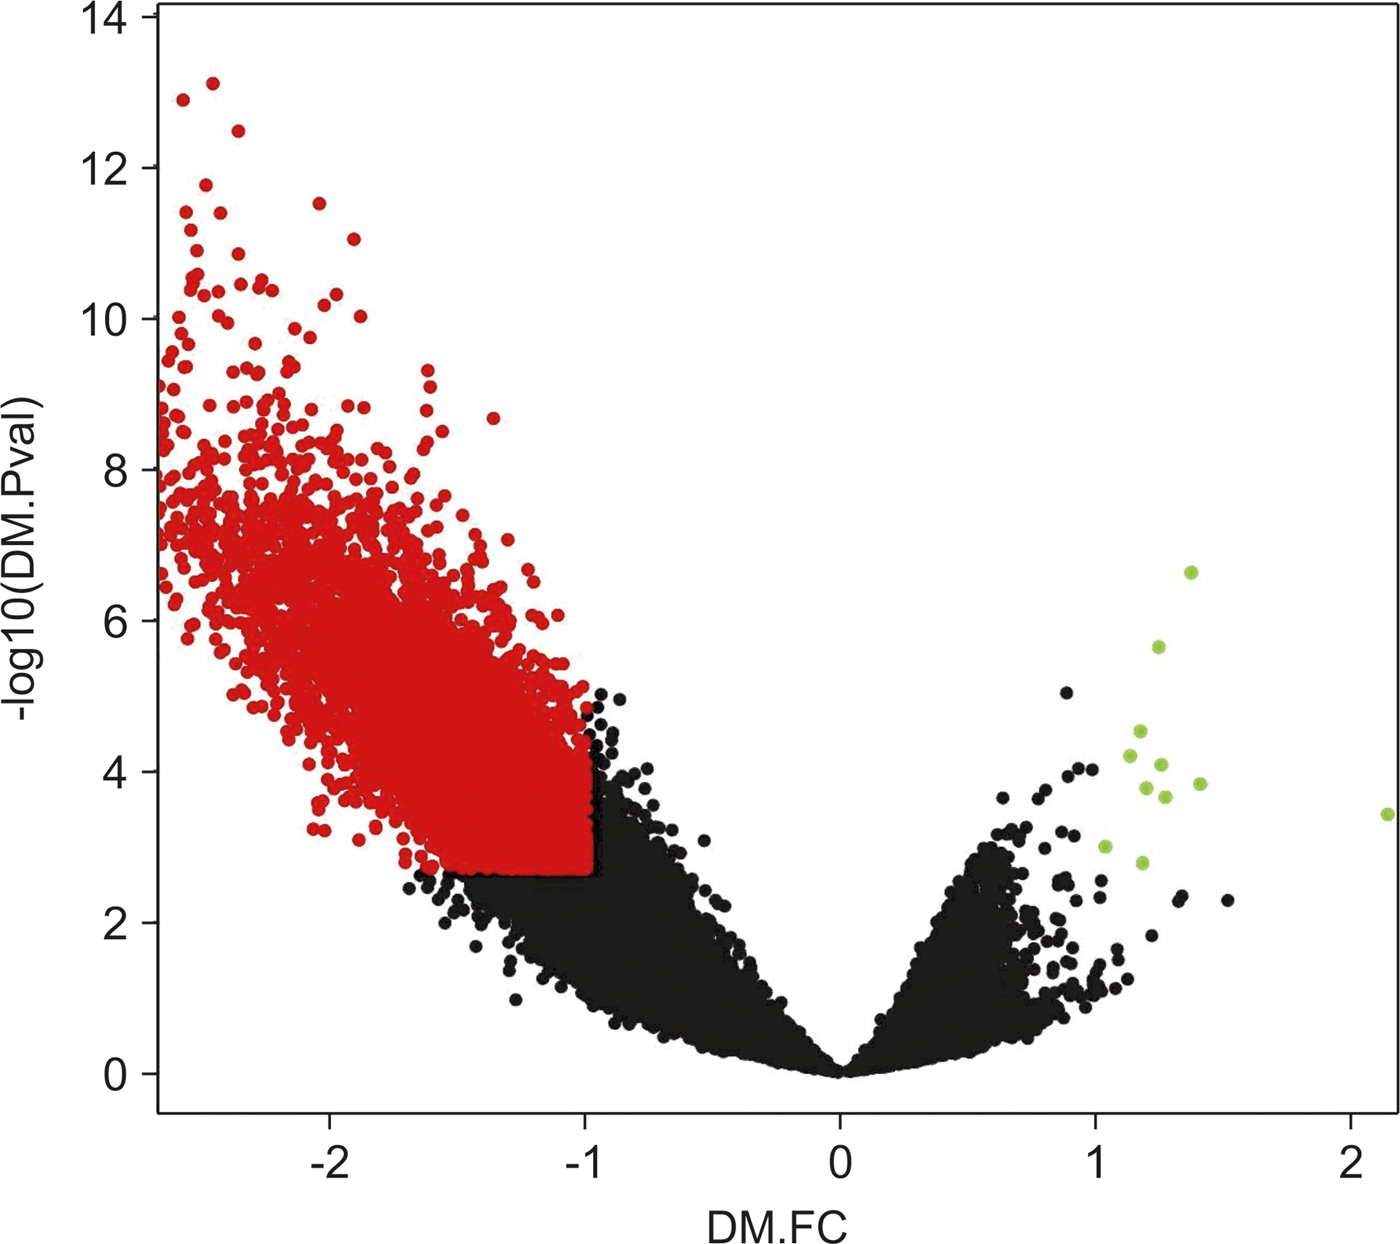
We noticed that differences in the hypomethylation intensity vs. hypermethylation were more significant, meaning that hypermethylated loci p-values and FC would not show significance if compared with differential values of hypomethylation loci (Fig. 2).
Volcano plot of chromosome 16 CpG loci. Loci subjected to the empirical Bayes differential methylation test with p values < 0.002 and absolute –lgFC values > 1 are coloured red. Green, loci that were differentially hypermethylated. Red, loci that were differentially hypomethylated. Black, CpG loci that were not differentially methylated.
Other previous analyses (Zhang et al., Reference Zhang, Zhou, Lin, Lowdon, Hong, Nagarajan, Cheng, Li, Stevens, Lee, Xing, Zhou, Sundaram, Elliott, Gu, Shi, Gascard, Sigaroudinia, Tlsty, Kadlecek, Weiss, O'Geen, Farnham, Maire, Ligon, Madden, Tam, Moore, Hirst, Marra, Zhang, Costello and Wang2013) have also been conducted to study hypermethylated and hypomethylated CpG loci separately, due to differences in their behaviours. After defining new lower-stringency criteria for DMRs (based on the p-value and FC distribution, and selecting the top quartile for both values), we selected hyper-DMRs with IgFC values of at least 0.4 and a maximum p-value of 0.1. Using these criteria, we found 1212 DMRs that showed increased methylation out of 10,817 studied DMRs.
The most hypermethylated DMRs were found during the intermediate phase (395 CpG loci) and late phase (400 CpG loci) of erythroid differentiation. Whereas, we found 225 and 124 DMRs in the start phase and early phase, respectively. The last phase had the lowest number of DMRs (86 CpG loci), as observed during the analysis of differentially hypomethylated regions. In general, we noticed a consistent pattern of differential hypermethylation during erythropoiesis (Fig. 3); however, CpG loci that lost methylation did not show such a consistent pattern (Fig. 1).
Number of differentially hypermethylated CpG loci in different regions of chromosome 16 during the five developmental phases of erythrocytes.

We found that hypermethylated DMRs occurred within promoter regions (1.5 kbp before the TSS) more frequently (165 loci, 13.5%) than did differentially hypomethylated loci (69 DMRs, 1%). We also found that 7% (85 DMRs) of differentially hypermethylated CpG loci overlapped with erythroid-specific enhancers, although only 1.3% of the differentially hypomethylated CpG loci were enhancers.
The hypermethylated regions overlapped with CGIs at 83% of the promoters and first-exon regions of DE genes. Fig. 3 shows a peak of hypermethylation during the intermediate and late phases. We found that 69% of all CpG loci at intragenic and promoter CGIs were hypermethylated, suggesting a positive correlation between the number of hypermethylated DMRs and the total length of intragenic CGI sequences.
(v) Transcription factor-enrichment analysis
It is unclear whether certain motifs affect the pattern of DNA methylation and whether hypomethylation is associated with a more frequent occurrence of certain TFBSs. We were also interested in determining whether the occurrence of certain TFBSs was responsible for positive or negative correlations between gene expression and methylation at CpG loci.
We performed TFBS-enrichment analysis to compare TFBSs enriched during each phase with previous biological findings. To study the possible enrichment of TFBSs, we used HOMER to perform separate enrichment analyses of coding regions and all DM regions.
For coding regions, we divided the DMRs into two groups, namely hypomethylated/downregulated DMRs (843) and hypomethylated/upregulated DMRs (545), to test for transcription factor-binding motifs enriched in each group. All TFBS enrichments were identified based on a p-value of less than 1 × 10⁻³ and a q-value of less than 0.1, for both groups. Chromosome-specific DMRs at promoters and gene body regions did not correspond to TFBS enrichment at differentially methylated loci. These findings supported our earlier findings of differential gene expression, demonstrating that hypomethylated DMRs were not directly associated with gene transcription during differentiation.
Next, we assessed the enrichment of all DMRs in chromosome 16 during the different phases of erythropoiesis. Data from previous studies (Yu et al., Reference Yu, Mo, Ebenezer, Bhattacharyya, Liu, Sundaravel, Giricz, Wontakal, Cartier, Caces, Artz, Nischal, Bhagat, Bathon, Maqbool, Gligich, Suzuki, Steidl, Godley, Skoultchi, Greally, Wickrema and Verma2013; Zhang et al., Reference Zhang, Zhou, Lin, Lowdon, Hong, Nagarajan, Cheng, Li, Stevens, Lee, Xing, Zhou, Sundaram, Elliott, Gu, Shi, Gascard, Sigaroudinia, Tlsty, Kadlecek, Weiss, O'Geen, Farnham, Maire, Ligon, Madden, Tam, Moore, Hirst, Marra, Zhang, Costello and Wang2013, Lessard et al., Reference Lessard, Beaudoin, Benkirane and Lettre2015) showed an enrichment of differentially hypomethylated CpGs during erythropoiesis in general, and we were interested in determining whether such enrichment was stage specific. Notably, our enrichment analysis only included hypomethylated DMRs, since hypermethylated regions showed differences in distribution (Figs 1 and 3).
Using the HOMER motif-finding program, we identified known TFBSs that occurred more frequently in hypomethylated DMR sequences in each phase, compared with human genome background sequences. We found that TFBS results with a p-value of less than 1 × 10⁻³ were stable in all runs and showed mutually exclusive TFBSs for each phase. Thus, we presented only the most enriched TFBSs in differentially hypomethylated CpG loci in chromosome 16.
(a) TFBS enrichment results for hypomethylated DMRs during the start phase of differentiation
We found GATA-binding sites with strong enrichment during the start phase of erythropoiesis. Many reports have shown that GATA2 and GATA1 are master regulators during the early stage of hematopoietic cell differentiation (Yu et al., Reference Yu, Mo, Ebenezer, Bhattacharyya, Liu, Sundaravel, Giricz, Wontakal, Cartier, Caces, Artz, Nischal, Bhagat, Bathon, Maqbool, Gligich, Suzuki, Steidl, Godley, Skoultchi, Greally, Wickrema and Verma2013; Vernimmen, Reference Vernimmen2014; Lessard et al., Reference Lessard, Beaudoin, Benkirane and Lettre2015). However, the enrichment of GATA3- and GATA4-regulation behaviour during the early stages of erythropoiesis remains unclear (Table 4).
Enrichment analysis results of 470 differentially methylated regions during the start phase versus background sequences, using the HOMER software.

(b) TFBS enrichment results for hypomethylated DMRs during the early phase of differentiation
The most enriched TFBS during the early phase was TF zinc finger protein 322 (ZNF322, also known as ZNF322A), which potentially maintains stem cell pluripotency in humans (Jen & Wang, Reference Jen and Wang2016). The second- and third-most enriched TFBSs identified during the early phase (between days 3 and 7) were for TF retinoic acid receptors (RARs) and retinoid X receptors (RXRs), which are known for their regulatory activities in normal myeloid and erythroid progenitor cells (Kinoshita et al., Reference Kinoshita, Koike, Mwamtemi, Ito, Ishida, Nakazawa, Kurokawa, Sakashita, Higuchi, Takeuchi, Sawai, Shiohara, Kamijo, Kawa, Yamashita and Komiyama2000) (Table 5).
Enrichment analysis results for 2041 differentially methylated regions during the early differentiation phase versus 48,124 background sequences, identified using the HOMER software.

(c) TFBS enrichment results for hypomethylated DMRs during the intermediate phase of differentiation
During the intermediate phase, we the identified NANOG strong-enrichment (p-value 1 × 10⁻⁶), androgen receptor-half site, and stem cell leukemia proteins, which have been found to be enriched in previous differential methylation studies (Yu et al., Reference Yu, Mo, Ebenezer, Bhattacharyya, Liu, Sundaravel, Giricz, Wontakal, Cartier, Caces, Artz, Nischal, Bhagat, Bathon, Maqbool, Gligich, Suzuki, Steidl, Godley, Skoultchi, Greally, Wickrema and Verma2013; Lessard et al., Reference Lessard, Beaudoin, Benkirane and Lettre2015), with no mention of the expected phase of differentiation (Table 6).
Enrichment analysis results for 3009 differentially methylated regions during the intermediate phase versus 46,889 background sequences, as identified using the HOMER software.

(d) TFBS enrichment results for hypomethylated DMRs during late phase of differentiation
During the late phase (between days 10 and 13), we found the most enriched TFBS to be the farnesoid X receptor (FXR, also known as NR1H4). This TF is known to maintain the balance of cholesterol and bile acids. FXR has not been reported to contribute to stem cell pluripotency or differentiation. Rather, it contributes to red blood cell functions, as expected from mature erythroblasts during the late phase of differentiation (Table 7).
Enrichment analysis results for 1429 differentially methylated regions during the late phase versus 48,587 background sequences, as identified using the HOMER software.

No significant enrichment of TFBSs was found for hypomethylated DMRs with maximum hypomethylation during the last phase (between days 13 and 16). Enrichment results are expected to be not only cell-type specific and stage-specific, but also chromosome-specific, which cannot be emphasized by whole-genome enrichment results.
4. Discussion
We presented a novel chromosome-specific statistical analysis to test for DMRs at five different phases of erythroid differentiation. We also defined a differential phase for each CpG loci to better understand the common methylation pattern of DMRs with maximum log2 fold change during specific stages.
Our focused assessment of chromosome 16 allowed us to identify region-specific TFBS enrichment during each independent phase of differentiation. Some of the most enriched TFBSs, such as GATA3, ZNF322 and FXR, were not identified in similar studies (Yu et al., Reference Yu, Mo, Ebenezer, Bhattacharyya, Liu, Sundaravel, Giricz, Wontakal, Cartier, Caces, Artz, Nischal, Bhagat, Bathon, Maqbool, Gligich, Suzuki, Steidl, Godley, Skoultchi, Greally, Wickrema and Verma2013; Zhang et al., Reference Zhang, Zhou, Lin, Lowdon, Hong, Nagarajan, Cheng, Li, Stevens, Lee, Xing, Zhou, Sundaram, Elliott, Gu, Shi, Gascard, Sigaroudinia, Tlsty, Kadlecek, Weiss, O'Geen, Farnham, Maire, Ligon, Madden, Tam, Moore, Hirst, Marra, Zhang, Costello and Wang2013, Lessard et al., Reference Lessard, Beaudoin, Benkirane and Lettre2015). Even though, their functional significances in erythroblast development and functions are well established, which highlights the significance of chromosome and stage specific DM analysis.
Our stage-specific analysis was able to identify significantly enriched (q-value < 0.01) hypomethylated DMRs specific to GATA factors (1, 2, 3 and 4) binding sites. GATA3 binding site was stably the top enriched during the start phase of differentiation (days 0 to 3). GATA3 gene has been reported to be expressed before hematopoietic stem cell (HSC) commitment to T cells, which explain its enrichment in the start phase of our analysis. However, GATA3 overexpression in mouse HSCs results in erythroid and megakaryocytic lineages (Ho et al., Reference Ho, Tai and Pai2009). This finding also suggests that hypomethylation of the GATA3 TFBS (and possibly GATA3-binding sites) is essential for early HSC commitment to the erythrocyte lineage.
During the early phase (days 3 to 7), ZNF322 and RAR–RXR were enriched. Data from a more recent study showed that the RAR–RXR heterodimer-response pathway promotes cell growth and differentiation, rather than inhibiting it (Kinoshita et al., Reference Kinoshita, Koike, Mwamtemi, Ito, Ishida, Nakazawa, Kurokawa, Sakashita, Higuchi, Takeuchi, Sawai, Shiohara, Kamijo, Kawa, Yamashita and Komiyama2000). The reported influence of RAR–RXR on progenitor cells indicates an early differentiation phase-specificity for enrichment.
During the intermediate phase, we found that NANOG was stably enriched. NANOG is a principle pluripotency regulator, and increasing evidence supports its influence on cell-fate commitments. NANOG has been extensively used to promote stem cell differentiation in vivo and specifically for erythroid differentiation (Fouse et al., Reference Fouse, Shen, Pellegrini, Cole, Meissner, Van Neste, Jaenisch and Fan2007). The need for this gene transcription explains its TFBS enrichment and hypomethylation before day 10 of differentiation when erythroblasts are getting ready for fate commitment.
We also found the B-cell CLL/lymphoma 6 (BCL6) binding site significantly enriched during the intermediate phase but it has not been reported to be enriched in previous studies, although an experiment in BCL6-deficient mice resulted in abnormal erythroid differentiation (Asari et al., Reference Asari, Sakamoto, Okada, Ohkubo, Arima, Hatano, Kuroda and Tokuhisa2005).
SCL factors that were also enriched in the intermediate phase had been known for their co-regulation with GATA2 at GATA2 sites and other times with GATA1 at its sites. With mutant SCL binding domains in mice, mice were found to not die as early as knockouts, which led to the idea that the SCL binding site is not crucial for HSC differentiation. In further studies, the importance of GATA1 and SCL mutual binding at SCL sites for transcriptional activation of erythroid was confirmed (Dore & Crispino, Reference Dore and Crispino2011). Our results resolved previous confusion, as SCL site importance seems to show later during erythropoiesis compared to GATA1 and GATA2 binding sites that were differentially hypomethylated earlier during the start phase. Our analysis could confirm the stage specificity of GATA1 and SCL binding sites although these erythroid regulators were reported to present poor stage specificity (Xu et al., Reference Xu, Shao, Glass, Bauer, Pinello, Van Handel, Hou, Stamatoyannopoulos, Mikkola, Yuan and Orkin2012).
The most enriched TFBSs were not the top TFBSs identified in whole-genome analysis, using the same data (Yu et al., Reference Yu, Mo, Ebenezer, Bhattacharyya, Liu, Sundaravel, Giricz, Wontakal, Cartier, Caces, Artz, Nischal, Bhagat, Bathon, Maqbool, Gligich, Suzuki, Steidl, Godley, Skoultchi, Greally, Wickrema and Verma2013); because we expected our selected DMRs to be both stage and chromosome specific. We successfully verified that grouping chromosome 16 DMRs regardless of the developmental stage (Table 8), failed to show significant enrichments for most of the predicted stage-specific enriched TFBSs (Tables 4–7). Also, different enrichment results are expected when analyzing the DMRs of another chromosome. This possibility can be verified in the future by applying our analysis to whole-genome data or another chromosome and by grouping the DMRs based on the differential stage.
Enrichment analysis results for 7050 differentially methylated regions during all phases of erythroid differentiation, as identified using the HOMER software.

Analyzing hypermethylated and hypomethylated CpG loci separately was crucial for finding stage-specific DMRs. We found that hypermethylation was strongly associated with the length of promoter and gene body, rather than gene expression levels. They possess more stable levels of methylation than hypomethylated regions during differentiation. Fig. 3 shows a consistent pattern of hypermethylation distribution, based on the number of DMRs during each phase of differentiation. This might indicate their critical role in activating and suppressing genes rather than regulating the amount of expression that might be associated with hypomethylated regions at gene body.
When defining hypermethylated DMRs, we selected CpG loci that gained methylation the most (have the largest logFC), consequently, no stage-specific enrichment of TFBS was found. We expect the selected most hypermethylated DMRs to also be the most preserved sites.
When interpreting results, it is important to consider data limitations. First, the methylation data only covered genes on the positive strand of the genome. In addition, the CpG data coverage of each gene may include exons, introns and/or promoter regions, which are not always recovered after filtering the data. However, the data could still be used to successfully monitor the general behaviours of gene methylation during the differentiation process.
Acknowledgement
We extend our regards and appreciation to Dr Robert Haney, Department of Biology at the University of Massachusetts, Lowell, for his comments and review of the text. This research received no specific grant from any funding agency, commercial or not-for-profit sectors.
Declaration of interest
None.
Supplementary material
The online supplementary material can be found available at https://doi.org/10.1017/S0016672318000022
Supplementary Table S1. Sample of the annotation table created for chromosome 16 CpG loci. The table shows CpG loci in the alpha-globin gene cluster. The table includes 20 columns. Note that the first exons sometimes overlap with the promoter region. Also, erythroid-specific enhancers are not present within the sample region of chromosome 16. Label definitions: pro, promoter region; enh enhancers; DE, differential expression; DM, differential methylation.
Supplementary Table S2. p-values and log2 fold change of empirical Bayes test of differentially expressed genes (p-value < 0.015 and logFC > 3) during erythroid differentiation phases. Note: RNA-seq samples were collected at five-time points of erythropoiesis, whereas Affymetrix samples were collected at four-time points only. No expression data was available for day 16 to test for differentially expressed genes at the last phase (day 13–day 16).


