

Introduction
Hydrated magnesium and sodium sulfates are among the minerals that are common in evaporite deposits (Braitsch, Reference Braitsch1971; van Doesburg et al., Reference Van Doesburg, Vergouwen and van der Plas1982; Keller et al., Reference Keller, McCarthy and Richardson1986a). According to Lindstrom et al. (Reference Lindstrom, Talreja, Linnow, Stahlbuhk and Steiger2016), the degree of hydration of these phases is contingent upon the parameters of the formation environment, including temperature, relative humidity and the physicochemical properties of brines. These minerals are frequently observed in sulfide-rich tailings (Zielinski et al., Reference Zielinski, Otton and Johnson2001; Agnew and Taylor, Reference Agnew and Taylor2000; Jambor et al., Reference Jambor, Nordstrom, Alpers, Alpers, Jambor and Nordstrom2000; Acero et al., Reference Acero, Ayora and Carrera2007). They are also formed through the weathering of Mg-bearing primary minerals in ultramafic rocks (Dipple et al., Reference Dipple, Wilson, Barker, Thom, Raudsepp, Power, Southam and Fallon2009) and minerals of cements and concretes (Nord, Reference Nord1992; Kuchitsu et al., Reference Kuchitsu, Ishizaki and Nishiura1999; Matsukura et al., Reference Matsukura, Oguchi and Kuchitsu2004). Na–Mg sulfates are important constituents of saline soils and play a role in the salinization of surface and groundwater as well as desertification (Keller et al., Reference Keller, McCarthy and Richardson1986b; Last, Reference Last2002). These minerals are predicted to form on icy bodies in the Solar System (Dalton and Pitman, Reference Dalton and Pitman2012; Dalton et al., Reference Dalton, Prieto-Ballesteros, Kargel, Jamieson, Jolivet and Quinn2005) and on Mars (King et al., Reference King, Lescinsky and Nesbitt2004; Peterson et al., Reference Peterson, Nelson, Madu and Shurvell2007).
The most common hydrated sodium and magnesium sulfate minerals are blödite, Na2Mg(SO4)2·4H2O (Hawthorne, Reference Hawthorne1985), konyaite, Na2Mg(SO4)2·5H2O (Leduc et al., Reference Leduc, Peterson and Wang2009) and löweite, Na12Mg7(SO4)13·15H2O (Haidinger, Reference Haidinger1847). In literature, the latter is frequently referred to as ‘loeweite’. Temperature, evaporation rate, water content, and the composition of the primary brine all influence the crystallization sequence of Na–Mg sulfate minerals. They are susceptible to recrystallization when the physicochemical conditions of the environment undergo fluctuations. In addition to a variety of evaporite deposits, these minerals have been observed in volcanically active fumaroles in Iceland (Jakobsson et al., Reference Jakobsson, Leonardsen, Balić-Žunić and Jonsson2008) and Kamchatka (Borisov et al., Reference Borisov, Siidra, Vlasenko, Platonova, Schuldt, Neuman, Strauss and Holzheid2024). Unlike monoclinic konyaite (P21/c) and blödite (P21/a), löweite is trigonal, space group R  $\bar 3$. Schneider and Zemann (Reference Schneider and Zemann1959) and Kuhn and Ritter (Reference Kuhn and Ritter1958) determined the chemical composition of löweite, while Fang and Robinson (Reference Fang and Robinson1970) later solved its crystal structure (R $\bar 3$, a = 11.769(9) Å, α = 106.5(2)°, R 1 = 0.062). Hydrogen atoms were not localized. The question of the number of water molecules in the löweite structure remained open for a long time. Calculations based on thermal analysis data indicated 15 water molecules per formula (Kuhn and Ritter, Reference Kuhn and Ritter1958). Results of thermal analysis are consistent with the löweite structure reported by Fang and Robinson (Reference Fang and Robinson1970), whose refinement required modelling a complex disorder in one of the sulfate tetrahedra.
The crystal structure of löweite was refined and the hydrogen atoms were localized in this study. In situ single-crystal (temperature range –173 to 227°C) and powder (temperature range –173 to 900°C) X-ray studies were performed.
Materials and methods
Materials
The sample with rich sulfate mineral association, including löweite, was collected from the Yadovitaya fumarole, Second Scoria Cone, Tolbachik volcano (Borisov et al., Reference Borisov, Siidra, Vlasenko, Platonova, Schuldt, Neuman, Strauss and Holzheid2024) from 1.0 m depth. Immediately after recovery, the sample was sealed off on-site and thus isolated from the atmosphere. Löweite is represented by lamellar crystals up to 200×500×50 μm.
The chemical analysis of löweite was carried out with a Hitachi FlexSEM 1000 scanning electron microscope equipped with EDS Xplore Contact 30 detector and Oxford AZtecLive STD system of analysis. Analytical conditions were: accelerating voltage 20 kV and beam current 5 nA. Only Na, Mg, S and O were recorded, contents of other elements with atomic numbers higher than that of beryllium were below detection limits.
Methods
Low-temperature and high-temperature single-crystal X-ray diffraction
Single-crystal X-ray diffraction (LT-SCXRD and HT-SCXRD for low and high temperatures, respectively) data for löweite were collected using a Rigaku XtaLAB Synergy-S diffractometer operating with MoKα radiation at 50 kV and 1 mA. A single crystal was chosen and more than a hemisphere of data collected with a frame width of 0.5° in ω, and 30 s spent counting for each frame. The data were integrated and corrected for absorption applying a multi-scan type model using the Rigaku Oxford Diffraction programs CrysAlis Pro 1.1.11.
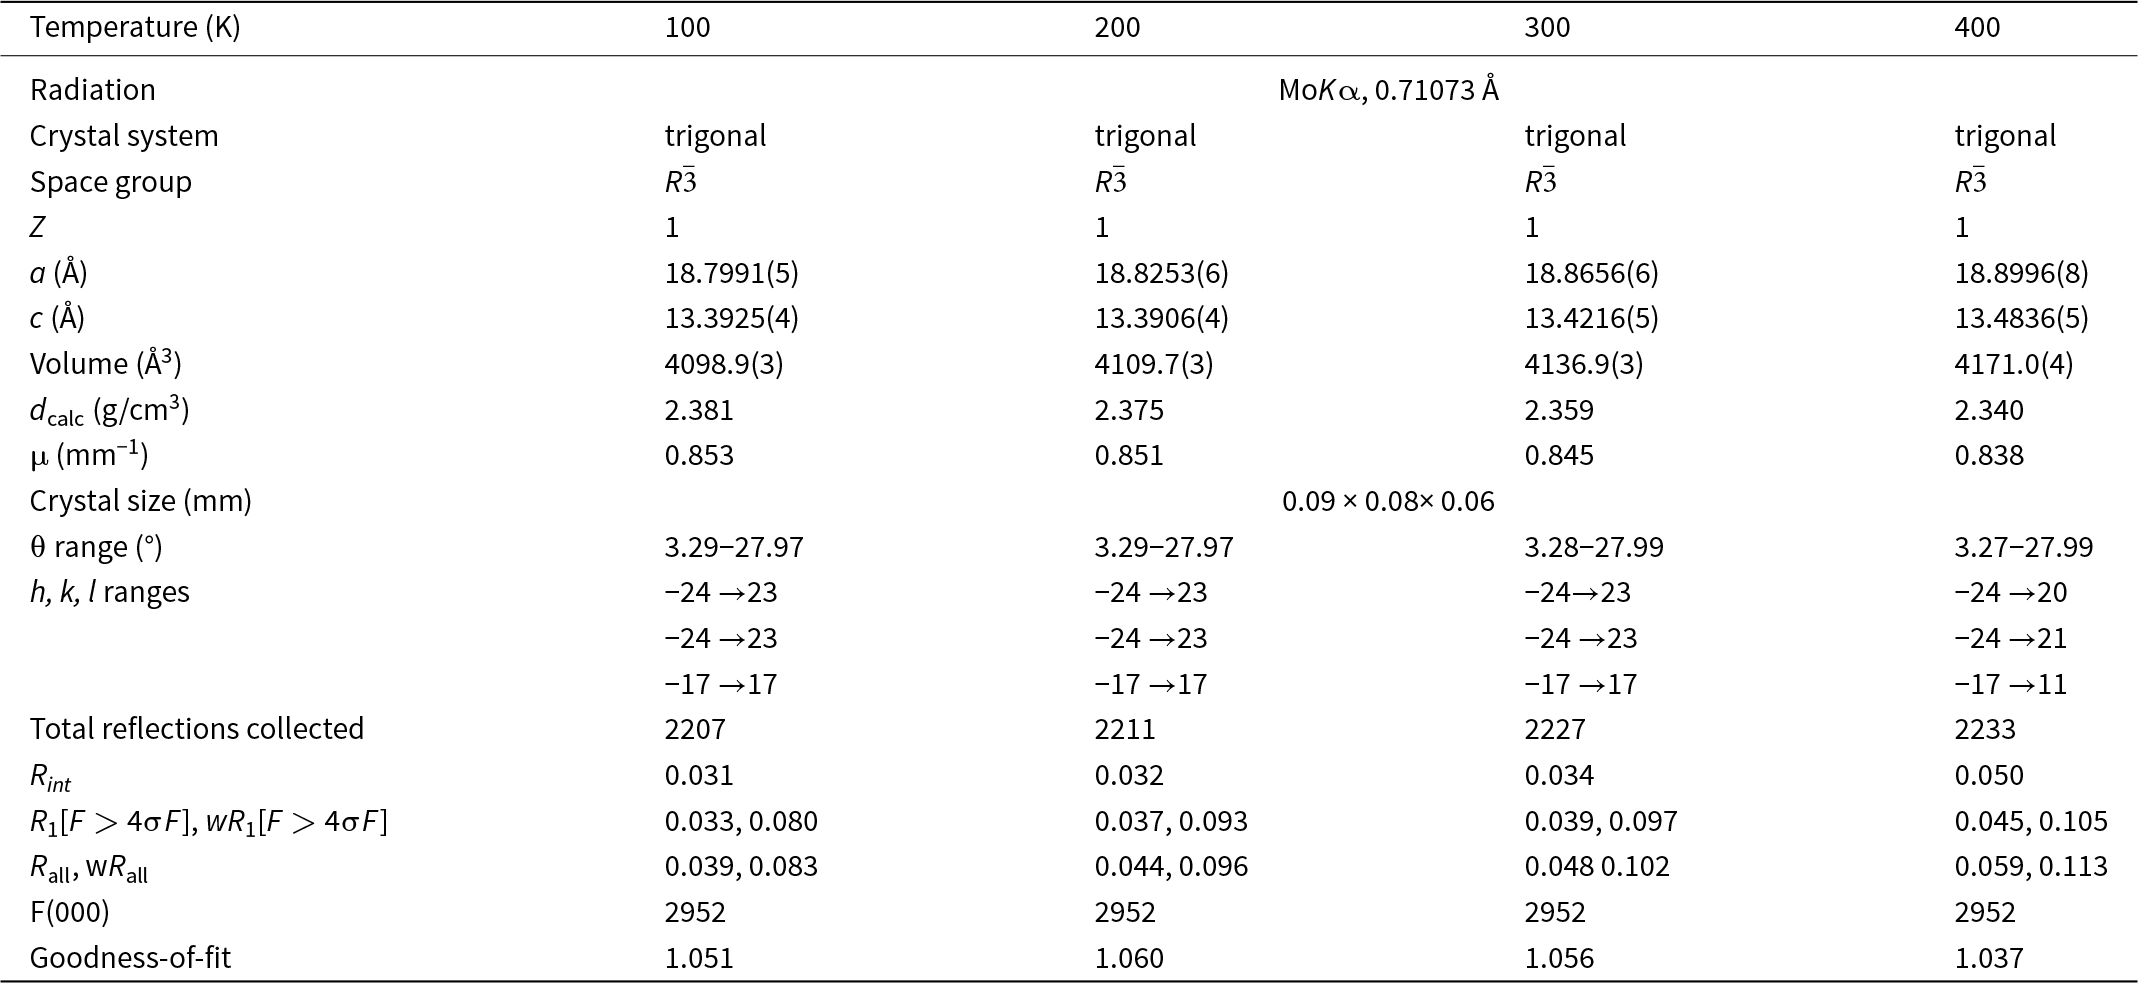
The löweite crystal was studied in the temperature range of 100–500 K (–173 to 227°С) using a «Hot Air Gas Blowers» heating system. A very high R int value is observed for the structural data obtained at 500 K, which is indicative of the commencement of crystal decomposition. However, the unit-cell parameters unambiguously correspond to löweite. Complete refinements of the structural datasets were only performed up to 480 K, and they are discussed below. The structures were successfully refined with the use of SHELX software package (Sheldrick, Reference Sheldrick2015). Atom coordinates and thermal displacement parameters for each temperature are collected in the corresponding crystallographic information file (cif, deposited as Supplementary material); crystallographic parameters for the selected temperatures are provided in Table 1. All H atoms were localized from the analysis of difference-Fourier electron density maps and were refined with the imposed O–H distance restraints of 1.000 ± 0.005 Å. The isotropic displacement parameters for HW1A and HW1B hydrogen atoms were held constant at 0.05 Å2 to prevent unrealistic refinement. Thermal displacement parameters for the O11 atom are comparatively large. It appeared feasible to split this partially occupied site into two subsites. Nevertheless, a decision was made to forgo this action in order to guarantee the clarity and interpretation of the thermal expansion behaviour, as delineated below.
Crystallographic data and refinement parameters for löweite

Table 1 Long description
The table lists single-crystal X-ray diffraction and refinement parameters for löweite measured at 100, 200, 300, and 400 K using molybdenum K alpha radiation with wavelength 0.71073 angstrom. The crystal system remains trigonal at all temperatures, with space group R bar 3 and Z equal to 1 throughout. Lattice parameter a increases from 18.7991 at 100 K to 18.8996 at 400 K, and c increases from 13.3925 to 13.4836. Unit-cell volume increases steadily from 4098.9 to 4171.0 cubic angstrom, while calculated density decreases from 2.381 to 2.340 grams per cubic centimeter and absorption coefficient decreases slightly from 0.853 to 0.838 per millimeter. Data collection uses a crystal size of 0.09 by 0.08 by 0.06 millimeters and a theta range near 3.27 to 27.99 degrees, with reflection index ranges reported for h, k, and l. Total reflections collected are similar across temperatures, from 2207 to 2233, and R int rises from 0.031 to 0.050 at 400 K. Refinement quality remains comparable, with R1 and weighted R1 for strong reflections increasing from 0.033 and 0.080 at 100 K to 0.045 and 0.105 at 400 K, and goodness-of-fit staying near 1.04 to 1.06. F zero zero zero is constant at 2952, and small changes in R factors at higher temperature may reflect slightly reduced data quality rather than a change in symmetry.
The effect of thermal motion on the bond-length values from single-crystal X-ray diffraction experiments is well-known (Downs, Reference Downs, Hazen and Downs2000). Corrections for S–O bonds were calculated by using a formula for the rigid-body motion: L 2 = l 02 + ⅜π2(Beq(A 2) – Beq(A 1)), where L and l 0 are corrected and observed A 1–A 2 bond lengths, respectively; and Beq(A 1) and Beq(A 2) are equivalent temperature factors of A 1 (cation, i.e.) and A 2 (anion, i.e. O) atoms, respectively.
Low-temperature and high-temperature powder X-ray diffraction
For the low-temperature and high-temperature powder X-ray diffraction (LT-PXRD, HT-PXRD, respectively) experiments, diffraction patterns were registered on a Rigaku Ultima IV powder diffractometer (Rigaku R-300 chamber, low vacuum of 600 Pa, CuKα radiation for the temperature range −173°C to 300°C (10°C step) and Rigaku HTA-1600 chamber and low vacuum of 600 Pa, CuKα radiation for the 100°C to 900°C range (30°C step), linear PSD detector). The ground sample was suspended in dry heptane and transferred onto a Cu (LT-PXRD) or Pt–Rh (HT-PXRD) holder. The heating rate was 2°C/min. Phase analysis was performed based on the PDF-2 database (powder diffraction file from the International Centre for Diffraction Data, http://www.icdd.com/, accessed 2020), and PDXL (Rigaku, 2010) and TOPAS V.5.0 (Bruker AXS, Reference Bruker2011) software. The thermal expansion of löweite was calculated using the Theta to Tensor-TTT program (Bubnova et al., Reference Bubnova, Firsova and Filatov2013).
Results
Crystal structure of löweite at 100K
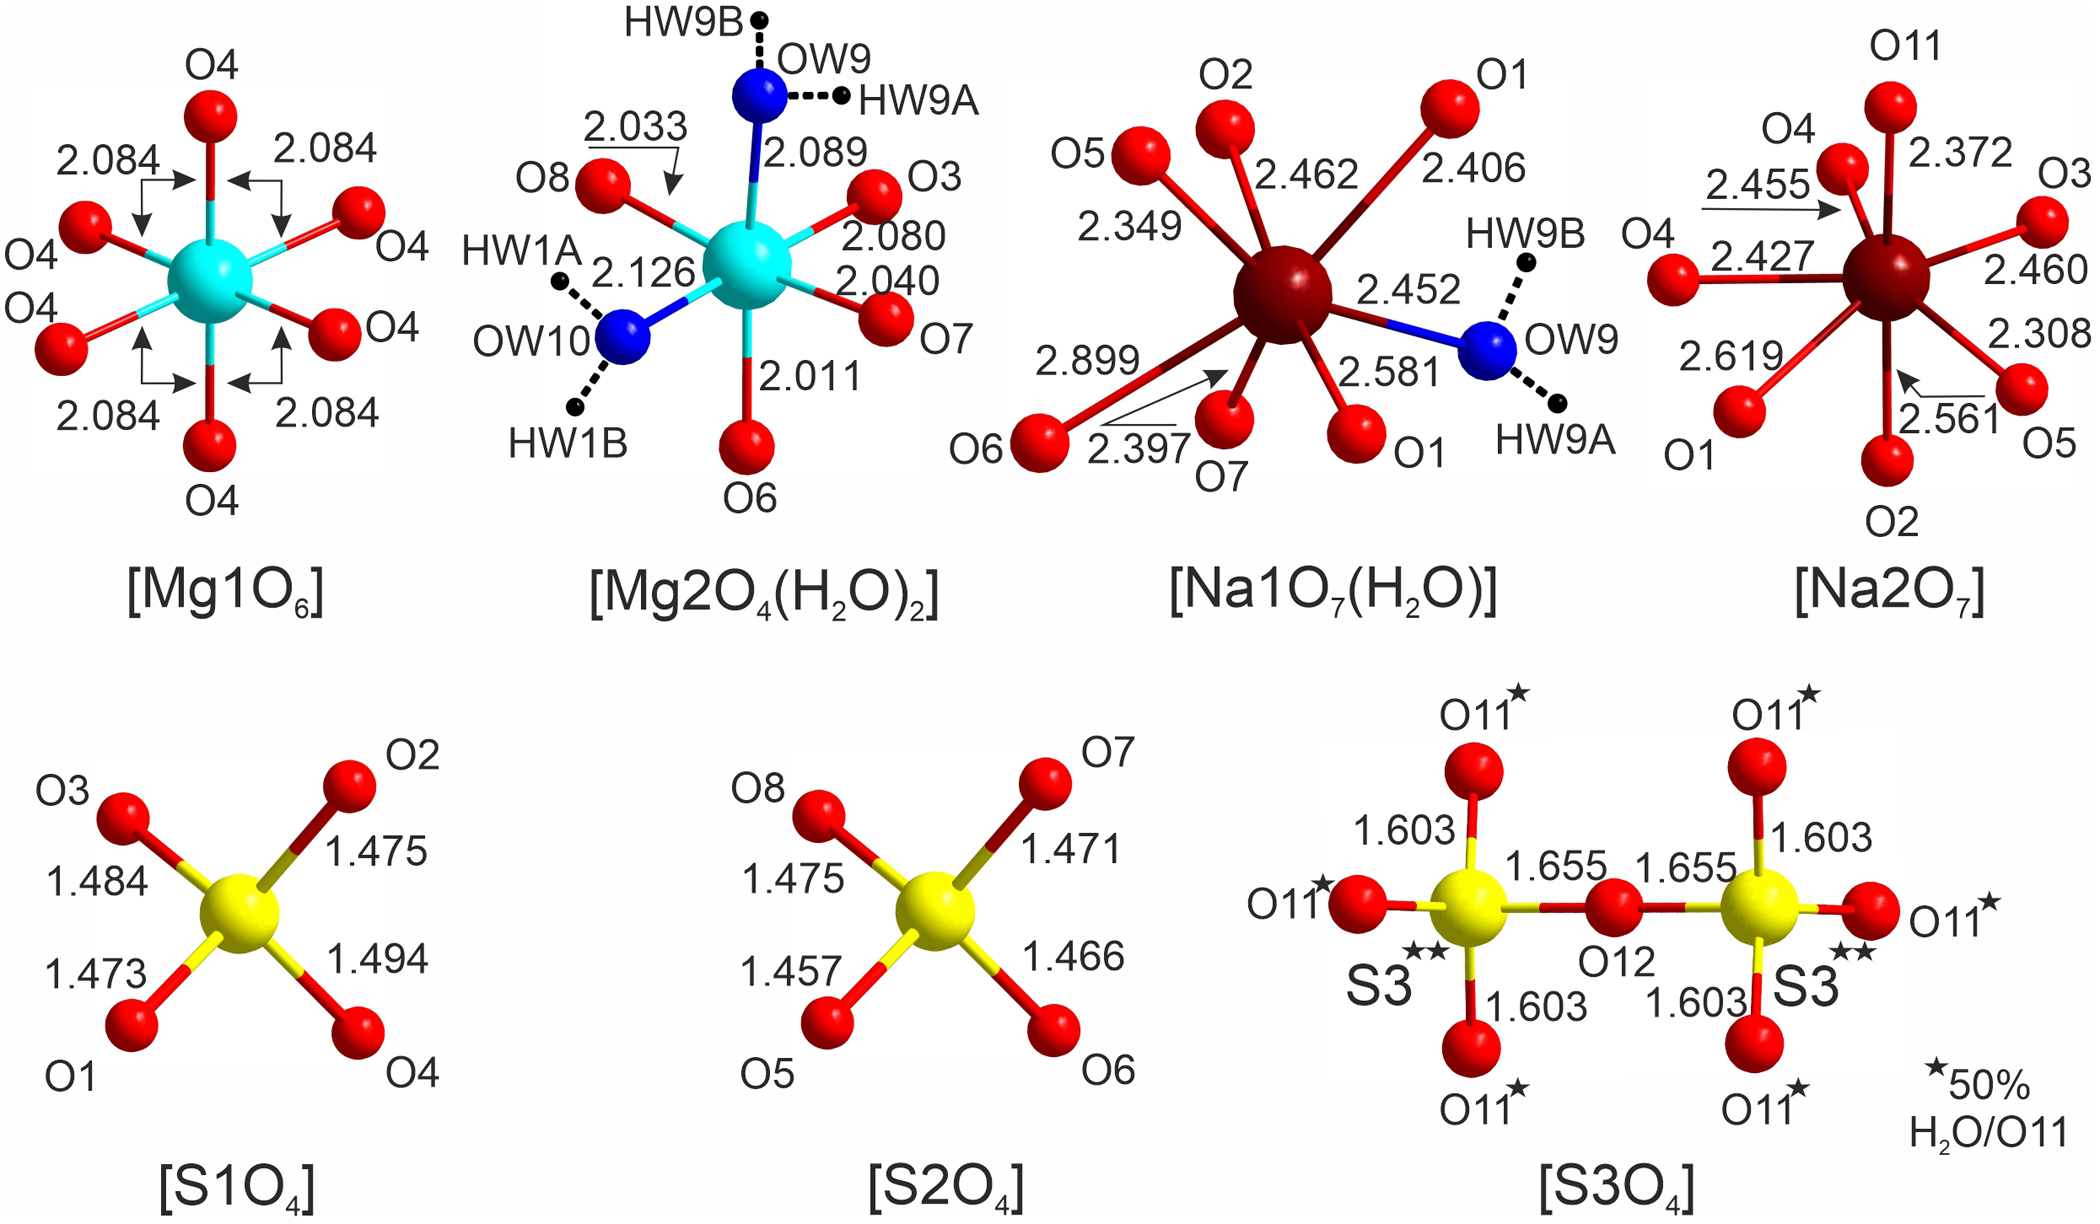
There are two symmetrically independent Mg and two Na atoms in the structure of löweite (Fig. 1). The Mg1 is coordinated by six oxygens to form Mg1O6 polyhedra (<Mg1–O> = 2.084 Å), and the Mg2 atom is coordinated by four oxygens and two water molecules thus forming Mg2O4(H2O)2 polyhedron (<Mg2–O> = 2.040, <Mg2–H2O> = 2.107 Å). The angles in the Mg1O6 polyhedron are nearly perfect for an octahedron, and all of the bond lengths are equal. Mg2–H2O bonds are elongated comparing to Mg2–O bonds with sulfate oxygens. The Na1 atom is coordinated by six oxygens and one water molecule to form Na1O6(H2O) polyhedra (<Na1–O> = 2.516, <Na1–H2O> = 2.452 Å), and the Na2 atom is coordinated by seven oxygens to form Na2O7 polyhedron (<Na2–O> = 2.457 Å). There are three symmetrically unique S atoms, in the crystal structure of löweite. Each of which is coordinated by four oxygen atoms (Fig. 1) to form SO4 tetrahedra (<S1–O> = 1.481, <S2–O> = 1.467, <S3–O> = 1.617 Å). The arrangement of the S1 and S2 atoms is completely ordered and almost perfectly tetrahedral. Because of the disorder in the S3 site, the bond lengths are much longer than the typical S–O values. The S3 atom is coordinated by one O12 atom and three O11 sites (Fig. 1). The occupancy of the S3 position is 50%. Consequently, the structure is characterized by the formation of a pseudo-group S2O7, in which sulfur is distributed across only one tetrahedron. Disorder also affects the positions of the water molecules in the O11 site.
Coordination environments for cations in the structure of löweite. Drawn using Diamond Version 4.6.8 (Crystal Impact GbR, Bonn, Germany).

Figure 1 Long description
The image shows coordination environments for cations in the structure of löweite. The top row displays polyhedra for Mg and Na atoms. The Mg1O6 polyhedron consists of a central Mg atom coordinated by six oxygen atoms, with bond lengths of 2.084 Å. The Mg2O4(H2O)2 polyhedron has a central Mg atom coordinated by four oxygen atoms and two water molecules, with Mg–O bond lengths of 2.040 Å and Mg–H2O bond lengths of 2.107 Å. The Na1O6(H2O) polyhedron features a central Na atom coordinated by six oxygen atoms and one water molecule, with Na–O bond lengths of 2.516 Å and Na–H2O bond lengths of 2.452 Å. The Na2O7 polyhedron has a central Na atom coordinated by seven oxygen atoms, with Na–O bond lengths of 2.457 Å. The bottom row shows tetrahedra for S atoms. The S1O4 tetrahedron consists of a central S atom coordinated by four oxygen atoms, with S–O bond lengths ranging from 1.473 Å to 1.494 Å. The S2O4 tetrahedron has a central S atom coordinated by four oxygen atoms, with S–O bond lengths ranging from 1.457 Å to 1.484 Å. The S3O4 tetrahedron features a central S atom coordinated by one O12 atom and three O11 sites, with S–O bond lengths ranging from 1.603 Å to 1.655 Å. The S3 site shows disorder, with 50 percent occupancy and positions of water molecules affected in the O11 site.
The bond-valence sums (BVS in valence units), calculated using the parameters from Gagné and Hawthorne (Reference Gagné and Hawthorne2016), correlate well to the formal valences of the atoms (2.04, 2.16, 1.09, 1.17, 5.87 and 6.07 vu for Mg1, Mg2, Na1, Na2, S1 and S2 respectively). Bond-valence sums 1.91, 1.78, 1.96, 2.09, 2.00, 1.98, 2.07, 1.87, 0.50 and 0.31 vu are observed for O1, O2, O3, O4, O5, O6, O7, O8, OW9 and OW10 atomic sites, respectively. For the highly disordered S3, O11 and O12 site, the BVS calculations were not performed.
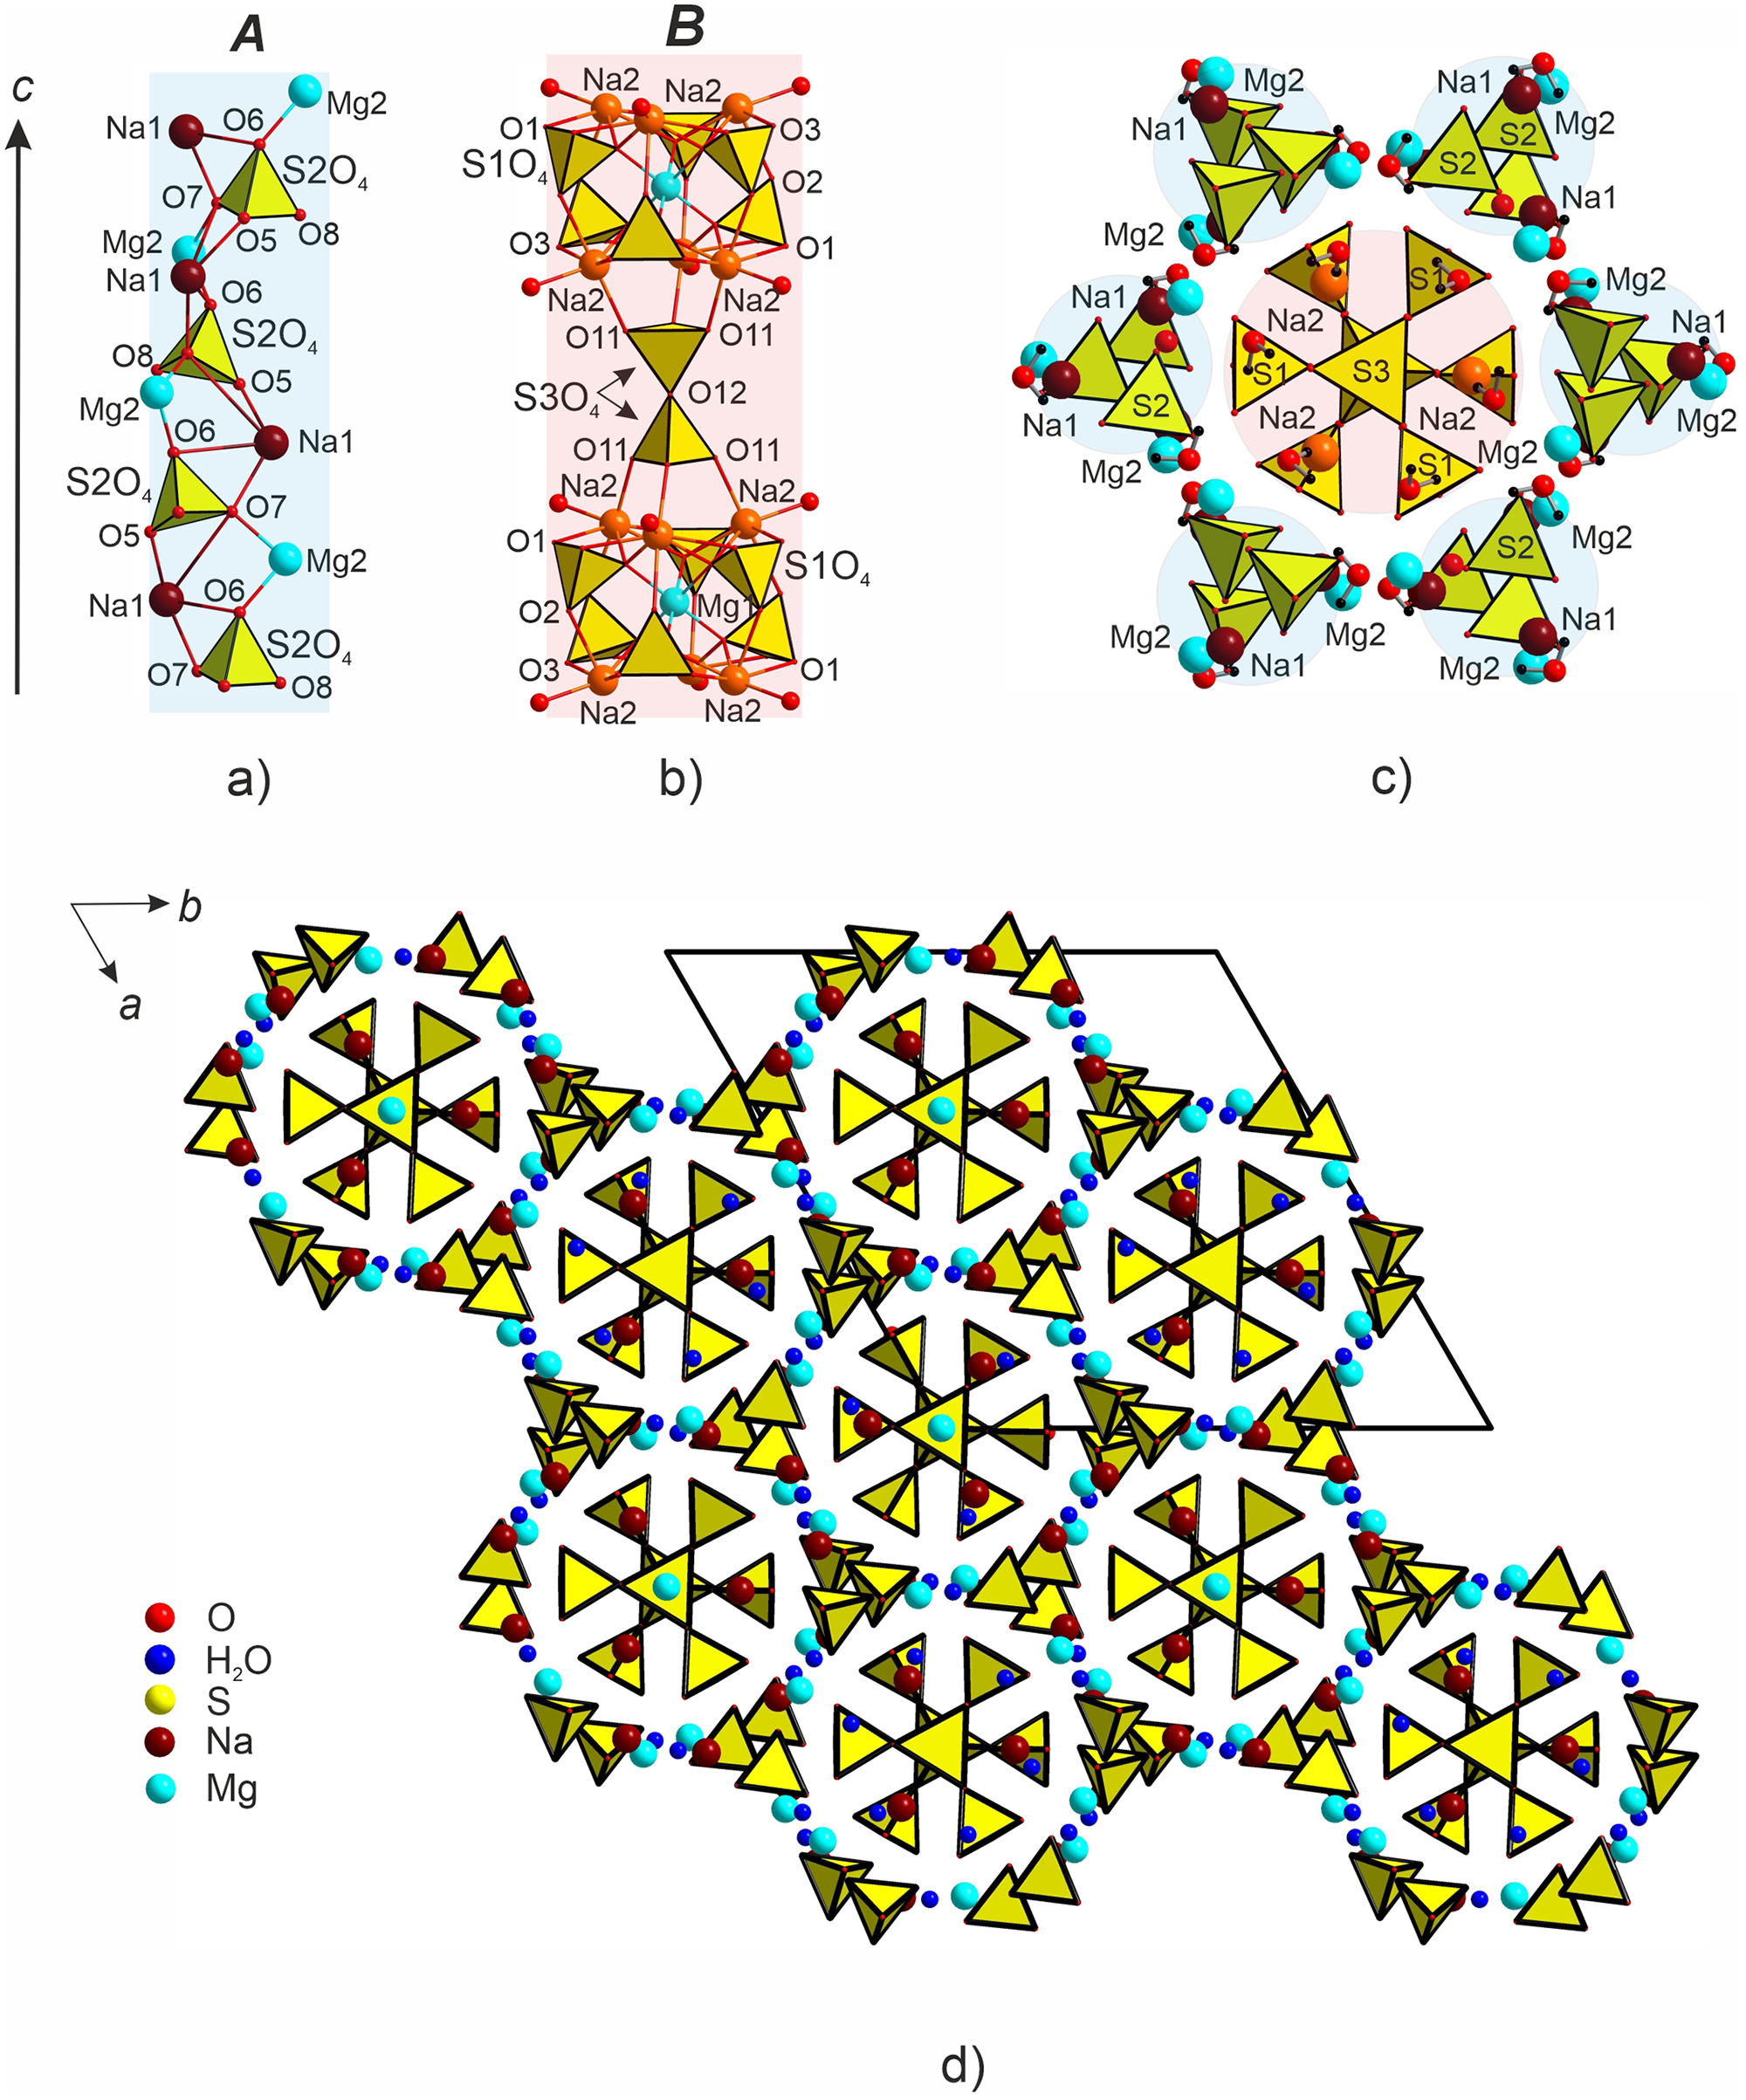
The löweite structure exhibits two types of rod-like chains: A and B (Fig. 2a,b). The A type is formed by Na1O6(H2O), Mg2O4(H2O)2, and S2O4 polyhedra via their common vertices (Fig. 2a). O7 and O8 sites are bridging atoms in the following hinges: S2–O7–Mg2, S2–O7–Na1; and S2–O8–Na1. The chains are elongated along the c-axis. There are six such rod-like chains around each three-fold axis. The second type of rod-like chains, B, is constructed from Na2O7, Mg1O6, S1O4 and S3O4 polyhedra (Fig. 2b). Each Mg1O6 polyhedron is interconnected with six S1O4 tetrahedra and six Na2O7 polyhedra. The complexes are linked into chains via the disordered S3O4 tetrahedra. As a result, Na2–O11–S3 hinges are formed in the B chain. These chains are arranged along the three-fold axes in the löweite structure, while A chains are located between them (Fig. 2c,d).
A (blue) and B (red) rod-like chains elongated along the c axis (a, b). Enlarged fragment of the löweite structure showing mutual arrangement of both types of chains (c). General projection of the crystal structure of löweite along the c axis (d). Drawn using Diamond Version 4.6.8 (Crystal Impact GbR, Bonn, Germany).

Figure 2 Long description
The image A shows the A type rod-like chain elongated along the c-axis, composed of Na1O6(H2O), Mg2O4(H2O)2 and S2O4 polyhedra connected via common vertices. Bridging atoms O7 and O8 form hinges S2–O7–Mg2, S2–O7–Na1 and S2–O8–Na1. The image B illustrates the B type rod-like chain, also elongated along the c-axis, constructed from Na2O7, Mg1O6, S1O4 and S3O4 polyhedra. Each Mg1O6 polyhedron connects with six S1O4 tetrahedra and six Na2O7 polyhedra, forming Na2–O11–S3 hinges. The image C presents an enlarged fragment of the löweite structure, showing the mutual arrangement of both types of chains around a three-fold axis. The A chains are located between the B chains. The image D provides a general projection of the crystal structure of löweite along the c-axis, displaying the arrangement of chains in a repeating pattern. The diagram uses color coding to differentiate elements: red for oxygen, blue for water, yellow for sulfur, light blue for sodium and green for magnesium.
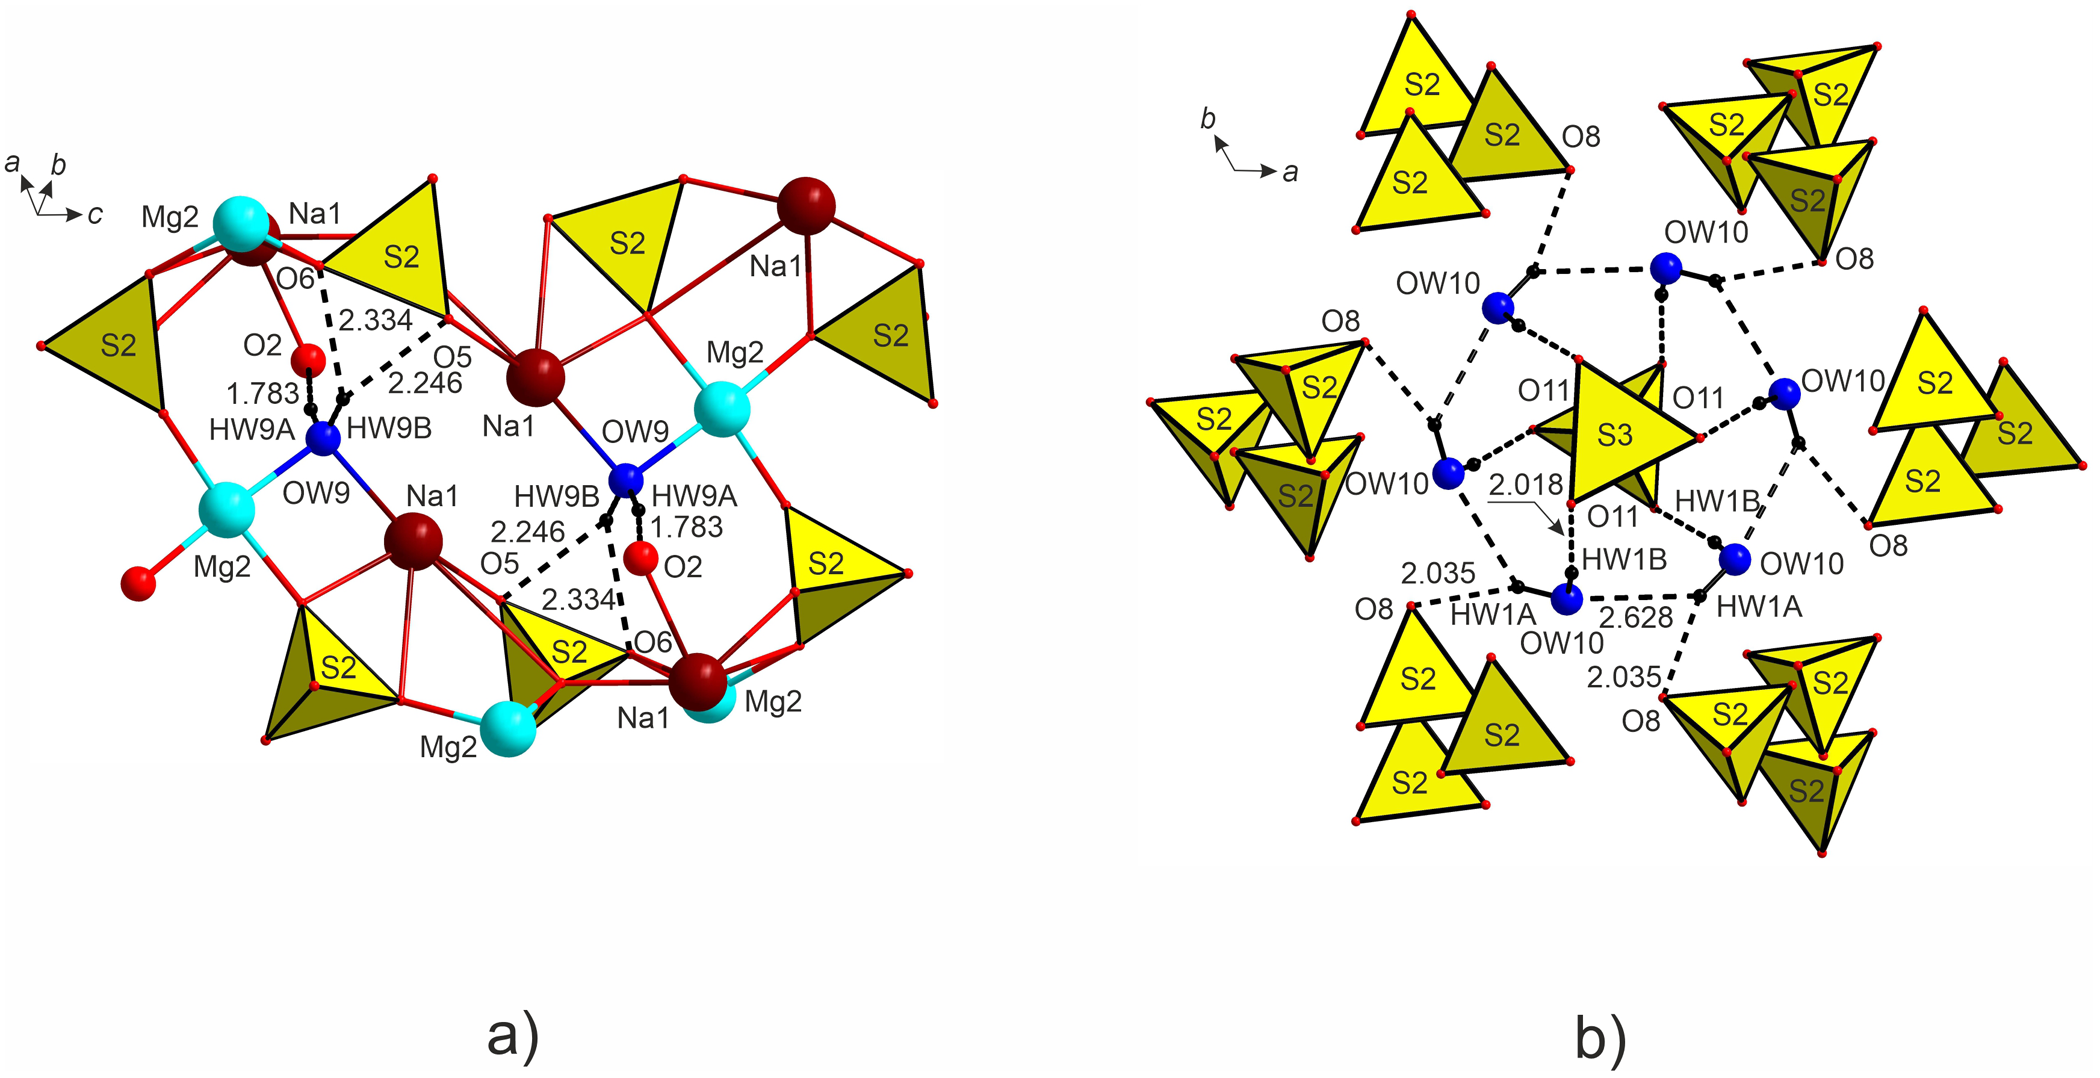
The Mg2 atom is coordinated by two water molecules (OW9 and OW10), and Na1 by one (OW9). Hydrogen bonds are formed between the Mg2O4(H2O)2 and S2O4, S3O4 polyhedra (Fig. 3a). The HW9A hydrogen atom forms a strong hydrogen bond of 1.782(1) Å with the O2 atom of the S2O4 sulfate tetrahedron and a bifurcate hydrogen bond with the O5 and O6 atoms with d(H···A) = 2.242(1) Å and 2.335(1) Å. The HW1A hydrogen of the OW10 molecule forms a hydrogen bond with the O8 oxygen atom with d(H···A) = 2.035(1) Å (Fig. 3b). The HW1A atom also forms an additional hydrogen bond of 2.628(1) Å with the neighbouring water molecule OW10 Å. The HW1B atom forms a hydrogen bond of 2.018(1) Å with the oxygen position O11, partially occupied by a water molecule.
H-bonds in the structure of löweite. Oxygen atoms of OW9 and OW10 water molecules are marked by blue. Drawn using Diamond Version 4.6.8 (Crystal Impact GbR, Bonn, Germany).

Figure 3 Long description
The image A shows the hydrogen bonding structure in löweite, focusing on the coordination of atoms. The Mg2 atom is coordinated by two water molecules, OW9 and OW10, while Na1 is coordinated by OW9. Hydrogen bonds are formed between Mg2O4(H2O)2 and S2O4, S3O4 polyhedra. The HW9A hydrogen atom forms a strong hydrogen bond with the O2 atom of the S2O4 sulfate tetrahedron, measuring one point seven eight two angstroms and bifurcate hydrogen bonds with the O5 and O6 atoms, measuring two point two four two angstroms and two point three three five angstroms respectively. The image B illustrates the hydrogen bonding network involving OW10 and surrounding atoms. The HW1A hydrogen atom of the OW10 molecule forms a hydrogen bond with the O8 oxygen atom, measuring two point zero three five angstroms and an additional hydrogen bond with the neighboring water molecule OW10, measuring two point six two eight angstroms. The HW1B atom forms a hydrogen bond with the oxygen position O11, partially occupied by a water molecule, measuring two point zero one eight angstroms. Both images depict the spatial arrangement of atoms and bonds, with oxygen atoms marked in blue and tetrahedral structures highlighted in yellow.
Crystal structure evolution upon heating
No phase transitions are observed over the entire range of LT- and HT-XRD data for löweite. The löweite crystal is stable up to 500 K (217°C), above which reflections on single-crystal X-ray frames disappear. The loss of löweite crystallinity is accompanied by a change in crystal transparency to milky white. After subsequent cooling to 300 K, the crystal remains X-ray amorphous, with a series of deep cracks observed on its surface.
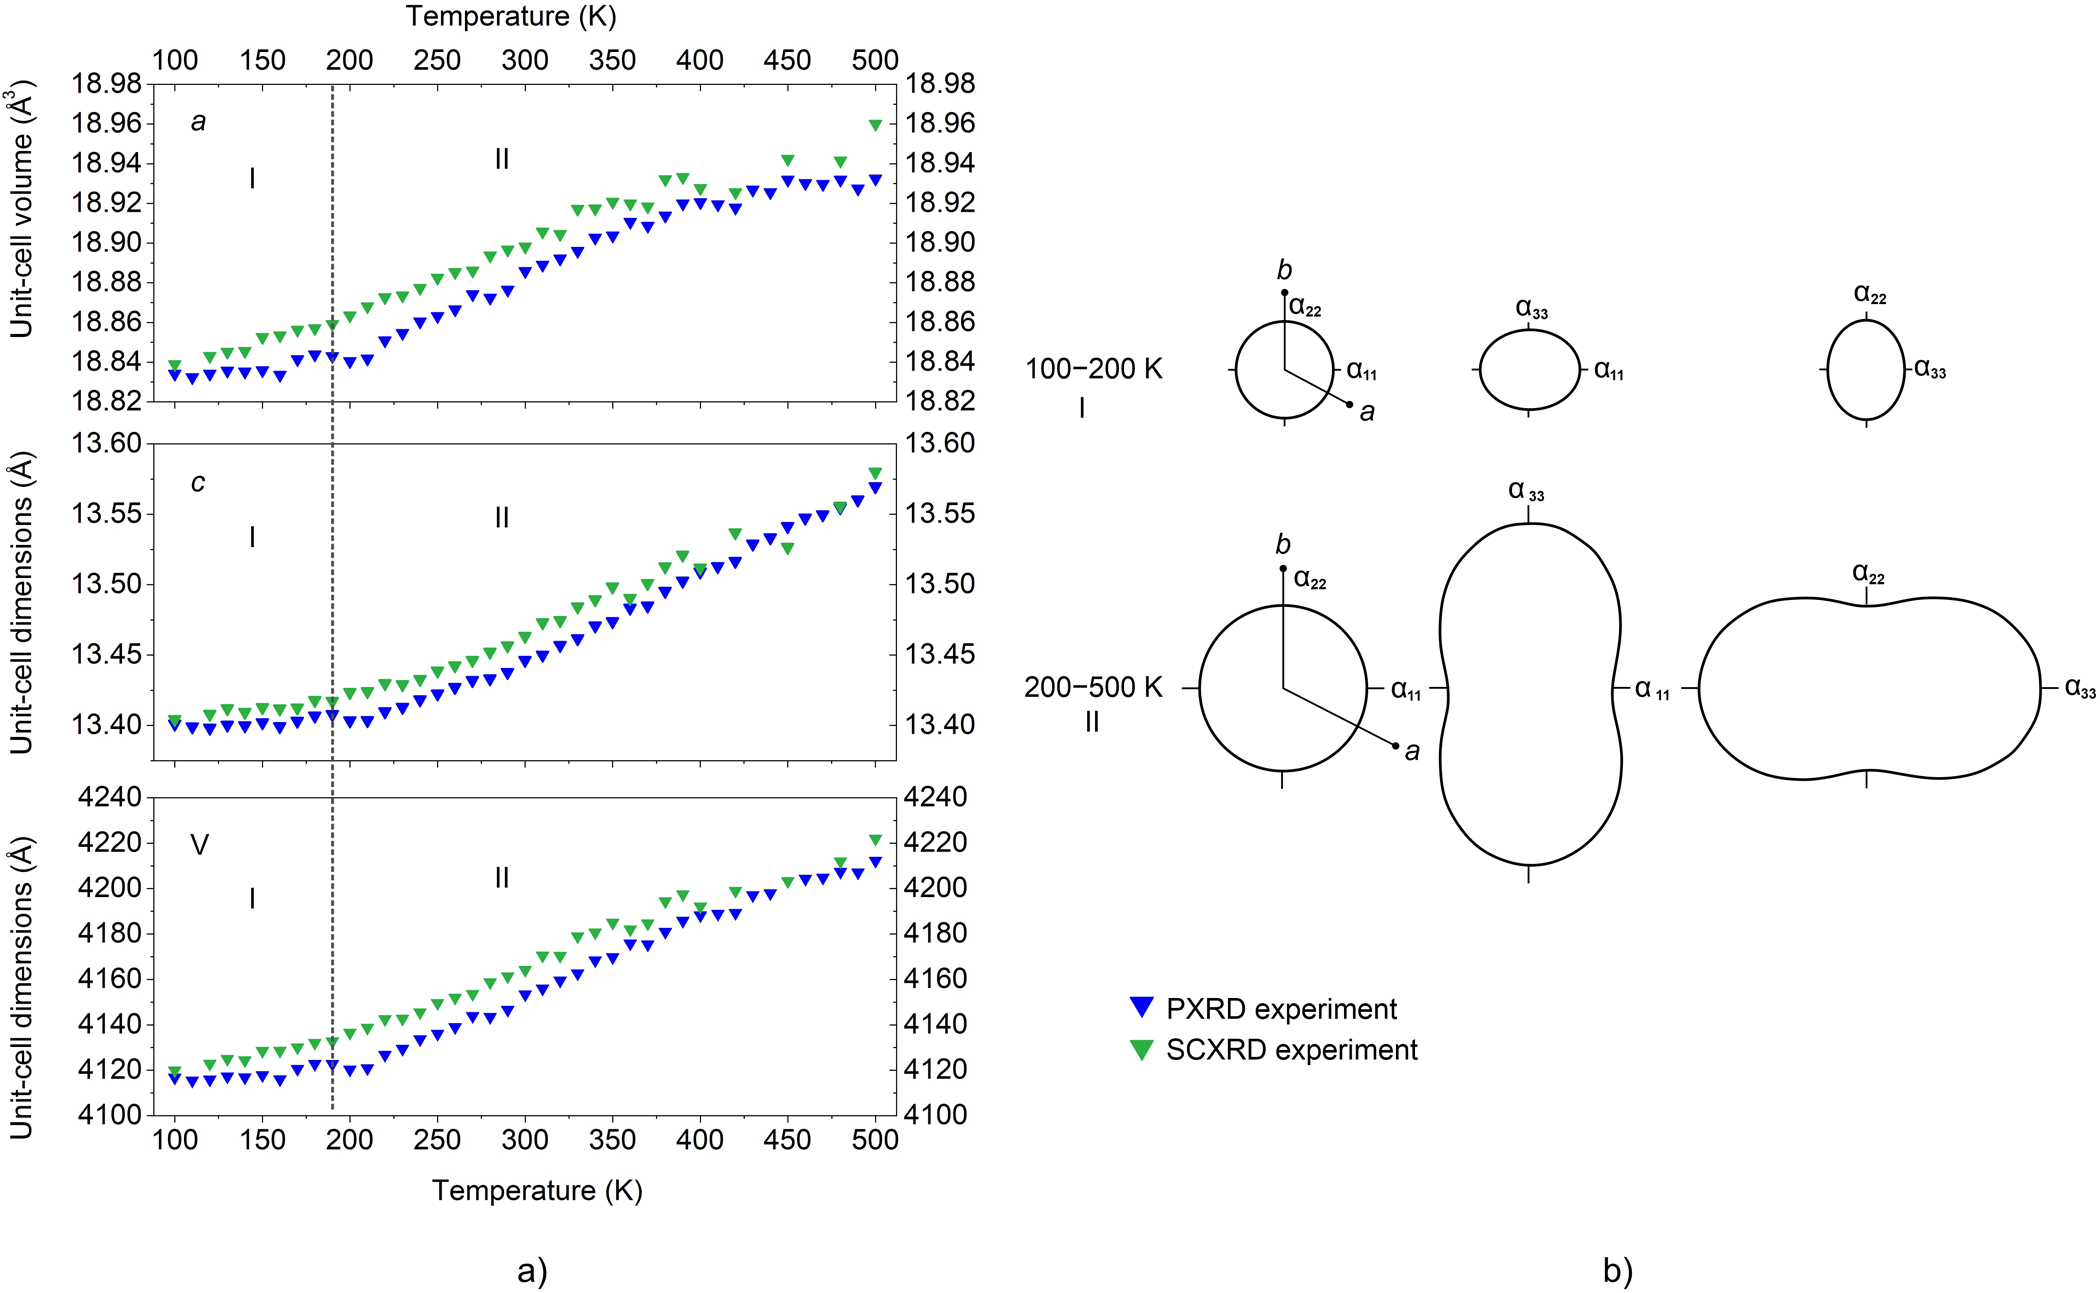
The evolution of löweite unit-cell parameters determined by SCXRD (brown dots) and PXRD (blue dots) upon heating in the range from 100 to 500 K is shown in Fig. 4a. Below, we discuss thermal expansion based only on single-crystal X-ray data. The unit-cell parameters a, c, and V increase upon the temperature rise. Each dependence has two linear sections: 100–190 K (I) and 200–500 K (II). In the first section, the parameters change only slightly compared to the second. In both cases, the dependences are well approximated by first-degree polynomials:
a 1(T) = 18.8147(25) + 0.238(16) × 10–3 T
c 1(T) = 13.3919(31) + 0.134(20) × 10–3 T
V 1(T) = 4105.5(1.4) + 145.4(9.4) × 10–3 T
and
a 2(T) = 18.7938(37) + 0.353(12) × 10–3 T
c 2(T) = 13.3135(53) + 0.510(17) × 10–3 T
V 2(T) = 4071.8(2.8) + 313.4(9.4) × 10–3 T
The evolution of löweite unit-cell parameters upon heating in the range from 100 to 500 K obtained using single-crystal and powder X-ray diffraction (a). Evolution of the thermal expansion tensor upon heating (b).

Figure 4 Long description
The figure has two parts labeled a) and b). a) Three stacked plots share the x-axis label Temperature (K), with tick labels 100, 150, 200, 250, 300, 350, 400, 450, 500. Top plot: y-axis label Unit-cell volume (A superscript 3). Left y-axis tick labels 18.80, 18.82, 18.84, 18.86, 18.88, 18.90, 18.92, 18.94, 18.96, 18.98. A matching right y-axis shows the same tick labels. Two vertical dashed lines mark 190 and 200 on the temperature axis. The region between 100 and 190 is labeled I and the region from 200 to 500 is labeled II. Two data series are shown with markers: PXRD experiment and SCXRD experiment. The plotted points rise from about 18.82 near 100 K to about 18.94 to 18.95 near 500 K. Middle plot: y-axis label Unit-cell distances (A). Left y-axis tick labels 13.40, 13.45, 13.50, 13.55, 13.60. A matching right y-axis shows the same tick labels. Two vertical dashed lines mark 190 and 200 on the temperature axis, with I and II labels as in the top plot. Two data series are shown with markers: PXRD experiment and SCXRD experiment. The plotted points rise from about 13.40 near 100 K to about 13.58 to 13.60 near 500 K. Bottom plot: y-axis label Unit-cell dimensions (A). Left y-axis tick labels 4120, 4140, 4160, 4180, 4200, 4220. A matching right y-axis shows the same tick labels. Two vertical dashed lines mark 190 and 200 on the temperature axis, with I and II labels as in the top plot. Two data series are shown with markers: PXRD experiment and SCXRD experiment. The plotted points rise from about 4120 near 100 K to about 4200 near 500 K. Legend: PXRD experiment; SCXRD experiment. b) A set of ellipse diagrams labeled 100 to 200 K and 200 to 500 K. Each temperature range shows three ellipses labeled alpha subscript 11, alpha subscript 22 and alpha subscript 33. The ellipses are drawn with different sizes and orientations and each ellipse has a small arrow indicating direction.
Between 100 and 180 K, the thermal expansion of löweite is almost constant and isotropic. However, at 200 K, the pattern of thermal expansion drastically changes and becomes strongly anisotropic until löweite decomposes. The α11 shows a 50% increase across the entire temperature range, while α33 increases by nearly 3.8 times.
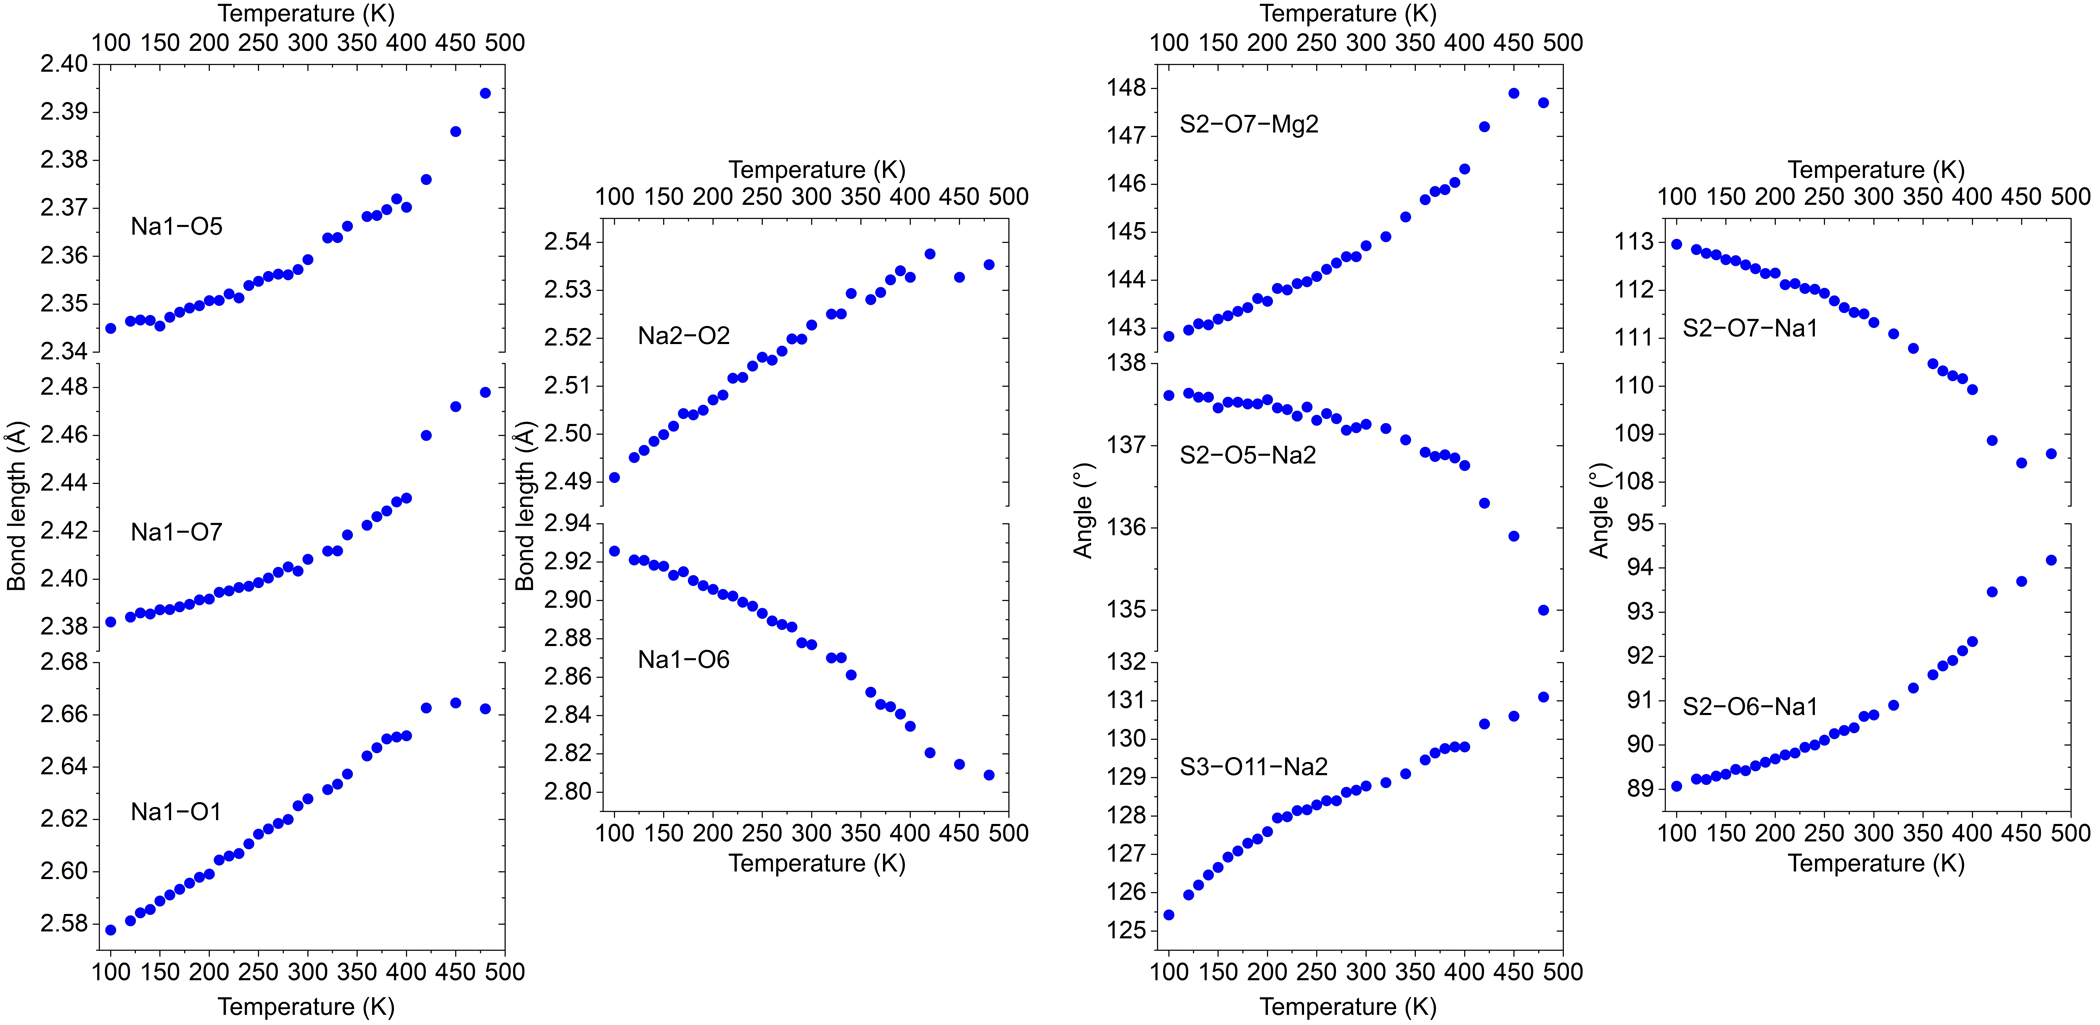
The pattern of thermal expansion varies as the temperature rises (Fig. 4b), indicating shear deformations. Löweite exhibits a strongly anisotropic thermal expansion between 200 and 500 K. It is underpinned by the anisotropy of the thermal evolution of bond lengths and angles in the coordination polyhedra. In most cases, changes in bond lengths do not exceed 0.03 Å, except for the Na1–O5 (0.04 Å), Na1–O7 (0.09 Å), Na1–O6 (0.09 Å), and Na2–O2 (0.07 Å) bonds. The structure is formed by an arrangement of hinges when the vertices of sodium and magnesium polyhedra and SO4 tetrahedra are shared (Fig. 2). Over the entire temperature range, most angles also change slightly, by less than 2 degrees. The exceptions are the angles (hinges) S2–O7–Mg2 (∆ = 4.42°), S2–O5–Na2 (∆ = 2.61°), S3–O11–Na2 (∆ = 2.30°), S2–O7–Na1 (∆ = 3.74°) and S2–O6–Na1 (∆ = 4.30°).
Polyhedra in A rod-like chains (Fig. 2a) that are elongated along the c-axis aggregate to produce the S2–O7–Mg2, S2–O7–Na1, and S2–O6–Na1 hinges. The chain’s elongation and a marked increase in thermal expansion in this direction are direct consequences of the substantial changes that these hinges undergo upon heating. The bonds that change the most are those that are aligned with the c axis. The same scenario is also indicative of B rod-like chains. Virtually unchanged, the distances between the chains exhibit values that fall within the e.s.d.
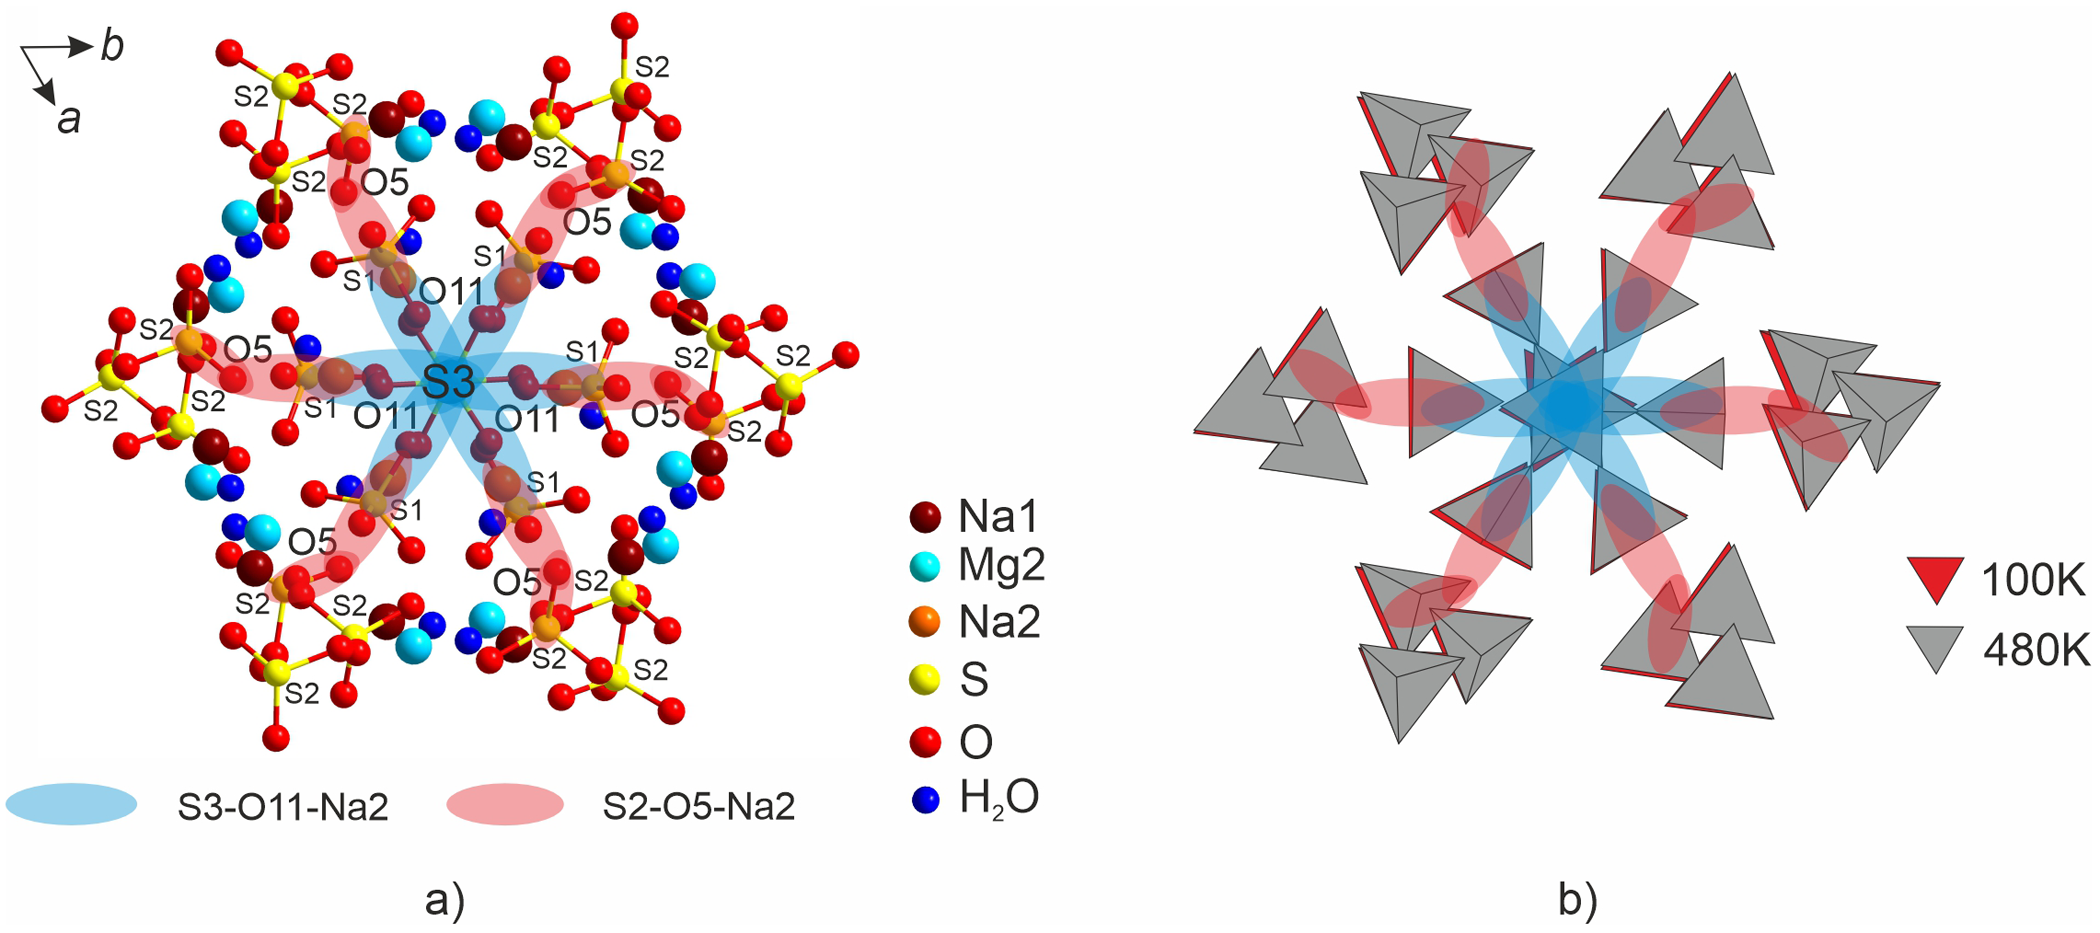
Concurrently, the S2–O5–Na2 and S3–O11–Na2 hinges are located in the ab-plane and are involved in the cohesion of the two types of chains into a framework (Fig. 5a). Both of these angles change significantly upon heating (Fig. 6). It is possible to visualize the crystal structure of löweite as consisting of two different kinds of hinges that, when heated, expand along their elongation. The sulfate tetrahedra’s displacement is shown in Fig. 5b through the superposition of projections of the löweite crystal structure at 100 and 480 K. The tetrahedra in both chains rotate relative to each other, albeit with varying degrees of displacement. Heating induces a sequence of shear deformations in the structure, which culminates in the amorphization of the löweite crystal upon further heating.
(a) A fragment of the löweite crystal structure with highlighted S3–O11–Na2 and S2–O5–Na2 hinges mainly responsible for the shear deformations in the löweite structure upon heating. (b) Schematic diagram of the evolution of the crystal structure of löweite upon heating in the range from 100 to 480 K obtained from single-crystal X-ray diffraction. See the text for details. Drawn using Diamond Version 4.6.8 (Crystal Impact GbR, Bonn, Germany).

Figure 5 Long description
The image consists of two parts. The first part, labeled a, shows a fragment of the löweite crystal structure with highlighted hinges S3 dash O11 dash Na2 and S2 dash O5 dash Na2. These hinges are mainly responsible for shear deformations upon heating. The diagram includes various elements represented by colored spheres: Na1 in dark red, Mg2 in light green, Na2 in light blue, S in yellow, O in red and H2O in dark blue. The hinges S3 dash O11 dash Na2 and S2 dash O5 dash Na2 are marked with blue and red ellipses, respectively. The orientation is indicated by an arrow pointing from b to a. The second part, labeled b, is a schematic diagram showing the evolution of the crystal structure upon heating from 100 to 480 K. It features superimposed projections of the structure at these temperatures, with red triangles representing 100 K and gray triangles representing 480 K. The diagram illustrates the displacement and rotation of sulfate tetrahedra within the structure as temperature increases.
Evolution of the selected bond lengths and angles in the crystal structure of löweite upon heating.

Figure 6 Long description
Three scatter plots arranged left to right. Left plot: The x-axis is labeled Temperature (K), with tick labels 100, 150, 200, 250, 300, 350, 400, 450, 500. The y-axis is labeled Bond length (Å), ranging from 2.58 to 2.40 with tick labels 2.58, 2.56, 2.54, 2.52, 2.50, 2.48, 2.46, 2.44, 2.42, 2.40. Three labeled point series appear: Na1–O5, Na1–O7 and Na1–O1. Na1–O5 rises from about 2.35 near 100 K to about 2.39 near 480 K. Na1–O7 rises from about 2.69 near 100 K to about 2.73 near 480 K. Na1–O1 rises from about 2.60 near 100 K to about 2.66 near 480 K. Middle plot: The x-axis is labeled Temperature (K), with tick labels 100, 150, 200, 250, 300, 350, 400, 450, 500. The y-axis is labeled Bond length (Å), ranging from 2.80 to 2.56 with tick labels 2.80, 2.78, 2.76, 2.74, 2.72, 2.70, 2.68, 2.66, 2.64, 2.62, 2.60, 2.58, 2.56. Two labeled point series appear: Na2–O2 and Na1–O6. Na2–O2 increases from about 2.90 near 100 K to about 2.54 near 480 K. Na1–O6 decreases from about 2.92 near 100 K to about 2.82 near 480 K. Right plot: The x-axis is labeled Temperature (K), with tick labels 100, 150, 200, 250, 300, 350, 400, 450, 500. The y-axis is labeled Angle (°), ranging from 88 to 148 with tick labels 88, 93, 98, 103, 108, 113, 118, 123, 128, 133, 138, 143, 148. Four labeled point series appear: S2–O7–Na2, S2–O5–Na2, S3–O11–Na2 and S2–O6–Na1. S2–O7–Na2 increases from about 142 near 100 K to about 148 near 480 K. S2–O5–Na2 decreases from about 140 near 100 K to about 135 near 480 K. S3–O11–Na2 increases from about 126 near 100 K to about 133 near 480 K. S2–O6–Na1 increases from about 88 near 100 K to about 98 near 480 K.
LT-PXRD and HT-PXRD and the decomposition of löweite
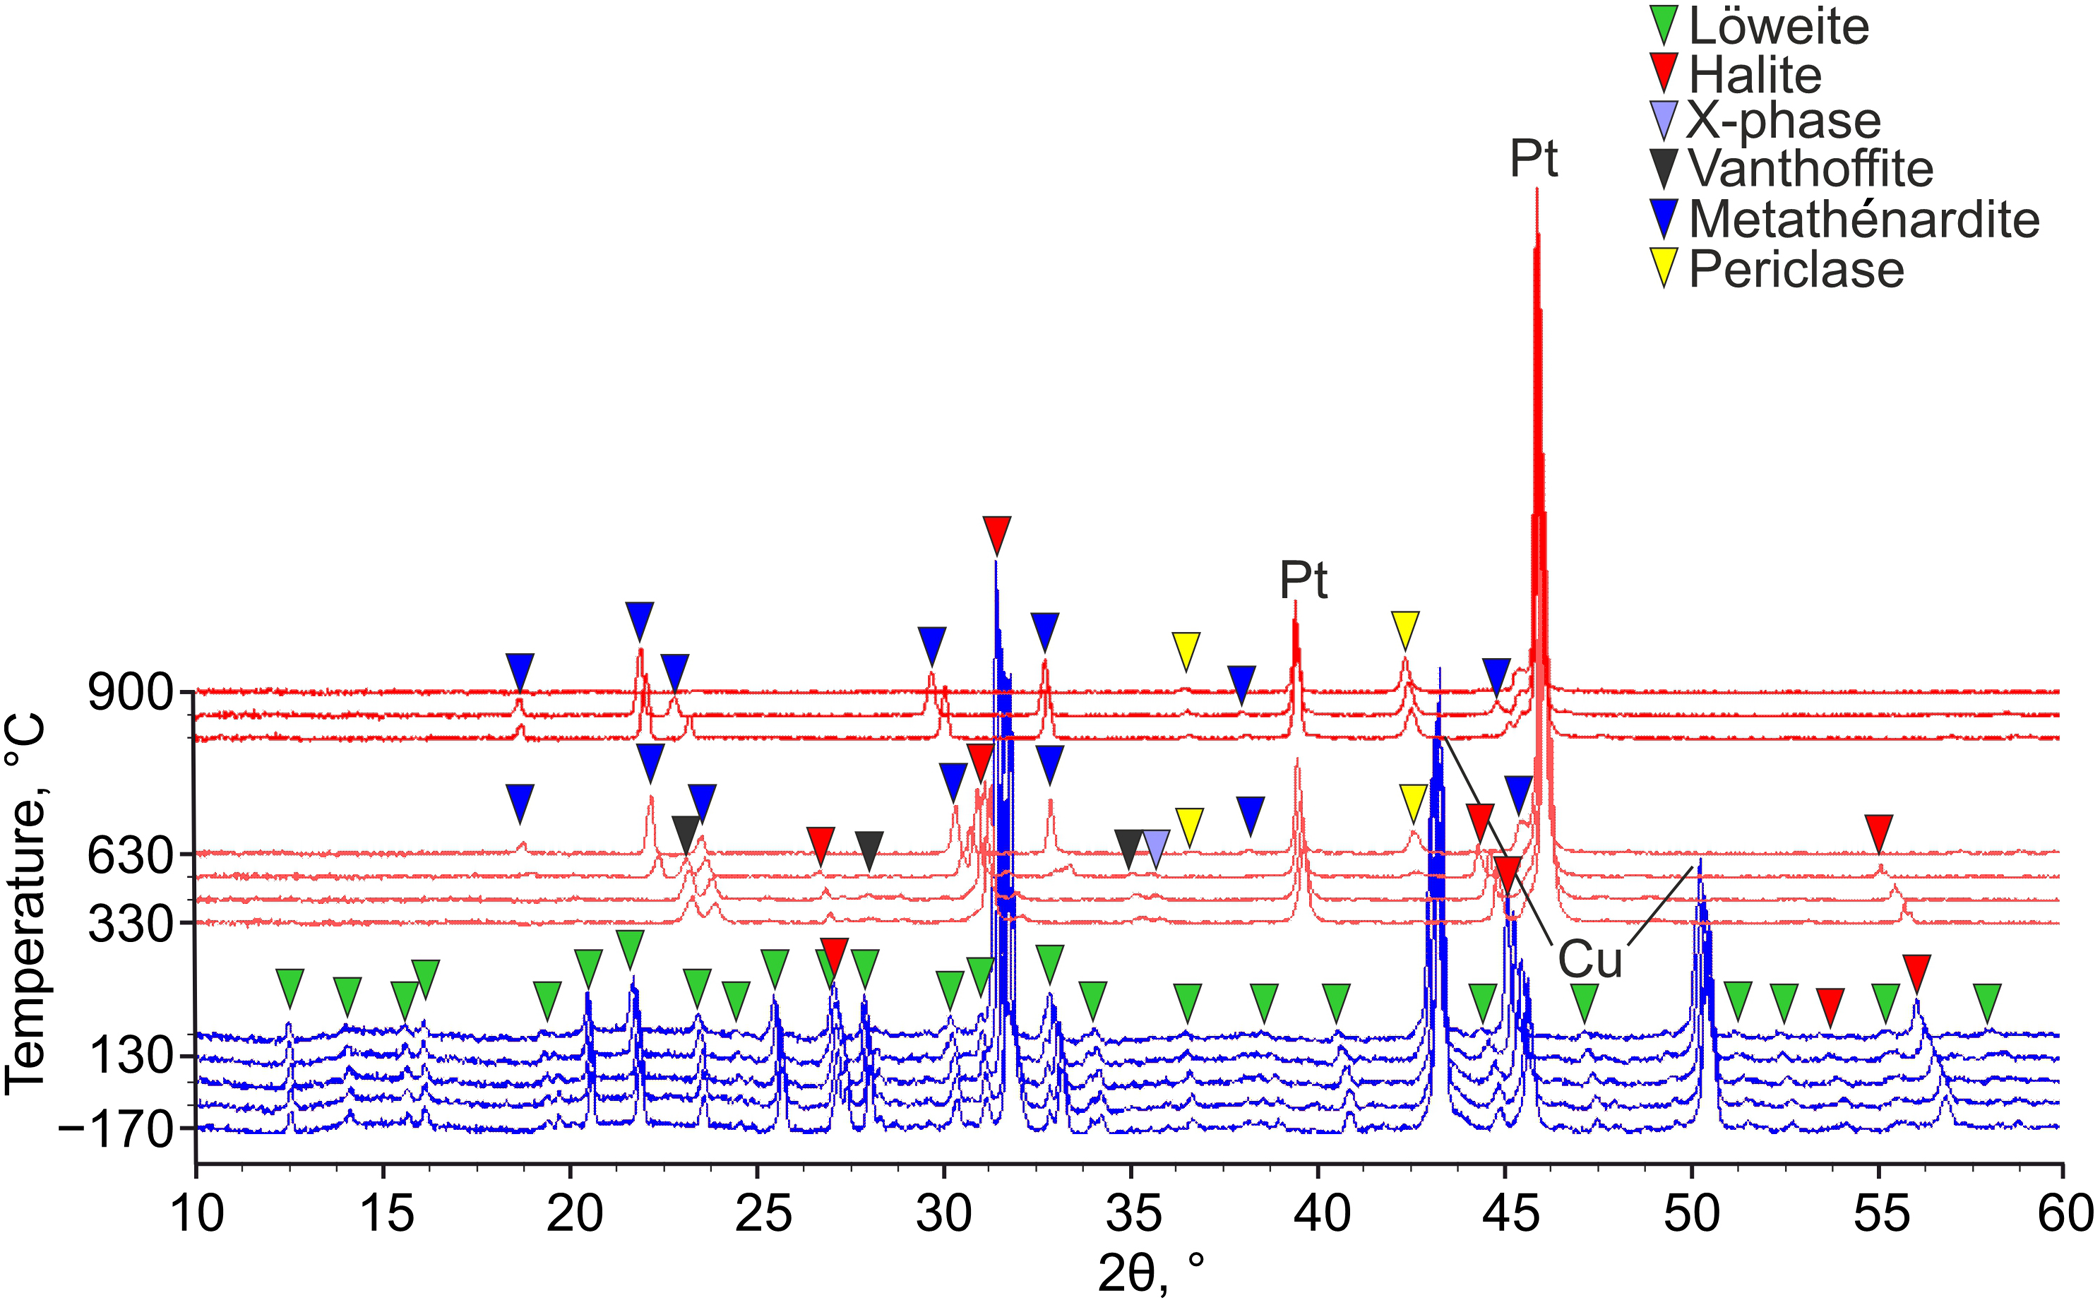
The initial polycrystalline sample contained ∼80 wt.% löweite because of the multiple halite intergrowth (Fig. 7). The sample is stable up to 220°C. With further temperature increases, starting from 220°C, the löweite content gradually decreases. The formation of broad, low-intensity peaks of löweite decomposition phases starts at 260°C. When heated to 280°C, the löweite peaks disappear completely. The X-ray diffraction pattern shows the formation of the following phases at 300°C: metathénardite Na2(SO4) (Naruse et al., Reference Naruse, Tanaka, Morikawa, Marumo and Mehrotra1987), vanthoffite Na6Mg(SO4)4 (Fischer and Hellner, Reference Fischer and Hellner1964), and up to 10 wt.% of a poorly identified ‘x-phase’. Small peaks of the latter can be described by glauberite, Na2Ca(SO4)2 (Cocco et al., Reference Cocco, Corazza and Sabelli1965). Note, both löweite and the associated halite are deficient in calcium. Trussov et al. (Reference Trussov, Male, Sanjuan, Orera and Slater2019) have recently reported a triclinic Na2Mg(SO4)2, although a magnesium analogue of glauberite is not yet known. Halite peaks are preserved up to a temperature of 540°C. Upon further heating, the content of ‘x-phase’ and glauberite-like phase decreases, and the content of metathénardite increases. At 570°C, weakly intense peaks of periclase start to form. As the temperature rises above 630°C, the X-ray diffraction patterns show exclusively the peaks of periclase MgO and metathénardite Na2(SO4). This pattern persists up to 870°C. And at 900°C, only the MgO peaks remain.
Evolution of the powder X-ray diffraction pattern of löweite upon heating.

Figure 7 Long description
Temperature, degrees Celsius A stacked line plot shows powder X-ray diffraction patterns collected at multiple temperatures. The x-axis label is 2 theta, degree, ranging from 10 to 60 with tick labels at 10, 15, 20, 25, 30, 35, 40, 45, 50, 55 and 60. The y-axis label is Temperature, degree Celsius, with tick labels at minus 170, 30, 330, 630 and 900. The line traces are ordered by temperature from minus 170 to 900. A legend lists phase markers: Löweite, Halite, X-phase, Vanthoffite, Metathénardite, Periclase. Inverted triangle markers are placed at many 2 theta positions along the stacked patterns. Text annotations label specific peaks: Pt is labeled near about 41 to 42 and again at a very tall peak near about 47 to 48. Cu is labeled near about 48 to 49. Across the full temperature series, prominent diffraction peaks occur near approximately 20 to 25, around 31 to 33, around 34 to 36, around 41 to 42 and a dominant peak near about 47 to 48, with additional peaks between about 50 and 58.
Concluding remarks
Single-crystal and powder X-ray diffraction studies show similar results regarding the stability of löweite up to ∼220°C. A polycrystalline löweite sample starts to decompose after this temperature, but individual peaks in the X-ray diffraction pattern indicate its presence in the mixture, along with decomposition products, up to 280°C. The fact that löweite remains stable under vacuum conditions of 600 Pa, which are similar to those on the surface of Mars, is another intriguing finding. Consequently, it appears very likely that löweite will be found on Mars’ surface. Phase transitions are not evident in the mineral until it reaches the decomposition temperature. Interestingly, the wide area of amorphization during dehydration that is observed in numerous hydrated sulfate minerals upon heating (e.g. Abdulina et al., Reference Abdulina, Borisov, Siidra, Ginga, Sanchez, Setzer and Holzheid2025; Borisov et al., Reference Borisov, Abdulina, Siidra, Ginga, Tsirlin, Holzheid, Zapfe, Yu and Setzer2025) is not present, and the peaks of löweite and of the decomposition phases are present throughout the entire range. As a consequence of fluctuations in temperature and relative humidity, hydrous sulfate minerals may undergo phase transitions and become X-ray amorphous (Chipera and Vaniman, Reference Chipera and Vaniman2007). According to Mills et al. (Reference Mills, Wilson, Dipple and Raudsepp2010), konyaite, for instance, decomposes after 22 months in air to produce a mixture of thénardite Na2SO4, hexahydrite MgSO4·6H2O, blödite Na2Mg(SO4)2·4H2O, and löweite. Previous studies of the thermal behaviour of blödite revealed that the mineral partially amorphizes at 95°C and transforms into löweite at 117°C (Balić-Žunić et al., Reference Balić-Žunić, Birkedal, Katerinopoulou and Comodi2016). It is worthwhile noting that the löweite sample was collected from the Tolbachik fumaroles in 2017 and stored in the air, but it did not undergo decomposition or transformation. Hence, of the known hydrated sodium and magnesium sulfates, löweite is the most stable despite the considerable hydration. In our research, we have observed the following transformation sequence for löweite upon heating: löweite → metathénardite + vanthoffite + glauberite-like phase → metathénardite + periclase.
The thermal expansion of löweite demonstrates two distinct patterns in two temperature ranges. Within the temperature range of –173 to –93°C, the structure virtually has no expansion. Following this, löweite rapidly expands, exhibiting a highly anisotropic behaviour. Shear deformations of the soft S–O–Mg and in particular S–O–Na hinges control the thermal expansion. The thermal and air stability of löweite is partially attributed to the hinge system in the structure, which provides flexibility and adaptability of löweite to changes in physicochemical environments.
Supplementary material
The supplementary material for this article can be found at https://doi.org/10.1180/mgm.2026.10192.
Acknowledgements
We acknowledge three anonymous reviewers for their comments that improved the manuscript. This work was financially supported by the Russian Science Foundation through the grant 25-17-00157. Technical support (project# 118201839) by the X-Ray Diffraction Resource Center of Saint-Petersburg State University is gratefully acknowledged.
Competing interests
The authors declare none.