

1. Introduction
The issue of gender discrimination remains a rather persistent issue across industries. The movie sector is no exception. According to the World Economic ForumFootnote 1 , “Only 17% of nominees at the Oscars since 1929 have been women – and less than 2% of nominees were women of colour.” They advance their argument further by highlighting that “Gender inequality at the Academy Awards is indicative of trends in the wider film industry, and society as a whole.” This already highlights how gender inequalities are reflected in the movie industry.
Motivated by this type of anecdotal evidence we want to study how gender composition in leading roles reflects these stereotypes. Even though an increasing number of women appears in leading roles over the last years, it remains unclear how this affects the way audiences and experts evaluate movies. A starting point is the power of audience ratings and awards in shaping a film’s success. Given the high stakes associated with it, understanding whether gender bias influences these evaluations is crucial for the industry, content creators, and society more broadly.
In this paper, we explore how the gender composition of leading actors in movies affects two key performance indicators: audience ratings and professional awards. We focus on the movie industry as it provides a unique setting to study this. The reason is that both audience reactions and expert evaluations are publicly observable and measurable, unlike most other industries. Therefore, any biases associated with gender are more pronounced in such a sector. Our goal is to uncover whether the gender of lead actors’ biases viewers’ and critics’ assessments and, if so, how this bias plays out.
To implement our analysis, we resort to a rich dataset combining audience ratings and information on awards received by movies from IMDb. Our analysis focuses on how these outcomes change depending on the number of female leading actors in a film. We carefully track whether changes in audience ratings and awards follow a linear pattern or show more complex relationships as the number of female leads increases. This approach allows us to capture hidden patterns that may reveal deeper biases.
Specifically, in our benchmark analysis, we use data from over 5,000 movies globally produced between 1998 and 2008. Relying on information provided by the IMDb website, we build detailed measures of female representation in leading roles. Moreover, we account for more standard determinants as we control for key factors that might affect movie success, such as budget, genre, production company, etc. Methodologically, we use robust econometric techniques, including fixed effects and selection models, to correct for potential biases arising from differences in who chooses to watch and rate different types of movies.
Our main results show a striking divergence: as female representation increases, audience ratings decline, while the likelihood of receiving awards rises. Interestingly, this pattern is non-linear. Our findings indicated that ratings drop steeply when women take up the first two leading roles and stabilize when women hold all three. On the other hand, awards peak when two women are in leading roles. This divergence suggests that audience members, particularly men, as we uncover later in our study, respond negatively to greater female presence, while expert committees tend to reward these films.
This contrast hints to the fact that movies with more women in visible roles tend to drive away male spectators. At the same time, those who still engage with such films rate them more harshly. This behavior seems to be less related to the quality of the movies and more to the bias against seeing women in leading positions.
This intuition is further reinforced by the fact that awards committees, made up of professionals and critics, seem to acknowledge the artistic or social value of these movies. Their evaluations are less affected by the gender of the actors and more focused on the quality of the work itself. We interpret this difference as the persistence of cultural stereotypes and resistance to changing norms among the broader public.
Overall, this divergence reflects a deeper societal process and transformation. Progress in representation is endorsed in professional circles at earlier stage, whereas wider audiences may still resist such changes. The implications for the industry are profound. Gender biases in public ratings can undermine the success of female-led projects, even when these films are objectively recognized as high-quality by experts. This has serious consequences for how movies with female leads are perceived, promoted, and financed. Acknowledging these biases calls for more awareness and even possible interventions to prevent unfair penalization of female-led films.
To ensure our results are not driven by specific data limitations, we run several robustness checks. These include focusing on different types of films, alternative measures of audience composition, and accounting for possible sample selection biases. All these tests confirm the consistency of our main findings.
We further explore the mechanisms behind the observed bias. We show that as the number of females leads increases, fewer men watch and rate these movies. Moreover, those who do watch tend to rate them negatively, even after controlling for movie quality using awards data. We further explore how the visibility of women in different production roles – such as directors and producers – affects evaluations. Interestingly, we show that when female representation is most visible to the audience, the bias is strongest. It tends to diminish when that representation is less visible, such as in the case of a female producer.
The rest of the paper is structured as follows. Section 2 reviews the related literature. Section 3 describes our data and key variables. Section 4 presents our empirical approach and main results and explores robustness checks. Section 5 concludes.
2. Related literature
Our paper contributes to the literature on consumers’ discriminatory attitudes focusing on gender biases and relates to research examining how gender diversity influences the success of teamwork outcomes when outcomes can be perceived as gendered.
Prior studies in economics and management have explored consumer biases, particularly how gender stereotypes shape buyer decisions. An example of these biases is captured in the so-called “gendered brands.” Spielmann et al. (Reference Spielmann, Dobscha and Lowrey2021) explore how gender stereotypes affect consumer product preferences when products are explicitly associated with a male or female identity. Through a series of experiments, the authors found a clear asymmetric bias: male consumers tend to avoid products that have a female-oriented brand name or female mascot, whereas female consumers do not similarly avoid products with a masculine branding. The authors attribute men’s aversion to “feminine” brands to a form of implicit bias linked to precarious masculinity – men may subconsciously avoid products that signal female associations in order to maintain their male identity. In a similar vein, Fan-Osuala (Reference Fan-Osuala2023) found that among 216 participants (half men, half women), product reviews authored by women were consistently perceived as less helpful and less influential in shaping purchasing decisions than identical reviews authored by men.
Kricheli-Katz and Regev (Reference Kricheli-Katz and Regev2016) provide additional evidence of consumer-driven discrimination against female sellers in online product markets. Items sold by women in eBay consistently fetched lower final prices than identical items sold by men, even when seller quality and listing details are comparable. Notably, eBay does not explicitly reveal seller gender, but buyers seemingly infer gender from clues in usernames, product descriptions, or other information and then act on a bias (Topaz et al., Reference Topaz, Higdon, Epps-Darling, Siau, Kerkhoff, Mendiratta and Young2022). In a related vein, Greenwood et al. (Reference Greenwood, Adjerid, Angst and Meikle2022) use controlled online experiments (factorial vignettes) to examine whether consumers (riders) exhibit bias when rating the performance of ride-sharing drivers of different genders. Participants were shown scenarios of ride-share experiences with drivers, varying the driver’s gender and the trip quality. When a ride experience was poor (low quality), consumers punished female drivers more harshly in their ratings than male drivers for the exact same subpar performance. In other words, a service mistake by a woman driver led to a bigger drop in customer satisfaction ratings than an identical mistake by a man.
Turning specifically to the movie industry, research integrates insights from marketing, labor economics, and cultural studies. The literature suggests that a movie’s success is determined not only by how it is made and promoted (Kang & Peng, Reference Kang and Peng2024), but also what it represents and whom it speaks to in societies around the world. Economic factors like production investment, budget, star-driven marketing, and information signals (reviews and social media) clearly shape revenue outcomes, as do social and cultural factors like representation and thematic appeal (McKenzie, Reference McKenzie2023, Michalopoulos & Rauh, Reference Michalopoulos and Rauh2024).
Representation of audiences on screen has economic payoffs, supporting the case for diversity not just as a social goal but as a profitability strategy (Litina & Zanaj, Reference Litina and Zanaj2026; Pattnaik et al., Reference Pattnaik, Nanda and Lu2025). More diverse casting expands a film’s appeal to global audiences and may signal content that resonates across cultural groups. These findings align with industry reports noting that films with diverse casts are “more likely to succeed at the box office” (UCLA, 2015).Footnote 2 Movies with predominantly non-white casts have higher average box-office revenue (and lower revenue variance) than similar, white-cast films, conditional on being produced (Zhong et al., Reference Zhong, Crema and Paserman2024).
Regarding gender discrimination within movie audiences, previous studies provide contrasting results. Some studies show that female lead actors receive more polarized audience ratings and slightly lower average scores than those led by men (Stroube & Waguespack, Reference Stroube and Waguespack2024). Others (Pattnaik et al., Reference Pattnaik, Nanda and Lu2025) point to a positive effect. In Stroube and Waguespack (Reference Stroube and Waguespack2024), male viewers tend to rate female-led films significantly lower on average than female viewers do, contributing to a negative skew in the ratings distribution. Female-led films released by major studios earn less box office revenue (a “penalty”) compared to male-led films, whereas independent studios do not experience this penalty and even see relatively better box office outcomes for female-led titles. This suggests that broad audiences exhibit a bias against female-led movies, while niche or independent audiences may be more accepting. Pattnaik et al. (Reference Pattnaik, Nanda and Lu2025) examine the relationship between gender diversity in Hollywood movies and international box office success, highlighting genre and international co-production moderators. They find gender diversity is associated with better movie outcomes. Movies with a strong female presence receive disproportionately more extremely low scores in unverified user reviews pulling down their average rating (Aguiar, Reference Aguiar2024). A change in the Rotten Tomatoes platform’s rating system allowed the author to identify the source of the bias: it appears that a small subset of online reviewers (“bad apples”) was driving the negative bias against female-led movies, rather than all viewers generally. The findings highlight that crowd reviews can introduce greater gender bias than expert reviews, and platform design or moderation can help mitigate this bias.
Our paper differs from prior studies in several important ways. While previous research, such as Aguiar (Reference Aguiar2024) and Stroube and Waguespack (Reference Stroube and Waguespack2024), documents gender biases in crowd ratings and highlights disparities between audience and critics, they mostly focus on average effects or variance without exploring non-linearities. In our research we uncover the non-linear dynamics between female representation and audience ratings and awards. Unlike Pattnaik et al. (Reference Pattnaik, Nanda and Lu2025), who examine diversity effects on international box office performance, our study focuses on domestic audience reactions and the biases within specific viewer groups, particularly male viewers. Moreover, our analysis uniquely emphasizes the role of gender visibility. We do so by distinguishing biases not only in leading roles but also across production roles like directors and producers. This aspect of visibility is instrumental when examining the movie industry and is an aspect that is overlooked by earlier studies. Methodologically, we advance the study of the research topic by applying a Heckman-like selection correction to rigorously account for audience composition bias. This ensures that the observed rating patterns are not merely driven by who chooses to watch the films. The interplay of these elements allows us to gain insights on audience composition, visibility-driven gender bias, and non-linear evaluation-of-movies patterns.
3. Data and variables
3.1. Data and main variables
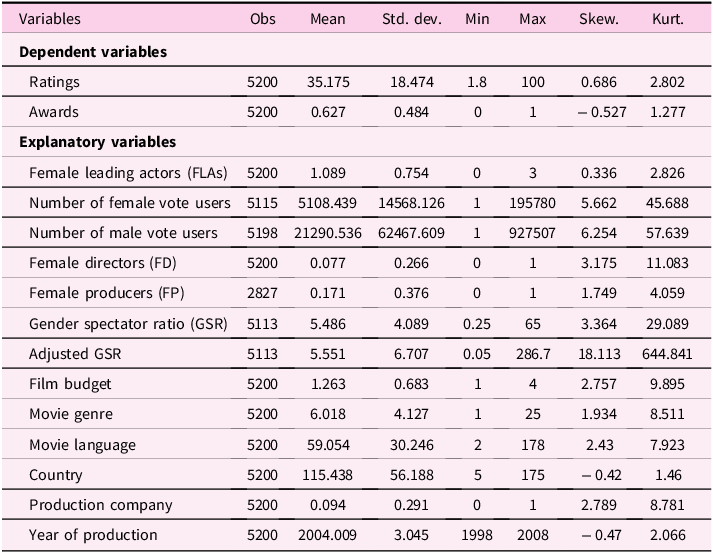
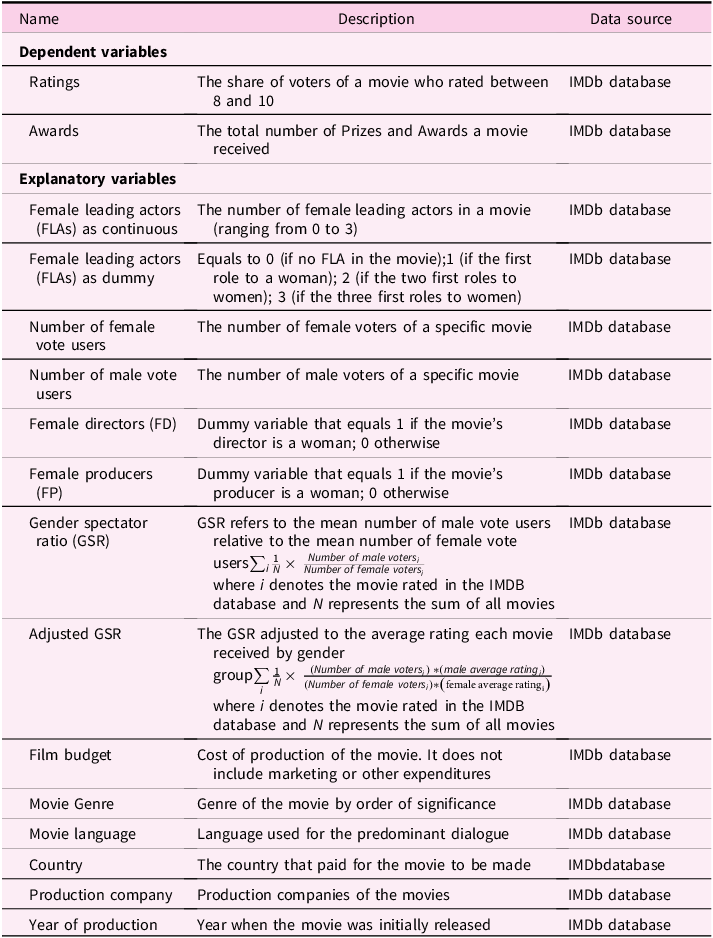
We obtain our data from two main sources: hand-collected data from the publicly available IMDb database. The largest available sample for which we have information along our main variables amounts to 77,316 movies and covers 1998 to 2008 (see also Litina & Zanaj, Reference Litina and Zanaj2026). However, for most movies we lack information about budgets and important controls in the country of origin for the movie members. Thus, for more restrictive specifications, the number of observations falls approximately to 5,000. Table A1 reports summary statistics and Table A2 provides all the technical definitions of the variables in our empirical analysis.
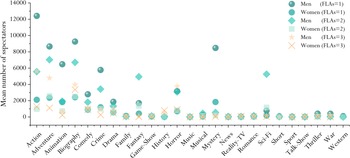
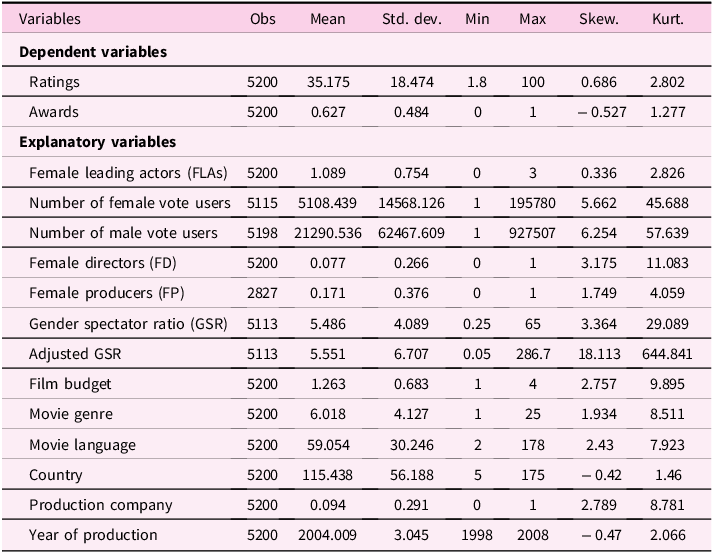
Based on Table A1, the dependent variables show that the average audience rating is 35.2 (on a 0–100 scale) with considerable variation, while about 63% of the movies received awards. Regarding key explanatory variables, the average number of female leading actors (FLAs) is around 1.1, indicating a moderate presence of women in lead roles across the sample. The number of male vote users is much higher than female vote users, showing a clear gender imbalance in the audience composition. This is shown in Figure 1, which presents the mean number of female and male spectators by movie genre and the representation of female leading actors (FLAs) in the IMDb sample. It can be observed that male spectators dominate in most cases, particularly in genres that attract larger audiences (i.e., action, adventure, biography, and mystery). Notably, in these genres, men tend to prefer movies featuring a single female leading actor. Only in the horror genre do we see male viewers watching movies with three FLAs in the cast. However, the number of such cases remains relatively low compared to other genres. The gender spectator ratio (GSR) indicates that, on average, for every female voter, there are about 5.5 male voters, and this imbalance becomes even more extreme when adjusted for movie-specific selection (adjusted GSR). Representation of female directors (7.7%) and producers (17%) remains low, showing limited gender diversity behind the camera. Control variables like budget, genre, language, and production year are also included, with wide variation across the sample.
The mean number of male and female spectators by number of female leading actors (FLAs) and movie genre.
Note: Estimates were conducted by the authors.
Source: IMDb.

We measure movie performance using two different types of indicators, first, the viewer ratings on IMDb (Ratings), and second, an indicator of movies having received at least one Award (Award). These are both measures that are meant to capture performance, yet they capture different aspects about a movie that speak to spectator and/or experts’ views. The IMDb ratings measure the overall appeal of the film to the public. We mainly use the number of IMDb users that give a rating of 8 out of 10 or higher (scaled by 1,000 for expositional brevity), as 8 is the threshold distinguishing very appealing movies from the rest.Footnote 3 In turn, the Awards, is a continuous variable that the number of awards a movie has received.
Our main independent variable is female representation among lead actors. We operationalize female presence using three alternative definitions. The first and most restrictive definition considers movies in which the primary lead role is portrayed by a female actor. The second definition expands this criterion by including movies where both of the top two billed actors are female. The third and least restrictive definition includes movies in which the top three billed cast members are all female. Hence, we quantitatively assess the extent of female representation according to these varying degrees of stringency.
3.2. Control variables
We include a large set of movie-related controls such as movie’s budget, genre, language, production company, the year of production, female directors and female producers (also used as the main independent variables), the number of female vote users and the number of male vote users, the GSR, and the adjusted GSR. All are important aspects that can have a profound effect on a movie’s success, whether measured by ratings or awards. We also introduce dummies for the major production companies, as they are more likely to deliver a successful movie due to better networking.Footnote 4
4. Empirical analysis and estimation results
Our benchmark empirical specification is the following: $Movie\;performanc{e_{ict}} = {a_0} + {a_1}FL{A_i} + {a_2}FLA_i^2 + {a_3}{{P}'_i} + {a_5}{C_c} + {a_6}{T_t} + {e_{ict}}$
In equation (1), movie performance is either ratings or awards of movie i produced in country c and distributed in year t. $FL{A_i}$
is the number of female leading actors in a movie and
$FL{A_i}$
is the number of female leading actors in a movie and $FLA_i^2$
is the square of that number.
$FLA_i^2$
is the square of that number. ${P'}$
is the vector of controls that are associated with the production function of the movie and its qualitative characteristics. C
c
and T
t
are country and year fixed effects controlling for time-invariant unobservable characteristics at the country level and common trends across countries, respectively. Finally, e
ict
is the error term. We estimate a fixed-effects model using OLS when the movie performance is measured by ratings and a logit one when the awards is our dependent variable, adapting the variables included in equation (1) as needed.
${P'}$
is the vector of controls that are associated with the production function of the movie and its qualitative characteristics. C
c
and T
t
are country and year fixed effects controlling for time-invariant unobservable characteristics at the country level and common trends across countries, respectively. Finally, e
ict
is the error term. We estimate a fixed-effects model using OLS when the movie performance is measured by ratings and a logit one when the awards is our dependent variable, adapting the variables included in equation (1) as needed.
4.1. Main results
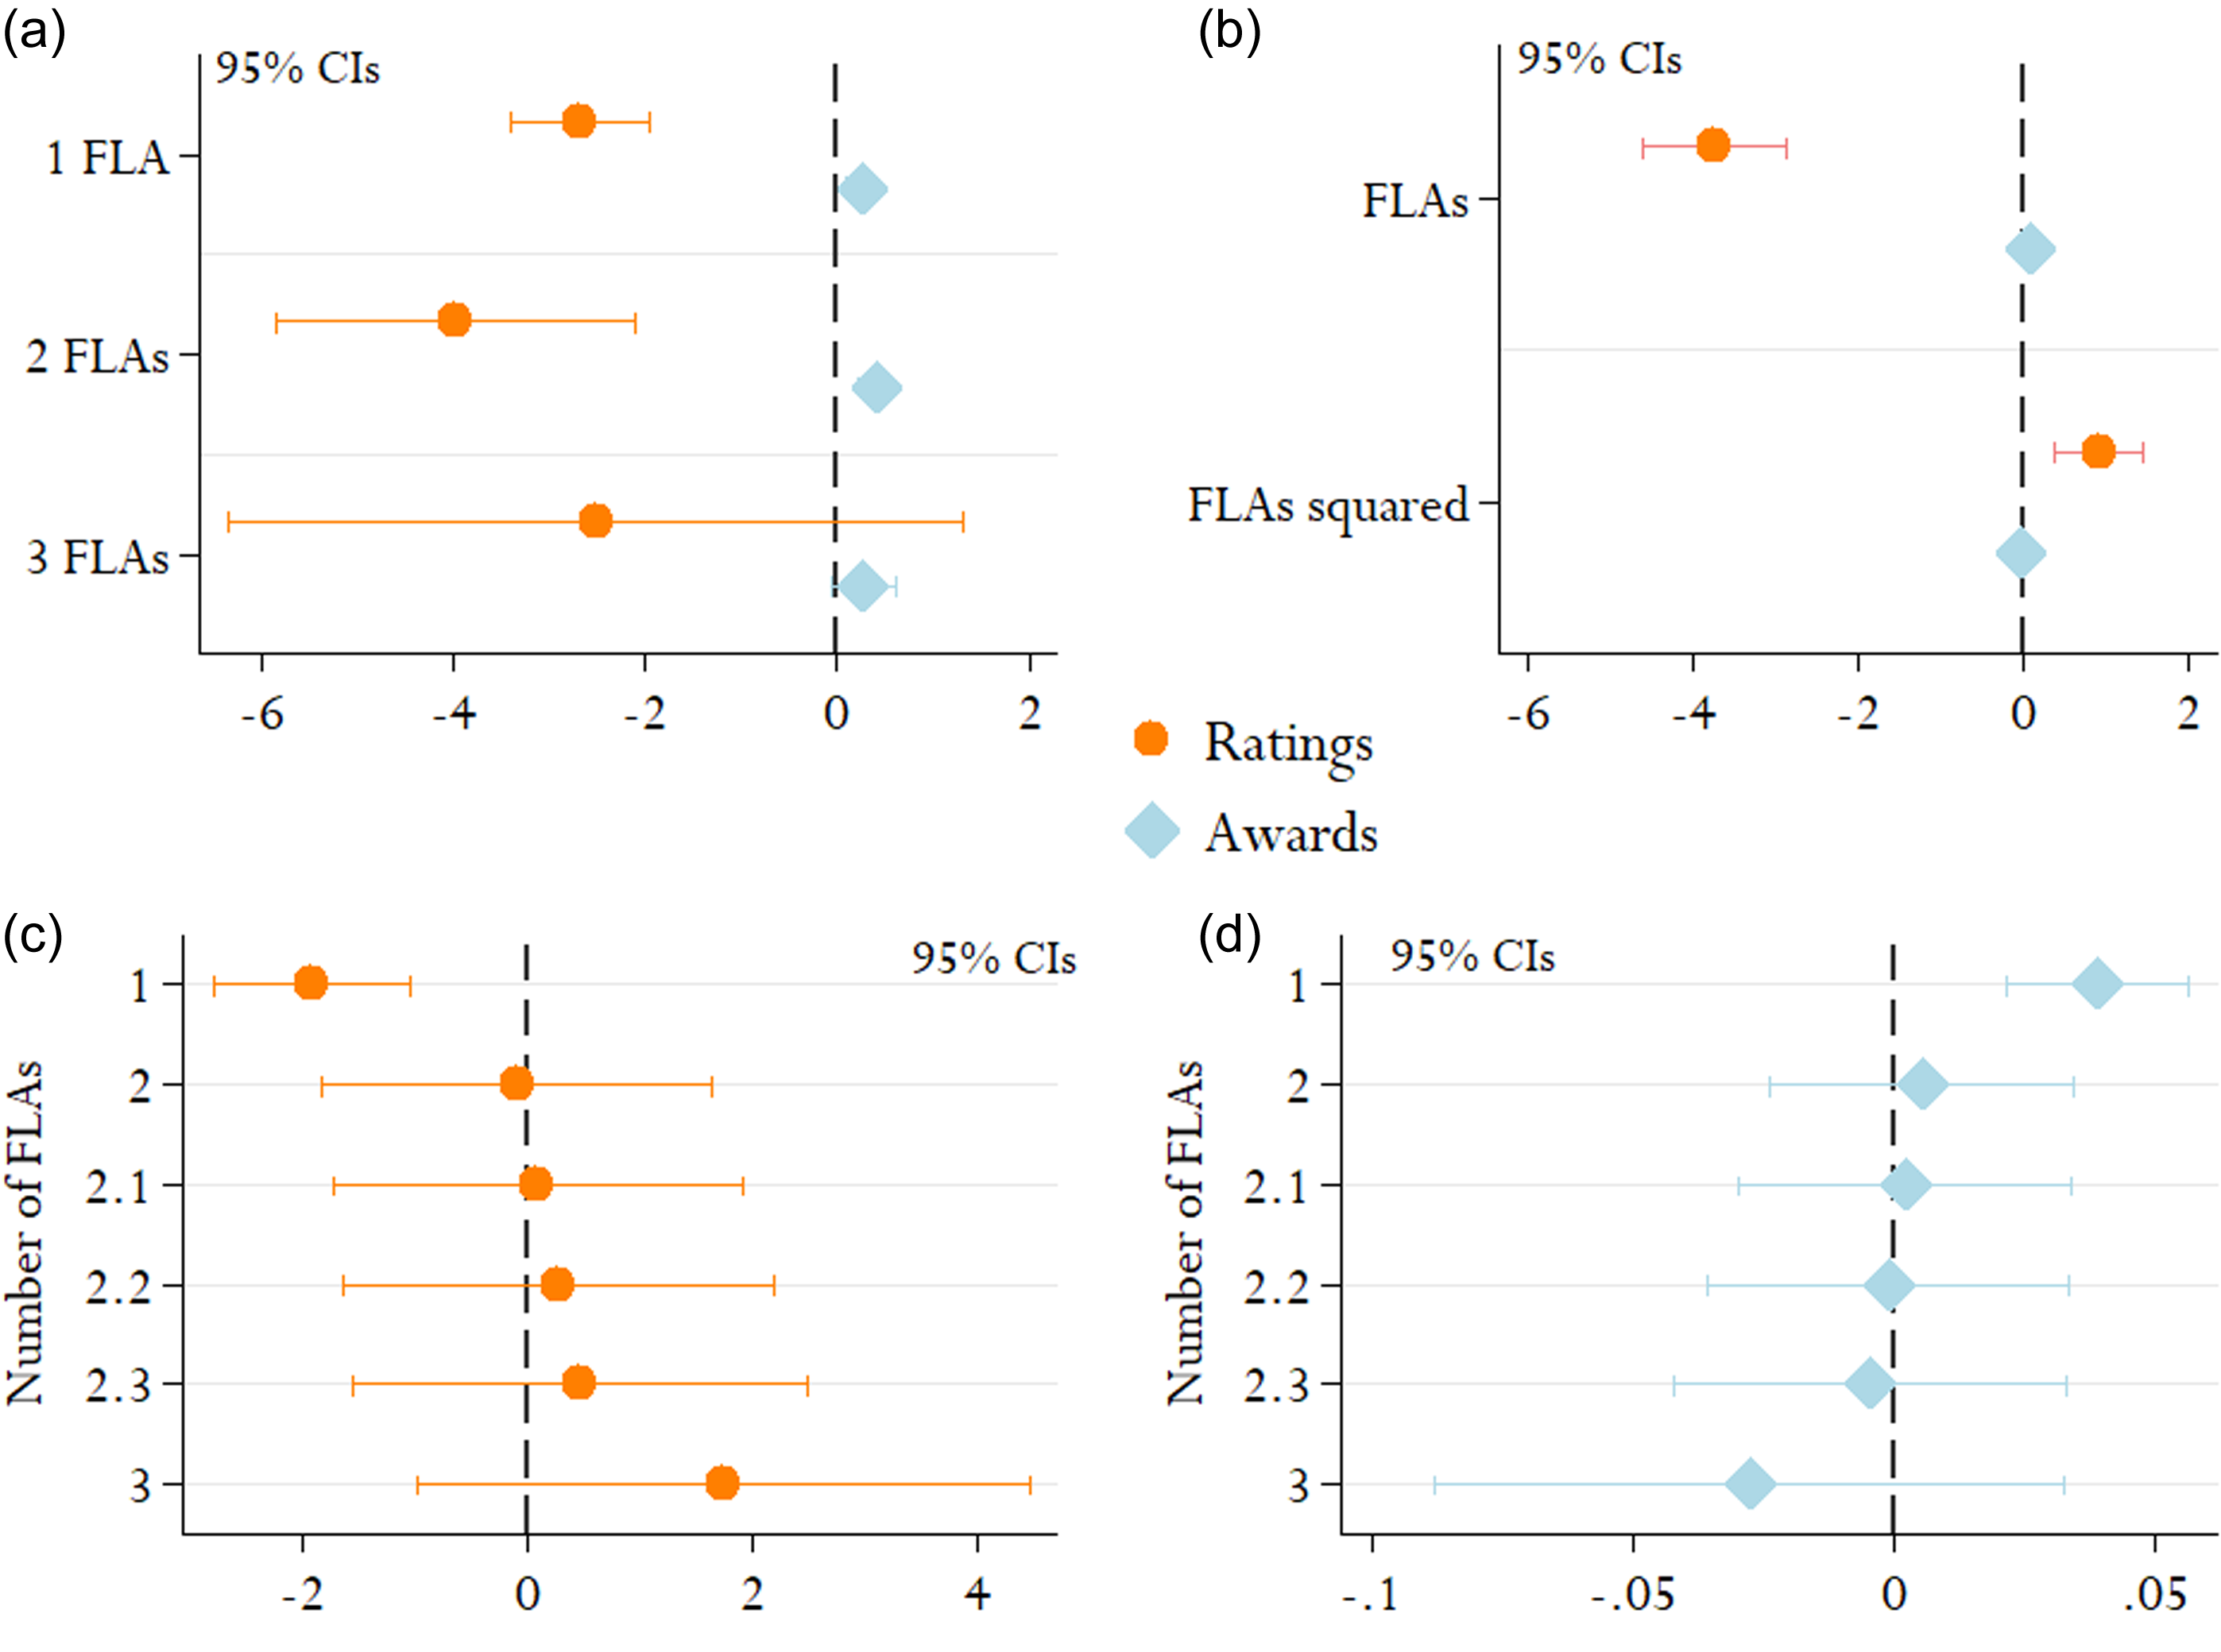
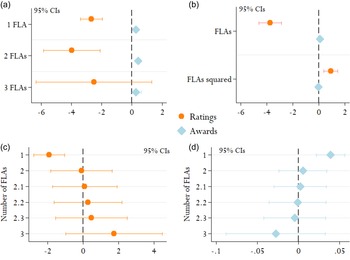
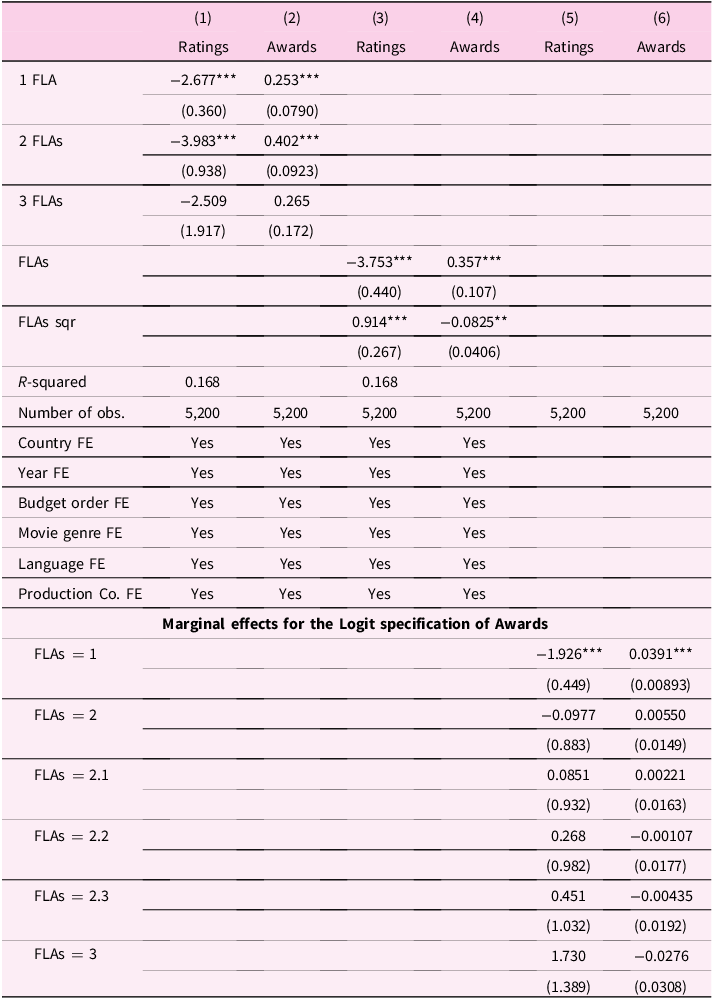
Figure 2a and Table 1 illustrate the estimated effects of the number of female leading actors (FLAs) on movie ratings and awards. We consider three distinct scenarios: films in which only the first leading role is female (1 FLA), films where the first two leading roles are female (2 FLAs), and films with women occupying all three leading roles (3 FLAs). The baseline for comparison consists of movies with male actors in all three leading roles (MLAs). Relative to MLAs movies, assigning the first leading role to a woman (1 FLA) significantly reduces ratings at the 1% significance level. This negative effect intensifies when women occupy the first two leading roles (2 FLAs) but diminishes and becomes statistically insignificant when all three leads are female (3 FLAs), revealing a possibly convex (inverse J-shaped) relationship. Conversely, the effect on awards displays a completely reversed (concave) pattern. Specifically, having two women in leading roles significantly increases the likelihood of winning awards at the 1% significance level, nearly doubling the probability from .253 to .401. However, this positive effect substantially diminishes (.265) and loses statistical significance once all three leading roles are female.
The effect of the number of FLAs and the respective marginal effects on ratings and awards.
Note: FLAs denotes the number of female leading actors in a movie. Panels (a) and (b) depict the estimated coefficients of FLAs for predicting movie ratings (orange circles) and awards (blue diamonds), respectively, based on regression specifications that include controls and fixed effects as detailed in Table 1. Panels (c) and (d) show the corresponding marginal effects of FLAs on movie ratings and awards.
Source: IMDb database.
The effect of the number of FLAs and the respective marginal effects on ratings and awards

The table reports coefficient estimates and standard errors (in parentheses) from the estimation of equation (1). The dependent variable is Ratings or Awards. All variables are defined in Table A2. Estimation method for Ratings is OLS FE and for Awards is Logit. FLAs denotes the number of female leading actors in a movie. The source of the data is IMDb database. The table also reports the number of observations, the Adjusted R-squared, and the type of fixed effects included in each specification. The lower part of the table reports the Marginal Effects. The *** and ** marks denote statistical significance at the 1% and 5% levels, respectively.
Thus, while increased female representation initially harms audience ratings, it simultaneously attracts expert recognition, highlighting a divergence in how spectators and award committees evaluate movies with female protagonists.
To corroborate non-linearity, we treat the number of FLAs as a continuous variable to precisely estimate the potential turning points in ratings and awards. A necessary condition for valid non-linearity is that these turning points fall within the FLAs range (0 to 3), accompanied by statistically significant coefficients that exhibit appropriate sign changes. Figure 2b and Table 1 (columns 3 and 4) present these estimates, confirming non-linearity for both ratings and awards. The coefficients are statistically significant (at least at the 5% level), and their signs align with previously identified patterns (Figure 2a). The turning points occur at 2.05 FLAs for ratings and 2.16 FLAs for awards, both statistically significant at the 1% level.
Interpreting non-linear estimates, however, requires caution, as marginal effects vary across the FLAs range. This implies there is no single effect of the independent variable (number of FLAs); rather, marginal effects must be estimated at different FLAs values. These marginal effects, depicted in Panels (c) and (d), gradually change signs as FLAs increase, consistent with the non-linear patterns observed. Crucially, these marginal effects correspond closely to the estimated turning points. For instance, Panel (c) indicates a shift from negative to positive marginal effects between 2 and 2.1 FLAs, aligning with the 2.05 turning point identified for ratings. A similar alignment occurs for awards. Apart from the initial marginal effects (1 FLA), subsequent effects lack statistical significance. However, this insignificance likely reflects the substantial increase in standard errors as the FLAs count rises – specifically, from 0.44 at 1 FLA (38,532 observations) to 0.88 at 2 FLAs (19,028 observations) and 1.38 at 3 FLAs (3,575 observations).Footnote 5 Thus, the reduced statistical significance of marginal effects at higher FLAs should not invalidate the observed non-linearity.
Taken all together, this analysis has revealed two key insights up to this point. First, the recorded divergence between spectators and experts on the role of women in the movie performance, and second, that the number of female leading actresses and corresponding movie’s ratings exhibits an inverse J-shaped curve. Why do spectators’ and experts’ evaluations diverge so strikingly? Experts are experts. Whatever biases may manifest in their award ratings, they are still considered more objective (or at least less subjective) than general spectators. The stark contrast observed between the two patterns clearly demonstrates this point. Thus, we do not investigate further experts’ evaluation. The latter has been important just to reflect on spectators’ behavior, in which we solely focus in the rest of the paper. In this respect, we also ask why spectators rate movies with more FLAs lower and why this rating rebounds beyond a certain point of FLAs (convexity). Having established the latter and crucially keeping also in mind the aforementioned divergence, we set the hypothesis that spectators exhibit a gender bias against women, which we call the gender discrimination hypothesis.
4.2. Sample selection: who sees movies with female leading stars?
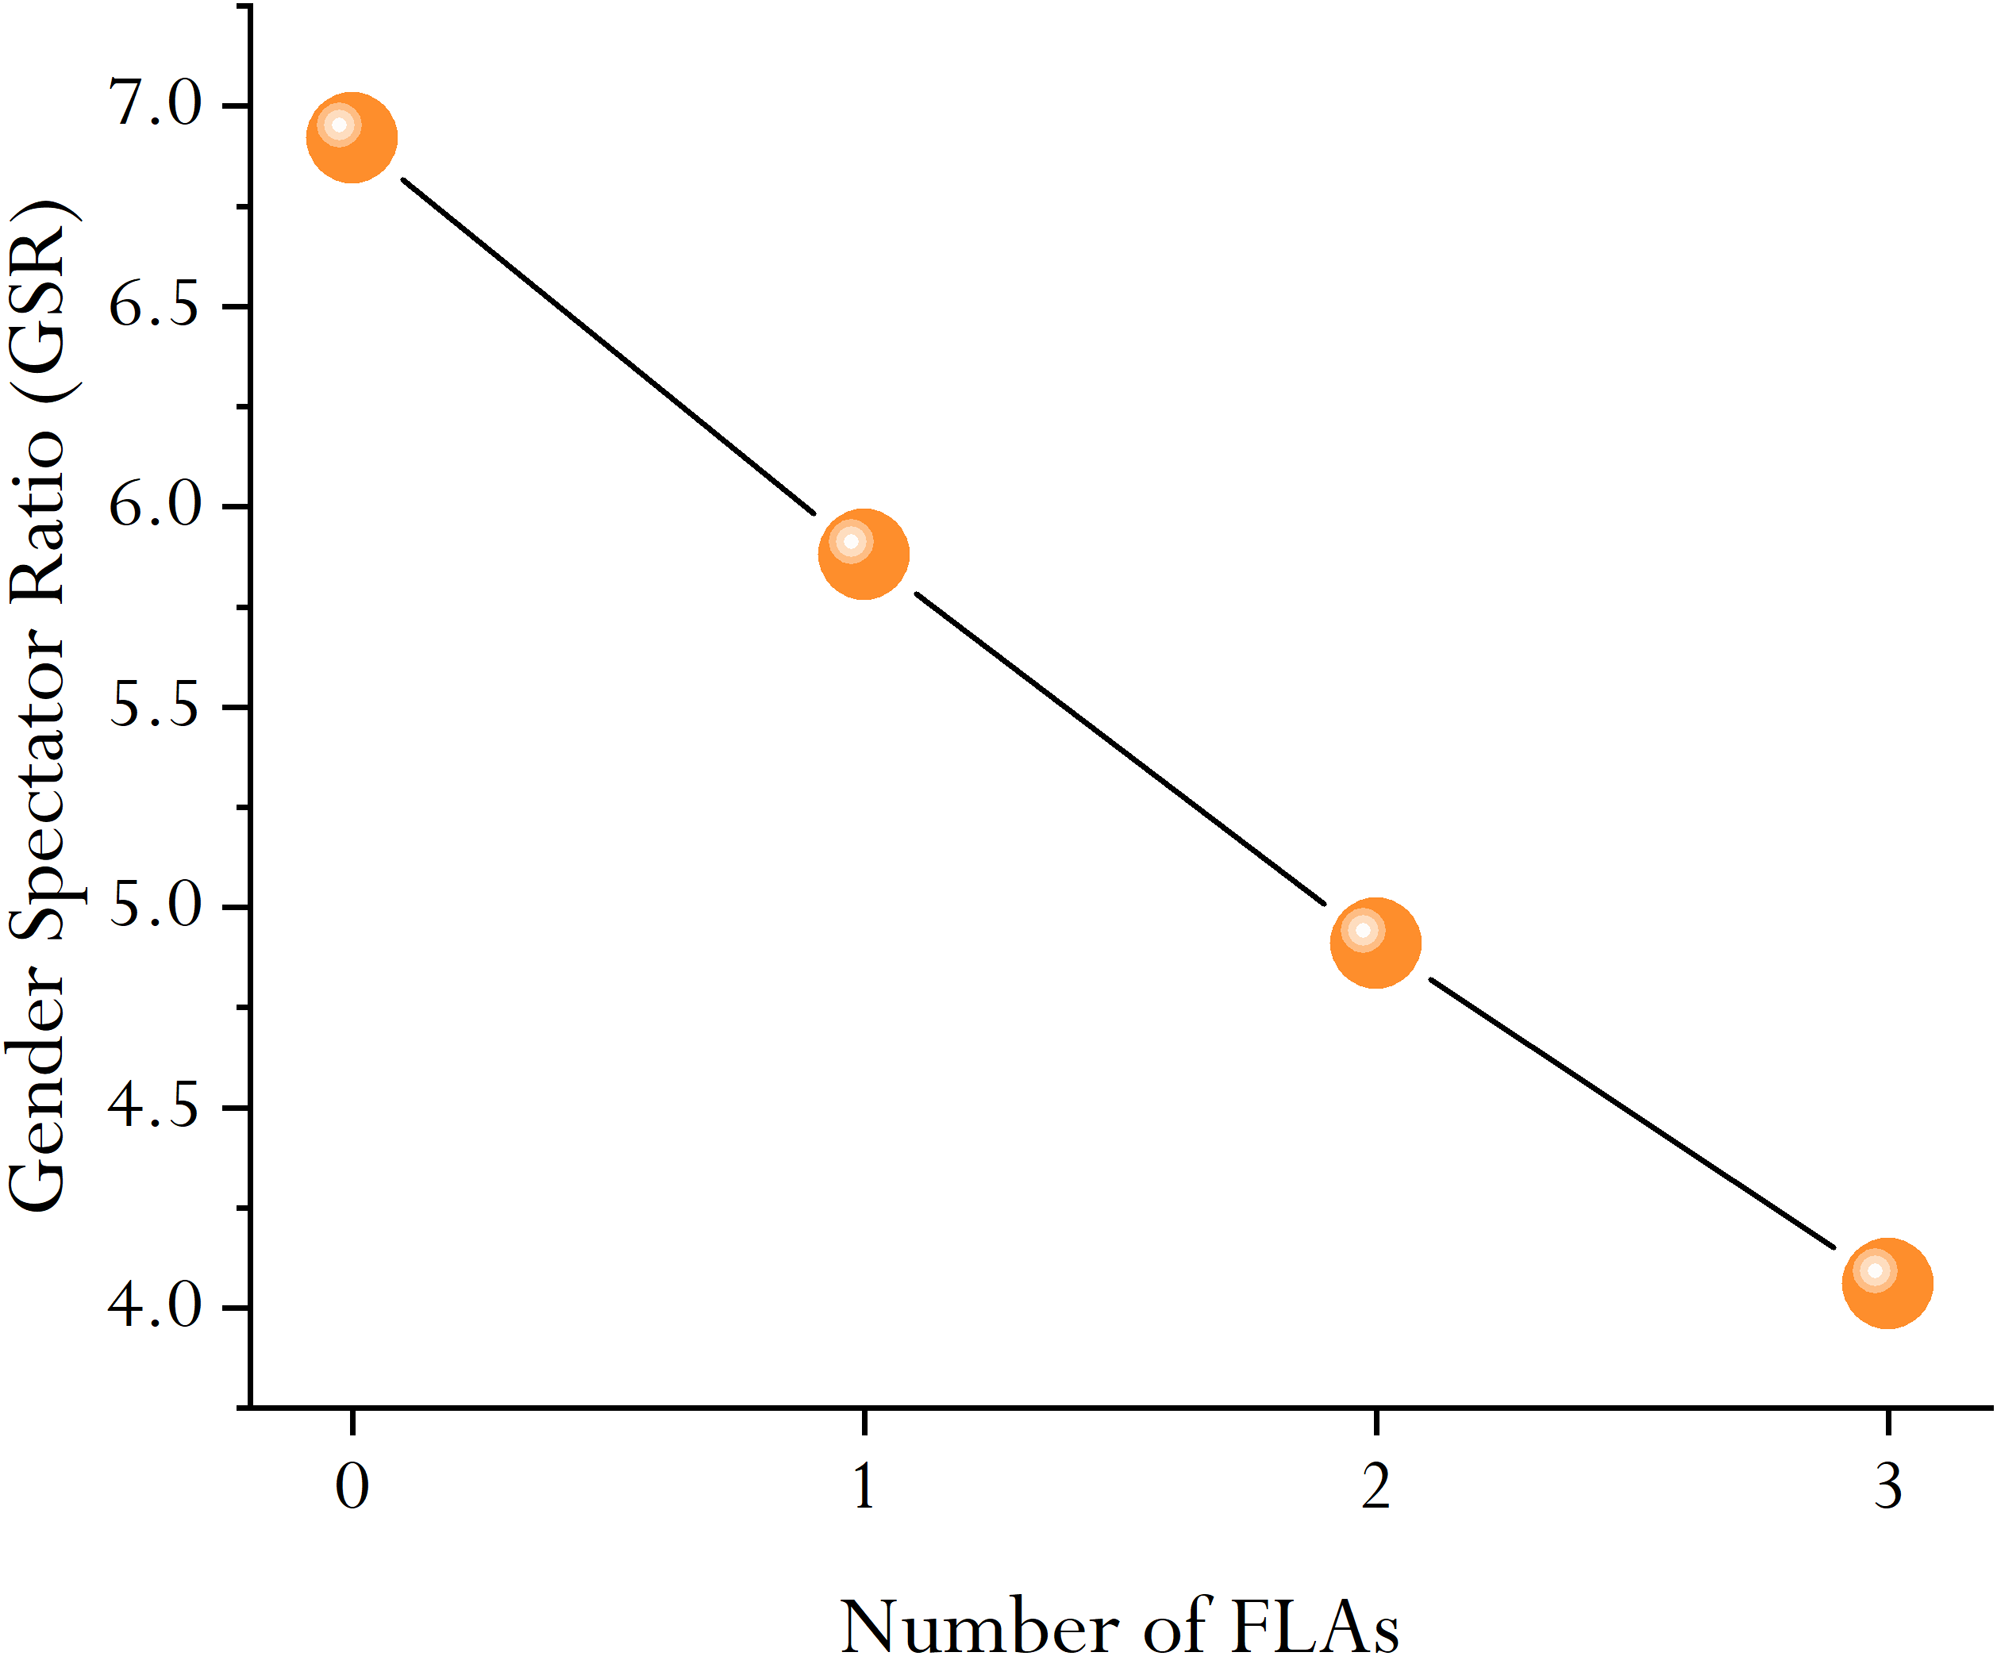
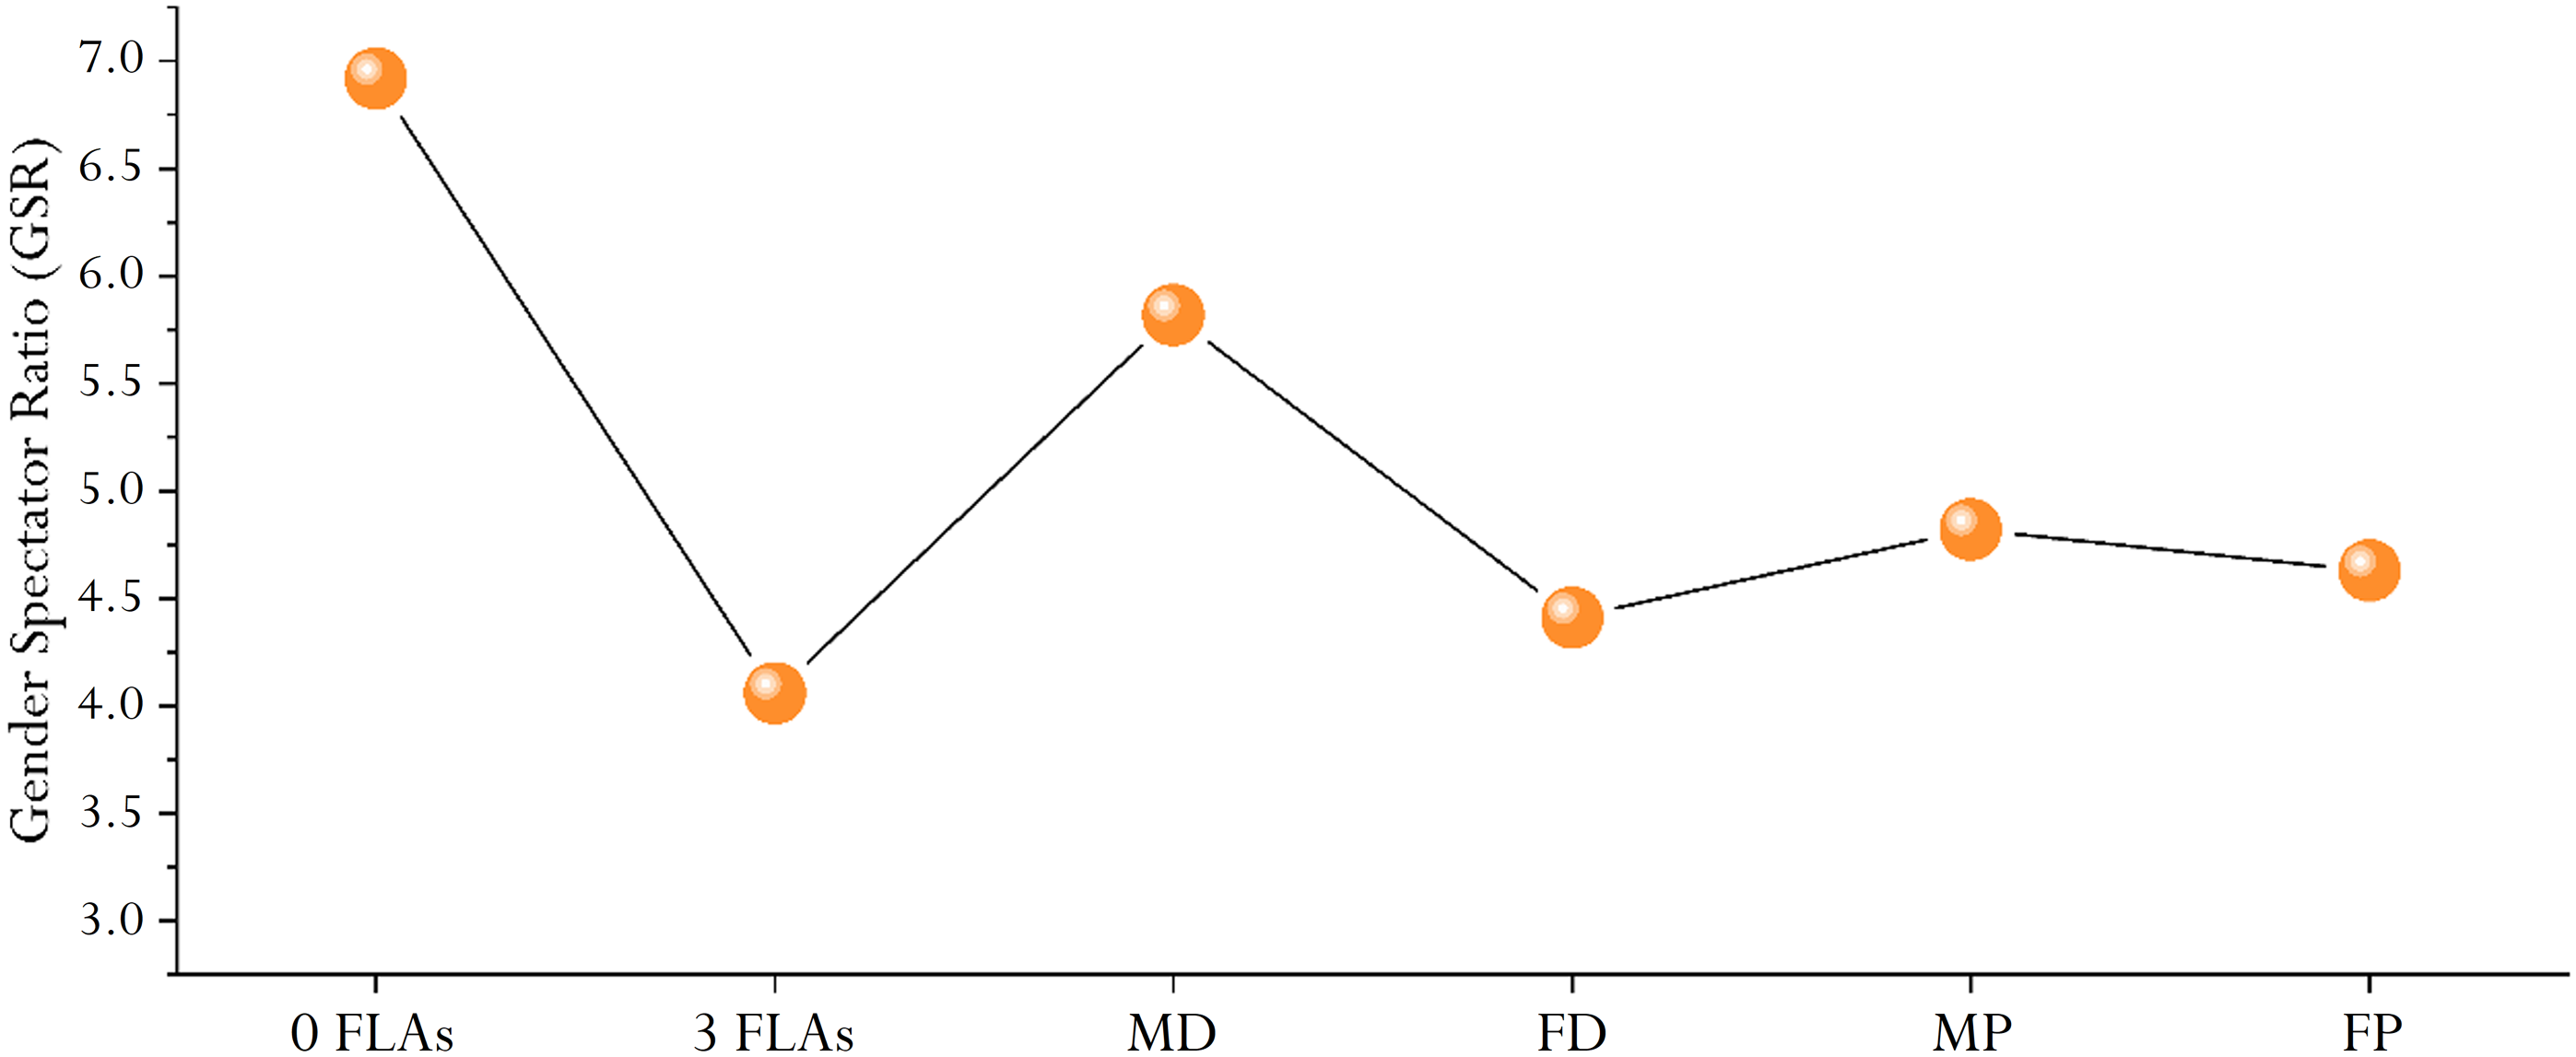
We speculate that a reason for the observed non-linear relationship is that movies featuring more female leading actors (FLAs) may attract proportionally more female spectators. Such films could align more closely with female-oriented interests (assuming peoples’ interests are gendered), potentially resulting in lower male viewership. To examine this possibility empirically, we calculate how the GSR – the ratio of mean male to female spectators – varies as the number of FLAs increases from 0 to 3. Figure 3 depicts this evolution, showing a clear decrease in the GSR as the number of FLAs rises. Hence, the larger share of male spectators we found at lower levels of FLAs might explain the initial negative effect of female leads on ratings (negative portion of the inverse J-shaped curve). In this line of thought, as the GSR decreases, the magnitude of this negative effect lessens (as we saw in Figure 2), eventually enabling a reversal at higher FLAs values, where the relationship becomes positive. Despite this reversal, note that male spectators continue to outnumber female spectators by more than two to one, even in films with the highest representation of female leads. This observation rules out a reverse gender bias scenario, whereby female spectators disproportionately evaluate with high ratings films with female leads.
The evolution of the GSR index with the number of FLAs in a movie.
Note: FLAs denotes the number of female leading actors in a movie. GSR refers to the mean number of male vote users relative to the mean number of female vote users. Estimates were conducted by the authors.
Source: IMDb database.

To test whether the decrease in the GSR drives the observed non-linear relationship between FLAs and ratings, thus signaling gender biases, we introduce an interaction between FLAs and two alternative measures of GSR. In addition to the standard GSR, we construct an adjusted version to account for differences in average ratings given by male and female spectators. These measures are defined as follows: $GSR = \sum\limits_i {{1 \over N}} *{{\left( {Number\;of\;male\;voter{s_i}} \right)} \over {\left( {Number\;of\;female\;voter{s_i}} \right)}}$
and $Adjusted\;GSR = \sum\limits_i {{1 \over N}} *{{\left( {Number\;of\;male\;voter{s_i}} \right)*\left( {Male\;average\;ratin{g_i}} \right)} \over {\left( {Number\;of\;female\;voter{s_i}} \right)*\left( {Female\;average\;ratin{g_i}} \right)}}$
where i indexes each movie rated in the IMDb database, and N denotes the total number of movies.
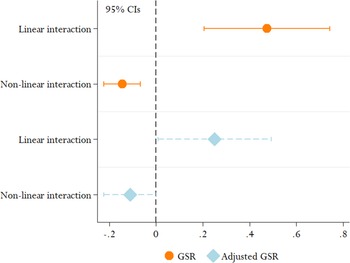
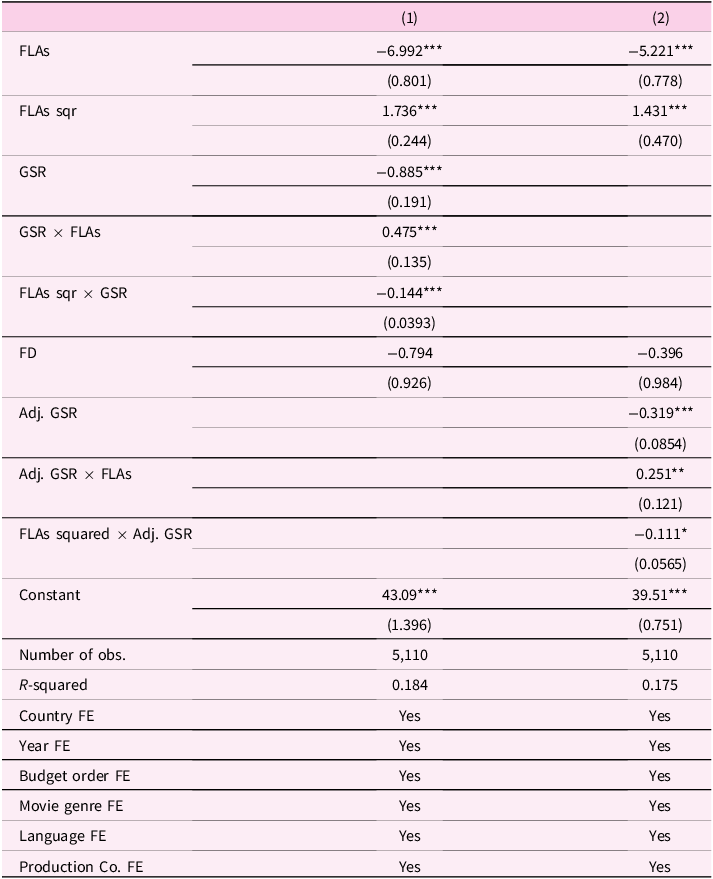
Now Figure 4 and Table 2 present the estimated interaction effects between the continuous FLAs variable and both GSR measures. For clarity, only these interaction terms are reported here; the main effects for FLAs, GSR, and FLAs squared are provided in Table 2.
The effect of linear and non-linear interactions between FLAs and the two GSR measures on movie ratings.
Note: GSR denotes the ratio of mean male to female voters. Adjusted GSR accounts additionally for average ratings by gender group. Linear and non-linear interactions refer respectively to FLAs × GSR (negative segment) and FLAs squared × GSR (positive segment) of the inverse J-shaped relationship. Number of observations (both models): 5,110 movies.
Source: IMDb database.

The effect of the linear and non-linear interactions between the FLAs and the two constructed measures of GSR on movie ratings
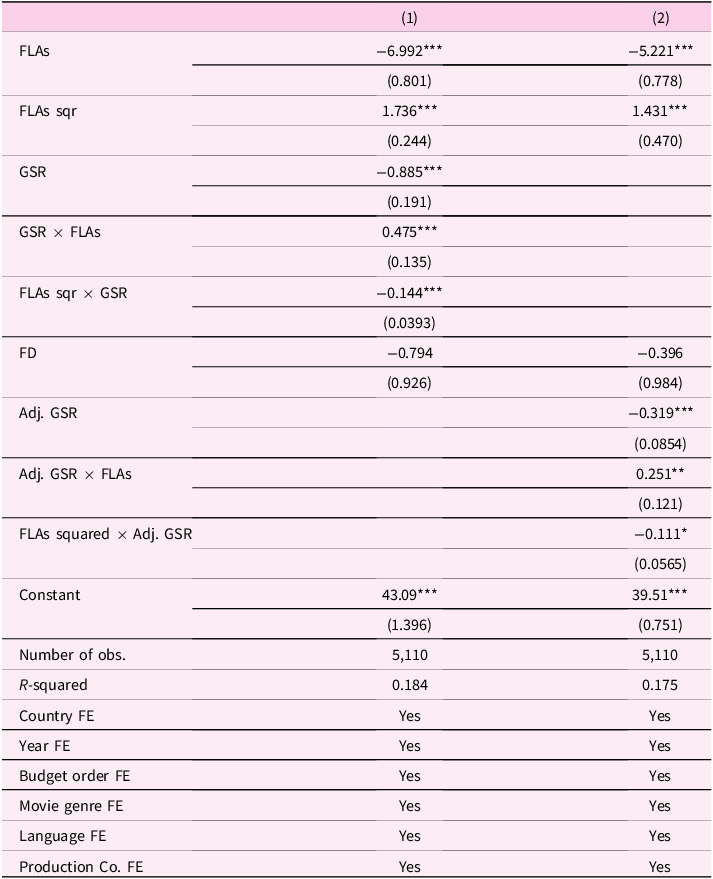
The table reports coefficient estimates and standard errors (in parentheses) from the estimation of equation 1. The dependent variable is Ratings. All variables are defined in Table A2. Estimation method for Ratings specification is OLS with multiple fixed effects. FLAs denotes the number of female leading actors in a movie. GSR denotes the ratio of mean male to female voters in a movie. Adjusted GSR accounts additionally for average ratings by gender group. Linear and non-linear interactions refer respectively to FLAs × GSR (negative segment) and FLAs sqr × GSR (positive segment) of the inverse J-shaped relationship. The source of the data is IMDb database. The table also reports the number of observations, the Adjusted R-squared, and the type of fixed effects included in each specification. The ***, **, and *marks denote statistical significance at the 1%, 5%, and 10% levels, respectively.
The linear interaction term between FLAs and GSR is positive and statistically significant, indicating that a higher ratio of male to female spectators increases the negative impact of FLAs on ratings, thus highlighting the role of male viewers in negatively evaluating films featuring more female leads. Conversely, the non-linear interaction term (FLAs squared × GSR) is negative and statistically significant, suggesting that in the positive segment of the inverse J-shaped curve, a higher GSR attenuates the positive effect of additional FLAs on ratings. This finding further corroborates the negative influence of male spectators on evaluations of movies with more than two FLAs. The smaller magnitude of the non-linear interaction compared to the linear interaction may indicate that male viewers who opt for films with a higher number of FLAs are comparatively less discriminatory. Results using adjusted GSR yield qualitatively similar interaction effects, though with smaller magnitudes, especially in the positive portion of the curve.
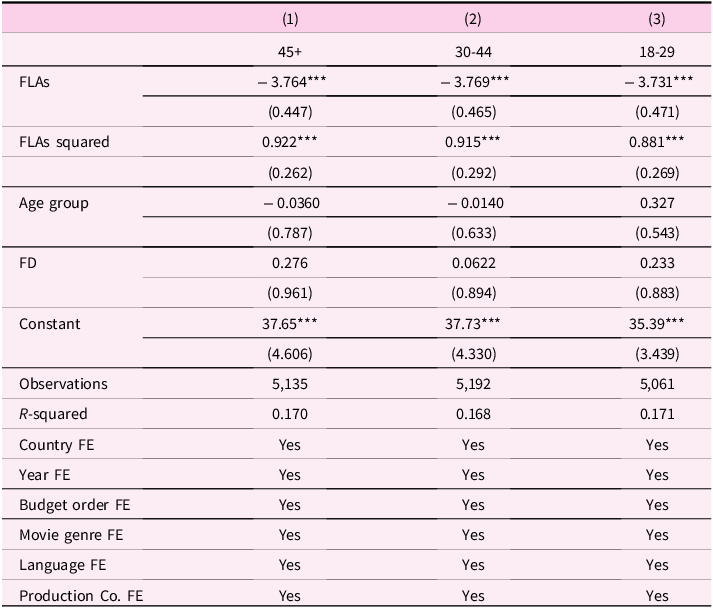
Above we uncovered a potential sample-selection issue due to a disproportionate decrease in male spectators as the number of female leading actors (FLAs) in a movie rises. This selective drop in male viewers could bias our ratings estimates upward, particularly at higher levels of FLAs. To safeguard our analysis against such bias, we adopt a Heckman-like selection approach. Specifically, in our setting, the outcome of interest – movie ratings – is always observed. The selection bias arises not from missingness in the dependent variable, but rather from composition effects: the systematic selective attrition of certain demographic segments (particularly male viewers) from rating movies with increased female representation. While the original Heckman correction addresses scenarios with partially observed outcomes (e.g., wage observations only for employed individuals), our adaptation corrects for biases stemming from implicit selection at the aggregate composition level. Accordingly, we seek a variable that would increase the likelihood to vote for a movie’s evaluation in the IMDB database. In addition, the variable we seek should be uncorrelated to the outcome under study (movie ratings). In our sample, the number of voters increases sharply in younger age groups. The latter implies that a movie has a higher probability of receiving ratings, independent of the number of FLAs, if the audience is younger. Hence, the age group could be used as the desirable variable in the Heckman-like test, assuming that the age group per se does not significantly affect the rating behavior (see Table A3 in Appendix). We test the following equation: $Movie\;Performanc{e_{ict}} = {a_0} + {a_1}FLA{s_i} + {a_2}FLAs_i^2 + Age\;group\;rati{o_{ict}} + {a_3}{P_i} + {a_5}{C_c} \\+ {a_6}{T_t} + {e_{ict}}$
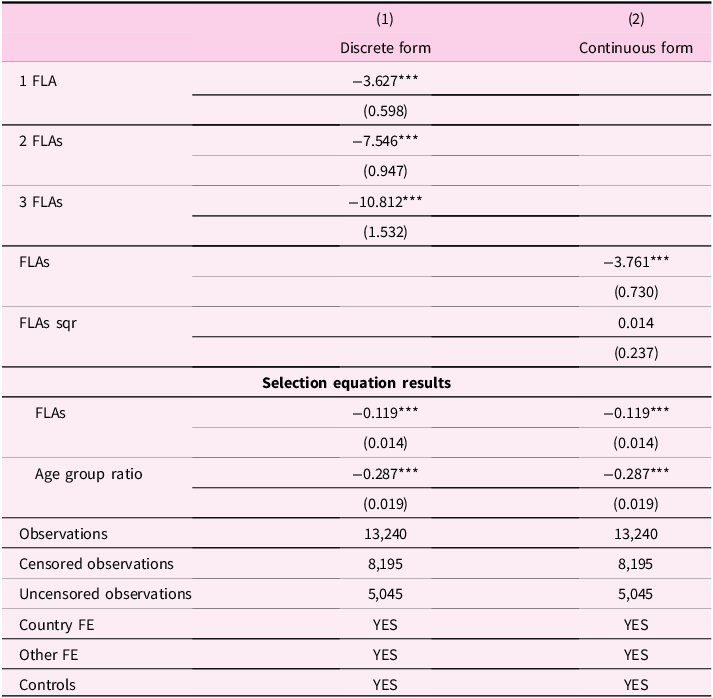
Results (Table 3) support the gender discrimination hypothesis. Column (1), treating FLAs discretely shows a negative and statistically significant relationship between FLAs and ratings that increases monotonically. Column (2), treating FLAs continuously, reveals a significant negative linear term. Specifically, these results indicate that unobserved characteristics positively influencing men’s likelihood to participate in rating movies are also positively correlated with their ratings. Thus, men who remain in the sample to rate films featuring female leads are likely to hold systematically more favorable views than those who opt out. Crucially, this implies that the observed negative impact of female leading actors on movie ratings is robust and potentially understated: the negative bias against female-led films persists despite a positive selection into rating, meaning that the most negatively biased viewers are those absent from the sample. Hence, the significant negative coefficient of female leads on ratings reflects a stronger evidence of gender-based discrimination than initially captured.
Heckman-like selection
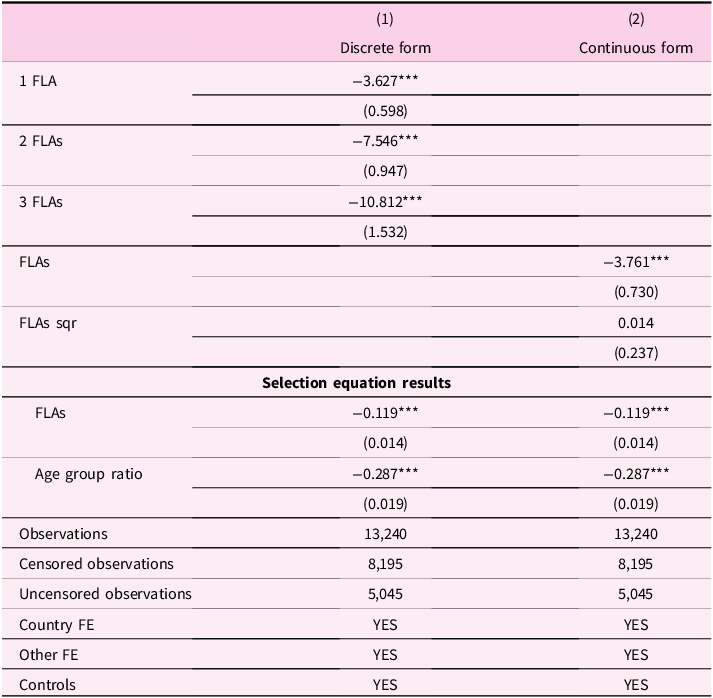
The table reports coefficient estimates and standard errors (in parentheses) from the estimation of a Heckman-like selection model. The dependent variable is Ratings. FLAs denotes the number of female leading actors in a movie. FLAs sqr refers to the square value of the latter. All variables are defined in Table A2. The outcome regression equation includes the control variables from the primary specifications presented earlier. The lower part of the table provides the number of observations, the adjusted R-squared, and the type of fixed effects included in each specification. The selection equation is based on the age-group ratio: viewers aged 45 years and older relative to those aged 18–44 years. We also report the inverse Mills ratio as well as the coefficients of the control variables from the selection equation. Standard errors are computed from the two-step correction procedure. The *** mark denotes statistical significance at the 1% level. *
4.3. Female visibility and invisibility
An interesting feature of movies is that different teams involved in making the movie (actors, directors, producers) are differently visible. In this Section, we explore how varying degrees of gender visibility among key movie crew members affect spectators’ ratings. Actors are highly visible to audiences, directors somewhat less visible, and producers typically the least visible.Footnote 6 We hypothesize that if gender discrimination is present, the negative impact associated with female crew members should weaken – or potentially vanish – as visibility decreases.
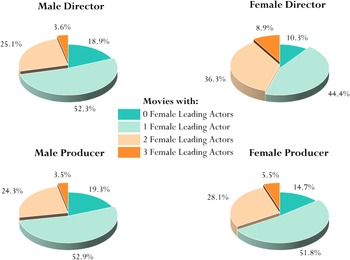
Two methodological challenges arise in testing this hypothesis. First, female directors and producers may disproportionately select films with more female leading actors (FLAs), confounding the effects of their own gender visibility with the actors’ visibility. Second, movies directed or produced by women may inherently attract different audience compositions, altering the GSR and potentially biasing ratings. Unlike the FLAs variable, female director (FD) and female producer (FP) indicators are binary, complicating the accounting of GSR variation within these categories. Fortunately, descriptive statistics (Figures 5 and 6) indicate favorable conditions for addressing these concerns. Female directors indeed select films with more FLAs compared to male directors (45.2% vs. 28.7%), but this disparity nearly disappears for producers (33.6% female vs. 27.8% male), as we see in Figure 5. Additionally, audience composition (GSR) becomes increasingly balanced from FLAs to directors and producers, substantially reducing selection bias (Figure 6).
Movies’ directors and producers: descriptive statistics.
Note: Estimates were conducted by the authors.
Source: IMDb database.

The GSR index by gender in actors, directors, and producers.
Note: FLAs denotes the female leading actors of the movie; MD and FD stand for the male and female directors, respectively; MP and FP represent the male and female producer, respectively. Estimates were conducted by the authors.
Source: IMDb database.

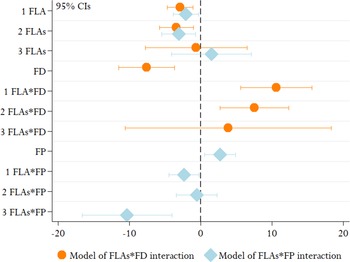
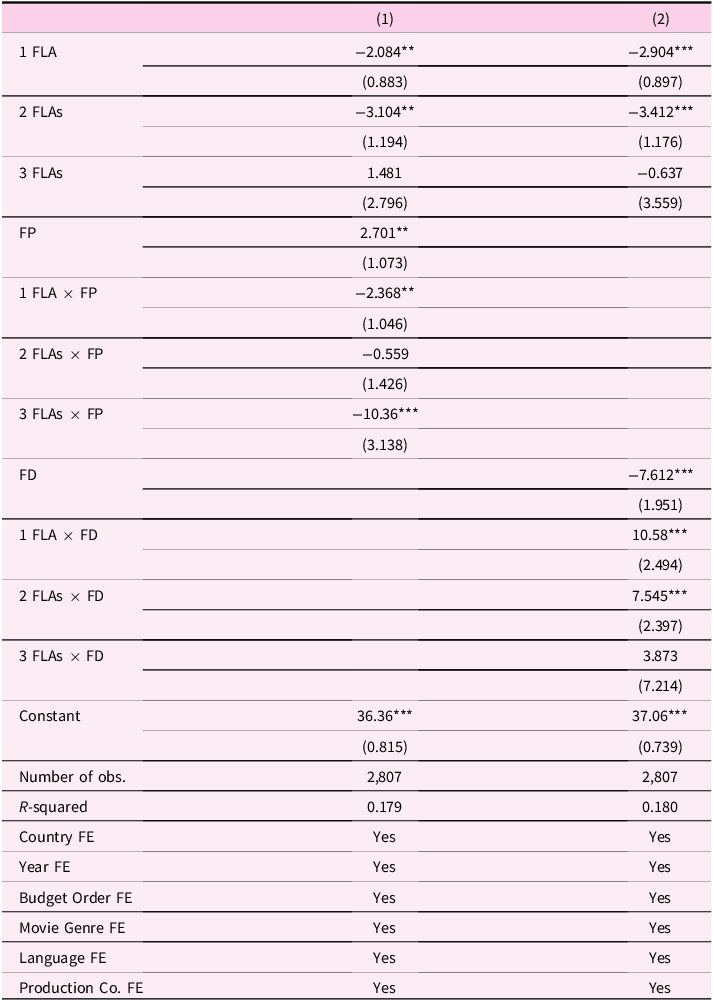
Regression results (Figure 7 and Table 4) demonstrate that films directed by women receive significantly lower ratings compared to male-directed films, consistent with partial visibility affecting ratings negatively. Interaction terms between FLAs and FD are positive, confirming that collaboration with visible female actors mitigates directors’ negative effect, possibly due to shifts in audience gender composition (that is, a higher number of women spectators). Interestingly, this positive interaction effect declines with more FLAs, suggesting that female spectators may rate these collaborations more objectively, or alternatively, that female directors lag behind male counterparts in perceived quality.
The effects of FLAs, Female director, Female Producer, and their interactions on movie ratings.
Note: FLA(s) stands for female leading actor(s). FD represents the female director. FP denotes the female producer. Number of observations (in both models): 2,807.
Source: IMDb database.

The effects of FLAs, FD, FP, and their interactions on movie ratings

The table reports coefficient estimates and standard errors (in parentheses) from the estimation of equation (1). The dependent variable is Ratings. All variables are defined in Table A2. Estimation method is OLS with multiple fixed effects. FLAs or denotes the number of female leading actors in a movie. FD represents the female director of a movie. FP denotes the female producer of a movie. The source of the data is IMDb database. The *** and ** marks denote statistical significance at the 1% and 5% levels, respectively.
In sharp contrast, in Figure 7 we see that the FP (female producers) exerts a positive and statistically significant impact on movie ratings at the 5% level of significance. Hence, films with female producers receive significantly higher ratings. This is the first of three key members of a film crew (actor, director, producer) that we looked at, where the female dimension (FP) raises the likelihood of receiving higher ratings compared to the male one (MP). Most importantly, this is the only instance in which the gender of the movie’s crew member examined is to a great extent – if not entirely – invisible to spectators (and thus it is excluded from people’s judgment criteria). Moreover, the GSR level of the groups compared were found to be the most balanced ones: 5.509 for the FP-MLAs group and 5.176 for the MP-MLAs. The latter substantially deals with potential distortions caused by sample selection problems as mentioned above.
However, when female producers collaborate with more FLAs, ratings decline sharply, reaffirming that visible female presence (FLAs) negatively affects ratings despite the positive invisible presence (FP). These findings strongly support our gender discrimination hypothesis: female visibility on screen induces negative bias among spectators, an effect mitigated or reversed when gender becomes less visible.
4.4. Robustness checks
4.4.1. Sample shifts
In this Section, we examine whether the effect of female leading actors (FLAs) on movie ratings and awards persists when focusing on highly awarded movie genres. The intuition behind is as follows: if gender discrimination exists, restricting our analysis to genres frequently recognized by film experts should not diminish the negative effect of FLAs on ratings found in the previous Section. Conversely, if discrimination is absent, we expect the FLAs effect on ratings and awards to converge (that is, to expose the same pattern) within highly awarded genres.
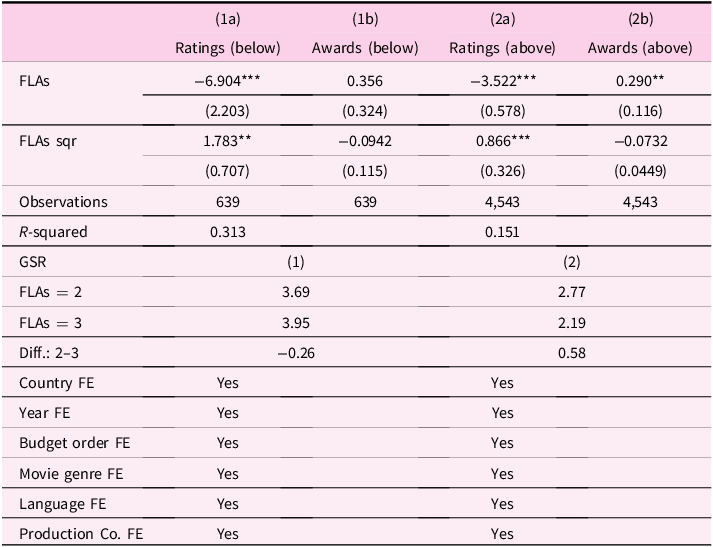
Due to limited variation in individual movie awards, over 78% of movies in our sample received no awards (see Figure A2), we consider instead the average number of awards by genre. Using a threshold based on the mean number of awards per genre (1.59), we separately analyze genres above and below this threshold (Table 5). To get a more precise picture of our hypothesis, we also estimate the subset above the mean confining it gradually to the most awarded movie genres by dropping one movie genre each time.
Results on above and below the mean estimated number of awards per movie genre
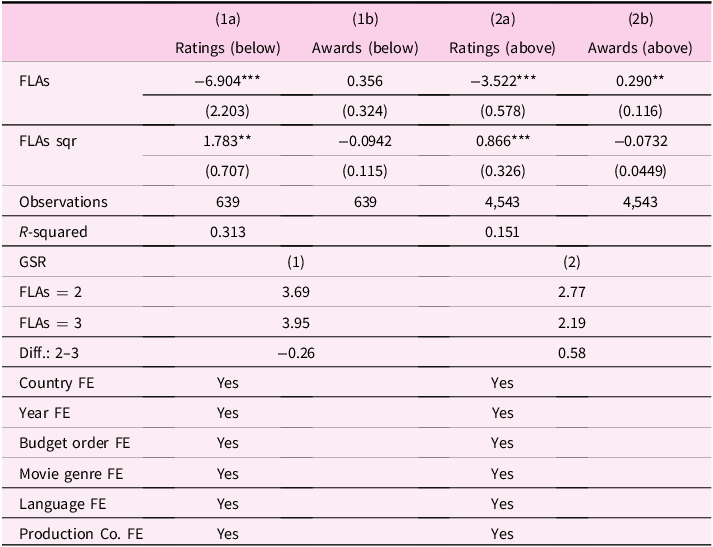
The table reports coefficient estimates and standard errors (in parentheses) from the estimation of equation (1). The dependent variable is Ratings or Awards. All variables are defined in Table A2. Estimation method is OLS with multiple fixed effects for Columns (1a) and (2a), and logit for columns (1b) and (2b). FLAs denotes the number of female leading actors in a movie. FLAs sqr refers to the square value of the latter. In the above columns only movies with awards above the average are considered, on the below exactly the opposite. GSR denotes the ratio of mean male to female voters in a movie. The source of the data is IMDb database. The *** and ** marks denote statistical significance at the 1% and 5% levels, respectively.
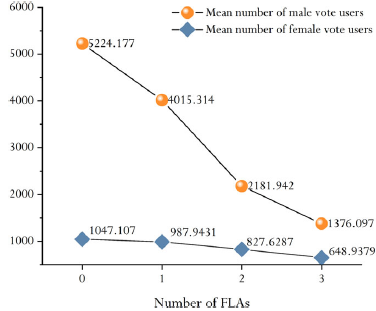
Results confirm significant non-linear effects for both subsets. Specifically, in highly awarded genres (above threshold), we observe a negative and significant effect of FLAs on ratings (convex relationship – column 2a), while awards show a positive linear significant effect (column 2b). Conversely, in genres below the threshold, the “awards” effect is insignificant, and ratings exhibit a pronounced negative and significant relationship. Notably, the Gender Spectator Ratio aligns with our expectations: for highly awarded genres, as GSR decreases (indicating fewer male spectators), ratings effects approach a turning point. The result for movie genres below the awards threshold initially appears inconsistent with our hypothesis, as the GSR increases from 3.69 to 3.95 between 2 and 3 FLAs, yet the reversal still occurs. Closer inspection reveals that this increase in GSR results from an atypical decline in the number of female spectators, by 27.9% (from 2,345 to 1,690), which exceeds that of male spectators, by 22.7% (from 8,669 to 6,693). Unlike previous cases, where male spectators decreased proportionally more and GSR thus declined (see Appendix; Figure A1), this unusual pattern explains the observed reversal despite rising GSR.
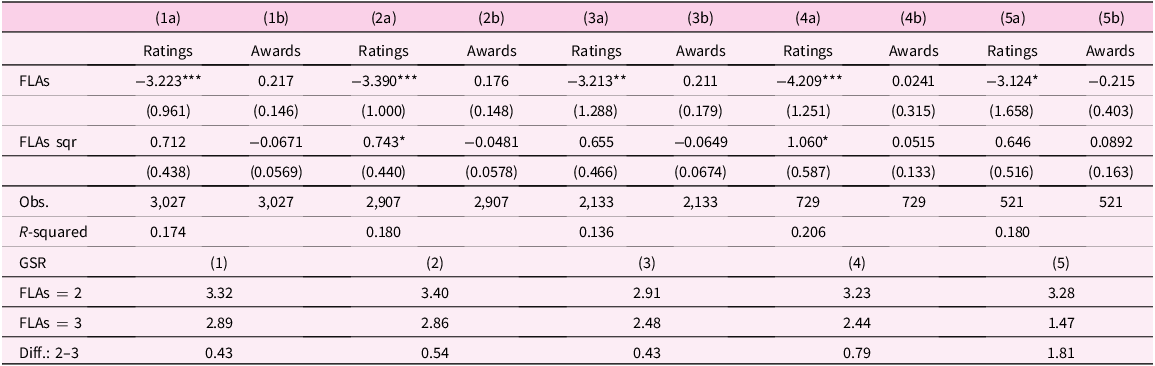
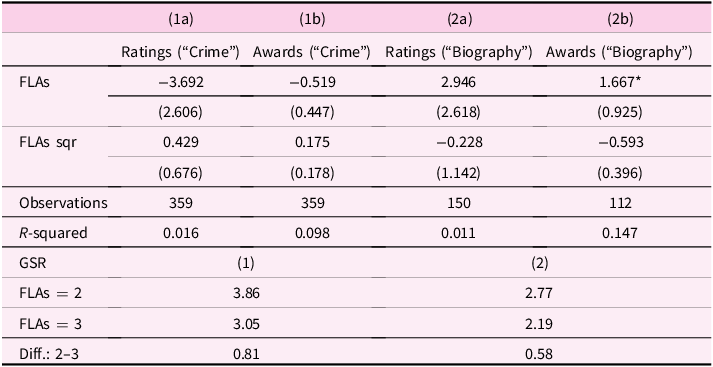
The number of observations is much higher above the imposed threshold. Hence, we focus on the sample of the upper distribution of the most awarded movie genres, which are action, adventure, animation, biography, comedy, drama, and crime. We confine it gradually in Table 6 as follows: in columns (1a,b) we drop Comedy; in columns (2a,b) we drop Comedy and Animation; in columns (3a,b) we drop Comedy, Animation, and Action; in columns (4a,b) we drop Comedy, Animation, Action, and Drama; in columns (5a,b) we drop Comedy, Animation, Action, Drama, and Adventure, respectively. Further analysis of solely the highly awarded genres (Table 6) reinforces our main findings. The contrast in the pattern observed between ratings and awards persists. We should underscore the insignificant positive effect we observe on awards. The latter dispels any thoughts on critics’ credibility. Next, the effect on ratings emerges linear in some cases: columns (1a), (3a), and (5a). In columns (1a) and (3a), this behavior coincides with the small fall one notes in the GSR: 0.43. This is aligned with the gender discrimination hypothesis we set. However, the result in column (5) deviates. There we see that the GSR sharply reduces by 1.81. Given the substantial decline in the ratio of men to women, why does a reversal not occur? In this instance, the regression sample consists of “Crime” and “Biography” movie genres. We disentangle our sample and we keep one movie genre each time in Table 7. Regarding the number of observations, “Crime” dominates: 359 against 150 in “Biography.” The GSR reduces in both cases. The fall is higher for “Crime” but notice that even with this substantial drop, the level of the GSR remains above 3. The latter suggests that even though the proportion of male to female spectators decreases enough, there is still a high number of men to keep the reversal from occurring. This finding reveals that the derived non-linearity (convexity) in ratings depends not only on the magnitude of the GSR decline but on its level as well. We find that in the “Crime” movie genre the FLAs has a negative (linear term) and insignificant effect in both the ratings and awards. The respective effects in “Biography” are positive but significant at 1% only in awards. Thus, the results observed in columns (5a) and (5) in Table 2 may be attributed to the supremacy of the “Crime” movie genre over the “Biography.” Overall, the divergence between ratings and awards persists even among critically acclaimed films, underscoring gender discrimination as a persistent factor influencing audience ratings of movies.
Results on the upper distribution of the threshold based on the mean number of awards per genre
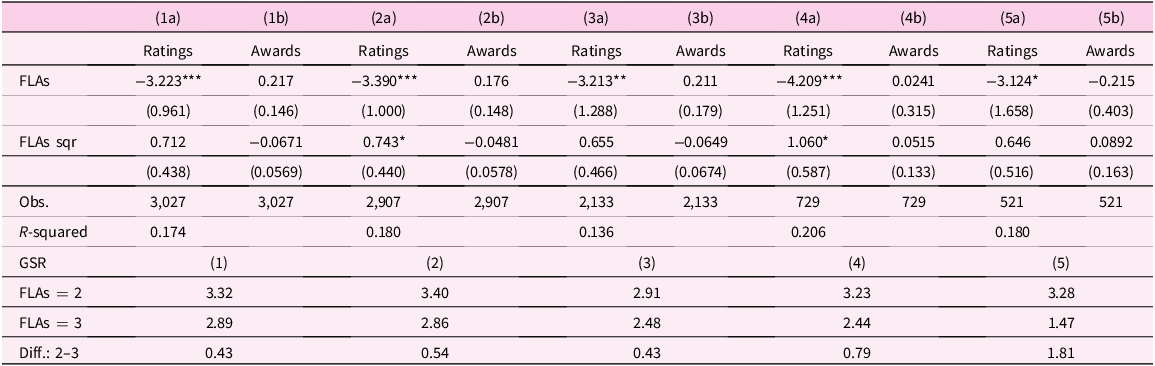
The table reports coefficient estimates and standard errors (in parentheses) from the estimation of equation (1). The dependent variable is Ratings or Awards. All variables are defined in Table A2. Estimation method is OLS with multiple fixed effects for Columns (1a), (2a), (3a), (4a), and (5a), and logit for columns (1b), (2b), (3b), (4b), and (5b). FLAs denotes the number of female leading actors in a movie. FLAs sqr refers to the square value of the latter. GSR denotes the ratio of mean male to female voters in a movie. The source of the data is IMDb database. The ***, **, and *marks denote statistical significance at the 1%, 5%, and 10% levels, respectively.
4.4.2. Gender of raters
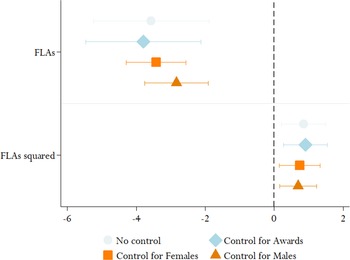
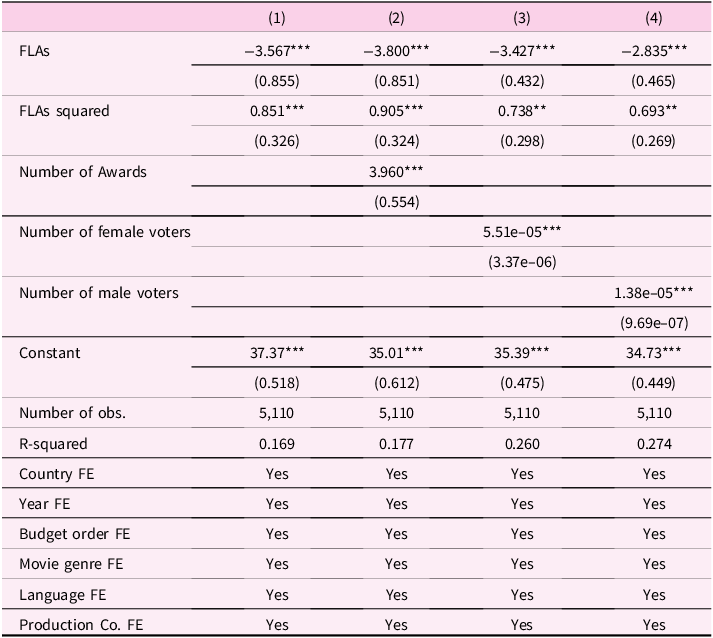
Now, we check the robustness of the gender discrimination hypothesis by isolating the subjective component of audience ratings. To this end, we control for the number of professional awards received, assuming these awards reflect a relatively objective measure of a movie’s quality. If gender discrimination against female leading actors (FLAs) exists, it should manifest clearly within the subjective assessments made by spectators after accounting for this more objective evaluation. Said differently, if adding awards to the model increases the negative effect of female leading actors (FLAs) on ratings, particularly at the negative segment of the inverse J-shaped curve, would support the existence of male audience discrimination.
Indeed, controlling for awards amplifies the negative effect of FLAs on ratings (Figure 8 and Table 8), strongly supporting our hypothesis. This effect is especially pronounced in the negative segment and minimally affects the positive segment, further underscoring the role of GSR. Additionally, controlling separately for the number of female and male voters (weighted by their average ratings) provides further insights. Female voters have a modest mitigating influence on the negative FLAs effect, potentially due to their limited proportion or lower gender bias. Male voters, however, exhibit a stronger reduction in the negative FLAs effect upon their inclusion. Importantly, the effect emerging from male voters is similar in magnitude to that from female voters in the positive segment, suggesting less pronounced gender discrimination among men who choose films with more female leads.
Results solely for “Crime” and “Biography” movie genres
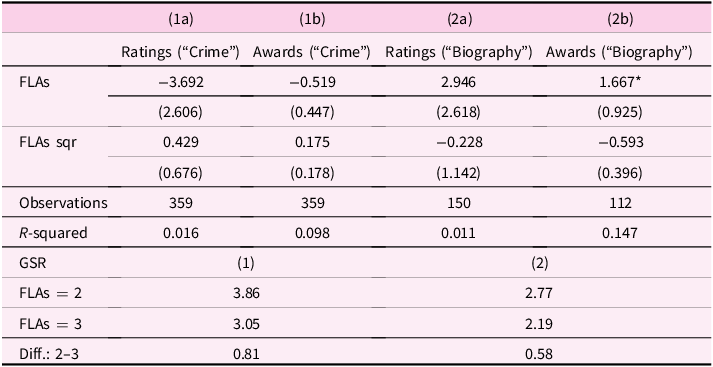
The table reports coefficient estimates and standard errors (in parentheses) from the estimation of equation (1). The dependent variable is Ratings or Awards. All variables are defined in Table A2. Estimation method is OLS with multiple fixed effects for Columns (1a) and (2a), and logit for columns (1b) and (2b). FLAs denotes the number of female leading actors in a movie. FLAs sqr refers to the square value of the latter. GSR denotes the ratio of mean male to female voters in a movie. The source of the data is IMDb database. The * mark denotes statistical significance at the 10% level.
The effect of FLAs and FLAs squared on ratings in four distinguished cases: no control; control for awards; control for female spectators; control for male spectators.
Note: FLAs stands for the number of female leading actors. FLAs squared refers to the square value of the latter. Female and male vote users have been constructed by multiplying the respective mean number of voters to their average ratings as recorded in the IMDb database. Number of observations (in all four models): 5,110. Source: IMDb database.

The effect of FLAs and FLAs squared on ratings in four distinguished cases: additional controls for quality and audience gender
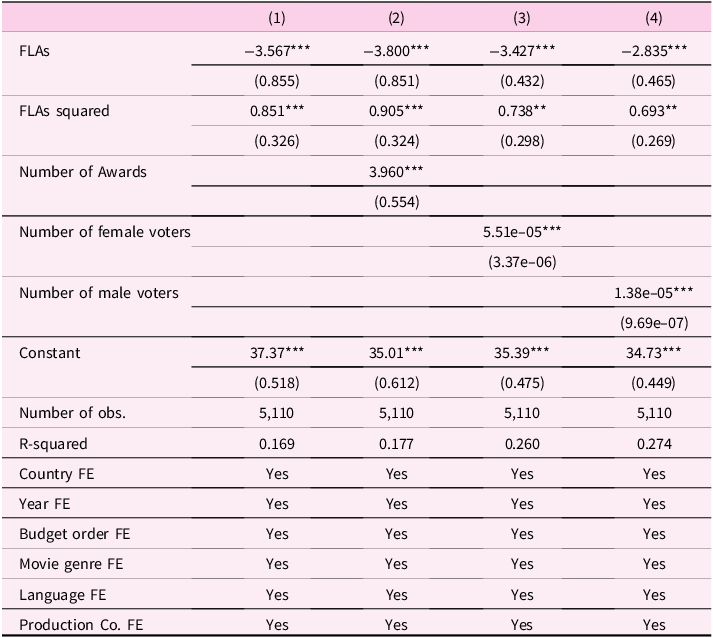
The table reports coefficient estimates and standard errors (in parentheses) from the estimation of equation (1). The dependent variable is Ratings. All variables are defined in Table A2. Estimation method is OLS with multiple fixed effects. FLAs or denotes the number of female leading actors in a movie. FLAs squared refers to the square value of the latter. Female and male vote users have been constructed by multiplying the respective mean number of voters to their average ratings as recorded in the IMDb database. In the first Model (1), no additional controls are added. In Model (2), the number of awards is added to the specification, in Model (3) and (4), the number of female voters and male voters is accounted for, respectively. The source of the data is IMDb database. The *** and ** marks denote statistical significance at the 1% and 5% levels, respectively
5. Concluding remarks
Our research uncovers the complex relationship between gender representation in movies and audience evaluations. Shedding light on various aspects of the interplay provides evidence of gender bias in people’s view. Our findings hint at a striking divergence: while audience ratings decline as the number of female leading actors increases, these same movies are more likely to receive awards from expert committees. Our identified pattern is non-linear. As such, it highlights that the bias is most pronounced when women occupy the first two leading roles. We further illustrate that this bias is primarily driven by male viewers. The latter, both withdraw from evaluating female-led movies and when they do, they rate them more harshly.
Our study contributes to the literature by further emphasizing the role of gender visibility. In doing so we extend the analysis beyond leading roles to include directors and producers, where different patterns of bias are observed. We further take care of audience self-selection bias which allows us to we isolate the pure effect of gender representation on ratings.
Overall, our findings have significant implications for the film industry and for platforms that rely on user-generated ratings. They suggest that audience ratings may not always reflect the true quality of female-led productions, but rather underlying gender biases, particularly from male viewers. Quite unexpectedly, this calls for greater awareness in how success is measured. It also provides clear insights to how platforms might adjust their rating systems to mitigate such biases.
More broadly speaking, our research highlights the need for the industry to recognize and address these biases. Only such amendments can ensure that female-led and produced films are fairly evaluated and promoted. Given the importance of the movie industry as some form of “edutainment,” addressing this bias has profound implications that extend even beyond the movie industry.
Acknowledgements
For comments and suggestions on our paper, we are grateful to Luisito Bertinelli, Per Fredriksson, Despina Gavresi, Dimitrios Minos, Silvia Peracchi, Olga Popova, Eva Sierminska. We would also like to thank participants at the workshop on Gender and Economics in 2023 and the webinar on gender and family economics.
Funding statement
This work is part of a project that has received funding from the Research Fund of the University of Macedonia under the Research funding program: “Gender and Equality Policies (number: 82040).”
The mean number of female and male vote users given the number of FLAs in the movie.
Note: Estimates were conducted by the authors.
Source: IMDb database.

Descriptive statistics and description
List of variables

The effect of FLAs and FLAs squared on ratings with age groups

The table reports coefficient estimates and standard errors (in parentheses) from the estimation of equation (1) including the age group. Dependent variable: Ratings. The *** mark denotes statistical significance at the 1% level.

 Open access

