

Introduction
Deciphering climate history has been one of the major goals of the scientific exploration of Mars. The atmosphere and climate are important proxies for understanding the distribution and stability of water and the implications for environments conducive to the origin and evolution of life (Carr Reference Carr1996). The concept of a global hydrological cycle and system provides an important framework for the understanding and analysis of the distribution of water on a planet, and how this varies with geological time. Here we review the nature of the current global hydrologic cycle on Mars and assess its application to early Mars history (the Noachian Period, the first ~20% of Mars history, about 4.5 to 3.7 billion years ago). We find that although the current hydrologic system on Mars is horizontally stratified (i.e. the surface water cycle is separated from deeper groundwater circulation by a globally continuous frozen layer, the cryosphere), there is great debate about its configuration in the Noachian (Head Reference Head2012). Evidence has been cited to support both a “warm and wet” early Mars (e.g. Craddock & Howard Reference Craddock and Howard2002, Craddock et al. Reference Craddock, Irwin, Howard and Latham2013), with a vertically integrated hydrologic system (i.e. abundant exchange between deep groundwater circulation and surface reservoirs) and a “cold and icy” early Mars (e.g. Wordsworth et al. Reference Wordsworth, Forget, Millour, Head, Madeleine and Charnay2013) with a horizontally stratified hydrologic system (Head Reference Head2013). In order to provide perspective on this debate, we review the nature of groundwater, fluvial and lacustrine processes in the hyperarid, hypothermal environment of the Antarctic McMurdo Dry Valleys (MDV), and describe the hydrological system and cycle currently characterizing this Mars-like region (Marchant & Head Reference Marchant and Head2007).
The hydrological system/cycle of Mars
The current hydrological cycle on Mars
The major themes and reservoirs of the Martian hydrological system were first outlined by Clifford (Reference Clifford1993) and further developed by Clifford & Parker (Reference Clifford and Parker2001). These concepts are built on a foundation of the nature of the early crust of Mars and its ability to act as an aquifer (Fig. 1a). To a first order, the current hydrological cycle on Mars is one characterized by a global cryosphere, and a subsurface groundwater system whose size is determined by estimates of the amount of groundwater assumed under various models to remain there from earlier times (Clifford Reference Clifford1993, Carr Reference Carr1996). This system is currently horizontally stratified (Fig. 1a) (Head Reference Head2012), with the global cryosphere isolating the deeper groundwater system from the surface (except for very slow diffusive processes). On the surface (Fig. 1b), water is latitudinally (horizontally) exchanged between the three main reservoirs (the polar caps, the regolith and ground ice, and the atmosphere) due to seasonal and longer-term climate effects (Forget & Pierrehumbert Reference Forget and Pierrehumbert1997). The vast majority of the water budget resides in the polar caps. Throughout the Amazonian period, spin-axis/orbital perturbations have mobilized polar ice and redeposited it at mid-latitudes (e.g. Madeleine et al. Reference Madeleine, Forget, Head, Levard, Montmessin and Millour2009, Kadish et al. Reference Kadish, Head and Barlow2010) and in equatorial regions (e.g. Head & Marchant Reference Head and Marchant2003). Key to the long-term stability of this configuration is a low geothermal flux and a hypothermal, hyperarid climate.
The current hydrological system and cycle on Mars. a. Crustal cross-section from pole to pole illustrating a horizontally stratified hydrologic system characteristic of present day Mars (after Clifford Reference Clifford1993) and thought to have been typical throughout the Amazonian Period (from Head Reference Head2012). b. The current major surface and near-surface water reservoirs and their exchange.

Examination of the geological record of non-polar ice deposits (Head Reference Head2012) strongly suggests that the climate of Mars throughout the Amazonian (the last ~66% of Mars history, from about three billion years ago to the present), was much like it is today, a cold and dry climate regime, characterized by the latitudinal migration of surface ice in response to variations in spin-axis/orbital parameters, primarily obliquity (Fig. 1b) (e.g. Forget et al. Reference Forget, Haberle, Montmessin, Levrard and Head2006, Head et al. Reference Head, Marchant, Agnew, Fassett and Kreslavsky2006, Madeleine et al. Reference Madeleine, Forget, Head, Levard, Montmessin and Millour2009, Fastook et al. 2011, Head Reference Head2012). A corollary is that the Amazonian hydrological system was horizontally stratified (i.e. the surface water cycle was separated from deeper groundwater circulation by a globally continuous frozen layer, the cryosphere) (Head Reference Head2012) (Fig. 1).
The Noachian hydrological cycle on Mars
What characterized the climate regime during the Noachian, the first ~20% of Mars history? Many hypothesize that the Noachian of Mars was a warm, wet period of pluvial activity (e.g. Craddock & Howard Reference Craddock and Howard2002, Craddock et al. Reference Craddock, Irwin, Howard and Latham2013) with a higher global geothermal gradient (Fig. 2). In this case, the hydrological system would be vertically integrated, at least in low to mid-latitudes (e.g. Andrews-Hanna et al. Reference Andrews-Hanna, Zuber, Arvidson and Wiseman2010, Andrews-Hanna & Lewis Reference Andrews-Hanna and Lewis2011). Surface runoff would be important, the water table would be close to the surface, vertical exchange would be significant, and vertical recharge would maintain an episodically high water table over time, often intersecting the surface. An implication of this scenario is the presence of a Noachian ocean in the northern lowlands (Fig. 2).
The Late Noachian hydrological system and cycle on Mars dominated by a “warm and wet” climate, including pluvial activity (e.g. Craddock & Howard Reference Craddock and Howard2002). Crustal cross-section from pole to pole illustrating the resulting vertically integrated hydrologic system (from Head Reference Head2012).

Numerous lines of evidence have been cited in support of the interpretation of a “warm and wet” early Mars Late Noachian climate. Recent mission data (e.g. Bibring et al. Reference Bibring, Langevin, Mustard, Poulet, Arvidson, Gendrin, Gondet, Mangold, Pinet and Forget2006) have detected surface minerals interpreted to indicate the role of liquid water in the pervasive alteration of the crust (phyllosilicates), and the deposition of evaporates (sulfates). Detection of the presence of extensive chloride deposits in the southern uplands supports the former widespread presence of water (Osterloo et al. Reference Osterloo, Anderson, Hamilton and Hynek2010). Geomorphological and crater preservation data have been used to document a Middle Noachian period of intensive erosion and degradation of impact craters and intercrater areas (Mangold et al. Reference Mangold, Adeli, Conway, Ansan and Langlais2012). Geomorphological evidence has been cited for rainwater (pluvial) activity (Craddock & Howard Reference Craddock and Howard2002, Craddock et al. Reference Craddock, Irwin, Howard and Latham2013). Dendritic valley networks (Craddock & Howard Reference Craddock and Howard2002), densely distributed (Hynek et al. Reference Hynek, Beach and Hoke2010) and dated to the Late Noachian-Early Hesperian (Fassett & Head Reference Fassett and Head2008a) are interpreted to represent a phase of significant fluvial erosion in the southern uplands (Howard et al. Reference Howard, Moore and Irwin2005, Irwin et al. Reference Irwin, Howard, Craddock and Moore2005, Barnhart et al. Reference Barnhart, Howard and Moore2009, Grotzinger & Milliken Reference Grotzinger and Milliken2012). In association with valley networks are found more than 220 open-basin lakes indicating inflow, filling and outflow, and thus the existence of standing bodies of water of significant volume (Fassett & Head Reference Fassett and Head2008b), and numerous closed-basin lakes (Cabrol & Grin Reference Cabrol and Grin2001, Aureli et al. Reference Aureli, Head, Goudge and Fassett2013). Mars Exploration Rover (MER) observations at Meridiani suggest that abundant liquid water was present there in the Late Noachian (Squyres et al. Reference Squyres, Knoll, Arvidson, Clark, Grotzinger, Jolliff, McLennan, Tosca, Bell, Calvin, Farrand, Glotch, Golombek, Herkenhoff, Johnson, Klingelhofer, McSween and Yen2006) and these findings are viewed as being consistent with a vertically integrated hydrologic system (Andrews-Hanna et al. Reference Andrews-Hanna, Zuber, Arvidson and Wiseman2010). Recent findings from the Mars Science Laboratory rover Curiosity show evidence of extensive sedimentary particle rounding in an ancient stream related to an alluvial fan (Williams et al. Reference Williams, Grotzinger, Dietrich, Gupta, Sumner, Wiens, Mangold, Malin, Edgett, Maurice, Forni, Gasnault, Ollila, Newsom, Dromart, Palucis, Yingst, Anderson, Herkenhoff, Le Mouelic, Goetz, Madsen, Koefoed, Jensen, Bridges, Schwenzer, Lewis, Stack, Rubin, Kah, Bell, Farmer, Sullivan, van Beek, Blaney, Pariser and Deen2013) and significant water in amorphous silicate grains in the soil of the Gusev crater floor, a closed-basin lake on Mars (Irwin et al. Reference Irwin, Howard, Craddock and Moore2005).
Evidence for a warm and wet early Mars has not been universally accepted, however (e.g. Squyres & Kasting Reference Squyres and Kasting1994, Gaidos & Marion Reference Gaidos and Marion2003, Fairen Reference Fairen2010). Significant parts of the phyllosilicates in the Noachian crust (Fe, Mg clays) appear to be due to hydrothermal (subsurface) alteration (Ehlmann et al. Reference Ehlmann, Mustard, Murchie, Bibring, Meunier, Fraeman and Langevin2011), rather than related to weathering linked to surface pluvial processes. Despite evidence for widespread fluvial activity, Noachian degradation/erosion rates are very low by terrestrial standards, analogous to hyperarid environments (Golombek et al. Reference Golombek, Grant, Crumpler, Greeley, Arvidson, Bell, Weitz, Sullivan, Christensen, Soderblom and Squyres2006). Valley networks are poorly integrated (Stepenski & Coradetti Reference Stepinski and Coradetti2004) potentially suggesting shorter-term fluvial, rather than longer-term pluvial-induced activity (Aharonson et al. Reference Aharonson, Zuber, Rothman, Schorghofer and Whipple2002). Evidence that Noachian valley network-related precipitation might be snowfall (nivial), rather than rainfall (pluvial) (Scanlon et al. Reference Scanlon, Head, Madeleine, Wordsworth and Forget2013), together with a new understanding of the role of regional ice deposits at all latitudes in the Amazonian, provide perspective on the possibility of regional ice deposits in the Noachian. Finally, atmospheric modellers have consistently encountered difficulty in producing and maintaining an atmosphere conducive to Noachian warm and wet pluvial environments due to a faint young Sun and insufficient greenhouse gases (e.g. Haberle Reference Haberle1998).
Recent modelling of the Noachian climate
Significant progress has recently been made in modelling of the atmosphere on early Mars. A complete 3-D General Circulation Model (GCM) has been developed (Forget et al. Reference Forget, Wordsworth, Millour, Madeleine, Kerber, Leconte, Marcq and Haberle2013) including revised spectroscopic properties for CO2 and a full water cycle (Wordsworth et al. Reference Wordsworth, Forget, Millour, Head, Madeleine and Charnay2013). Model sensitivities to surface pressures, cloud microphysics properties, obliquity and orbital properties, atmospheric dust loading, and model resolution have been systematically explored. These simulations of an early Mars climate assume a faint young Sun and explore a CO2 atmosphere with surface pressures between 0.1 and 7 bars.
One of the most fundamental findings of the model is that for atmospheric pressures greater than a few hundred millibars, surface temperatures vary with altitude because of the onset of atmosphere-surface thermal coupling, and adiabatic cooling and warming of the atmosphere as it moves vertically. This adiabatic cooling effect results in the deposition of snow and ice at high altitudes (Fig. 3). This is in contrast to the conditions at present and throughout the Amazonian, where the low atmospheric pressure results in a thermally decoupled atmosphere-surface climate regime. Exploration of parameter space for the Noachian thermally coupled atmosphere-surface climate regime (Forget et al. Reference Forget, Wordsworth, Millour, Madeleine, Kerber, Leconte, Marcq and Haberle2013, Wordsworth et al. Reference Wordsworth, Forget, Millour, Head, Madeleine and Charnay2013) found that, in the absence of other warming mechanisms, no combination of parameters could lead to mean annual atmospheric temperatures (MAAT) anywhere on the planet that were above 0°C and thus consistent with pluvial activity and widespread flow of liquid water.
The Late Noachian “cold and icy” hydrological system and cycle on Mars: This example is dominated by a “cold and icy” climate and nivial activity as suggested by recent climate models (e.g. Forget et al. Reference Forget, Wordsworth, Millour, Madeleine, Kerber, Leconte, Marcq and Haberle2013, Wordsworth et al. Reference Wordsworth, Forget, Millour, Head, Madeleine and Charnay2013) to have been typical of the Late Noachian Period. Diagrammatic cross-section showing water transport paths and residence locations in the southern hemisphere of Mars in the “cold and icy” climate model (e.g. Forget et al. Reference Forget, Wordsworth, Millour, Madeleine, Kerber, Leconte, Marcq and Haberle2013, Wordsworth et al. Reference Wordsworth, Forget, Millour, Head, Madeleine and Charnay2013).

Further analysis with a complete water cycle with clouds and precipitation (Wordsworth et al. Reference Wordsworth, Forget, Millour, Head, Madeleine and Charnay2013) permitted the modelling of the location and evolution of water and ice on the surface of early Mars. The addition of a water cycle, combined with the adiabatic cooling effect, causes southern highland region temperatures to fall significantly below the global average (Fig. 3). These conditions lead to the scenario of a “Noachian icy highlands”. Water is transported to the highlands from low-lying regions due to the adiabatic cooling effect and snows out to form 1) an extended water ice cap at the southern pole (Head & Pratt Reference Head and Pratt2001, Fastook et al. Reference Fastook, Head, Marchant, Forget and Madeleine2012) (see the yellow unit in inset map in Fig. 3, centred at the south pole), and 2) altitude-dependent snow and ice deposits down to lower southern latitudes (Forget et al. Reference Forget, Wordsworth, Millour, Madeleine, Kerber, Leconte, Marcq and Haberle2013, Wordsworth et al. Reference Wordsworth, Forget, Millour, Head, Madeleine and Charnay2013). Mean annual temperatures are well below 0°C, but episodic peak seasonal temperatures (PSTs) or peak daytime temperatures (PDTs) caused by spin-axis/orbital perturbations (or punctuated warming events such as impacts or volcanism) can melt accumulated snow and ice, with meltwater flowing into the surrounding lower elevations (Fig. 3); evaporation and sublimation return water to the highlands as snow.
In summary, Forget et al. (Reference Forget, Wordsworth, Millour, Madeleine, Kerber, Leconte, Marcq and Haberle2013) and Wordsworth et al. (Reference Wordsworth, Forget, Millour, Head, Madeleine and Charnay2013) conclude that the Late Noachian climate MAAT is well below 0°C. Wordsworth et al. (Reference Wordsworth, Forget, Millour, Head, Madeleine and Charnay2013) describe three options to reach melting temperatures in the context of this “cold and icy” Mars climate:
-
1) Systematic top-down warming; in this case spin-axis/orbital parameters (obliquity, eccentricity and precession) (Laskar et al. 2004) could produce conditions in which the icy highlands undergo heating and melting during PST or PDT conditions, but the MAAT remains below 0°C, as predicted by the “icy highlands” model.
-
2) Punctuated top-down warming; in this case some distinctive event(s) cause the MAAT, PST or PDT to reach the melting point for an extended period of time (decades to centuries), causing the icy highlands regional ice cover to undergo melting, drainage, and to exhibit related fluvial and lacustrine processes. Two types of punctuated top-down warming are: a) Environmental effects of impact cratering events, causing surface and atmospheric warming, rainfall and melting (e.g. Toon et al. 2010). b) Massive volcanic eruptions, in which a short-lived warmer climate and surface hydrological activity (melting of ice deposits and associated fluvial and lacustrine processes) are produced by the radiative effect of volcanic greenhouse gases, such as CO2, H20 and SO2, emitted during phases of punctuated volcanism (e.g. Forget & Pierrehumbert Reference Forget and Pierrehumbert1997, Halevy & Head Reference Halevy and Head2012).
-
3) Bottom-up heating; in this case, enhanced geothermal gradients on early Mars cause basal heating of regional snow and ice deposits, melting, and drainage of meltwater.
Wordsworth et al. (Reference Wordsworth, Forget, Millour, Head, Madeleine and Charnay2013; p. 12–17) provide detailed discussions of these three mechanisms. In conjunction with any of these types of melting phases, ice migration back to higher altitudes constitutes a robust mechanism for recharging highland water sources. Could the predictions of this “Noachian Icy Highlands” model (Fig. 3) be consistent with the many lines of evidence traditionally cited for a “warm, wet” early Mars and also address the contradictions cited above?
Assessing the Noachian “cold and icy” climate hypothesis with terrestrial analogues
How can the Noachian “cold and icy” climate hypothesis be assessed and its predictions tested? Terrestrial analogues have been employed successfully in interpreting many landforms and processes on Mars, and the hypothermal, hyperarid environment of the MDV has been particularly useful in the interpretation of latitude-dependent ice deposits (Marchant & Head Reference Marchant and Head2007), mid-latitude alpine glaciers (Head et al. Reference Head, Marchant, Agnew, Fassett and Kreslavsky2006), tropical mountain glaciers (Head & Marchant Reference Head and Marchant2003), polygonally patterned ground (Levy et al. Reference Levy, Head and Marchant2008), Martian soils (Barrett et al. Reference Barrett, Page, Gooseff and Takacs-Vebach2010), stream ecosystems (Gooseff et al. Reference Gooseff, McKnight, Lyons and Blum2002, Reference Gooseff, McKnight, Carr and Baeseman2010), and saline lakes and ponds (Mikucki et al. Reference Mikucki, Lyons, Hawes, Lanoil and Doran2010). Noachian valley networks and open/closed-basin lakes have been cited as key evidence for a “warm and wet” early Mars (e.g. Craddock et al. Reference Craddock, Irwin, Howard and Latham2013). Here we investigate groundwater, fluvial and lacustrine processes in the Mars-like Antarctic MDVs to assess whether these processes, which take place in the absence of pluvial activity and with MAAT well below zero, can serve as informative proxies for Noachian Mars. We describe groundwater processes and hydrological systems occurring in humid (pluvial) climates, as points of comparison, and then summarize the nature of fluvial and lacustrine processes, landforms, and deposits in the MDV as background to assessing Mars Noachian climate models.
Groundwater processes
Basic definitions and principles of groundwater processes in humid climates
Groundwater is water occurring in the pore spaces of bedrock and soil, and in temperate climates originates predominantly as rainfall. Rainfall passes down through the zone of aeration and into the saturated zone at the water table (Fig. 4a). In soils and sediments with appropriate porosity and permeability (usually fine-grained), a thin zone just above the water table remains wet due to capillary action (Fig. 4c). At the ground surface, there is often a thin zone of relatively less permeable clay-rich material formed by enhanced surface-atmosphere and biogenic chemical weathering; this soil layer may retard infiltration and enhance the roles of evaporation and transpiration.
Main features of hydrological cycles on Earth. a. Temperate climates: a vertically integrated hydrological system. b. Hyperarid, hypothermal climates: a horizontally stratified hydrologic system. Nivial activity is minimal and sublimation dominates over melting. The small amounts of meltwater tend to be concentrated in fluvial channels and the adjacent wetted hyporheic zone (see Fig. 8a for details). c. Details of the vertically integrated hydrological system. d. Details of the horizontally stratified hydrologic system.

The water table usually slopes toward streams and lakes and contributes to their flow (effluent streams), but in arid regions the water table may lie much deeper than the stream level and streams may lose water toward the water table (influent streams) (Fig. 4a). Seasonal or annual variations in rainfall cause the vertical migration of the water table and individual streams can transition from influent to effluent. The base of the saturated zone commonly lies at depths defined by increasing overburden pressure closing available pore spaces and decreasing interconnectivity, and is commonly irregular and poorly defined.
Groundwater tends to migrate toward topographic lows under the influence of gravity and thus in active systems with abundant rainwater the water table tends to mimic surface topography (Fig. 4a). In arid regions, the paucity of refreshment, and the influence of gravity, drive the water table toward horizontality and increase its depth. Porosity (the percentage of open void space that can hold water) and permeability (the rate at which water can pass through the pores) dictate the general rates of groundwater movement; these rates are extremely slow (m a-1) due to the small size of pores and the complexities of their interconnectedness. Grain size and shape, sorting, packing, cementation, vesicularity, jointing and fracturing, and tortuosity all influence porosity and permeability and thus rates of groundwater movement. Groundwater plays an important part in the hydrological cycle (Fig. 4a) and undergoes recharge when precipitation soaks into the ground and reaches the water table, and discharge where groundwater flows into streams, swamps/wetlands, lakes or oceans. Recharge areas are almost always much greater than discharge areas, but significant differences can occur in humid versus arid regions, and in influent and effluent fluvial systems. The chemistry of groundwater can vary considerably depending on the types of rocks through which it travels and its refresh rate, and this can influence groundwater salinity, density and viscosity (Fig. 4a). Solutes in groundwater commonly consist of chlorides, sulfates and bicarbonates of Ca, Mg, Na, K and Fe derived from weathering of common rock-forming minerals and from the characteristics of rainwater.
In summary, groundwater processes and a vertically integrated hydrologic cycle occur throughout humid-temperate regions (compare Fig. 4a & c and Fig. 4b). At higher latitudes (and sometimes at higher altitudes in temperate regions), however, mean annual temperatures lower to such a degree that they approach and exceed the freezing point of water and produce perennially frozen ground or permafrost. For example, the southern limit of permafrost in the Northern Hemisphere of Earth occurs where the mean annual air temperature is between about -5 and -10°C. Permafrost thicknesses of up to 1500 m have been recorded in Siberia; thick permafrost tends to occur on the margins outside of ice sheets (periglacial environments), where, among other things, the insulating effects of the ice sheets themselves do not act to inhibit permafrost development and thickening.
The hydrologic system in the McMurdo Dry Valleys
Groundwater processes in the hyperarid, hypothermal MDV (Fig. 4b & d) are quite different from those in humid temperate regions (Fig. 4a & c). First, rainfall does not occur, and thus the overland flow of water from rainfall, and significant infiltration into a near-surface groundwater aquifer induced by overland flow, is non-existent. Second, mean annual snowfall ranges from 3–50 mm a-1 water equivalent in the MDV (Fountain et al. Reference Fountain, Nylen, Monaghan, Basagic and Bromwich2009), a precipitation level that is an order of magnitude lower than levels in temperate climates; furthermore, in the MDV most of this precipitation is lost by sublimation rather than melting. Third, and most importantly, the hypothermal conditions of the MDV mean that the shallow groundwater table typical of temperate climates is replaced by permafrost; in the MDV the water table becomes the ice table and occurs at shallow depths (tens of centimetres) (Fig. 4b & d). This configuration creates a barrier of low porosity and permeability between the surface and the deeper subsurface groundwater system. For the very limited amount of meltwater that occurs in the MDV, the permafrost layer can thus be thought of as an aquiclude (Fig. 4d), a solid impermeable layer underlying a potential perched aquifer composed of the dry porous soil material overlying the permafrost layer (Marchant & Head Reference Marchant and Head2007). The presence of the permafrost layer effectively isolates atmospheric precipitation from the deeper groundwater system, forming a horizontally stratified hydrologic system (Fig. 4b & d).
In summary, the MDV hydrologic cycle is horizontally stratified rather than vertically integrated (Fig. 4b). A permafrost layer, caused by MAAT well below 0°C, creates a barrier between any surface meltwater and the groundwater zone below. The top of the ice-cemented soil is in diffusive equilibrium with the atmosphere. Any seasonal meltwater (Fig. 5) soaks into the dry active layer, wets the adjacent soil (see Fig. 8a & b), percolates down to the ice table aquiclude, and flows over the ice table, eventually evaporating or freezing. Due to the absence of widespread, perennial liquid water, weathering and erosion rates are lower by several orders of magnitude (Summerfield et al. Reference Summerfield, Stuart, Cockburn, Sugden, Denton, Dunai and Marchant1998) and can vary considerably depending on local conditions and seasonal abundances of liquid water in microenvironments.
McMurdo Dry Valleys snow and ice microenvironments illustrating the multiple sources of snow and ice concentrations available for seasonal melting.

Water sources in the McMurdo Dry Valleys and the movement of water
What are the sources of water in the MDV and how does water interact with underlying soils and the horizontally stratified hydrologic system? In general, MDV soils are very dry; Campbell et al. (Reference Campbell, Claridge, Campbell and Balks1998) found that the gravimetric water content (GWC) in the upper 3 cm of soil from 50 sites in the relatively wet coastal thaw zone (Marchant & Head Reference Marchant and Head2007) averaged ~1%, and increased steadily with depth to about 10% just above top of the ice table, and much higher in the permafrost layer below. In spite of this dryness, there are numerous local microenvironments in which water sources exist, typically in the form of localized deposits of snow and ice (Fig. 5).
Snow on rocks: One source of water is the small amount of melting that takes place when snow collects on the tops of dark rocks; this process occurs throughout the MDV, but it is the only significant source of water in the ultra-cold and dry stable upland zone (SUZ; Marchant & Head Reference Marchant and Head2007). Solar radiation preferentially heats dark, low albedo rocks, forming meltwater that drains into local pits on the rocks to cause slow alteration (Head et al. Reference Head, Kreslavsky and Marchant2011); minor amounts of meltwater flow down the sides of the rocks to form shallow ice cement in the dry permafrost below and adjacent to the rock. In this case, the snow is subliming from the top, but melting from the albedo-induced warming of the rock beneath the snow. This transient meltwater produces very small amounts of weathering (Salvatore et al. Reference Salvatore, Mustard, Head, Cooper, Marchant and Wyatt2013) and pits (Head et al. Reference Head, Kreslavsky and Marchant2011), but weathering rates are extremely low (Summerfield et al. Reference Summerfield, Stuart, Cockburn, Sugden, Denton, Dunai and Marchant1998).
Isolated snow patches and accompanying moisture fringe: Larger snow patches can form in the lee of rocks and in local depressions (Figs 5 & 6a). Peak daytime temperatures reach sufficiently high values in the coastal thaw zone and occasionally in the slightly higher-elevation inland mixed zone (Marchant & Head Reference Marchant and Head2007) so that local melting of snow and ice patches can occur. Although snow patches insulate underlying soils from elevated temperatures, top-down heating of the patches causes meltwater to form, flow, and ultimately soak into the upper dry part of the permafrost adjacent to the snow and ice patches (Fig. 5), typically in the downslope direction. Campbell et al. (Reference Campbell, Claridge, Campbell and Balks1998) measured the time-dependent behaviour of one of these snow patches and showed that the upper 5 cm of the adjacent wetted soil had a GWC of 15% at the edge of the thawing and subliming snow patch, 12% at 1.5 m distance, and 2.5% at 4 m distance. Following the retreat and disappearance of the snow patch the moist soil dried out and the soil GWC dropped to <1% in 14 days. These dark fringes are thus transient features whose lifetime is dependent on the longevity of the source of meltwater and the rate of desiccation of the soil once the source is exhausted.
Examples of meltwater sources and processes in the McMurdo Dry Valleys (see Fig. 5 for context). a. Seasonal snow and ice sequestered in patches and polygon troughs. b. Slope-streak/water track features above Don Juan Pond (DJP) in upper Wright Valley. Water sources are snow patches sequestered in bedrock alcoves. c. Interpretative cross-section of the formation of DJP slope streaks/water tracks (Head et al. Reference Head, Marchant, Dickson, Levy and Morgan2007a).

Snow and ice in alcoves, channels and polygons: Polygon troughs serve as traps for annual and wind-blown snow (Figs 5 & 6a) and can channel meltwater to produce dark fringes and distal dark slope streaks (Levy et al. Reference Levy, Head and Marchant2008). If patches are sufficiently large (e.g. snow sequestered in alcoves and channels; Figs 5, 6a & b), meltwater generation and lateral capillary flow may progress throughout the summer season. From the margins of the source, the meltwater moves downslope in the upper dry permafrost layer, and along the top of the ice table, and wicks up into the overlying dry soil, wetting it to produce patchy to linear dampened regions known as dark slope streaks (Head et al. Reference Head, Marchant, Dickson, Levy and Morgan2007a) or water tracks (e.g. Lyons et al. Reference Lyons, Welch, Carey, Doran, Wall, Virginia, Fountain, Csatho and Tremper2005, Levy et al. Reference Levy, Fountain, Gooseff, Welch and Lyons2011) (Figs 5, 6b & c). These features wax and wane depending on: 1) the annual and seasonal abundance of snow and ice in their source regions, 2) the rate at which the snow and ice melt during peak summer, 3) the salinity of the water, 4) the properties of the soil and the resulting rate of vapour diffusion and desiccation, and 5) the microenvironment in which they occur (Marchant & Head Reference Marchant and Head2007). In the upper part of the inland mixed zone on the north-facing slopes above Don Juan Pond, slope streaks have been active and have advanced, waxed and waned over six years of observations (Head et al. Reference Head, Marchant, Dickson, Levy and Morgan2007a) (Fig. 6b & c). In Taylor Valley (Levy et al. Reference Levy, Fountain, Gooseff, Welch and Lyons2011), water tracks are generated by a combination of infiltration from melting snowpacks, melting of pore ice at the ice table beneath the water tracks, and melting of buried segregation ice formed during winter. Several orders of magnitude less water is delivered to adjacent Lake Hoare by specific water tracks than by surface stream runoff, but the solute delivery by water tracks is about equal to the mass of solutes delivered from stream flow (Gooseff et al. Reference Gooseff, McKnight, Carr and Baeseman2010, Levy et al. Reference Levy, Fountain, Gooseff, Welch and Lyons2011).
Wind-blown snow and ice can be readily trapped in gullies, alcoves, and associated channels (Figs 5, 7a & c): in the South Fork of upper Wright Valley, gullies exhibit high-elevation alcoves, intermediate elevation channels and lower elevation sedimentary fans, with channels often cutting the fans and extending to the valley floor (Fig. 7b & c). Early austral heating along the valley floors melts snow and shallow ice sequestered in the gully channel that feeds low-lying, intermittent streams (Fig. 7c & d). As summer progresses and higher temperatures influence higher altitudes, perennial snow and ice in alcoves and adjacent snow patches (Figs 7a & b, 10a & g) begin to melt and to initiate a second, more intense phase of melting and water flow in the gullies and in low-lying streams (Fig. 11); this results in significant fluvial activity and the formation of swamps/wetlands and ponds (Fig. 8b).
A gully system in the South Fork of upper Wright Valley (upper part of the inland mixed zone), illustrating snow sequestration in the source and channel, peak seasonal/daytime melting, and sediment transport (Head et al. Reference Head, Marchant, Dickson, Levy and Morgan2007b, Dickson et al. Reference Dickson, Head, Levy and Morgan2014). a. Perennial snow and ice on a terrace (large patch) and in an alcove (smaller patch at lower right) above the gully system. Note channel extending from the perennial snowpatch margin, downslope. b. Lower parts of the gully system below the perennial and alcove snow and ice seen in Fig. 7a and at the top of this image, illustrating the relationships between the channel part of the gully system (middle, bottom) and the alcove/perennial ice snow and ice deposits (above) that melt later in the summer season (see Fig. 11). c. Lower parts of the gully system (channel, fans, and wetland zone; see Fig. 8b) showing white patches of wind-blown seasonal snow sequestered in the gully channel. d. The same lower parts of the gully system (channel, fans, and wetland zone; see Fig. 7c) 12 days after the image in Fig. 7c was taken. Note that the meltwater source of sequestered channel snow has been exhausted, the hyporheic has retreated to the channel, and the wetland area has dehydrated and decreased in extent due to evaporation of soil moisture in the hyperarid environment.

The hyporheic zone associated with streams. a. Block diagram illustrating the role of the hyporheic zone in water and ice migration and storage, chemical alteration, solute storage and migration, ecosystem development, and relation to seasonal melting processes forming ephemeral streams. The important role of the shallow ice table that forms an aquiclude, perched aquifer and horizontally stratified hydrologic system, is illustrated. This diagram does not portray a specific time, but rather the integrated features and processes. b. Relationship of surface features in a gully system to the perched aquifer and the hyporheic zone (meltwater source associated with sequestered snow in alcove, channel, fan, and swampy area/pond on the valley floor).

Water in the hyporheic zone: Snow patches trapped in larger alcoves and gully channels in the inland mixed and coastal thaw zones also undergo seasonal melting and can produce discontinuous to continuous flow within the channels to yield transient streams (Head et al. Reference Head, Marchant, Dickson, Levy and Morgan2007b); when the wetted zones that form dark fringes occur in association with these streams (Fig. 8a), they are known as hyporheic zones (the wetted region below and adjacent to areas of stream flow). The nature of hyporheic zones (Fig. 8a) further illustrates the behaviour of liquid water in this horizontally stratified hydrologic system. Lack of vegetation in the MDV permits the direct observation of the development of hyporheic zones adjacent to streams. An important aspect of the hyporheic zone is the nature and rates of exchange of stream water and the consequences for geological and biogeochemical processes, factors that can be studied by stream tracer experiments and stable isotope analyses. Analyses of tracer experiments on two MDV glacier meltwater streams (Huey Creek, Green Creek, McKnight et al. Reference McKnight, Niyogi, Alger, Bomblies, Conovitz and Tate1999) showed that the porous nature of the alluvium in streambeds permitted rapid rates of near-stream hyporheic exchange, with the consequences of: 1) increased local weathering rates of streambed material (relative to temperate watersheds outside Antarctica) (Lyons et al. Reference Lyons, Howard-Williams and Hawes1997, Nezat et al. Reference Nezat, Lyons and Welch2001, Gooseff et al. Reference Gooseff, McKnight, Lyons and Blum2002, Maurice et al. Reference Maurice, McKnight, Leff, Fulghum and Gooseff2002, Harris et al. Reference Harris, Carey, Lyons, Welch and Fountain2007) and 2) increased downstream nutrient uptake (McKnight et al. Reference McKnight, Niyogi, Alger, Bomblies, Conovitz and Tate1999, Virginia & Wall Reference Virginia and Wall1999).
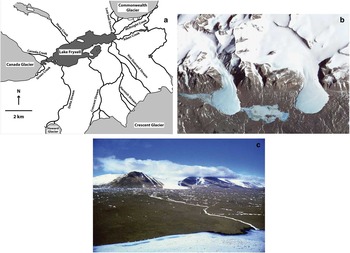
Glacial ice: With very low snowfall, contributions to the groundwater system in the MDV are often limited to the dark fringes and slope streaks associated with melting of sequestered snow and ice, and from melting alpine glaciers in the adjacent uplands (Fig. 9), particularly glaciers that occur in the relatively warm inland mixed and coastal thaw zones. During a period of 6–12 weeks in peak summer, favourable insolation geometry causes melting of glacial ice, meltwater drainage into adjacent areas, and downslope transport in stream channels floored by sandy alluvium (Conovitz et al. Reference Conovitz, McKnight, MacDonald, Fountain and House1998). Discharge during this time ranges from peaks on the order of 100 litres s-1 (or more in the case of the Garwood and Onyx rivers) to extended periods of no flow; this stream flow is the main source of water and nutrients for the ice-covered (4–6 m thick) closed-basin lakes (Fig. 9a–c), which lose water primarily by ablation (Chinn Reference Chinn1993).
Melting of glacial snow and ice as a major source of meltwater in the McMurdo Dry Valleys. a. Distribution of glacier-fed streams feeding Lake Fryxell (after McKnight et al. Reference McKnight, Niyogi, Alger, Bomblies, Conovitz and Tate1999). b. Satellite image of Canada (left) and Commonwealth (right) glaciers, the sources of parts of the meltwater feeding Lake Fryxell (lower centre). c. Perspective view of glaciers and a meltwater stream feeding Lake Fryxell. (Courtesy of Diane McKnight).
Frozen meltwater and active-layer ice cement: At the onset of glacial melting, the active layer in stream channels and adjacent hyporheic zones still contain frozen meltwater from the previous summer (Fig. 8a). Despite the generally high porosity of the streambed alluvium, the amount of unoccupied pore space in the streambed is at a minimum early in the season, but becomes greater as the active-layer ice from the previous season undergoes warming and melting. By late November to early December, flow in these streams becomes continuous and the surface is wetted throughout the remainder of the season. Over the course of several weeks during this period, the lateral wetted zones of the hyporheic zones appear, first discontinuously and thereafter more continuously. The water frozen in the active layer from previous summer thaws and contributes to the hyporheic zone meltwater volume, ultimately melting down to permafrost depths of 30–70 cm as the thermal wave from peak summer temperatures penetrates to depth. The permafrost layer acts as a barrier to further vertical movement and infiltration of the meltwater (an aquiclude), and meltwater is forced to move downslope by surface flow in the active layer, over the ice table (Fig. 8a), and laterally and vertically by capillary action.
Storage of water in the hyporheic zone: Storage of water in the high-porosity hyporheic zone (Fig. 8a) represents a significant reservoir (estimated by Gooseff et al. Reference Gooseff, McKnight, Carr and Baeseman2010, as 11088 m3 for 11.2 km long Delta Stream and 990 m3 for the ~1 km long Green Creek) (therefore, ~1 m3/m). During relatively cold summers, the amount of meltwater in hyporheic zones can be up to several times the amount of water in the stream channels themselves (e.g. McKnight et al. Reference McKnight, Niyogi, Alger, Bomblies, Conovitz and Tate1999). Gooseff et al. (Reference Gooseff, McKnight, Carr and Baeseman2010) describe hyporheic zone cross-sectional areas of up to 12 m3/m in some MDV streambeds; combined with a porosity of the order of 0.33, this suggests of the order of 4 m3/m of available space for water in the streambed hyporheic zone. Stream hyporheic zones can extend laterally for several metres on each side of active streams and are up to 70 cm deep. Gooseff et al. (Reference Gooseff, McKnight, Carr and Baeseman2010) subdivided the hyporheic zone into two components (Fig. 8a): 1) near-stream and 2) extended, and characterized water exchange using stream tracer experiments. Water residing in the extended component of the hyporheic zone is much more isotopically enriched than stream water, suggesting a longer residence time during which fractionation has occurred due to summer evaporation and winter sublimation of hyporheic water and ice. Later in the flow season, less-enriched water was found in the extended hyporheic zone, suggesting that stream water can be exchanged into and out of this zone on timescales of weeks to months. Using the OTIS transient storage model, Gooseff et al. (Reference Gooseff, McKnight, Carr and Baeseman2010) characterized the exchange of stream water with the extended hyporheic zone and found that the near-stream component of the hyporheic zone had exchange rates generally an order of magnitude higher (10-5 s-1) than the extended part of the hyporheic zone (Fig. 8a). These results underline the importance of two timescales of hydrologic and biogeochemical exchange in Antarctic streams: 1) near-stream zones of rapid exchange, and 2) extended zones in which slower water fraction and biogeochemical reaction rates occur and can influence stream water chemistry on longer timescales.
These various snow and ice microenvironments (Fig. 5) can serve as sources of meltwater if temperatures exceed melting during peak seasonal and daytime periods of insolation. When melting occurs, meltwater from various sources can combine together to produce ephemeral streams and rivers, and perennial ice-covered ponds and lakes. Meltwater is trapped in the upper dry active layer by the ice-table aquiclude (Figs 4d & 8).
McMurdo Dry Valleys hydrologic system: summary
In contrast to temperate climates (Fig. 4a & c), the regional hydrological system in the MDV is horizontally stratified (Fig. 4b & d); deep groundwater lies below a permafrost layer and is not in contact with the surface or ephemeral streams (Chinn Reference Chinn1993). The presence of a regional permafrost layer creates an aquiclude that traps the limited surface water produced by melting of surface snow and ice, and restricts groundwater flow to the active layer (in the largely dry layer lying above the ice table). Liquid water travels on and in the perched aquifer (Figs 4b & d, 5 & 8) and may be wicked up through capillary action (Fig. 6b & c). Recognizable geomorphic features (Fig. 5) range from local dark fringes around melting snow patches, to dark slope streaks on slopes below larger accumulations of melting snow and ice (Fig. 6b & c), to surface channelization (streams) where additional snowmelt and glacial meltwater flows (Fig. 7) and soaks into the regions adjacent to the streams (Fig. 7b & c) (hyporheic zones; Fig. 8a & b). This meltwater can move in the shallow subsurface above the ice table (Fig. 4b & d), often wicking to the surface in low-lying areas to produce small ponds and their wetted perimeters (Gooseff et al. Reference Gooseff, McKnight, Carr and Baeseman2010) (Fig. 8b). This shallow perched water table geometry has important consequences for fluvial and lacustrine systems and processes, and the distribution and abundance of life in the MDV (McKnight et al. Reference McKnight, Niyogi, Alger, Bomblies, Conovitz and Tate1999).
Fluvial processes
Basic definitions and principles of fluvial processes in humid zones
Fluvial processes involve the action of liquid water flowing in streams and rivers and the processes and deposits associated with them. Fluvial processes are distinguished from sediment flows, which generally maintain grain-to-grain contact during their movement. In temperate climates (Fig. 4a & c), liquid water is commonly derived from pluvial (rainwater) activity; pluvial activity tends to be variable over the short-term (mist to heavy rain) and irregular over longer term (seasonal or annual variations). In general, the majority of rainfall is returned to the atmosphere by evaporation and transpiration, a small amount infiltrates into the soil, and the remainder forms runoff across the surface, first in overland sheet-like flow and then forming into narrow distributary channels in which the stream flow is concentrated. Fluvial activity can be measured in terms of stream discharge, the amount of water flowing at a point in the channel over a given time. Because water supply is irregular, stream discharge during and following peak pluvial activity can exceed the carrying capacity of the channel, and flooding occurs, increasing velocity and altering the stream cross-sectional area. Stream hydrographs (stream discharge as a function of time) map these variables and relationships in reference to base flow, and flood frequency curves (annual maximum discharge versus recurrence interval) provide a longer-term view of peak flood processes. Fluvial processes in temperate climates dominate the evolution of the landscape due to the abundance of pluvial activity and the consequence of its drainage, chemical and physical erosion and transport, and its influence on a host of other processes (Fig. 4a).
Fluvial processes in the McMurdo Dry Valleys
In contrast to temperate climates (Fig. 4a & c), there is no pluvial (rainfall) activity in the hyperarid, hypothermal MDV (Fig. 4b & d). Delivery of water to the surface is by direct snowfall in very small amounts (3–50 mm a-1 water equivalent in the MDV; Fountain et al. Reference Fountain, Nylen, Monaghan, Basagic and Bromwich2009) and from snow transported off the polar plateau by drainage winds (Speirs et al. Reference Speirs, Steinhoff, McGowan, Bromwich and Monaghan2010). Snowfall can drift and be sequestered in topographic traps and wind shadows (Fig. 5). Long-term snow and ice accumulation results in the formation of perennial snowbanks and glaciers, and their seasonal melting represents the major source of liquid water for fluvial activity (Fig. 5). Drainage basins are limited to the zones of snow and ice accumulation (alcoves, depressions, lee of obstacles, and glacier surfaces; Fig. 5) and are therefore insignificant in area compared to highly integrated basins in temperate climates. Although regional topography is inherited from earlier times (Sugden et al. Reference Sugden, Marchant, Potter, Souchez, Denton, Swisher and Tison1995), due to localized water sources, short stream lengths, and the locally immature topography of the MDV, stream order is very low (Fig. 9a & c), and streams tend to form ice-covered, closed-basin lakes (Fig. 9c).
The role of McMurdo Dry Valleys microenvironments in fluvial processes
The range of microenvironments in the MDV results in significant variation in fluvial processes within the MDV (Marchant & Head Reference Marchant and Head2007). In the SUZ (Marchant & Head Reference Marchant and Head2007), temperatures are sufficiently cold both annually and seasonally that meltwater is generally absent, and limited to the immediate margins of and surfaces of solar-heated, low albedo rocks; consequently, typical fluvial activity does not occur in the SUZ. In the inland mixed zone and coastal thaw zone (Marchant & Head Reference Marchant and Head2007, Marchant et al. Reference Marchant, Mackay, Lamp, Hayden and Head2013), streams are minimal in number, drainage basins are by definition small (limited to areas where perennial or annual snow deposits are sequestered), and streams are of low order (virtually all of first order). Recharge zones are limited to perennial and annual snow patches trapped in scarps, alcoves, and gully channels that undergo top-down melting (Figs 5, 8b, 10) (Head et al. Reference Head, Marchant, Dickson, Levy and Morgan2007b). Due to the low volume of liquid meltwater introduced into the fluvial system, and the lack of both vegetation and an intensely weathered water-related surface soil layer, initial meltwater percolates vertically downward, wetting the dry active layer (Fig. 6c), and also migrates laterally to create the wetted, hyporheic zone along the margins of stream channels (Figs 7c, 10b & c). Initial stages of melting are dominated by infiltration processes (Fig. 10b–d) until either 1) the hyporheic zone is locally saturated or 2) the meltwater supply rate exceeds the infiltration capacity of the substrate, and overland flow ensues in the channel (Head et al. Reference Head, Marchant, Dickson, Levy and Morgan2007b) (Fig. 10b, d, f). Downstream migration of water flow progresses in fits and starts, as tongues of overland flow lose water to the dry active layer in the streambed by lateral and distal infiltration (Fig. 10d) to create an expanded hyporheic zone (Figs 8a, 10c & f). Following this early phase, and exhaustion of wind-blown snow and ice water sources in the channel, dehydration of the channel and hyporheic zone takes place (Fig. 11, top). Later, as seasonal temperatures rise and melting temperatures reach higher altitudes, the perennial snowbank and alcove water sources in and above the alcove melt due to PDTs above 0°C and produce significant daily pulses of stream activity and erosion (Fig. 11, bottom) (Dickson et al. Reference Dickson, Head, Levy and Morgan2014). Thus, melting of wind-blown snow and ice in the South Fork gully channel (Fig. 7c–d, 10a–g) early in the season is replaced later in the season by much higher flux daily meltwater pulses (Fig. 11, bottom) due to melting of the perennial snow on the plateau and in the alcove.
Details of melting, stream flow, and hyporheic zone development in the gully system in the South Fork of upper Wright Valley pictured in Fig. 7 (upper part of the inland mixed zone) (Head et al. Reference Head, Marchant, Dickson, Levy and Morgan2007b, Dickson et al. Reference Dickson, Head, Levy and Morgan2014). a. Small patch of seasonal snow sequestered in the channel melts and soaks into the hyporheic zone streambed above the ice table (see Fig. 8a), moves downslope in the hyporheic zone and emerges at a rocky break in slope. View is downstream. b. Multiple patches of seasonal snow accumulation melt during peak daytime temperatures and feed the stream and hyporheic zone, which is growing downstream and laterally. View is upstream. c. Downslope divergent growth of the hyporheic zone as meltwater moves along the top of the ice table due to regional slope, while the snow- and ice-filled channel extends to the left in a local meander due to local surface topography. Meltwater moving along the top of the ice table at 15–20 cm depth wicks to the surface to form a wetted extended hyporheic zone (see Fig. 8a). View is upstream. d. Surface flow across channel floor from peak daytime temperature-induced melting and flow of sequestered snow and ice in the channel. Note that the margins of the finger-like wetted areas are already soaking into the subsurface to feed the hyporheic zone. View looking obliquely upstream. e. Salts deposited following evaporation of an early lobe of meltwater (similar to that seen in Fig. 10d). Early-stage meltwater soaking into the hyporheic zone flushes salts that have been concentrated due to seasonal sublimation and dehydration (Fig. 8a); view looking upstream. f. Central part of the meltwater channel showing sediment sorting (note coarse sand in channel and pebbles in the banks) and sedimentary structures. Note damp nature of the hyporheic zone adjacent to the channel. g. Small, hand-dug pits in gully channel of gully system shown in Fig. 10d. Left pit is prior to arrival of surface meltwater; the upper few cm are dehydrated, but the lower parts are have been dampened by water moving within the hyporheic zone from earlier stream activity, and wicking up. Right pit is shortly after a phase of surface flow (see fluvial textures adjacent to the pit) (Fig. 10 d) and shows how rapidly the water soaks into the dry active layer down to the top of the ice table and evaporates from the near-surface. Water is observed in the bottom 1–2 cm of the pit, and is moving downslope just above the ice table.

Frame from time-lapse image sequence of the transient, daily pulse of meltwater that surges through the gully system following peak daily insolation and melting of the snow and ice in the perennial ice/alcove region (Fig. 7a & b). Top; in late November, the early seasonal melting of the snow and ice sequestered in the channel has ceased and the channel floor and upper hyporheic zone have become dehydrated. Bottom: as seasonal temperatures rise and melting temperatures reach higher altitudes, the perennial snowbank and alcove water sources melt due to peak daytime temperatures and produce significant daily pulses of stream activity and erosion (Dickson et al. Reference Dickson, Head, Levy and Morgan2014).

For example, in the South Fork of upper Wright Valley (upper part of the inland mixed zone; Marchant & Head Reference Marchant and Head2007) (Figs 7 & 10), temperature records (Fig. 12) show the influence of seasonal daytime temperatures on meltwater production. In late October, PDTs exceed 0°C, but daily average temperatures do not exceed 0°C until mid-November, oscillating around 3–4°C until early February, when they rapidly descend to well below 0°C. The 0°C isotherm does not penetrate to the top of the ice table (20 cm depth) until mid-December and hovers there until mid-February, where it rapidly descends to temperatures well below 0°C. These data suggest that melting of the top of the permafrost aquiclude (the ice table) provides a small contribution to meltwater and stream flow compared to melting of surface snow and ice reservoirs (Fig. 5). These records illustrate the two phases of meltwater production for the gully in the South Fork of upper Wright Valley (Figs 7 & 10). Early PDTs (late October–mid-November) melt snow sequestered in the gully channel (Figs 7c & d, 10a–g), causing low-flux pulses of meltwater (Fig. 10d), and annual development of the wetted hyporheic zone. As daily average surface temperatures exceed 0°C in December, melting of the high altitude snow and ice sequestered in the alcove and perennial ice cover (Fig. 7a & b) causes daily pulses of meltwater with peak fluxes much higher (Fig. 11) than earlier melting of channel snow patches (Fig. 10a–g). These later daily pulses feed the wetlands and ponds at the bottom of the valleys (Fig. 8b). In contrast, in Beacon Valley (the stable upland microclimate zone; Marchant & Head Reference Marchant and Head2007), note the slow rise in temperature away from the winter mean of less than ~-30°C starting in mid-September; temperatures in late December–January approach and occasionally exceed 0°C, but these are not sufficiently high or of sufficient duration to cause melting of ice and snow, other than local surface snow on low-albedo rocks (e.g. Marchant & Head Reference Marchant and Head2007, Head et al. Reference Head, Kreslavsky and Marchant2011). Compare this record for the stable upland microclimate zone (Marchant & Head Reference Marchant and Head2007), where significant seasonal melting does not occur, with the duration of temperatures above 0°C in the upper part of the inland mixed microclimate zone, where melting and gully formation is first observed (Fig. 12a). This comparison shows why there are no gully ephemeral streams in the SUZ, but local ephemeral streams in the inland mixed zone (Marchant & Head Reference Marchant and Head2007).
Seasonal and annual temperature records in the McMurdo Dry Valleys. a. Temperature records (daily average temperatures) for the South Fork of upper Wright Valley (upper part of the inland mixed zone; Marchant & Head Reference Marchant and Head2007) for the 2009–10 summer. This is the same area as illustrated in Figs 7 & 10 and shows the influence of seasonal daytime temperatures on meltwater production. Measurements are made at the surface (0 cm; red line) and 20 cm below the surface in soil at the top of the ice table during the sensor installation (blue line). b. Daily average temperature in Beacon Valley (the stable upland microclimate zone; Marchant & Head Reference Marchant and Head2007) for the year 2007 (see Kowalewski et al. Reference Kowalewski, Marchant, Levy and Head2006, Reference Kowalewski, Marchant, Swanger and Head2011, Reference Kowalewski, Marchant, Head and Jackson2012).

Behaviour of meltwater and discharge
Often, advancing tongues of meltwater in channels can be seen to retreat as the infiltration rate varies (or the infiltration capacity of the stream floor sediments changes) (Fig. 10d). During periods of decreased insolation (diurnal temperature variations or cloudy periods), surface temperature drops, melting decreases, and standing and running water in the channel freezes over. Portions of the hyporheic zone dehydrate by evaporation, particularly the distal sands in the channel fans, creating a dry layer a few cm thick above the hyporheic zone (Fig. 10g, left). This zone increases in thickness with increasing duration between recharge events. Base flow through active-layer sediments occurs at three scales. First, locally in the stream bed, the flux is insufficient to overcome the infiltration capacity of the channel sediment, and meltwater sinks into the substrate and remerges a few metres down-channel in springs at a topographic step caused by the presence of rocks (Fig. 10a). Secondly, at the valley bottoms, wet-topped polygons form creating a “spongy wetlands” area where patches of water can be seen to emerge at the surface (Figs 7b–d, 8b). Thirdly, water continues to travel along the ice table in the valley floor until it reaches the low point where it can intersect the surface, forming a local pond (Fig. 8b). The pond water level waxes and wanes depending on the amount of infiltration, and transport along the hyporheic zone above the ice table (Gooseff et al. Reference Gooseff, McKnight, Carr and Baeseman2010). As winter returns (Fig. 12), water remaining in the stream and hyporheic zone freezes; most of this ice sublimates, but some remains sequestered until melting conditions return the following year (Fig. 8a).
In the coastal thaw zone, seasonal atmospheric temperatures exceed 0°C and widespread melting of surface snow and subsurface ice in soils can occur. Additionally, in this region, cold-based alpine and piedmont glaciers extend to low elevations (Figs 9 & 13) and can undergo significant top-down and near-surface melting due to solid-state greenhouse effects creating the meltwater that feeds the vast majority of ephemeral streams and associated hyporheic zones, and ultimately flows into the lakes (Figs 9 & 13). The combination of cold ice and low surface meltwater flux means that some meltwater refreezes in surface crevasses, though most drains laterally across the top of the ice, and is shed at the front and margins of the glacier (Fountain et al. Reference Fountain, Lewis and Doran1999). Meltwater generation is significantly influenced by the geometry of the glacier relative to solar insolation (Dana et al. Reference Dana, Wharton and Dubayah1998, Fountain et al. Reference Fountain, Lewis and Doran1999) (Fig. 13). There is also evidence that significant melting can take place below the solid surface in the upper metre of the glacial ice by absorption of solar radiation along crystal boundaries (Fountain et al. Reference Fountain, Lewis and Doran1999). Glacial meltwater cascades off the edge of the ice, often in waterfalls, and drains downslope in streams (Atkins & Dickinson Reference Atkins and Dickinson2007) (Fig. 9). Most streams are of low order and flow into closed-basin lakes (Fig. 9a) (Chinn Reference Chinn1993, Bencala Reference Bencala2000, Gooseff et al. Reference Gooseff, McKnight, Carr and Baeseman2010). Chemical weathering is highly concentrated in stream channels and the hyporheic zone (Fig. 8) (Nezat et al. Reference Nezat, Lyons and Welch2001, Maurice et al. Reference Maurice, McKnight, Leff, Fulghum and Gooseff2002) and the large areas of terrain between channels (Figs 5, 7 & 8b) are unaffected and unmodified by fluvial and related activity. Because meltwater runoff is seasonally centralized in these narrow areas, they become focal points for ecosystem development during wet periods (McKnight et al. Reference McKnight, Niyogi, Alger, Bomblies, Conovitz and Tate1999), and on longer timescales become ecological legacies for the sustenance and reactivation of ecosystems.
Derivation of glacial meltwater in the McMurdo Dry Valleys. Block diagram illustrating the complex relationships between atmospheric temperature, altitude, snow and ice accumulation and flow, glacial melting, stream flow and lake levels (e.g. Fountain et al. Reference Fountain, Lewis and Doran1999).

In lower Wright Valley, meltwater from Wright Lower Glacier is impounded behind a moraine complex, forming Lake Brownsworth. Drainage from Lake Brownsworth, in turn, forms the ~35 km long Onyx River that flows into Lake Vanda, a closed-basin lake toward the western end of central Wright Valley. Regional analysis of the Onyx River has defined three reaches (bedrock incision, moraine breaches and alluvial) whose slopes are controlled by antecedent geomorphological events (Shaw & Healy Reference Shaw and Healy1980). The immature nature of the Onyx River retains a memory of recent antecedent climatic events and can thus be used to compare fluvial histories between valleys (Shaw & Healy Reference Shaw and Healy1980).
McMurdo Dry Valleys fluvial processes: summary
In contrast to temperate climates, fluvial processes in the MDV (and thus a host of weathering, erosion and transport processes there) are severely limited due to the lack of rainfall. Fluvial activity is absent in the SUZ, seasonal and intermittent in the inland mixed zone, and often continuous but ephemeral in the coastal thaw zone (Marchant & Head Reference Marchant and Head2007). The limited sources of meltwater generate very local streams and hyporheic zones (Fig. 8), serving to concentrate chemical weathering processes and biological ecosystems. The horizontally stratified hydrologic system (Fig. 4b & d) means that meltwater is constrained to flow in a very shallow perched aquifer formed within the largely dry active layer on top of the ice table (e.g. an aquiclude). These conditions, and this configuration, are among the major factors that preserve and fossilize geomorphic features and landscapes in portions of the MDV (e.g. Denton et al. Reference Denton, Sugden, Marchant, Hall and Wilch1993, Sugden et al. Reference Sugden, Marchant and Denton1993, Reference Sugden, Marchant, Potter, Souchez, Denton, Swisher and Tison1995, Reference Sugden, Summerfield, Denton, Wilch, McIntosh, Marchant and Rutford1999, Marchant & Head Reference Marchant and Head2007).
Lacustrine processes
Basic definitions and principles of lacustrine processes in humid zones
Lakes and ponds are standing bodies of water lying in topographically low areas that form from the impoundment of stream and river water, and/or the intersection of the water table with the land surface (Fig. 4a). From the perspective of geological time, ponds and lakes tend to be transient features related to the history of active planation processes. For example, rapid planation of a regional surface by continental glaciation can completely disrupt pre-existing mature drainage networks, initiating a phase of abundant lake formation (abundant local lows filled with water on a regionally shallow topographic gradient); as the landscape develops more integrated and mature drainage patterns, lakes integrate, drain, and give way to well-ordered fluvial drainage networks. With time, ponds and lakes become filled with sediment, changing stream gradients and water table geometries. Lakes can be subdivided into several types: open-basin lakes are both fed and drained by streams; closed-basin lakes (endorheic) have a river or stream input, but no fluvial drainage. Lakes and ponds can also be described and characterized by their area and volume, catchment area, stratification and circulation, seasonal behaviour (freezing), acidity, salinity, type of sedimentation, and their biological viability and productivity. Ponds and lakes gain and lose water by fluvial and groundwater input and output, and additionally lose water by evaporation (Fig. 4a). Excessive evaporation over input can cause reduction in lake levels and desiccation; in arid climates this can result in the progressive concentration of salts and the production of the classic saline lake sequence of evaporite deposits as a function of unidirectional salinization, ultimately producing a saltpan, or playa.
Due to the stability of the water column in lakes and the distinctive temperature/density relationship of water, lakes are stratified into layers (thermoclines) of different temperature with depth. In temperate climates, surface waters cool and become more dense (to the maximum water density at 4.1ºC) in the winter and can thus overturn and mix seasonally, exchanging oxygen with deeper waters. In tropical areas, surface waters may never reach maximum density and lakes can remain heavily stratified. The high specific heat capacity of lake water can serve to both warm and cool surrounding regions depending on ambient daily or seasonal air temperatures. Temperate climates, with their moderate seasonal temperature ranges, abundant liquid water and fluvial activity, and common immature landscapes due to recent continental glaciation, are host to the most abundant occurrence of lakes and ponds on Earth.
Lakes in the McMurdo Dry Valleys
More than 20 permanent lakes and ponds occur in the hyperarid and hypothermal MDV and, in contrast to temperate lakes, almost all are characterized by perennial ice cover up to 6 m thick, overlying liquid lake water (Figs 5 & 9c) (Mikucki et al. Reference Mikucki, Lyons, Hawes, Lanoil and Doran2010). Ice cover serves to: 1) limit exchange of gases between the lake and the atmosphere, 2) restrict sediment deposition in the lake, 3) reduce light penetration, and 4) minimize wind-generated currents (Doran et al. Reference Doran, Wharton and Lyons1994). Lake levels have been rising in the recent past at about 15 cm a-1 (Chinn Reference Chinn1993), a trend initially interpreted to be due to a corresponding increase in summertime surface air temperature (Wharton et al. Reference Wharton, McKay, Clow, Andersen, Simmons and Love1992).
McMurdo Dry Valleys lacustrine types: Chinn (Reference Chinn1993) subdivided lakes in the MDV into several hydrological types: 1) Wet-based lakes: These lakes do not freeze to the ground during winter and have either permanent, seasonal or no ice cover. Summer inflow of meltwater beneath the ice cover causes lake levels to rise seasonally and they lower from sublimation of the ice cover and evaporation of the summer meltwater moat. 2) Dry-based lakes: These include ice-block lakes that are permanently frozen through to the lakebed. Ice thicknesses may far exceed those in wet-based lakes and such lakes rise by addition of meltwater by flooding on top of the ice surface, and fall by ablation of the surface. Some dry-based lakes may have a thin film of highly saline water at their base (Doran et al. Reference Doran, Wharton and Lyons1994, Reference Doran, Fritsen, McKay, Priscu and Adams2003, Reference Doran, Priscu, Lyons, Powell, Anderson and Poreda2004). 3) Ice-free lakes: These small lakes, such as Don Juan Pond, are very highly saline, and usually do not freeze even in winter. Chinn (Reference Chinn1993) further subdivided MDV lakes on the basis of their openness and associations as follows: 1) Enclosed lakes: No surface outflow (also known as closed-basin lakes). Summer inflow is balanced by annual sublimation and evaporation and such lakes are usually warm, saline, and meromictic. 2) Lakes with throughflow: Lakes that overflow into outlet streams (also known as open-basin lakes), have relatively stable levels, and are commonly not saline. 3) Epiglacial lakes: These lakes are on or adjacent to and against glaciers.
How do the MDV lakes differ from typical temperate lakes? First, the MDV lakes lie on top of a 200–300 m thick permafrost layer (Fig. 5) and thus should freeze solid due to the underlying permafrost and the mean annual surface air temperature of ~ -20°C. However, very finely tuned conditions lead to the present characteristics of MDV wet-based lakes. Key to the heat balance and survival of the liquid water is the input of summer meltwater to the lake and the presence of an “insulating” ice cover. Despite wide variations in depths in the MDV wet-based lakes, surface ice-layer thicknesses are relatively constant from place to place in a given air-temperature regime. Ice thickness is primarily determined by ablation; in winter, ice is added to the bottom of the layer and in summer the thickness is reduced by surface ablation. Latent heat is released during winter freezing of water to the base, and is conducted up through the ice layer to the surface where it balances heat loss from the ablating surface. This generally maintains a steady-state thickness, recycling the ice cover (typically ~3 m thick) in about 10 years (McKay et al. Reference McKay, Clow, Wharton and Squyres1985).
In closed-basin lakes in general, lake level fluctuations are caused by imbalances between input and evaporation (sublimation from the lake ice in the case of MDV lakes). Because of this sensitive balance, a very important characteristic of closed-basin lakes is that they tend to magnify even minor climate signals and are thus known as “amplifier” lakes (Hall et al. Reference Hall, Denton and Overturf2001). Although there is great promise in using the record of changing lake levels in these amplifier lakes to study climate change on recent and geological timescales, the specific relationships between climate and lake levels has not yet been determined in detail (Hall et al. 2010).
Sources of water feeding lakes and relation to climate history: Where does the water come from and under what conditions is excess meltwater produced to form these lakes (Fig. 5) and cause modifications in their levels (Fig. 13)? The dominant means of supply (meltwater) and loss (ablation) are clearly seasonally and climatically controlled in the MDV. It is clear that small perturbations to the climate system can result in large changes in lake systems, often in non-intuitive ways (Chinn Reference Chinn1993, Hall et al. 2010). The role of deep groundwater influx into the floors of some lakes has been debated, but appears to be minor and localized to “hot lakes” (Weand et al. Reference Weand, Fortner, Hoehn and Parker1975, Chinn Reference Chinn1993). Most recently, MDV lake levels have risen consistently since they were first observed in the early 1900s, and there is a positive correlation with the order of magnitude increase in meltwater inflow, and constant ablation (Chinn Reference Chinn1993).
Clearly, the main source of meltwater supply in the MDV is from top-down glacial meltwater production (Figs 8b, 9, 13), but this is not a simple function of increasing surface air temperature in the MDV (Chinn Reference Chinn1993). Chinn (Reference Chinn1993), Hall & Denton (Reference Hall and Denton1996), Fountain et al. (Reference Fountain, Lewis and Doran1999, Reference Fountain, Neumann, Glenn and Chinn2004), Hendy (Reference Hendy2000), Hall et al. (Reference Hall, Denton and Overturf2001) and Hall et al. (2010) have all discussed the complex and sometimes conflicting effects of changes in surface temperature, wind patterns, cloudiness, surface snowfall, albedo, glacial advance and retreat and position of the ablation zone, melting, stream flow, ablation rates, and lake levels. The observed positive correlation between increased lake levels and stream flow is thought to represent a complex relationship with the climate-related behaviour of glaciers, specifically depending on the distribution of glacier area with elevation in the watershed (Chinn Reference Chinn1993, Fountain et al. Reference Fountain, Neumann, Glenn and Chinn2004) (Fig. 13). As the atmospheric 0°C isotherm rises seasonally in altitude, glaciers will be encountered and melting will begin in a complex non-linear manner (Dana et al. Reference Dana, Wharton and Dubayah1998, Fountain et al. Reference Fountain, Lewis and Doran1999), feeding stream flow. The rate of stream flow will increase as seasonal warming brings the melting temperature up to the specific elevation that represents the maximum glacier area per elevation contour in the ablation zone. Thus, the elevation of the base of individual glaciers can have a large influence on the timing and volume of meltwater generation and stream flow; larger piedmont glaciers can be more important than higher-altitude alpine glaciers, and their collective effects (in terms of the maximum glacier area per elevation contour in the ablation zone) can also exert a strong influence on peak flow rates. These types of variables (Fig. 13) are among the factors that help to explain the individual behaviour of specific stream fluxes and lake levels (Chinn Reference Chinn1993, Dana et al. Reference Dana, Wharton and Dubayah1998, Fountain et al. Reference Fountain, Lewis and Doran1999, Reference Fountain, Neumann, Glenn and Chinn2004).
Furthermore, viewed historically, the longer term waxing and waning of lake levels may be related to the long-term response of glacial hypsometry (Fig. 13): increased precipitation can lead to increased accumulation, and with time, this translates into increased flow and descent of glaciers to lower elevations, where they may be more susceptible to melting. The estimated timescale response of the MDV glaciers is of the order 103 years (Fountain et al. Reference Fountain, Lewis and Doran1999), so current melting behaviour may be due to a characteristic glacial hypsometry that is the net result of climatic changes that occurred long ago. Deconvolving climate signals from meltwater fluxes and lake levels clearly needs to account for evolving glacial hypsometry (accumulation rates, wind velocities, flow behaviour, ice softening, rates of advancement, equilibrium line migration, insolation geometry and net amounts of melting) (Fig. 13) (Dana et al. Reference Dana, Wharton and Dubayah1998, Fountain et al. Reference Fountain, Lewis and Doran1999, Reference Fountain, Neumann, Glenn and Chinn2004).
The role of local settings e.g. Don Juan Pond. In some cases, local environments can cause extreme conditions to develop in MDV lakes and ponds. For example, while sodium is the major cation in most lakes (most likely derived primarily from marine aerosols), calcium is dominant in Lake Vanda and Don Juan Pond (Torii & Yamagata Reference Torii and Yamagata1981). Don Juan Pond, generally measuring about 100x300 m and 10 cm deep, is characterized by the highest salinity among lakes in Antarctica (Torii et al. Reference Torii, Murata and Yamagata1981), a nearly saturated solution of calcium chloride that remains unfrozen down to extremely low winter temperatures (~-50°C). Its water source is unusual in that in contrast to glacier meltwater-fed streams and lakes elsewhere in the MDV, and especially in Taylor Valley, no nearby glaciers serve as meltwater sources. Precipitation accounts for 15–30% of the input, with the remainder from meltwater streams that enter from the west and from groundwater discharge from a confined aquifer below (Harris et al. Reference Harris, Cartwright and Torii1979). Recent work suggests that melting of snowpack could contribute to water influx along the top of the ice table (Head et al. Reference Head, Marchant, Dickson, Levy and Morgan2007a, Reference Head, Marchant, Dickson, Levy and Morgan2007b). Because of these relationships and its unusual setting, Don Juan Pond is in a precarious hydrological equilibrium (Chinn Reference Chinn1993); if either the stream flow or groundwater influx ceased, the pond would dry up within a year (Harris et al. Reference Harris, Cartwright and Torii1979, Harris & Cartwright Reference Harris and Cartwright1981). Occasional and rapid oscillation of the pond level is correlated with strong winds.
Dickson et al. (Reference Dickson, Head, Levy and Marchant2013) presented time-lapse image data and meteorological measurements that underline the importance of deliquescence within the watershed of Don Juan Pond, and may account for the unusual CaCl2 brines. They show that brines presently in the soil rapidly hydrate during periods of high relative humidity (RH), and together with small amounts of meltwater from gully-related (Head et al. Reference Head, Marchant, Dickson, Levy and Morgan2007a) water transport along the ice table, are capable of generating brines that control summertime water levels in Don Juan Pond. Groundwater input was not observed.
McMurdo Dry Valleys lakes: summary
Lakes and ponds in temperate areas (Fig. 4a & c) are largely of pluvial origin and characterized by abundant vegetation, large drainage basins and higher order streams delivering rainwater. In contrast, the hyperarid, hypothermal conditions in the MDV (Fig. 4b & d) mean that there is no rainfall, that water sources are limited primarily to meltwater from cold-based glacier surfaces (Fig. 9), that flow into the lakes is seasonal and highly variable, being related to changing and sluggish response to glacial hypsometry (Fig. 13), itself a function of changing climate. Lake level fluctuations are caused by imbalances between meltwater input and sublimation from the ice surface, and this sensitive balance tends to magnify even minor climate signals. The MDV amplifier lakes are thus excellent laboratories for the study of lakes in extreme geological and biological environments, and unique systems like Don Juan Pond offer the opportunity to study end-member enrichment processes.
Synthesis and discussion
This framework of seasonal melting and groundwater/fluvial/lacustrine processes in an otherwise hyperarid, hypothermal Mars-like Antarctic environment (Chinn Reference Chinn1993, Dana et al. Reference Dana, Wharton and Dubayah1998, Fountain et al. Reference Fountain, Lewis and Doran1999, Marchant & Head Reference Marchant and Head2007) provides a baseline of environmental conditions to test the hypothesis that a “cold and icy” Late Noachian Mars (Fig. 3) (Forget et al. Reference Forget, Wordsworth, Millour, Madeleine, Kerber, Leconte, Marcq and Haberle2013, Wordsworth et al. Reference Wordsworth, Forget, Millour, Head, Madeleine and Charnay2013) might produce the observed fluvial and lacustrine features (e.g. Fassett & Head Reference Fassett and Head2008a, Reference Fassett and Head2008b) during transient warming periods. On the basis of the synthesis of MDV climate settings, microenvironments and groundwater, fluvial and lacustrine processes, we highlight the following summary points that are relevant to analysis and further understanding of a possible cold and icy Noachian climate on Mars.
McMurdo Dry Valleys hydrological system and cycle
-
1. Mean annual air temperature is sufficiently low (~-14 to -30°C) (Fig. 11) that the MDV are characterized by a continuous permafrost layer estimated to be several hundred metres thick.
-
2. Much of the permafrost layer is occupied by ice cement, with an upper dry layer tens of centimetres thick that is in diffusive equilibrium with the atmosphere (Fig. 4d).
-
3. The hyperarid, hypothermal environment of the MDV thus creates a hydrologic system that is horizontally stratified (surface water separated from deep groundwater by a continuous permafrost layer; Fig. 4b), in contrast to a vertically integrated hydrologic system typical of temperate climates (Fig. 4a).
-
4. The configuration of the horizontally stratified hydrologic system (Fig. 4b & d) means that the near-surface hydrologic cycle is transient and forms on an aquiclude, creating a perched aquifer; meltwater travels along the top of and within the largely dry active layer, and its depth of penetration is limited by the ice table. Meltwater locally wets the usually dry active layer, often to the ice table, and moves down the gravity gradient, in directions dictated by the slope of the ice table surface.
-
5. The configuration of water sources are predominantly local (Fig. 5) and their behaviour has different consequences for geomorphic features (gullies, lakes, etc.) and amounts/fluxes of water.
-
6. Despite the broad constancy of environmental conditions in the MDV on a global high-latitude scale, microclimate zones there create different geomorphic variations that are sensitive to, and determined by, the presence and state of water (Figs 5 & 13).
McMurdo Dry Valleys meltwater sources and fluvial/lacustrine processes
-
1. Melting of glacial ice and snow cover can take place in hyperarid, hypothermal environments such as the MDV (Figs 4b, 5, 13), even where the mean annual temperature is well below 0°C.
-
2. Surface meltwater sources are extremely limited due to the hyperarid, hypothermal conditions; meltwater generation can be thought of as a supply-limited process.
-
3. Sources of meltwater (Fig. 5) include isolated snow patches, snow and ice patches in polygon troughs, alcoves and channels, glacial ice, frozen meltwater, and, in places, subsurface ice (Fig. 8a).
-
4. Melting of ice and snow (Fig. 5), and flow of liquid water (Fig. 10) occur annually in association with peak southern summer seasonal and daytime temperatures, which in low-lying regions can approach and sometimes exceed the melting point of water. At higher elevations, low-albedo surface rocks can be heated to temperatures well above 0°C and assist in localized melting of marginal snowdrifts. The key elements critical for melting of ice and flow of water in these environments include PSTs, PDTs (Fig. 12), insolation geometry, snow and ice altitude (Fig. 13), glacial flow rates, previous record of snow and ice in the accumulation zone, topography, and bedrock/soil characteristics. Glacial ice and its meltwater contain biogeochemical records (Tranter et al. Reference Tranter, Bagshaw, Fountain and Foreman2010). Melting of wind-blown snow and ice in the South Fork gully channel (Figs 7c & d, 10a–g) early in the season is replaced later in the season by the much higher flux daily meltwater pulses shown here when the perennial snow on the plateau and alcove are favourably oriented and above 0°C (Fig. 12a).
-
5. Meltwater from these sources can form transient/ephemeral streams and rivers that at low elevations in the MDV can do significant geomorphic work (erosion and deposition) in the vicinity of the channel (Fig. 10). Streams and rivers have immature drainage and are poorly integrated.
-
6. The hyporheic zone, associated with streams, (Fig. 8a) serves as a water/ice reservoir, a water transport pathway, a solute storage and flushing area, a zone of enhanced chemical weathering, and an oasis for biology.
-
7. Due to the lack of rainfall, intervening areas between streams are largely unaffected by surface water and retain their dry upper layer above the ice table at the top of the permafrost (Figs 7 & 8b).
-
8. These streams and rivers feed both closed- and open-basin lakes (Figs 4b, 5, 8b, 13) that are ice-covered and persist for at least thousands of years. Evaporation of lakes is severely curtailed by ice cover. The ice cover is in a delicate balance determined by a variety of environmental factors.
-
9. Under certain extreme conditions, MDV closed-basin lakes can become so saline that they do not freeze in the winter even at temperatures of -50°C (e.g. Don Juan Pond).
Working toward a conceptual model for a cold and icy Noachian Mars scenario
In the end-member “warm and wet” early Mars climate scenario (e.g. Craddock & Howard Reference Craddock and Howard2002, Craddock et al. Reference Craddock, Irwin, Howard and Latham2013), during which pluvial activity dominates, mean annual temperatures on Mars are above 0°C. There is no global permafrost layer, and the hydrologic system is vertically integrated (Fig. 2). Rainfall provides the dominant water source, and fluvial activity is long-term but stream flow rates may vary seasonally. Lakes are permanent and ice-covered only seasonally, if at all. Streams are influent above the water table (typically high altitudes) and effluent where the water table intersects the surface (typically lower altitudes) (Fig. 4a & c). Lakes may be predominantly influent (if above the water table) or effluent if below the water table.
Alternatively, how might we characterize the Late Noachian “cold and icy” climate scenario (e.g. Forget et al. Reference Forget, Wordsworth, Millour, Madeleine, Kerber, Leconte, Marcq and Haberle2013, Wordsworth et al. Reference Wordsworth, Forget, Millour, Head, Madeleine and Charnay2013) using insights obtained from analysis of the MDV? Can such a scenario explain the array of fluvial and lacustrine features observed on Late Noachian Mars? We first examine the general setting, then explore the specific climate model scenario, and finally, outline a conceptual model for Late Noachian Mars under MDV-like conditions. In general, on the basis of the Wordsworth et al. (Reference Wordsworth, Forget, Millour, Head, Madeleine and Charnay2013) analysis, mean annual temperatures on Mars are below 0°C. This means that there is a global permafrost layer and a horizontally stratified hydrologic system (Fig. 4b). In this scenario, snow and ice deposits form in the “icy highlands of the southern hemisphere (Fig. 3) and these provide the meltwater source for geomorphic work.
Top-down heating and melting of these ice deposits can take place through PSTs rising above the melting point, and through punctuated events, such as impacts or high-effusion rate volcanism. Here we assume that the PSTs/PDTs in the Late Noachian icy highlands model can rise above the melting point of water and we explore the consequences of this scenario. Very similar effects could also derive from the punctuated top-down heating mechanisms. Starting with this assumption, during PSTs and/or PDTs (Fig. 12), top-down melting of snow and ice could occur. The extended duration of the summer season on Mars relative to the Earth, approximately doubles the time when melting could take place. This meltwater forms a perched aquifer above the ice table aquiclude (Fig. 4b & d). The resulting fluvial activity is ephemeral, but repeated yearly events can carve valleys and form lakes (e.g. Figs 5, 8b, 13). Lakes are semi-permanent due to ice cover, and thus meltwater is stored there during periods when temperatures are below 0°C. Variations in the hydrologic system are introduced by landscape-induced snow and ice dynamics (e.g. volume, altitude, and insolation geometry of flowing ice) (Fig. 13) and by small fluctuations in input parameters to solar insolation (e.g. spin-axis/orbital parameters).
Do these local MDV principles apply to the much larger areas of Late Noachian Mars? In the icy Noachian highlands scenario, snow and ice occupy the high altitudes due to atmospheric-surface coupling and the adiabatic cooling effect (Fig. 3) (e.g. Forget et al. Reference Forget, Wordsworth, Millour, Madeleine, Kerber, Leconte, Marcq and Haberle2013, Wordsworth et al. Reference Wordsworth, Forget, Millour, Head, Madeleine and Charnay2013). This means that the area of the southern hemisphere uplands would be blanketed by a layer of ice and snow at least decametres thick (Fig. 14a). A simple reconstruction of an icy Noachian Mars shows the effects of the adiabatic cooling effect (Fig. 3): first, the Dorsa Argentea Formation (Head & Pratt Reference Head and Pratt2001) would surround the south circumpolar region (Fastook et al. Reference Fastook, Head, Marchant, Forget and Madeleine2012), and snow would concentrate at high altitudes (high southern latitudes) accumulating and forming ice deposits; we adopt a value of +1.0 km for the surface ice stability line (Fig. 14a) (Head Reference Head2012, Reference Head2013). Below this altitude, snow and ice could also accumulate on local highs depending on local and regional topography and atmospheric circulation patterns (e.g. Scanlon et al. Reference Scanlon, Head, Madeleine, Wordsworth and Forget2013). In a steady-state situation, any surface liquid water at low-altitudes (equatorial and northern lowlands) would rapidly freeze, sublimate, and be transported back to the southern high altitudes (Fig. 3), replenishing the snow and ice cover. The upper part of the regolith below the surface ice stability line would be dry above the top of the ice table to a depth determined by diffusive equilibrium with the atmosphere (Fig. 4d). The Noachian hydrologic system would be horizontally stratified due to the global permafrost aquiclude (Fig. 4b).
“Cold and icy” Late Noachian Mars: Configuration of snow and ice in the Noachian highlands according to the “cold and icy” Late Noachian climate model (Forget et al. Reference Forget, Wordsworth, Millour, Madeleine, Kerber, Leconte, Marcq and Haberle2013, Wordsworth et al. Reference Wordsworth, Forget, Millour, Head, Madeleine and Charnay2013), and relationship to the distribution of features indicating water transport across the surface of Mars (valley networks) and its storage in open- and closed-basin lakes. a. Distribution of snow and ice on the surface of Late Noachian Mars, assuming an equilibrium line altitude (ELA) of +1 km (Head Reference Head2013). b. The distribution of valley networks on Mars (Carr Reference Carr1996, Fassett & Head Reference Fassett and Head2008a, Hynek et al. Reference Hynek, Beach and Hoke2010). c. The distribution of open-basin lakes on Mars (Fassett & Head Reference Fassett and Head2008b). d. The distribution of closed-basin lakes on Mars (Aureli et al. Reference Aureli, Head, Goudge and Fassett2013). e. The distribution and relationship of snow and ice in the Noachian highlands, valley networks, open-basin lakes and closed-basin lakes.

Although the Martian solar day (24 hours 39 minutes) is approximately the same length as Earth’s, the Martian year is about twice as long as an Earth year, and southern summer is almost twice as long as on Earth. Thus, during southern summer (currently about 154 Sols, or Mars solar days, long), extended periods of PSTs and PDTs occur (Fig. 12). Top-down melting of snow and ice during this period could generate significant meltwater, whose fate would be to drain off the top of the upland regional ice deposit into surrounding low areas and form gully channels, streams and rivers draining toward lower elevations, ponding in lows and craters to form closed- and open-basin lakes (e.g. Fig. 5). These repeated seasonal diurnal periods of melting would cause warming of the cryosphere but the melting geotherm would be unlikely to penetrate deep into or through the kilometres-thick cryosphere (Figs 1a & 12). Thus, meltwater streams would be perched above the ice table (Figs 4b, 4d & 5), influent, poorly integrated, and tend to erode laterally. In contrast to the case of regional rainfall (Figs 2 & 4a), stream location and integration would be initially controlled by ice sheet distribution and topography (Fig. 14), and then by local topographic gradients and catchments at elevations lower than the ice sheet (Figs 5 & 13).
These extended periods of seasonal melting (or melting in punctuated melting scenarios) are predicted to produce the following consequences:
Derivation of meltwater: 1) Regional snow and ice deposits (an ice sheet and glaciers) above the surface ice stability line (Fig. 14a) would undergo altitude/latitude-dependent warming during each Mars summer (about six Earth months), 2) meltwater runoff from the ice sheet (Figs 5, 13, 14) would drain and flow downslope to the edge of the ice sheet, where meltwater channels would encounter Noachian cratered terrain topography (Fig. 14a) and flow across the surface forming valley networks (Fig. 14b), and around and into craters, forming closed-basin (Fig. 14d) and open-basin (Fig. 14c) lakes; fluvial drainage systems on top of aquicludes would be extensive, but might be poorly integrated (Fig. 14e), 3) snow and ice accumulations below the snowline would also undergo melting, producing a more integrated drainage system controlled by the presence of snow; sometimes these two systems would integrate, 4) seasonal top-down heating and melting of the top tens of metres of continuous ice would produce a volume of water, based on inferred ice sheet size (Head Reference Head2013), well in excess of the total volume interpreted to have occupied open/closed-basin lakes (Fassett & Head Reference Fassett and Head2008b) (Fig. 14e).
Hydrological system and cycle: 1) Meltwater would initially infiltrate into and erode the dry regolith to the top of the ice table (e.g. Figs 5, 7, 10), producing a perched aquifer and more efficient lateral erosion than deeper infiltration, 2) time periods above 0°C (e.g. Fig. 12) would be long enough to cause extensive melting and runoff, and to cause differences in the depth to the top of the ice table and thus the production of some local meltwater, but are probably not sufficient to penetrate through the permafrost layer, 3) at the end of the annual melting period, PSTs and PDTs would return to below 0°C (e.g. Fig. 12), meltwater would freeze and sublime, returning to the high altitudes as snowfall to replenish regional snow and ice deposits (Fig. 3), 4) this Noachian icy highlands, atmospheric-surface coupling induced, adiabatic cooling effect-dominated water cycle (Fig. 14e) would persist until MAAT dropped to below 0°C (e.g. Fig. 12), 5) once MAAT returned to values well below 0°C at the end of spin-axis/orbital induced warming, lower altitude/latitude snow and ice would return to high altitudes to re-establish the nominal Noachian icy highlands climate regional snow and ice deposits (Fig. 3).
Noachian ice sheet melting: Fluvial processes: Surface melting of a Noachian ice sheet (Fig. 14a & b) has the following consequences: 1) meltwater is focused in streams near the edge of the ice sources and overland flow is thus limited to the location of the channels at the edge of the ice sheet (Fig. 9), 2) streams therefore may be of low order (due to being linked to individual ice sheet drainage channels, not integrated overland flow) and poorly integrated with widths and depths significantly influenced by the shallow ice table, 3) sediments are pre-processed by impact cratering, volcanic, and Aeolian processes; the source rocks are already highly modified and bedrock exposure is low, 4) stream activity acts to further physically alter the sediments, producing sorting and rounding, 5) in streams the hyporheic zone (Fig. 8a) defines the focus for chemical and isotopic exchange, and chemical weathering, 6) if simple life existed on Mars at this time, ecosystem development might be focused in streams during wet periods; on longer timescales these deposits might become ecological legacies for the sustenance and reactivation of ecosystems, 7) solutes are derived from the wetting and erosion of the regolith, and concentrated in water in the fluvial channels and the hyporheic zone (Figs 8a & 10e), 8) inter-stream areas are not significantly influenced by the fluvial phase (Fig. 8b) and thus net erosion rates are minimal there and for the terrain in general, 9) the intermittent availability of meltwater and the resulting episodic nature of the transport of sediment can lead to the formation of fluvial/alluvial sedimentary fans on steeper slopes (Figs 7 & 8b), such as crater interior walls, 10) sedimentary fluvial deposits become centres for Aeolian debris transport during non-fluvial intervals; winds transport finer fluvial sediments and sort and modify the coarser surface materials.
Noachian ice sheet melting: Lacustrine processes: Transported meltwater collects and resides in lacustrine environments (Fig. 14c & d): 1) streams drain into local lows to form ponds and lakes, predominantly in intercrater and intracrater regions, 2) local ponds form in irregular lows from peak discharge drainage; these could contain significant amounts of solutes from erosion of surface salts and from water flushed from the hyporheic zone (e.g. Don Juan Pond; Dickson et al. Reference Dickson, Head, Levy and Marchant2013), 3) some depressions (typically impact craters) fill with water, breach the rim crest and drain, creating open-basin lakes (Fig. 14c), 4) closed-basin lakes (also often in craters) are formed when water flux is insufficient to fill the depression and external drainage does not occur (Fig. 14d), 5) lakes are likely to be ice-covered, losing ice by sublimation but adding ice by freezing of inflowing meltwater to the base or on top of the ice cover, 6) lakes persist between periods of melting due to their ice cover; smaller ponds and lakes may disappear at these times due to sublimation, 7) the dominance of sublimation over evaporation in these lakes disfavours, but does not preclude, the formation of evaporates on the lake floors following transition to another climate regime. The geochemistry of MDV lakes provides an extensive record of interrelated factors of waxing, waning, desiccation and source materials (e.g. Lyons et al. Reference Lyons, Frape and Welch1999, Reference Lyons, Fountain, Doran, Priscu, Neumann and Welch2000, Reference Lyons, Welch, Carey, Doran, Wall, Virginia, Fountain, Csatho and Tremper2005, 2006).
In summary, on the basis of our comparison to the hyperarid, hypothermal, low-lying MDVs, the “cold and icy” Noachian highlands scenario could plausibly explain the array of fluvial and lacustrine features seen on Late Noachian Mars. An early Mars climate characterized by atmosphere-surface coupling and the adiabatic cooling effect would be characterized by MAAT below 0°C (e.g. Forget et al. Reference Forget, Wordsworth, Millour, Madeleine, Kerber, Leconte, Marcq and Haberle2013, Wordsworth et al. Reference Wordsworth, Forget, Millour, Head, Madeleine and Charnay2013), but PST and PDT could be above 0°C (e.g. Fig. 12). If baseline MAAT are high enough, but still below 0°C, these spin-axis/orbital parameter induced seasonal and diurnal temperature excursions appear to be sufficient to cause top-down (e.g. surface) melting of a Noachian icy highlands, and formation of streams, rivers and lakes (Fig. 14). Furthermore, additional sources of punctuated top-down warming, the environmental effects of impact cratering events and massive volcanic eruptions, could potentially produce a short-lived warmer climate and surface hydrological activity on the multi-decadal-centennial timescale (see Wordsworth et al. Reference Wordsworth, Forget, Millour, Head, Madeleine and Charnay2013, p. 12–17, for detailed discussions). Regardless of the melting mechanism or its duration, the icy highlands model provides a robust mechanism for recharging highland water sources through water migration from lowland streams and lakes, back to higher altitudes to be redeposited as snow. We now outline a series of questions that might further help to resolve the conundrum of the Late Noachian climate on Mars.
Outstanding questions: McMurdo Dry Valleys and Noachian Mars
The Late Noachian on Mars was a period of fluvial/lacustrine activity, as shown by preserved evidence of valley network, and open/closed-basin lake formation. How can we further test whether this period was predominantly pluvial (“warm and wet”) or predominantly nivial (“cold and icy”)?
-
1. Geomorphology: Are individual fluvial/lacustrine features on Mars consistent with those observed in the MDV? Does the entire ensemble of features (valley networks, open- and closed-basin lakes) (Fig. 14e) on Mars appear to be consistent with a “cold and icy” MDV-like scenario? What criteria can be applied to address these comparisons further? Do other landforms, such as impact craters, show evidence for formation and degradation processes more consistent with either scenario? Can other analogues, such as those in the Arctic, provide information on somewhat warmer conditions and the role of vegetation and occasional rainfall?
-
2. Initiation: Is there evidence for a transition to conditions favourable for valley network formation and where and in what state was water prior to that time? What insights can recent studies of long-term climate change in the MDV (Lewis et al. Reference Lewis, Marchant, Ashworth, Hemming and Machlus2007, Marchant et al. Reference Marchant, Mackay, Lamp, Hayden and Head2013) provide?
-
3. Timing and duration: What is the length of time that it took to carve the valley networks on Mars? Could this erosion occur in sustained seasons of optimal obliquity? Does it require a punctuated, longer term phase of warming that elevates global temperatures (e.g. Halevy & Head Reference Halevy and Head2012)? How can MDV analogues help address this question?
-
4. Repetition and variation within periods: Is there evidence in the geologic record of Mars for multiple times of fluvial/lacustrine formation or does it appear that formation occurred under sustained conditions? Are there climate-driven pulses during periods of valley network formation? How can the documented origin of streams and lakes in the MDV help to address this?
-
5. Transition and cessation: What caused the valley networks to cease forming? Was this gradual or rapid? What geological evidence should be searched for to test and establish these scenarios for Mars?
-
6. Presence of Noachian ocean: A “warm and wet” early Mars climate predicts the presence of a Noachian ocean in the northern lowlands. This scenario is not necessary for a “cold and icy” Noachian Mars. How can the presence of a Noachian northern ocean be tested to distinguish between these hypotheses?
These questions and further tests will provide the basis for determining the climate environment responsible for the Late Noachian fluvial/lacustrine period dominated by valley network, and open/closed-basin lake formation. Further exploration of the MDV will permit additional assessment of the end-member hypotheses for whether this period was predominantly pluvial (“warm and wet”) or predominantly nivial (“cold and icy”).
Acknowledgements
We gratefully acknowledge financial support from the National Science Foundation, Office of Polar Programs, Grant PLR-0944702 (Quantifying Surface Processes above Buried Ice in Antarctica: Implications for Terrestrial Climate Change and Glaciation on Mars), D.R. Marchant, and Grant ANT-0739702 (Orbital Spectral Mapping of Surface Compositions in the Antarctic Dry Valleys: Regional Distributions of Secondary Mineral-Phases as Climate Indicators), J.W. Head. Logistical support for this project in Antarctica was provided by the US National Science Foundation through the US Antarctic Program. We thank the National Aeronautics and Space Administration (NASA) for financial assistance to support this work through a Mars Data Analysis Program Grant (NNX11AI81G) to J.W. Head. Thanks are extended to James Dickson, Joseph Levy, Doug Kowalewski, and Kate Swanger for their assistance in the field and for extensive and fruitful science discussions and contributions. We thank Anne Côté for her dedicated help in figure and manuscript preparation. The authors would also like to thank the reviewers for their valuable comments.
Dedication
We dedicate this paper to David Sugden. There are few glacial geomorphologists who have made a greater impact on our field than David Sugden, and certainly none more pioneering and influential in linking glacial geology with glaciological theory. Indeed, it is on the basis of his extraordinary achievements and scientific results over a span of nearly six decades that it is now possible to extend glacial geologic and polar studies to other planets, and specifically to begin to unravel glaciation and climate change on Mars.


 Open access

