





Depression is a highly prevalent mental disorder often originating in adolescence (Kessler et al., Reference Kessler, Aguilar-Gaxiola, Alonso, Chatterji, Lee, Ormel, Üstün and Wang2009; Malhi & Mann, Reference Malhi and Mann2018; Wittchen et al., Reference Wittchen, Jacobi, Rehm, Gustavsson, Svensson, Jönsson, Olesen, Allgulander, Alonso, Faravelli, Fratiglioni, Jennum, Lieb, Maercker, van Os, Preisig, Salvador-Carulla, Simon and Steinhausen2011). Rather than a binary diagnosis, empirical studies suggest it is best understood as a symptom continuum with varying frequency and severity (Haslam et al., Reference Haslam, McGrath, Viechtbauer and Kuppens2020), involving sadness, loss of interest, irritability, lack of energy, and sleep difficulties (American Psychiatric Association, 2013). Although the causes of depression are multifactorial, personality traits, that is, characteristic ways of thinking, feeling, and behaving, are among the most important predictors of depression, and there is a growing consensus that personality traits are crucial for understanding psychopathology (Hakulinen et al., Reference Hakulinen, Elovainio, Pulkki-Råback, Virtanen, Kivimäki and Jokela2015; Widiger et al., Reference Widiger, Sellbom, Chmielewski, Clark, DeYoung, Kotov, Krueger, Lynam, Miller and Mullins-Sweatt2019).
Personality is often studied within the Big Five framework, which includes the domains of neuroticism, extraversion, openness, agreeableness, and conscientiousness (McCrae & John, Reference McCrae and John1992). Meta-analyses and systematic reviews of adult samples have consistently documented cross-sectional associations between higher neuroticism, lower extraversion, lower conscientiousness, and depression (Kotov et al., Reference Kotov, Gamez, Schmidt and Watson2010; Lyon et al., Reference Lyon, Elliott, Ware, Juhasz and Brown2021). These traits are also prospectively associated with depressive symptoms and diagnosis in longitudinal studies of both adult (Altaweel et al., Reference Altaweel, Upthegrove, Surtees, Durdurak and Marwaha2023; Hakulinen et al., Reference Hakulinen, Elovainio, Pulkki-Råback, Virtanen, Kivimäki and Jokela2015; Jeronimus et al., Reference Jeronimus, Kotov, Riese and Ormel2016; Ormel et al., Reference Ormel, Jeronimus, Kotov, Riese, Bos, Hankin, Rosmalen and Oldehinkel2013; Struijs et al., Reference Struijs, Lamers, Spinhoven, van der Does and Penninx2018) and adolescent (Etkin et al., Reference Etkin, De Caluwé, Ibáñez, Ortet and Mezquita2022; Klimstra et al., Reference Klimstra, Akse, Hale, Raaijmakers and Meeus2010) samples. Neuroticism shows the strongest association with depression, consistent with its links to emotional instability, stress vulnerability, and negative emotionality. Importantly, genetically informative studies suggest that these phenotypic associations, especially those involving neuroticism, largely stem from common genetic factors (Brainstorm Consortium et al., Reference Anttila, Bulik-Sullivan, Finucane, Walters, Bras, Duncan, Escott-Price, Falcone, Gormley, Malik, Patsopoulos, Ripke, Wei, Yu, Lee, Turley, Grenier-Boley, Chouraki and Neale2018; Hettema et al., Reference Hettema, Neale, Myers, Prescott and Kendler2006; Kendler et al., Reference Kendler, Gatz, Gardner and Pedersen2006; Kendler & Myers, Reference Kendler and Myers2010; Kendler et al., Reference Kendler, Neale, Kessler, Heath and Eaves1993; Mitrović et al., Reference Mitrović, Mihić, Sadiković and Smederevac2023), indicating that the observed associations are primarily due to shared genetic influences rather than higher neuroticism directly leading to depression.
Certain personality-related characteristics are particularly important for adolescent adaptation, including peer relationships, self-efficacy, and impulse regulation, and this study incorporates measures of these characteristics alongside the Big Five traits. Loneliness is considered a strong risk factor for depression (Heinrich & Gullone, Reference Heinrich and Gullone2006), and longitudinal studies have consistently reported associations between loneliness and depressive symptoms and diagnosis in adolescent samples (Loades et al., Reference Loades, Chatburn, Higson-Sweeney, Reynolds, Shafran, Brigden, Linney, McManus, Borwick and Crawley2020; Vanhalst et al., Reference Vanhalst, Klimstra, Luyckx, Scholte, Engels and Goossens2012; Wei et al., Reference Wei, Russell and Zakalik2005). Self-efficacy (Bandura, Reference Bandura1977; Wang et al., Reference Wang, Liu, Li, Zhu, Yue, Li, Li, Wu, Wang and Liu2022) is another factor, where low perceived coping ability and low tolerance for negative thoughts may increase vulnerability (Muris, Reference Muris2002). However, longitudinal evidence remains limited (Wang et al., Reference Wang, Liu, Li, Zhu, Yue, Li, Li, Wu, Wang and Liu2022).
Impulsivity is another trait extensively studied in psychiatric research. It is a multidimensional construct, defined as a predisposition toward rapid, unplanned reactions without regard for negative consequences (Moeller et al., Reference Moeller, Barratt, Dougherty, Schmitz and Swann2001, p. 1784), and is considered a general vulnerability factor for adolescent psychopathology (Cosi et al., Reference Cosi, Hernández-Martínez, Canals and Vigil-Colet2011). Although often studied in relation to externalizing disorders, impulsivity is also associated with internalizing disorders, including depression (Piko & Pinczés, Reference Piko and Pinczés2014; Regan et al., Reference Regan, Harris and Fields2019; Royuela-Colomer et al., Reference Royuela-Colomer, Fernández-González and Orue2021; Saddichha & Schuetz, Reference Saddichha and Schuetz2014). However, the temporal relationship remains unclear, as most studies have examined impulsivity and depression in the context of suicidal behavior (Altaweel et al., Reference Altaweel, Upthegrove, Surtees, Durdurak and Marwaha2023), and less is known about this association in the absence of suicidality.
Regarding protective factors for depression, many researchers have highlighted resilience-related characteristics. Numerous studies have shown that higher levels of both trait resilience, a personality trait that increases the ability to cope with adversity, and sense of coherence, the perception of the world as comprehensible, manageable, and meaningful, are negatively associated with mental health problems, including depressive symptoms (for meta-analyses, see Hu et al., Reference Hu, Zhang and Wang2015; Schäfer et al., Reference Schäfer, Sopp, Fuchs, Kotzur, Maahs and Michael2023; Watters et al., Reference Watters, Aloe and Wojciak2023). However, these meta-analyses are based on cross-sectional studies, highlighting the need for longitudinal research to clarify the temporal relationship between resilience factors and depression.
Besides the personal characteristics and behavioral tendencies described above, stressful or negative life events are widely considered important factors for depression (Hammen, Reference Hammen2016; Jacobs et al., Reference Jacobs, Reinecke, Gollan and Kane2008; Reyes-Rodríguez et al., Reference Reyes-Rodríguez, Rivera-Medina, Cámara-Fuentes, Suárez-Torres and Bernal2013; Thapar et al., Reference Thapar, Collishaw, Pine and Thapar2012). Negative life events, often assessed via cumulative checklists (Cohen et al., Reference Cohen, Murphy, Prather, Murphy and Prather2019), are significantly associated with adolescent depressive symptoms (Aune et al., Reference Aune, Hamiel and Wolmer2023; Kim et al., Reference Kim, Galván and Kim2021; March-Llanes et al., Reference March-Llanes, Marques-Feixa, Mezquita, Fananas and Moya-Higueras2017; Pine et al., Reference Pine, Cohen, Johnson and Brook2002; Thapar et al., Reference Thapar, Collishaw, Pine and Thapar2012). While often interpreted as a direct environmental impact, these measures also reflect genetic variance (Kendler & Baker, Reference Kendler and Baker2007). Genetic variance in measured life events suggests that individuals are not passive recipients of their environment, but also actively select environments related to their genetic predispositions, and that genetically influenced behaviors may elicit certain environmental reactions.
Considering the genetic influences on measured environments, an important question is whether the associations between life events and depression are causal or arise from common genetic factors influencing both the occurrence of life events and depression. Researchers often distinguish between life events considered outside an individual’s control (independent life events) and those likely to be influenced by an individual’s behavior (dependent life events). As expected, the heritability of dependent life events is substantially higher than that of independent events (Bemmels et al., Reference Bemmels, Burt, Legrand, Iacono and McGue2008; Kendler & Baker, Reference Kendler and Baker2007; Plomin et al., Reference Plomin, Lichtenstein, Pedersen, McClearn and Nesselroade1990). Unfortunately, most knowledge about the relationship between life events and depression comes from studies that have not been able to take the role of genetics into account. However, earlier genetically informative studies suggest that a substantial proportion of the association between negative dependent life events and depression is due to common genetic influences (Boardman et al., Reference Boardman, Alexander and Stallings2011; Harrison et al., Reference Harrison, Docherty, Finsaas, Kotov, Shabalin, Waszczuk, Katz, Davila and Klein2023; Kendler & Gardner, Reference Kendler and Gardner2010). In other words, the association between life events and depression may be partly explained by genetic factors influencing both the likelihood of exposure to certain life events and the risk of depression.
Despite established associations, most research remains cross-sectional and focused on neuroticism (Lyon et al., Reference Lyon, Elliott, Ware, Juhasz and Brown2021; Mitrović et al., Reference Mitrović, Mihić, Sadiković and Smederevac2023). Longitudinal, genetically informative designs are necessary to disentangle whether these associations are causal or driven by common genetic factors, which is vital for effective prevention (Kendall et al., Reference Kendall, Van Assche, Andlauer, Choi, Luykx, Schulte and Lu2021; Sullivan et al., Reference Sullivan, Neale and Kendler2000). Longitudinal genetically informative designs are essential for understanding how genetic and environmental influences on internalizing problems and personality unfold over time, rather than at a single cross-sectional snapshot. Nivard, Middeldorp et al. (Reference Nivard, Middeldorp, Dolan and Boomsma2015) showed, using a longitudinal twin sample from ages 14–32 years and genetic simplex modeling, that both genetic and environmental influences on neuroticism are highly stable, with genetic correlations between adjacent age periods exceeding .9 and, after correction for measurement error, environmental correlations of .7–.9. In a second large cohort-sequential twin study spanning ages 3–63 years, (Nivard, Dolan et al (Reference Nivard, Dolan, Kendler, Kan, Willemsen, van Beijsterveldt, Lindauer, van Beek, Geels, Bartels, Middeldorp and Boomsma2015) found that symptoms of anxiety and depression show substantial phenotypic stability that is largely attributable to genetic factors, with additional age-specific ‘genetic innovation’ in childhood and adolescence and an increasing role for environmental variance in adulthood. Similarly, Kendler et al. (Reference Kendler, Eaves, Loken, Pedersen, Middeldorp, Reynolds, Boomsma, Lichtenstein, Silberg and Gardner2011), analyzing repeated measures of anxiety and depression symptoms in monozygotic (MZ) twins using hierarchical linear modeling, demonstrated that twins’ trajectories increasingly diverge from childhood through midlife, indicating that cumulative environmental experiences make a growing contribution to stable individual differences in symptom levels.
Other longitudinal twin work has used these designs to clarify how environmental exposures and interpersonal experiences interplay with genetic liability. Middeldorp et al. (Reference Middeldorp, Cath, Beem, Willemsen and Boomsma2008) reported reciprocal prospective associations between life events and both anxious depression and neuroticism, supporting a bidirectional causal relationship rather than gene–environment correlation for these links. Abdellaoui et al. (Reference Abdellaoui, Chen, Willemsen, Ehli, Davies, Verweij, Nivard, de Geus, Boomsma and Cacioppo2019), combining twin, molecular genetic, and longitudinal data, showed that the association between loneliness and personality is largely explained by neuroticism and is strongly genetic in nature (genetic correlation ≈ .71), with evidence for reciprocal causal influences over time. Collectively, these studies illustrate the unique value of longitudinal twin designs in separating enduring from transient influences, detecting genetic innovation and environmental accumulation across development, and elucidating the dynamic interplay between personality, life events, and internalizing symptoms. Identifying these modifiable environmental vs. genetic markers allows for better early detection and intervention.
Using a longitudinal genetically informative design, the present study aimed to examine associations between a range of personality characteristics and life events during adolescence and depression in young adulthood. The personality characteristics examined included the Big Five traits, loneliness, self-efficacy, trait resilience, sense of coherence, and impulsivity. For ease of communication, we use the term ‘personality’ when referring collectively to these traits and personality-related variables. Supporting this phrasing, previous studies have found that loneliness (Mund et al., Reference Mund, Freuding, Möbius, Horn and Neyer2020) and sense of coherence (Honkinen et al., Reference Honkinen, Suominen, Helenius, Aromaa, Rautava, Sourander and Sillanpää2008; Skaug et al., Reference Skaug, Czajkowski, Waaktaar and Torgersen2022b) show similar stability over time as the Big Five traits, and resilience (Hu et al., Reference Hu, Zhang and Wang2015), self-efficacy (Altaweel et al., Reference Altaweel, Upthegrove, Surtees, Durdurak and Marwaha2023) and impusivity (DeYoung, Reference DeYoung, Vohs and Baumeister2011) are commonly regarded as personality traits in the literature. Thus, all these concepts can be considered personality characteristics in a broad sense. We specifically studied negative dependent life events, as the nature of their relationship with depression is unclear and their association with depression is typically stronger than that observed for independent life events (Harrison et al., Reference Harrison, Docherty, Finsaas, Kotov, Shabalin, Waszczuk, Katz, Davila and Klein2023; Kendler & Gardner, Reference Kendler and Gardner2010).
Our aims were to: (1) examine associations between a range of personality variables throughout adolescence and depression in young adulthood; (2) examine whether negative dependent life events during adolescence are predictive of depression in young adulthood; and (3) determine the extent to which associations of personality characteristics and negative dependent life events with depression reflect ‘direct’ environmental effects versus common genetic influences. We hypothesized that personality characteristics and negative dependent life events during adolescence would predict depression in young adulthood, and that a substantial portion of the associations between personality, life events, and depression would be caused by common genetic influences.
Materials and Methods
Sample and Procedure
In this study, data from the population-based Oslo University Adolescent and Young Adult Twin Project were used (Torgersen & Waaktaar, Reference Torgersen and Waaktaar2019; Torgersen & Waaktaar, Reference Torgersen and Waaktaar2020). All twins born in Norway from the birth cohorts 1988–1994 were invited to participate. Self-report questionnaires were sent out to the twins three times, with two years between measurements (12 to 18 years at Wave-1). In addition, the twins were invited to a face-to-face interview when they were around 19 years old (M = 19.1, SD = 1.2). Informed consent was obtained from both the twins and their parents. The study was approved by the Norwegian Data Inspectorate and the Regional Committees for Medical and Health Research Ethics. American Psychological Association ethical standards were followed in the conduct of the study. Twin zygosity was determined by a combination of a zygosity questionnaire and gene testing. The misclassification rate of same-sex twins is estimated to be only 0.64% (Skaug et al., Reference Skaug, Czajkowski, Waaktaar and Torgersen2022a).
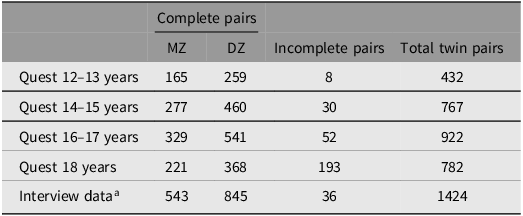
In the present study, the data obtained from the three measurement waves, each including data from seven birth cohorts, was reorganized based on age groups: 12–13 years, 14–15 years, 16–17 years, and 18 years and older (i.e., up until the time of the interview assessment of depression). The total sample size consisted of 3394 twins (56% females) from 1716 twin pairs. The majority of participants who completed the questionnaires also took part in the interview assessment (i.e., 76%, 80%, 82% and 87% at age 12–13, 14–15, 16–17 and 18 respectively). These high retention rates between questionnaire and interview data likely reflect the study’s flexible scheduling of the in-person interviews, reimbursement of travel expenses, and the option for co-twins to be interviewed together (although in separate rooms with different interviewers). Further details regarding the sample characteristics are presented in Table 1.
Number of participants

Table 1. Long description
The table presents the number of participants in a study, organized by age groups and types of twin pairs. It has five rows and five columns. The columns are labeled 'Complete pairs', 'MZ', 'DZ', 'Incomplete pairs', and 'Total twin pairs'. The rows are labeled 'Quest 12–13 years', 'Quest 14–15 years', 'Quest 16–17 years', 'Quest 18 years', and 'Interview data'. Row 1: Quest 12–13 years, MZ 165, DZ 259, Incomplete pairs 8, Total twin pairs 432. Row 2: Quest 14–15 years, MZ 277, DZ 460, Incomplete pairs 30, Total twin pairs 767. Row 3: Quest 16–17 years, MZ 329, DZ 541, Incomplete pairs 52, Total twin pairs 922. Row 4: Quest 18 years, MZ 221, DZ 368, Incomplete pairs 193, Total twin pairs 782. Row 5: Interview data, MZ 543, DZ 845, Incomplete pairs 36, Total twin pairs 1424.
Note: Quest, questionnaire data; MZ, monozygotic twin pairs; DZ, dizygotic twin pairs.
a Mean age = 19.1 years (SD = 1.2).
Power Analyses
Power analyses were performed to examine the required magnitude of genetic correlations between two phenotypes that would provide a statistical power of .80 to detect them under various scenarios of additive genetic and shared environmental influence. The analyses were conducted in OpenMx, using the functions provided by Verhulst (Reference Verhulst2017). Following Verhulst, a significance threshold of α = .10 was used in the power calculations, reflecting the corrected type I error rate for likelihood ratio tests of a single bounded variance-related parameter with one degree of freedom. As a rigorous test, we used the number of complete MZ and dizygotic (DZ) pairs with available data on depression for the power analyses (N MZ = 543; N DZ = 845). Assuming no shared environmental effects and a heritability of .30, .40 and .50, we could with a power of .80 detect genetic correlations of .59, .41 and .30, respectively. Alternatively, in the presence of a shared environmental effect of .10, and a heritability of .30, .40 and .50, we could with a power of .80 detect genetic correlations of .54, .37 and .37 respectively.
Measures
Questionnaire data. To maximize the number of scales included in the questionnaires, and to minimize dropouts and missing data, the complete scales were abbreviated based on results from a pilot study (Torgersen & Waaktaar, Reference Torgersen and Waaktaar2019). Items with the highest item-to-trait correlations across different age groups and sex were selected for inclusion in the abbreviated scales. The questionnaire scale items are presented in Supplementary material, along with reliability coefficients (Table S1).
Big Five Personality. The Big Five personality traits were assessed using the Hierarchical Personality Inventory for Children (HiPIC; Mervielde & De Fruyt, Reference Mervielde, De Fruyt, Mervielde, Deary, De Fruyt and Ostendorf1999). This inventory measures the domains of emotional stability (neuroticism, reversed), extraversion, imagination (corresponding to openness), benevolence (corresponding to agreeableness), and conscientiousness. In the present study, the full HiPIC (144 items) was abbreviated to a 40-item scale, comprising 8 items per trait. Participants rated their responses on a 5-point scale ranging from 0 (not typical) to 4 (very typical). Mean scores were computed for each of the five personality traits, that is, neuroticism, extraversion, openness, agreeableness, and conscientiousness.
Self-efficacy. Self-efficacy over the past year was assessed by a 12-item abbreviated version of the Children’s Perceived Self-Efficacy scales (CPSE; Pastorelli et al., Reference Pastorelli, Caprara, Barbaranelli, Rola, Rozsa and Bandura2001), which originally contained 37 items. The scale included items measuring academic performance (e.g., finish homework by deadlines, motivation of doing schoolwork), social skills (e.g., ability to make and keep friends, handle interpersonal conflicts) and capacity to resist peer pressure (e.g., engaging in risky behaviors, voicing opinions when facing disagreement). Each item was rated on a 5-point scale ranging from 0 (not easy at all) to 4 (very easy), and an average score was calculated for each participant.
Resilience. Two scales were used to measure resilience: the Resilience Scale (RS; Wagnild & Young, Reference Wagnild and Young1993), originally containing 25 items, and the Ego-Resiliency Scale (ER89; Block & Kremen, Reference Block and Kremen1996), originally containing 14 items. Both scales were abbreviated to include five items each. The RS items comprised statements assessing level of commitment to completing plans, interest in various subjects, determination, and self-belief. The ER89 items assessed the degree to which the person finds joy in dealing with new situations, fills the everyday life with things that are interesting, and describe him/herself as having a ‘strong’ personality. Participants rated each item on a 5-point scale ranging from 0 (not typical) to 4 (very typical), and mean scores were calculated for each scale.
Loneliness. Feelings of loneliness in the past year were evaluated using a five-item scale. The scale included the four-item survey version of the Revised University of California, Los Angeles (R-UCLA) Loneliness Scale (Russell et al., Reference Russell, Peplau and Cutrona1980) and one direct measure of loneliness (‘I feel lonely’). Participants responded to each item on a 5-point scale ranging from 0 (not typical) to 4 (very typical). Mean scores were calculated, with higher scores indicating more feelings of loneliness.
Sense of coherence. Sense of coherence in the past year was assessed using a shortened five-item version of the Sense of Coherence 13-item scale (SOC-13; Antonovsky, Reference Antonovsky1987). The scale included items assessing an individual’s perception of the world and oneself as understandable, manageable, and meaningful. Participants provided responses on a 7-point scale, ranging from 1 (very often) to 7 (rarely/never). Mean scores were calculated, with higher scores indicating stronger sense of coherence.
Impulsivity. Impulsivity in the past year was assessed using seven items from the Control Scale (impulsivity reversed, originally 13 items) within the brief form of the Multidimensional Personality Questionnaire (MPQ-BF; Patrick et al., Reference Patrick, Curtin and Tellegen2002). The scale measured tendencies to act on the spur of the moment, the inclination to plan and organize, and the likelihood of making decisions through careful reasoning. Participants responded to each item on a 3-point scale, ranging from 0 (false) to 2 (true). Mean scores were calculated, with higher scores indicating higher levels of impulsivity.
Negative dependent life events. The participants were asked to indicate whether they had experienced any of a set of 14 negative dependent life events the past year (0 = no, 1 = yes). The scale consisted of nine items from the Life Event Questionnaire for Adolescents (LEQ-A; Masten et al., Reference Masten, Neemann and Andenas1994) and five events that were added after a pilot study. The scale included events such as having many arguments with parents, going through a breakup with a girlfriend/boyfriend, feeling disappointed by a friend, feeling disappointed by someone in the family, and having major problems with a teacher. For each participant, the number of negative dependent life events that had occurred the past year was summed up to an aggregated score.
Interview-data: Depression . DSM-IV depression was assessed using the Mini International Neuropsychiatric Interview (MINI; Sheehan et al., Reference Sheehan, Lecrubier, Sheehan, Amorim, Janavs, Weiller, Hergueta, Baker and Dunbar1998) in Norwegian Translation. A dimensional approach was used to measure current depression, meaning that participants were categorized into three groups based on the severity of their symptoms. The categories were as follows: 0 = no depression, 1 = subthreshold depression (i.e., individuals who lacked one or two criteria for a full diagnosis), 2 = depression (individuals who met the full criteria for a diagnosis of depression). This approach acknowledge that depression exists on a continuum and that individuals may experience varying levels of symptom severity. The rationale for a dimensional approach is supported by prior studies suggesting that differences in psychopathology, including depression, are better understood as differences in degree rather than as qualitative differences in kind (Haslam et al., Reference Haslam, McGrath, Viechtbauer and Kuppens2020; Lahey et al., Reference Lahey, Tiemeier and Krueger2022).
Statistical Analyses
Phenotypic analyses. Phenotypic associations between personality and depression were examined using correlation and regression analyses. Four separate regression analyses were conducted, each with depression as the dependent variable. The independent variables in these models consisted of personality variables assessed during distinct age ranges: 12–13 years, 14–15 years, 16–17 years, and 18 years. From these regression models, we extracted the predicted values. We refer to these scores as aggregated personality scores, as the personality variables are weighted based on their importance for depression. This aggregation allows for a comprehensive assessment of the longitudinal relationship between personality traits expressed during adolescence and subsequent depression in young adulthood. Additionally, correlation analyses were performed to examine the phenotypic associations between negative dependent life events and depression.
Biometric analyses. Using twin data allows us to decompose variance (and covariance) in phenotypes into genetic and environmental components: additive genetic (A), nonadditive genetic (D), shared environmental (C), and nonshared environmental (E) influences. MZ twins share 100% of their segregating genes, whereas DZ twins share on average 50%; thus A and D correlate 1.0 in MZ pairs and are expected to correlate .50 and .25 respectively in DZ pairs. C influences are environmental factors that make twins similar (correlated 1.0 in both MZ and DZ pairs). E influences are experiences unique to each twin, including measurement error, and are uncorrelated within pairs.
The classical twin design infers A, C, D, and E by comparing MZ and DZ twin correlations. If A is the only source of familial resemblance, the DZ correlation should be half the MZ correlation. A DZ correlation greater than half the MZ correlation suggests C effects, whereas a DZ correlation less than half the MZ correlation suggests influence of D. In the classical twin design, C and D cannot be estimated simultaneously because their effects are confounded in the MZ–DZ covariance structure. Depending on the correlation structure, we therefore model either C or D. The remaining variance is attributed to E. First, we fitted univariate twin models to estimate the relative contribution of genetic and environmental factors to variation in depression and the aggregated personality scores. Next, we fitted a series of bivariate Cholesky decomposition models to quantify the relative contribution of genetic and environmental influences to the covariance between personality and depression. The aggregated personality score from a given age was included as the first variable, with depression as the second variable in each model. Using data from twins, the bivariate Cholesky decomposition partitions the variance in the first variable into genetic and environmental sources. Furthermore, the model quantifies the extent to which the genetic and environmental factors influencing the first variable also are contributing to variance in the second variable. The residual variance in the second variable that is not shared with the first variable is also partitioned into genetic and environmental sources (Neale & Maes, Reference Neale and Maes2004). In addition, the Cholesky decomposition enables estimation of genetic and environmental correlations. The genetic and environmental correlations between personality and depression represent the degree to which the same genetic and environmental factors contribute to variation in both traits. For example, a genetic correlation close to 1 suggests that there is a strong overlap in the genetic influences on both personality and depression. Furthermore, a nonshared environmental correlation close to zero suggests that the environmental influences on personality and depression are mostly separate and distinct from another. A similar procedure was performed to quantify the proportions of the phenotypic correlations between negative dependent life events and depression that were due to genetic and environmental influences, respectively. That is, the aggregated score of negative dependent life events assessed at a given age was included as the first variable in each Cholesky decomposition, and depression was included as the second variable.
All biometric models were conducted using the structural equation modelling R package OpenMx (Neale et al., Reference Neale, Hunter, Pritikin, Zahery, Brick, Kirkpatrick, Estabrook, Bates, Maes and Boker2016), and all models were fitted to raw data using full information maximum likelihood (FIML). A threshold model was employed for the analyses of depression, in which a continuous normally disturbed liability is assumed to underlie the observed ordinal variable. Models for continuous data were used to analyze the aggregated personality scores and negative dependent life events. To account for potential mean-level differences between males and females, the models were fitted with separate thresholds and means for each sex. When comparing different models, the Akaike’s information criterion (AIC; Akaike, Reference Akaike1987), the Bayesian information criterion (BIC; Raftery, Reference Raftery1995) and the sample-size adjusted BIC were used as criteria for model selection, with lower values indicating better model fit.
Results
Eighty-three (3%) and 362 (13%) individuals of the total 2812 interviewed participants were classified having subthreshold depression and depression respectively. Means and standard deviations for the personality variables and negative dependent life events are presented in Supplementary material Table S2, and interscale correlations and correlation with sex are presented in Table S3. Overall, the results showed that the associations between sex and the study variables were weak in magnitude (i.e., almost all correlations were below .20).
Personality and Depression
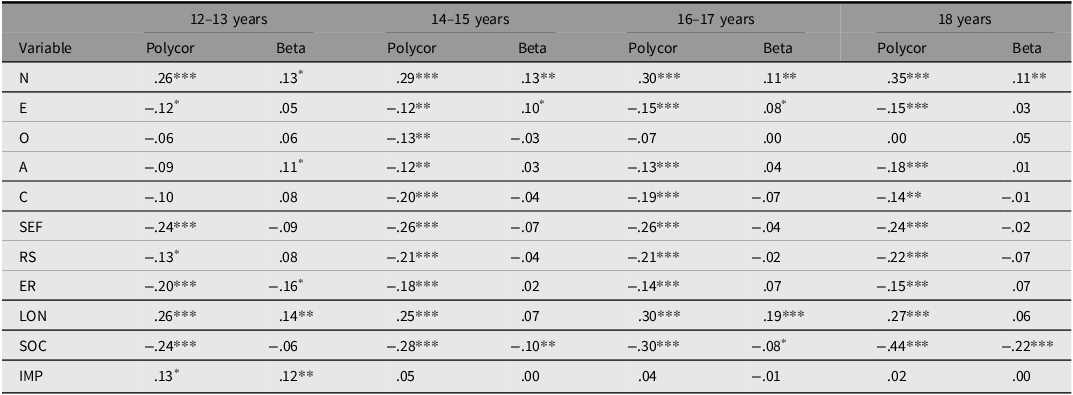
Table 2 displays bivariate correlations and results from regression analyses predicting depression from personality characteristics measured at different ages in adolescence. Depression was associated with higher levels of neuroticism and loneliness, as well as lower levels of sense of coherence, self-efficacy, and resilience. Neuroticism had a consistent and unique effect on depression at all ages. The other aforementioned variables (i.e., loneliness, sense of coherence, self-efficacy, and resilience) also showed unique effects on depression, although their independent effects varied across the age groups. Considering that depression is an ordinal variable, the beta values in Table 2 are probably underestimated using linear regression. However, these analyses were only conducted to derive aggregated personality scores, where the variables being weighted according to their importance for depression.
Bivariate correlations between personality and depression, and results from linear regression analyses predicting depression

Table 2. Long description
The table presents bivariate correlations and results from regression analyses predicting depression from personality characteristics measured at different ages in adolescence. It has 12 rows and 8 columns. The columns are labeled as follows: 12–13 years Polycor, 12–13 years Beta, 14–15 years Polycor, 14–15 years Beta, 16–17 years Polycor, 16–17 years Beta, 18 years Polycor, and 18 years Beta. The rows are labeled with variables: N, E, O, A, C, SEF, RS, ER, LON, SOC, and IMP. Each cell contains a numerical value representing the correlation or regression result. Notable trends include consistent negative correlations between depression and variables like SEF, RS, and SOC across different ages, and positive correlations with variables like N and LON.
Note: Polycor, polyserial bivariate correlation with depression; Beta, standardized beta, predicting depression from all independent variables; N, neuroticism; E, extraversion; O, openness; A, agreeableness; C, conscientiousness; SEF, self-efficacy; RS, Resilience scale; ER, ego resilience; LON, loneliness; SOC, sense of coherence; IMP, impulsivity.
* p < .05. **p < .01. ***p < .001.
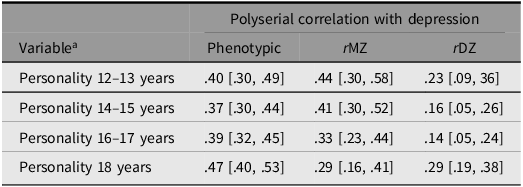
The heritability of depression was estimated as 43%, while the heritability estimates for the aggregated personality scores ranged from 45% (18 years) to 56% (14–15 years). Nonshared environmental influences accounted for the remaining variance in all variables. That is, an AE model provided the best fit for all variables. In line with this, the twin correlations also indicated substantial additive genetic influence and negligible influence of shared environmental factors. Detailed information on twin correlations, univariate parameter estimates, and fit statistics can be found in Supplementary material Table S4 (depression) and Table S5 (personality). In Table 3, polyserial correlations between the aggregated personality scores and depression are presented. Interestingly, the phenotypic correlations were quite similar in magnitude, regardless of whether personality was assessed early in adolescence or later in adolescence (with also a shorter time interval between the assessments of personality and depression). The extent to which the MZ correlation is lower than the phenotypic correlation is indicative of common influence of nonshared environmental factors in the association between personality and depression. In other words, this would indicate a ‘direct’ environmental effect of personality on depression. Such influences appear to be negligible when personality was measured at 12–13 years and 14–15 years. However, from 16–17 years, nonshared environmental influences contributed weakly to the association between personality and depression. Overall, the pattern of twin correlations indicate that personality is associated with depression mainly due to common genetic influences. Specifically, the DZ correlations were approximately half the size compared to the MZ correlations, indicating no influence of shared environmental factors. This aligns with findings from the univariate twin models, which showed no influence of shared environmental factors in any of the study variables. Thus, it is unlikely that shared environmental factors contribute to the covariance between personality and depression. The exception was the association between personality measured at 18 years and depression, where the MZ and DZ correlations were similar in magnitude. The reason why the MZ correlation is low in this case is probably because some people have remitted from depression. Specifically, 42 MZ twin pairs discordant on current depression (i.e., our outcome variable) were concordant on lifetime depression. If we use ‘lifetime depression’ instead of ‘current depression’ as our measure of depression, the MZ correlation increases to .39 (p < .001), and the corresponding DZ correlation is .21 (p < .001).
Cross-trait correlations

Table 3. Long description
A table with four rows and three columns comparing polyserial correlations between personality and depression across different ages. The columns are labeled Phenotypic, rMZ, and rDZ. The rows are labeled Personality 12–13 years, Personality 14–15 years, Personality 16–17 years, and Personality 18 years. Each cell contains correlation values with confidence intervals in brackets. Row 1: Personality 12–13 years, Phenotypic .40 [.30, .49], rMZ .44 [.30, .58], rDZ .23 [.09, .36]. Row 2: Personality 14–15 years, Phenotypic .37 [.30, .44], rMZ .41 [.30, .52], rDZ .16 [.05, .26]. Row 3: Personality 16–17 years, Phenotypic .39 [.32, .45], rMZ .33 [.23, .44], rDZ .14 [.05, .24]. Row 4: Personality 18 years, Phenotypic .47 [.40, .53], rMZ .29 [.16, .41], rDZ .29 [.19, .38].
Note: 95% confidence intervals in brackets. Phenotypic, cross-trait correlation without considering twin-pair membership; rMZ, cross-trait correlation within monozygotic twin pairs; rDZ, cross-trait correlation within dizygotic twin pairs.
a Aggregated personality score, where the personality variables are weighted relative to their importance for depression.
A series of bivariate Cholesky decomposition models were fitted to quantify the contributions of genetic and environmental influences on the relationship between personality throughout adolescence and depression in young adulthood. Specifically, we partitioned the phenotypic correlations between the aggregated personality scores and depression into genetic and environmental influences. The twin correlations presented in Table 3 suggest that an ADE model (rather than an ACE model) should be fitted for the model including personality measured at 14–15 years (i.e., based on the DZ correlation being less than half the magnitude of the MZ correlation). However, our univariate twin models did not provide evidence of nonadditive genetic influences creating variance in either depression or personality. Thus, nonadditive genetic factors are unlikely to confound the association between these variables. Consequently, full ACE models were fitted for all age groups, and compared to reduced AE models. Based on the AIC, BIC and sample-size adjusted BIC values, the best fitting model for all Cholesky decompositions was an AE model (see Table S6). When examining the twin correlations in Table 3, it may appear surprising that an AE model (which excludes shared environmental influences) provided best fit for the model including personality at 18 years. However, it is important to note that the correlation coefficient is based on complete cases only, whereas the Cholesky decompositions utilized full information maximum likelihood estimation, which utilizes all available information to generate parameter estimates that are most likely to reproduce the observed data. Therefore, the results obtained from the Cholesky decomposition are likely to be more reliable and accurate. Additionally, the support for an AE model is consistent with findings from the univariate twin models, which indicated no influence of shared environmental factors on any of the study variables.
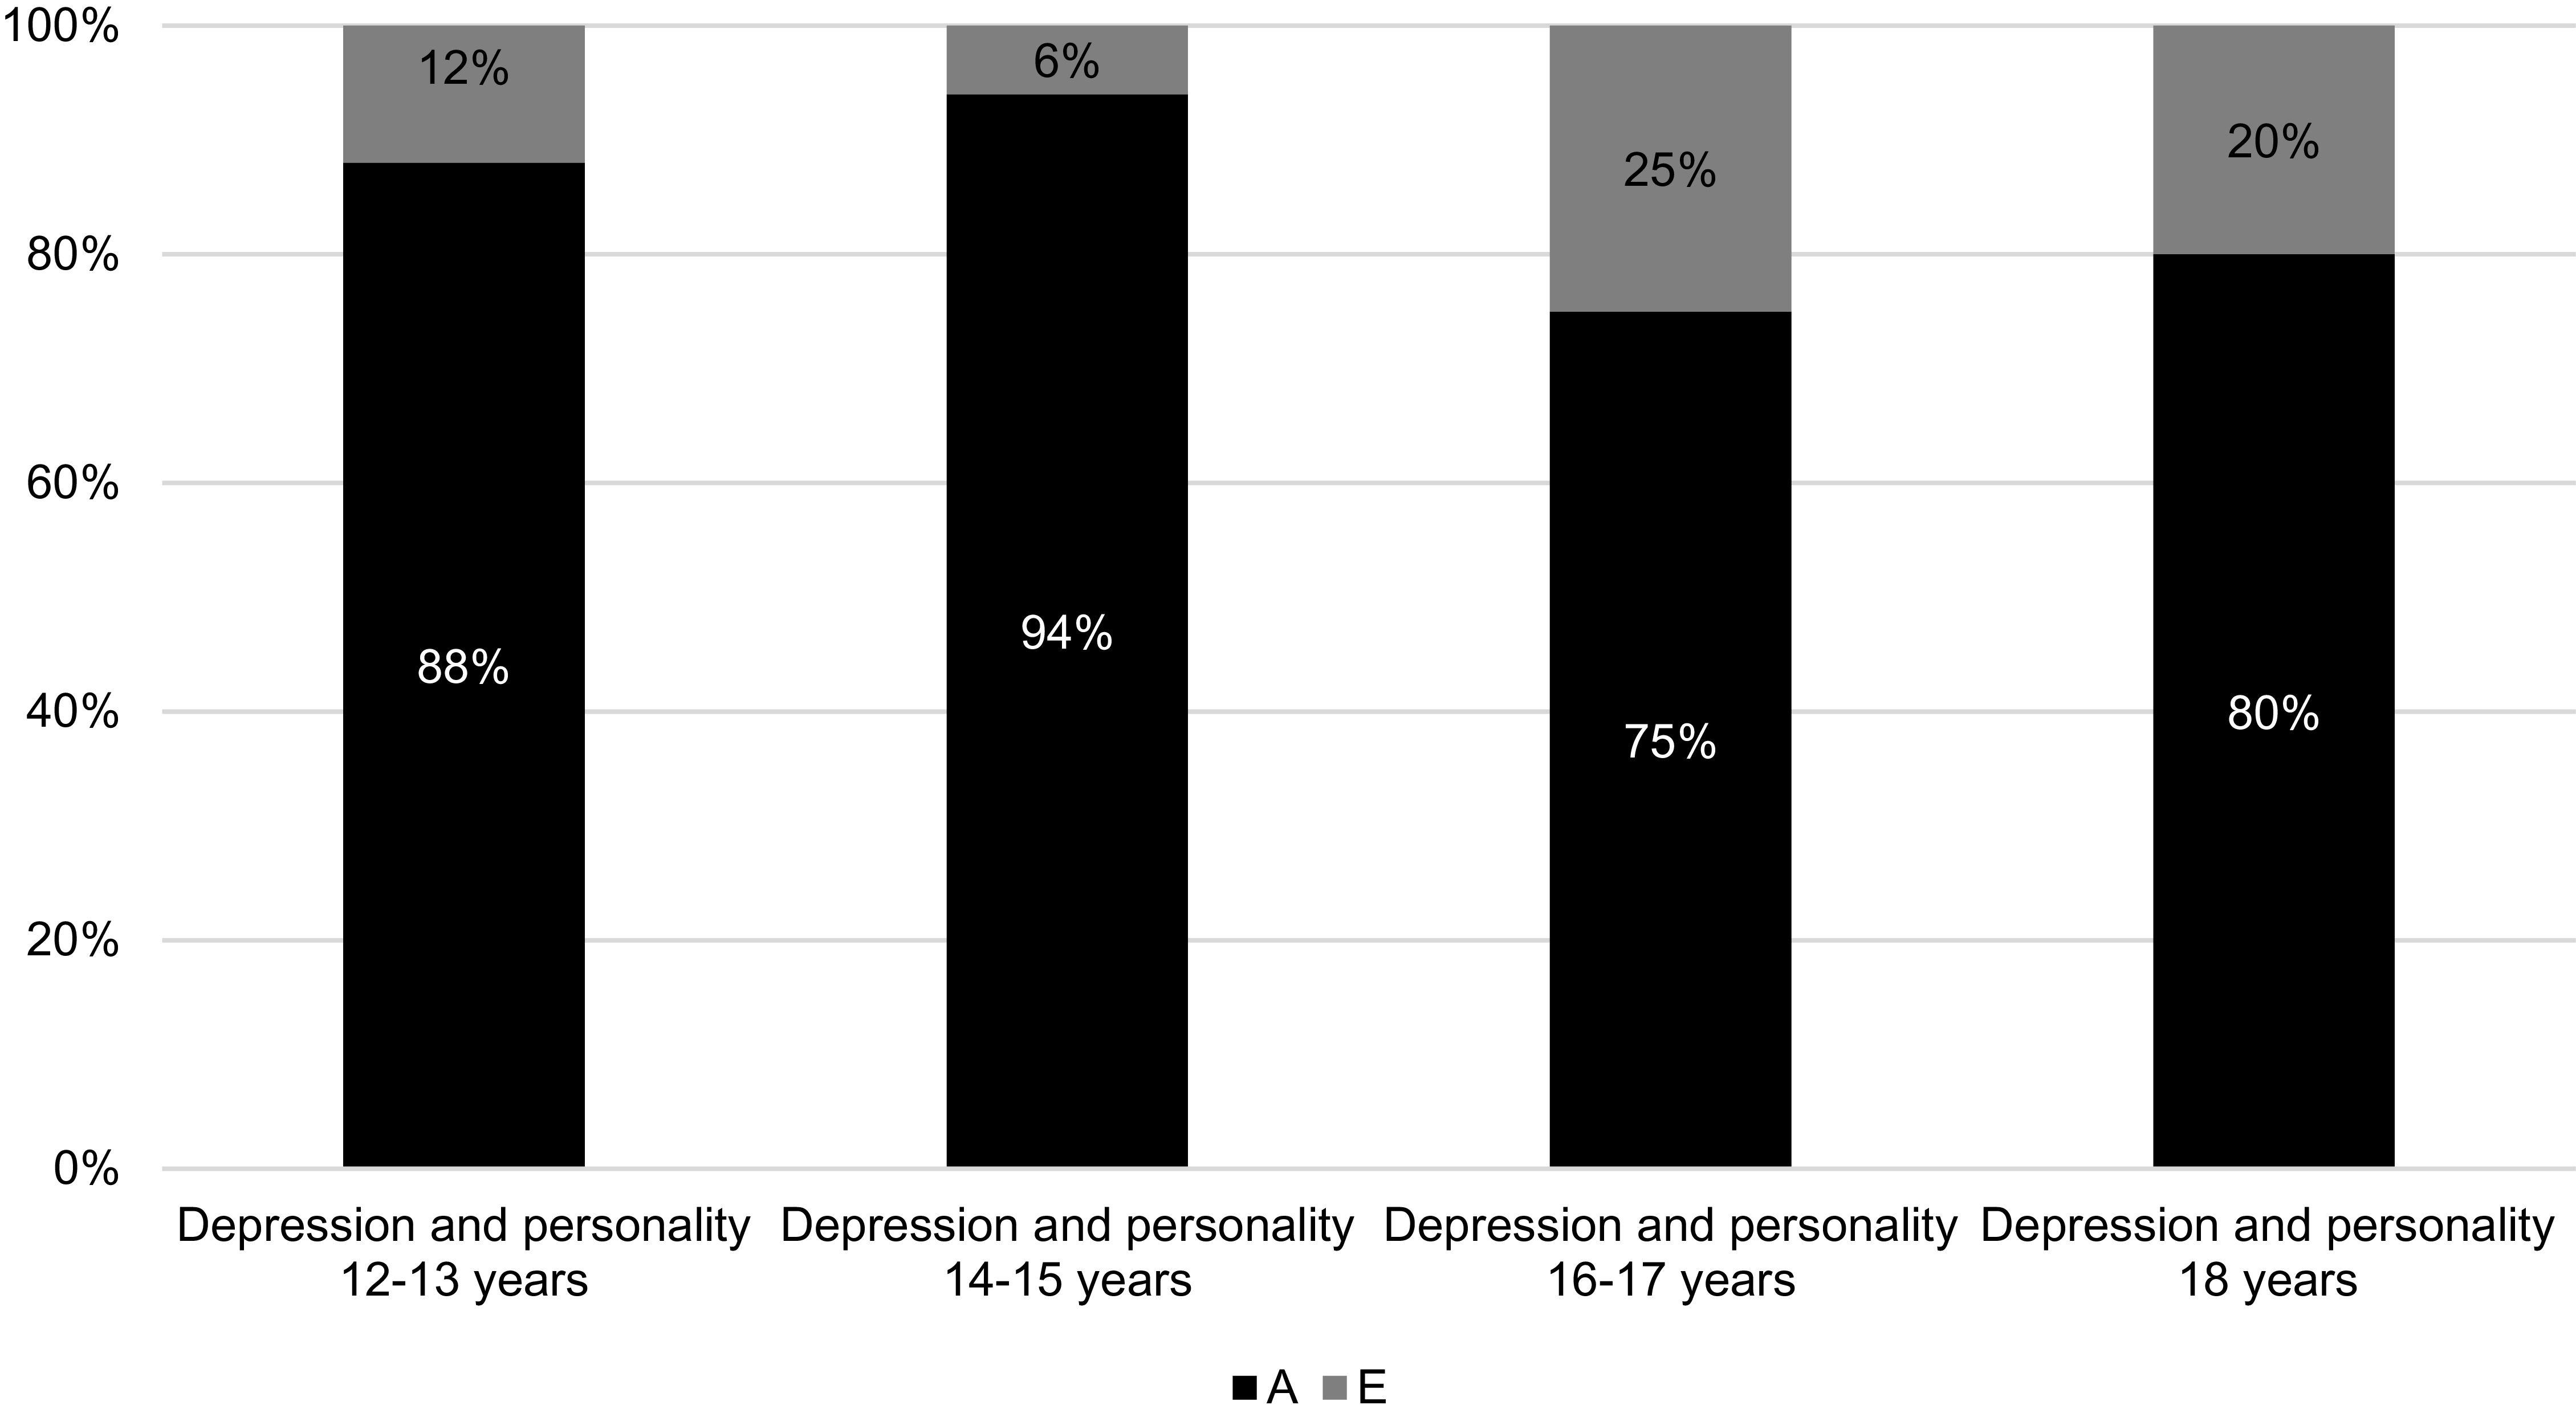
Figure 1 displays the percentages of the phenotypic correlations between personality and depression that can be attributed to genetic and environmental influences respectively. The standardized parameter estimates can be found in Supplementary material Table S7. As can be seen in Figure 1, the phenotypic associations between personality and depression were largely due to common genetic influences. Specifically, personality measured at 12–13 years and 14–15 years predicts depression almost exclusively due to common genetic influences. However, from 16–17 years, nonshared environmental influences weakly contributed to the association between personality and depression.
Proportion of genetic and environmental influences on the association between personality and depression.
Note: A, additive genetic influences; E, nonshared environmental influences. The percentages represent the proportions of the phenotypic correlations between aggregated personality scores and depression due to additive genetic and non-shared environmental influences.

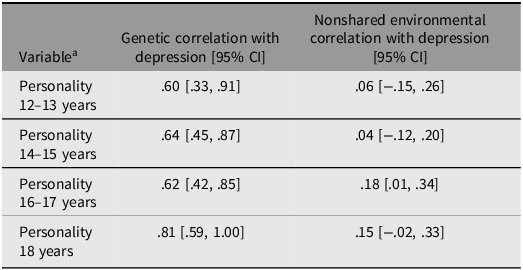
Table 4 presents genetic and environmental correlations between personality and depression, which further support the findings depicted in Figure 1. All genetic correlations were high, indicating a strong influence of common genetic factors on the relationship between personality and depression. Conversely, nonshared environmental factors appear to have a much weaker (and predominantly nonsignificant) influence. These findings align with the results presented in Figure 1, suggesting that nonshared environmental factors have almost no impact on the association between personality and depression when considering personality during early adolescence (and more than three years before the assessment of depression). However, when personality is measured later in adolescence (and closer in time to the assessment of depression), environmental factors may have a small ‘direct’ effect on depression, as indicated by the weak nonshared environmental correlations.
Genetic and environmental correlations

Table 4. Long description
The table presents genetic and environmental correlations between personality and depression across different ages. It has four rows and three columns. The columns are labeled 'Variable', 'Genetic correlation with depression [95% CI]', and 'Nonshared environmental correlation with depression [95% CI]'. The rows are labeled with different age ranges for personality assessment: 12–13 years, 14–15 years, 16–17 years, and 18 years. Each row provides the correlation values and their 95% confidence intervals for both genetic and nonshared environmental factors. The genetic correlations are consistently high across all age ranges, while the nonshared environmental correlations are generally lower and often nonsignificant.
Note:
a Aggregated personality score, where the personality variables are weighted relative to their importance for depression.
Genetic and environmental correlations between each individual trait and depression are provided in Table S8. Importantly, these correlations must be considered in relation to the overall strength of the phenotypic associations between the individual traits and depression. Consequently, the most interesting correlations are those between depression and neuroticism, loneliness, sense of coherence, self-efficacy, and resilience. However, for completeness, we report correlations for all traits across all age groups. Overall, the aforementioned traits showed a similar pattern of genetic and environmental correlations as presented in Table 4: moderate-to-large genetic correlations and small (and nonsignificant) nonshared environmental correlations.
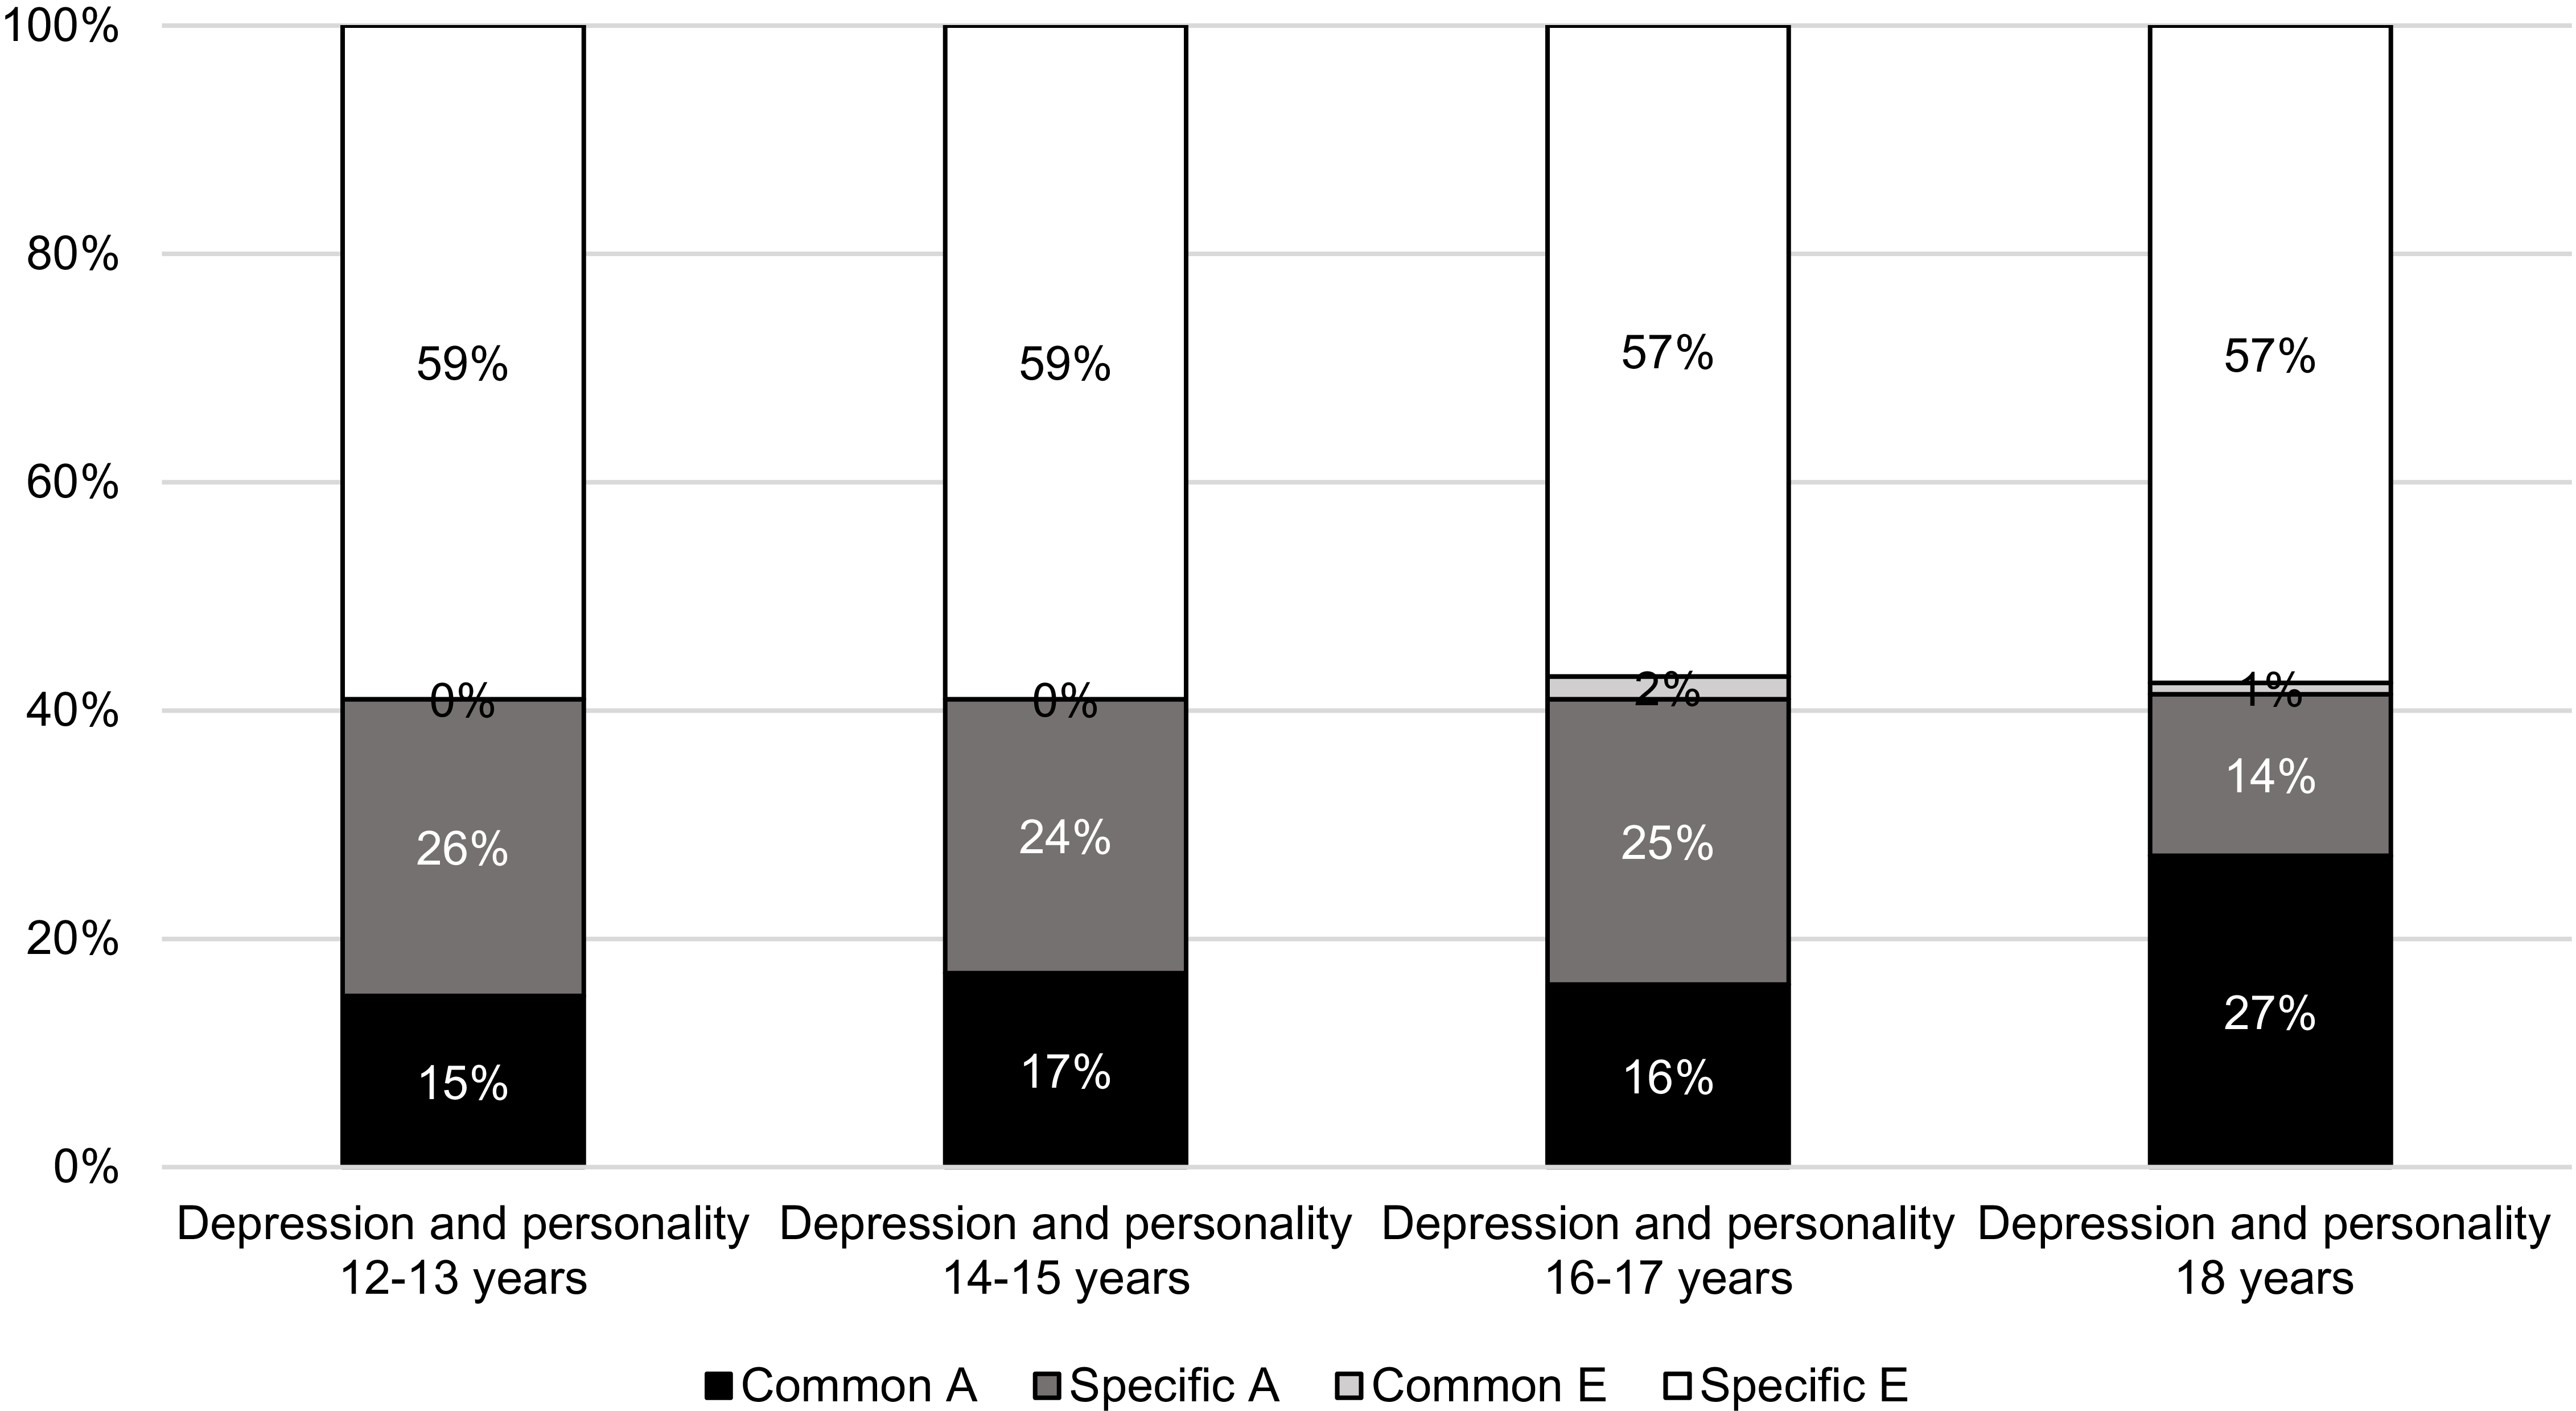
Figure 2 displays the total variance in depression, divided into portions of genetic and environmental influences that are unique to depression and those that are shared with personality at different ages during adolescence. The proportion of the genetic variance in depression that was shared with personality was relatively similar, regardless of whether personality was measured at age 12–13 years, 14–15 years or 16–17 years. However, when personality was assessed at age 18 (and relatively concurrent in time with the assessment of depression), a larger portion of the genetic variance in depression was shared with personality. Specifically, 66% of the total heritability of depression was shared with personality measured at age 18 years (i.e., 27/27 + 14). Regarding the nonshared environmental variance depression, the results suggest that depression does not share any environmental variance with personality. This implies that in this study, the environmental factors influencing depression are distinct from those influencing personality.
Total variance in depression, divided into unique and shared variance with personality.
Note: Common A, genetic influence common to both depression and personality; Specific A, genetic influence unique to depression; Common E, nonshared environmental influence common to both depression and personality; Specific E, nonshared environmental influence unique to depression.

Life Events and Depression
In addition to examining the relationship between personality and depression, we also examined the associations between reported negative dependent life events throughout adolescence and depression in young adulthood. The heritability of negative dependent life events was found to be high, with additive genetic influences explaining between 46% and 59% of the total variance across the different age groups in adolescence. The remaining variance was explained by nonshared environmental influences. Detailed information on twin correlations, univariate parameter estimates, and model fit can be found in Table S9.
Table 5 presents phenotypic, genetic, and nonshared environmental correlations between negative dependent life events and depression, as well as the proportions of the phenotypic correlations that were attributable genetic and environmental influences. Weak positive associations were observed between negative dependent life events and depression. Furthermore, the results suggest that the phenotypic associations between negative dependent life events and depression were primarily explained by common genetic influences. The influence of nonshared environmental factors was negligible when life events were measured at 12–13 years. However, when life events were assessed later in adolescence and the time interval between measurements of life events and depression decreased, there was an increasing contribution of nonshared environmental influences to the association. Standardized parameter estimates from the Cholesky decompositions can be found in Supplementary material Table S10.
Correlations and proportion of genetic and environmental influences on the association between negative dependent life events and depression

Table 5. Long description
A table with four rows and five columns. The columns are labeled Variable, rPH, rG, rE, Prop A, and Prop E. The rows are labeled NegDep 12–13 years and depression, NegDep 14–15 years and depression, NegDep 16–17 years and depression, and NegDep 18 years and depression. Row 1: NegDep 12–13 years and depression, rPH: .25 [.15, .35], rG: .32 [.07, .57], rE: .02 [-.20, .23], Prop A: 96 percent, Prop E: 4 percent. Row 2: NegDep 14–15 years and depression, rPH: .26 [.19, .34], rG: .42 [.22, .63], rE: .08 [-.09, .24], Prop A: 83 percent, Prop E: 17 percent. Row 3: NegDep 16–17 years and depression, rPH: .28 [.21, .34], rG: .45 [.23, .69], rE: .12 [-.05, .29], Prop A: 74 percent, Prop E: 26 percent. Row 4: NegDep 18 years and depression, rPH: .31 [.23, .38], rG: .43 [.20, .67], rE: .18 [-.01, .36], Prop A: 68 percent, Prop E: 32 percent.
Note: 95% confidence intervals in brackets. NegDep, negative dependent life events; r PH, phenotypic polyserial correlation; r G, genetic correlation; r E, nonshared environmental correlation; Prop A, percentage of the phenotypic correlation due to additive genetic influences; Prop E, percentage of the phenotypic correlation due to nonshared environmental influences.
Discussion
The present study examined the longitudinal relationship between personality throughout adolescence and depression in young adulthood, and quantified the extent to which these associations could be attributed to ‘direct’ effects of personality and the extent to which the associations were due to common genetic influences. The phenotypic analyses indicated that depression was primarily predicted by higher levels of neuroticism, higher levels of loneliness and lower sense of coherence, but also by lower self-efficacy, and lower resilience at some ages. These findings align with previous studies conducted with adolescent samples, which have reported associations between depression and both neuroticism (Etkin et al., Reference Etkin, De Caluwé, Ibáñez, Ortet and Mezquita2022; Klimstra et al., Reference Klimstra, Akse, Hale, Raaijmakers and Meeus2010), loneliness (Loades et al., Reference Loades, Chatburn, Higson-Sweeney, Reynolds, Shafran, Brigden, Linney, McManus, Borwick and Crawley2020; Vanhalst et al., Reference Vanhalst, Klimstra, Luyckx, Scholte, Engels and Goossens2012), sense of coherence (Schäfer et al., Reference Schäfer, Sopp, Fuchs, Kotzur, Maahs and Michael2023), self-efficacy (Wang et al., Reference Wang, Liu, Li, Zhu, Yue, Li, Li, Wu, Wang and Liu2022) and trait resilience (Hu et al., Reference Hu, Zhang and Wang2015). However, existing research on the relationship between personality characteristics and depression is predominantly based on cross-sectional study designs, and longitudinal studies typically follow the participants for a maximum of 2–3 years (e.g., Etkin et al., Reference Etkin, De Caluwé, Ibáñez, Ortet and Mezquita2022; Lyon et al., Reference Lyon, Elliott, Ware, Juhasz and Brown2021; Wang et al., Reference Wang, Liu, Li, Zhu, Yue, Li, Li, Wu, Wang and Liu2022). The present study contributes to the literature by examining the long-term effects of personality throughout adolescence on depression in young adulthood.
Results from the present study add to the literature by showing that personality characteristics measured already in early adolescence predict depression in young adulthood (Mean age = 19.1 years). Specifically, the phenotypic correlation between the aggregated personality score and depression was .40 (p < .001) when personality was measured at 12–13 years (i.e., 6–7 years before the assessment of depression). When personality was measured at 18 years, the phenotypic correlation with depression was .47 (p < .001). By using data from twins, we were also able to examine the nature of the observed associations between personality and depression. The results showed that the associations between the measured personality variables and depression were primarily driven by common genetic factors. Specifically, common genetic influences explained between 75% and 94% of the covariance between the aggregated personality scores and depression.
The heritability of depression was estimated as 43%, which is similar to heritability estimates reported in prior studies (Kendall et al., Reference Kendall, Van Assche, Andlauer, Choi, Luykx, Schulte and Lu2021; Smoller, Reference Smoller2016; Sullivan et al., Reference Sullivan, Neale and Kendler2000). The variance decomposition of depression divided into percentages of genetic and environmental influences that are unique to depression and those that are shared with personality, showed that a substantial amount of the total genetic variance in depression was shared with personality. Specifically, 66% of the heritability of depression measured around age 19 was accounted for by genetic factors that were also associated with personality measured at 18 years. Depression also shared substantial genetic variance with personality measured earlier in adolescence; 37% of the heritability of depression was shared with personality at 12–13 years. In contrast, the contribution of common nonshared environmental influences between depression and personality was found to be negligible. This provide further support for the results, indicating that the associations between personality and depression is primarily driven by common genetic influences. In other words, the results suggest that genetic vulnerabilities and predispositions associated with specific personality traits may also play a role in the development of depression. These findings are in line with existing genetically informative studies on neuroticism and depression, which consistently has shown that the observed association between these variables is largely due to common genetic influences (Kendler et al., Reference Kendler, Gatz, Gardner and Pedersen2006; Kendler & Myers, Reference Kendler and Myers2010; Mitrović et al., Reference Mitrović, Mihić, Sadiković and Smederevac2023). Knowledge about the nature of the associations between depression and other personality variables beyond neuroticism is largely unknown. However, in line with our results, findings from a cross-sectional study of 18-year-old twins suggest that loneliness and depression share substantial genetic origins (Matthews et al., Reference Matthews, Danese, Wertz, Odgers, Ambler, Moffitt and Arseneault2016).
In sum, our results suggest that personality characteristics in adolescence, such as high neuroticism, loneliness, low self-efficacy, low resilience, and low sense of coherence may represent (genetic) vulnerabilities to later development of depression. One may wonder what the practical implications are when the associations between personality and depression were found to be largely genetic. It is commonly assumed that associations with a stronger environmental component are more effective in terms of preventive efforts. However, it is important to emphasize that this study is observational in nature and does not examine the effect of an intervention. Therefore, even though the associations between personality and depression were mainly driven by common genetic influences, it does not necessarily imply that preventive efforts targeting personality traits associated with depression will yield no effect. This should be examined in future studies.
We also examined the nature of the relationship between negative dependent life events during adolescence and depression in young adulthood. Although it has been known for a long time that measured environments are not solely environmental in nature (Kendler & Baker, Reference Kendler and Baker2007) and that individuals with depression experience negative life events partly due to own characteristics and behaviors (Hammen, Reference Hammen2006), much of what we know about the relationship between life events and depression comes from pure association studies that have not been able to take the role of genetics into account. Results from the present study suggest that negative dependent life events were associated with depression, mainly because genetic factors that contribute to depression also influence the likelihood of experiencing negative dependent life events. In other words, individuals who are genetically predisposed to develop depression are also more likely to experience negative dependent life events (i.e., gene-environment correlations). These findings challenge expectations based on common sense reasoning that would suggest that we are passive recipients of our environment. Rather, the results suggest that negative life events, usually considered as solely environmental stressors, may also reflect genetic risk factors for depression. These results are consistent with findings from existing genetically informative studies. Indeed, prior twin studies have found that a large proportion of the associations between dependent stressful life events and depressive symptoms are due to common genetic influences (Boardman et al., Reference Boardman, Alexander and Stallings2011; Kendler & Gardner, Reference Kendler and Gardner2010). Additionally, a recent study by Harrison et al. (Reference Harrison, Docherty, Finsaas, Kotov, Shabalin, Waszczuk, Katz, Davila and Klein2023) found that genetic risk for depression was associated with increased exposure of dependent stressful life events, further supporting the role of gene-environment correlations in explaining the relationship between dependent stress and depression.
Gene-environment correlations refer to situations where an individual’s genetic predisposition influences which environments they find themselves in (Plomin et al., Reference Plomin, DeFries and Loehlin1977). In the case of active gene-environment correlation, individuals with a genetic predisposition for depressive symptoms actively select into environments that increase the likelihood of experiencing negative life events. Evocative gene-environment correlations, on the other hand, occur when an individual’s genetically influenced characteristics elicit specific reactions from the environment. For example, an individual with a genetic predisposition for low mood and irritability may elicit negative reactions from parents or peers. Adolescence represents a time in which the teenager is given increasing autonomy, with increasing opportunities to choose their own surroundings. This may explain why genetic factors play an important role in the relationship between reported negative dependent life events during adolescence and depression in young adulthood.
Although our findings suggest that the relationship between negative dependent life events during adolescence and depression in young adulthood is primarily accounted for by common genetic influences, the results also showed some support that life events may be true environmental risk factors for depression, at least recent reported life events. Specifically, nonshared environmental influences explained 26% and 32% of the association when negative dependent life events were measured at age 16–17 years and 18 years respectively. However, it is important to recognize that these environmental contributions are relatively weak when considering the overall strength of the associations between life events and depression at the phenotypic level, which were found to be weak.
Limitations and Strengths
The current study has some potential limitations. First, our measure of depression included both clinical and subclinical scores. The results may thus not be generalizable to clinical populations. However, extensive research has shown that individual differences in psychopathology reflect differences of degree rather than differences of kind (Haslam et al., Reference Haslam, McGrath, Viechtbauer and Kuppens2020), suggesting that there is no reason to anticipate different results in a clinical population. Second, our measure of negative dependent life events included multiple events, potentially capturing events with varying effects on depression. However, studies consistently fail to identify systematic effects of single events. Rather, it seems that the environmental effects are driven by many experiences with small effects (Plomin et al., Reference Plomin, DeFries, Knopik and Neiderhiser2016; Turkheimer & Waldron, Reference Turkheimer and Waldron2000). Therefore, most studies aim to examine the combined effect of several life events on an outcome of interest. Third, since depression was not measured during the adolescent assessment periods, we cannot determine to what extent the personality measures reflect adolescent depression and to what extent they represent precursors to depression. Fourth, it is important to note that this is not an interventional study. Thus, even though the associations between personality, life events and depression were mainly accounted for by common genetic influences, this does not necessarily imply that e.g., personality targeted interventions would not be effective in reducing symptoms of depression. The clinical implications of the results should be further explored though interventional studies.
The present study also has several strengths. By using a longitudinal design in which the participants were followed throughout adolescence and up to early adulthood, we were able to examine the long-term impact of personality and life events on depression. In addition, a comprehensive questionnaire battery allowed us to examine the influence of a range of personality characteristics on depression. Furthermore, the use of data from twins enabled us to examine the underlying nature (i.e., genetic and/or environmental) of associations between the variables. This allowed us to determine the extent to which personality and life events predict depression due to direct environmental effects, and to what extent these associations stems from common genetic influences.
Conclusion
The aim of this study was to examine the longitudinal associations between personality, negative life events and depression, and to explore the extent to which these associations could be attributed to common genetic influences and ‘direct’ environmental effects. Moderate associations between personality and depression were found already when personality was measured at 12–13 years of age (and 6–7 years prior to the assessment of depression). Additionally, weak positive associations were observed between negative dependent life events and depression. Overall, the results indicated that the associations between personality, life events and depression were predominantly influenced by common genetic factors.
Supplementary material
To view supplementary material for this article, please visit https://doi.org/10.1017/thg.2026.10090.
Acknowledgments
RBUP, Eastern and Southern Norway contributed to data collection.
Financial support
This work was supported by the Department of Psychology, University of Oslo, and Eirunn Skaug is funded by Foundation Dam [grant number 426701]. The data collection was supported by the Research Council of Norway [grant numbers 170089, 213722, 213760].
Competing interests
None of the authors have any conflicts of interest to disclose. The funders had no role in study design, data collection and analysis, decision to publish, or preparation of the manuscript.
Ethical standards
The study was based on informed consent, and was approved by the Norwegian Data Inspectorate and the Regional Committees for Medical and Health Research Ethics, ref. 2015/4 (19661). The study was not pre-registered.
CRediT authorship contribution statement
Eirunn Skaug: Conceptualization, Data Curation, Formal analysis, Funding acquisition, Methodology, Writing – Original Draft. Trine Waaktaar: Conceptualization, Data Curation, Funding acquisition, Investigation, Methodology, Project administration, Supervision, Writing – Review and Editing. Svenn Torgersen: Conceptualization, Data Curation, Funding acquisition, Investigation, Methodology, Project administration, Supervision, Writing – Review and Editing.



 Open access

