


I. INTRODUCTION
Danofloxacin mesylate (sold under the brand name Advocin) is an antibiotic, used to treat respiratory disease in cattle (Halleran et al., Reference Halleran, Callahan, Jacob, Sylvester, Prange, Papich and Foster2021), that belongs to the fluoroquinolone class of veterinary antibiotics approved for use in the US by the FDA (2023). Danofloxacin in humans can cause minor eye, skin, and gastrointestinal irritation, as well as gastrointestinal irritation in animals, and is not approved for human use by the FDA (2022). Danofloxacin mesylate is rapidly distributed and found in high levels in the mammary glands, and respiratory and intestinal tracts following subcutaneous, intramuscular, or intravenous injection in livestock animals (Schrickx and Fink-Gremmels, Reference Schrickx and Fink-Gremmels2007). The metabolites found after administration included N-desmethyl- and unmetabolized danofloxacin, and NO. The European Medicines Agency (EMA) found very high doses, around 100–200 mg/kg body weight/day, also caused toxic fetal and maternal effects in rats and mice (1997).
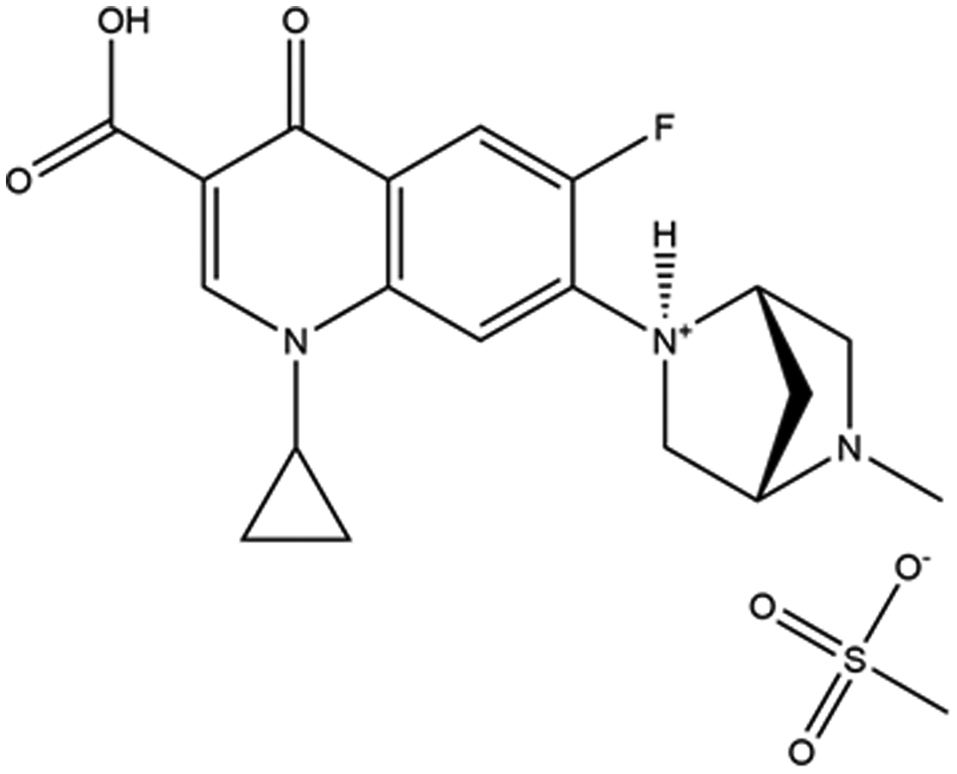
The systematic name (CAS Registry Number 119478-55-6) is 1-cyclopropyl-6-fluoro-7-[(1S,4S)-5-methyl-2,5-diazabicyclo[2.2.1]heptan-2-yl]-4-oxoquinoline-3-carboxylic acid methanesulfonate. A two-dimensional molecular diagram is shown in Figure 1. We are unaware of any published X-ray powder diffraction data on danofloxacin mesylate.
The 2D molecular structure of danofloxacin mesylate.
This work was carried out as part of a project (Kaduk et al., Reference Kaduk, Crowder, Zhong, Fawcett and Suchomel2014) to determine the crystal structures of large-volume commercial pharmaceuticals and include high-quality powder diffraction data for them in the Powder Diffraction File (Gates-Rector and Blanton, Reference Gates-Rector and Blanton2019).
II. EXPERIMENTAL
Danofloxacin mesylate was a commercial reagent, purchased from TargetMol (Batch #115470), and was used as-received. The white powder was packed into a 1.5 mm diameter Kapton capillary and rotated during the measurement at ~50 Hz. The powder pattern was measured at 295 K at beamline 11-BM (Antao et al., Reference Antao, Hassan, Wang, Lee and Toby2008; Lee et al., Reference Lee, Shu, Ramanathan, Preissner, Wang, Beno, Von Dreele, Ribaud, Kurtz, Antao, Jiao and Toby2008; Wang et al., Reference Wang, Toby, Lee, Ribaud, Antao, Kurtz, Ramanathan, Von Dreele and Beno2008) of the Advanced Photon Source at Argonne National Laboratory using a wavelength of 0.458208(2) Å from 0.5 to 50° 2θ with a step size of 0.001° and a counting time of 0.1 s/step. The high-resolution powder diffraction data were collected using 12 silicon crystal analyzers that allow for high angular resolution, high precision, and accurate peak positions. A mixture of silicon (NIST SRM 640c) and alumina (NIST SRM 676a) standards (ratio Al2O3:Si = 2:1 by weight) was used to calibrate the instrument and refine the monochromatic wavelength used in the experiment.
The pattern was indexed using N-TREOR (Altomare et al., Reference Altomare, Cuocci, Giacovazzo, Moliterni, Rizzi, Corriero and Falcicchio2013) on a primitive triclinic unit cell with a = 6.77464, b = 12.49476, c = 12.83040 Å, α = 84.879, β = 87.734, γ = 75.046°, V = 1044.9 Å3, and Z = 2. A reduced cell search in the Cambridge Structural Database (Groom et al., Reference Groom, Bruno, Lightfoot and Ward2016) yielded no hits. Since danofloxacin is a chiral molecule, we assumed the space group for danofloxacin mesylate to be P1, resulting in two cations and two anions in the asymmetric unit. Structure solutions in space group P-1 yielded significantly higher residuals.
The danofloxacin molecule was downloaded from PubChem (Kim et al., Reference Kim, Chen, Cheng, Gindulyte, He, He, Li, Shoemaker, Thiessen, Yu, Zaslavsky, Zhang and Bolton2023) as Conformer3D_CID_71335.sdf, and converted to a *.mol2 file using Mercury (Macrae et al., Reference Macrae, Sovago, Cottrell, Galek, McCabe, Pidcock, Platings, Shields, Stevens, Towler and Wood2020). The mesylate anion was built using Spartan ‘18 (Wavefunction, 2020), and saved as a *.mol2 file. The crystal structure was solved using Monte Carlo simulated annealing techniques as implemented in DASH (David et al., Reference David, Shankland, van de Streek, Pidcock, Motherwell and Cole2006), including Mogul Distribution Bias.
Many solutions were examined visually, and the 11 best solutions were refined. Among the solutions, there were variations in the orientation of the cyclopropane rings and the methyl group on the diazabicycloheptane cage. In the two best solutions, the orientations of these groups were the same. Among the solutions, there were also variations in the orientations of the mesylate anions. This might not be surprising, as the mesylate consists of a tetrahedral S atom surrounded by three O atoms and a methyl group. It may be difficult to distinguish 8 (O) from 9 (CH3) electrons using X-ray powder data. In the two best solutions the orientation of one of the mesylates was the same, while the other differed; the methyl group and one of the O atoms were interchanged. We attempted a refinement of a disordered model, but it was unstable and yielded chemically unreasonable results. Since we need an ordered model to perform DFT calculations, we concentrated on ordered models, though there may be some disorder of both the mesylate anions and the danofloxacin cations.
An additional feature of the structure solution is identifying which of the three N atoms of each cation is protonated. Normally, this is straightforward, as a short N–H⋯O hydrogen bond between the cation and anion can be identified. This was not the case in this structure.
Two different protonated states of danofloxacin have been identified (McCullagh et al., Reference McCullagh, Giles, Richardson, Stead and Palmer2018). Danofloxacin protomer I is protonated on the keto group of the oxoquinoline ring system. Protomer II is protonated at either what was designated as N6 or N5 (slightly less favorable). Each N atom is prochiral; protonating on the “up” or “down” sides yields another chiral center, so we had to consider protonating on either side of each N atom. Spartan calculations of isolated cations (DFT/B3LYP/6-31G*/water) suggested that protonation at N6 was most favorable. Cations protonated at N5 were 19 kcal/mol higher in energy (as suggested by McCullagh et al.), and those protonated at N7 were 53 kcal/mol higher in energy.
In the solid state, there are no particularly close N⋯O distances, so the normal/expected hydrogen bonds are not apparent. For N6 (and N52), the shortest N⋯O distance is >4.00 Å. For N7 (and N53), the shortest distances are 3.34 and 3.45 Å. For N5 (and N51), the shortest distances are 2.79/3.17 and 2.91 Å – both to O50/O49 and O3 of the carboxylic acid groups. Among these O atoms, the hydroxyl group is the most negative (from the isolated cation calculations), so it is not an unreasonable place for a long N–H⋯O hydrogen bond and seems to be the most likely acceptor for the proton. The next shortest N⋯O distances are to the carbonyl groups of the carboxylic acids, in the “other” directions. The expected N–H⋯O hydrogen bonds between the cations and mesylate anions are not present. Positions of H109 and H110 were derived by placing them on the shortest N⋯O vectors.
Rietveld refinement was carried out using GSAS-II (Toby and Von Dreele, Reference Toby and Von Dreele2013). Only the 2.0–25.0° portion of the pattern was included in the refinement (d min = 1.058 Å). All non-H bond distances and angles were subjected to restraints, based on a Mercury/Mogul Geometry check (Bruno et al., Reference Bruno, Cole, Kessler, Luo, Motherwell, Purkis, Smith, Taylor, Cooper, Harris and Orpen2004; Sykes et al., Reference Sykes, McCabe, Allen, Battle, Bruno and Wood2011). The Mogul average and standard deviation for each quantity were used as the restraint parameters. The restraints contributed 12.0% to the final χ 2. The hydrogen atoms were included in calculated positions, which were recalculated during the refinement using Materials Studio (Dassault Systèmes, 2021). The Uiso of the heavy atoms were grouped by chemical similarity. The Uiso for the H atoms were fixed at 1.3× the Uiso of the heavy atoms to which they are attached. No preferred orientation model was included in the refinement. The peak profiles were described using the generalized microstrain model (Stephens, Reference Stephens1999). The background was modeled using a 3-term shifted Chebyshev polynomial, and a peak at 7.31° 2θ to model the scattering from the Kapton capillary and any amorphous component.
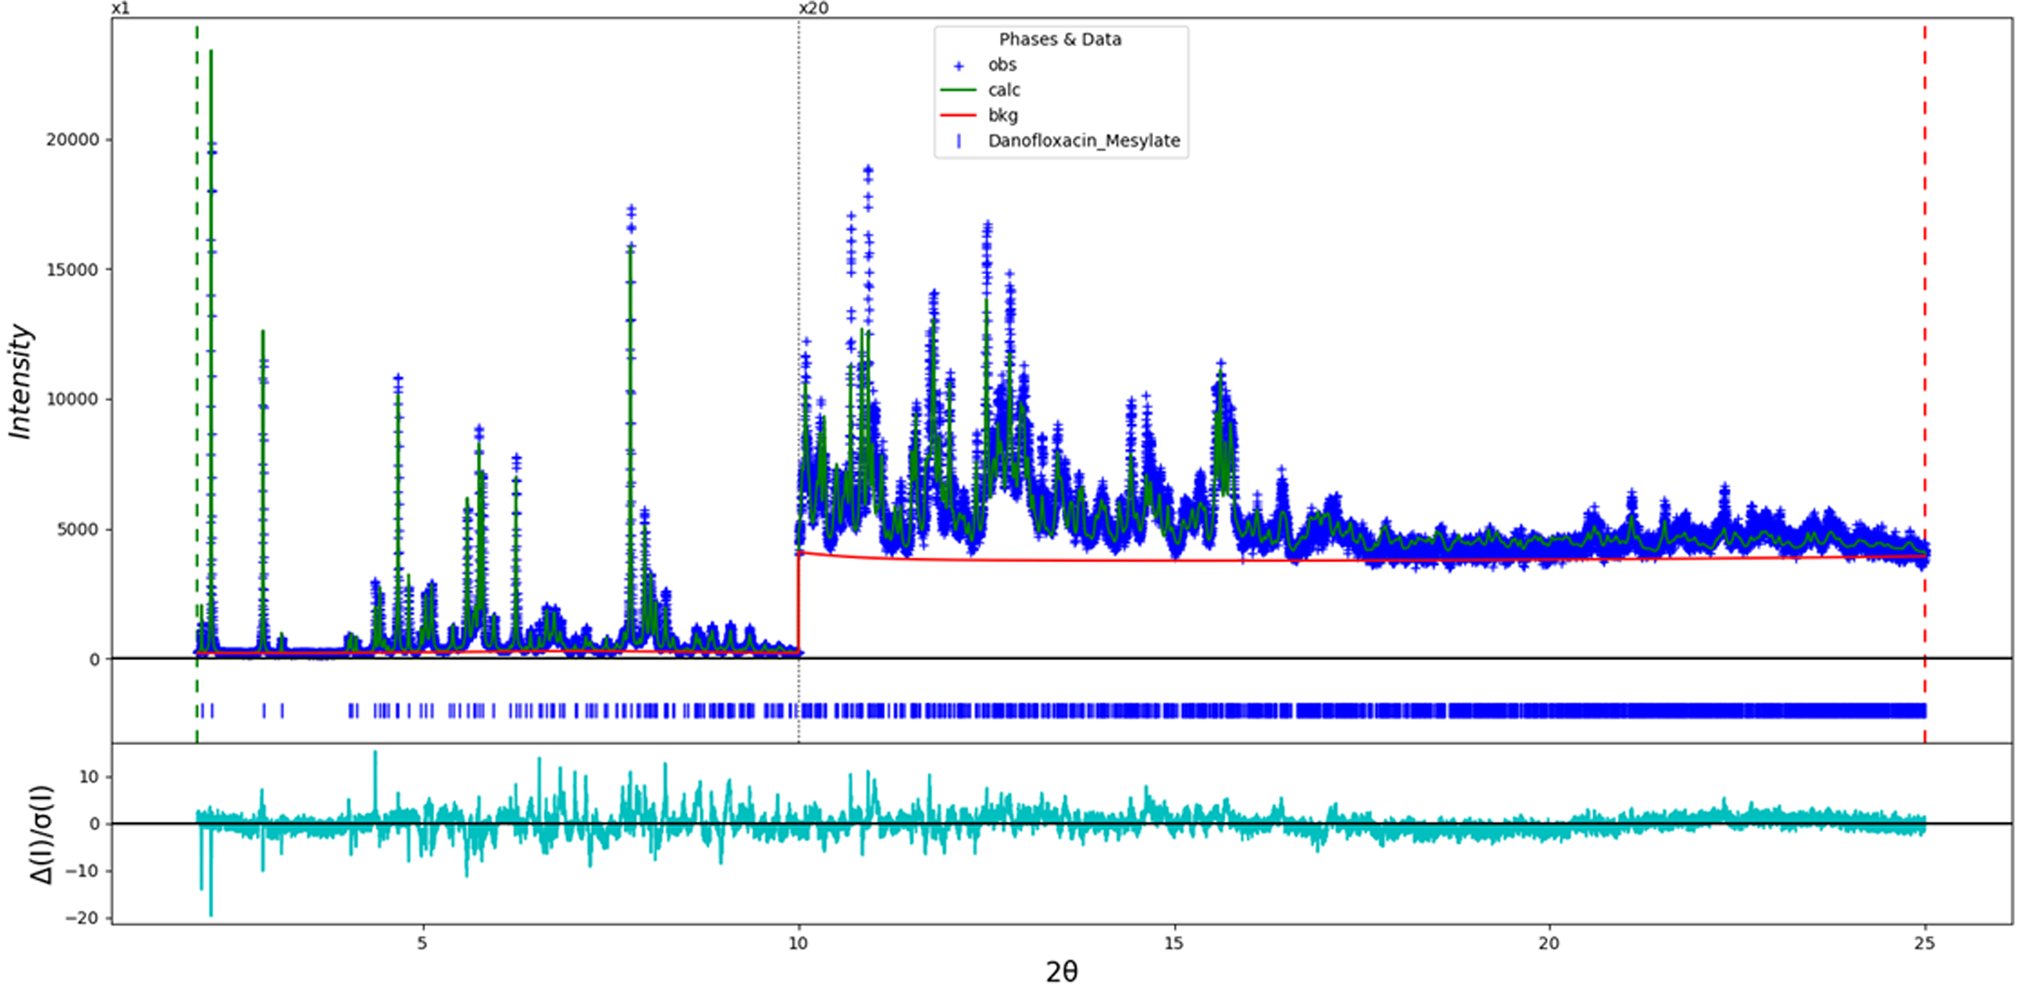
The final refinement (begun from the DFT-optimized structure) of 216 variables using 23,037 observations and 180 restraints yielded the residuals Rwp = 0.1089 and GOF = 2.27. The largest peak (0.91 Å from O50) and hole (1.76 Å from C55) in the difference Fourier map were 0.55(12) and −0.50(12) eÅ−3, respectively. The largest errors in the difference plot (Figure 2) are in the intensities of some of the peaks and may reflect the simplified model used here.
The Rietveld plot for the refinement of danofloxacin mesylate. The blue crosses represent the observed data points, and the green line is the calculated pattern. The cyan curve is the normalized error plot, and the red line is the background curve. The vertical scale has been multiplied by a factor of 20× for 2θ > 10.0°.
The structure of danofloxacin mesylate was optimized (fixed experimental unit cell) with density functional techniques using VASP (Kresse and Furthmüller, Reference Kresse and Furthmüller1996) through the MedeA graphical interface (Materials Design, 2016). The calculation was carried out on 16 2.4 GHz processors (each with 4 Gb RAM) of a 64-processor HP Proliant DL580 Generation 7 Linux cluster at North Central College. The calculation used the GGA-PBE functional, a plane wave cutoff energy of 400.0 eV, and a k-point spacing of 0.5 Å−1 leading to a 2 × 2 × 1 mesh, and took ~13 h. Single-point density functional theory calculations (fixed experimental cell) and population analysis were carried out using CRYSTAL23 (Erba et al., Reference Erba, Desmaris, Casassa, Civalleri, Donà, Bush, Searle, Maschio, Daga, Cossard, Ribaldone, Ascrizzi, Marana, Flament and Kirtman2023). The basis sets for the H, C, N, and O atoms in the calculation were those of Gatti et al. (Reference Gatti, Saunders and Roetti1994), and those for F and S were those of Peintinger et al. (Reference Peintinger, Vilela Oliveira and Bredow2013). The calculations were run on a 3.5 GHz PC using 8 k-points and the B3LYP functional and took ~6.4 h.
III. RESULTS AND DISCUSSION
The strong N–H⋯O hydrogen bonds which might have been expected between the cations and the anions are not present. Although calculations of isolated cations suggest that the protonation of N6 yields the lowest-energy structure, the solid-state interactions indicate that N5 is protonated in both cations.
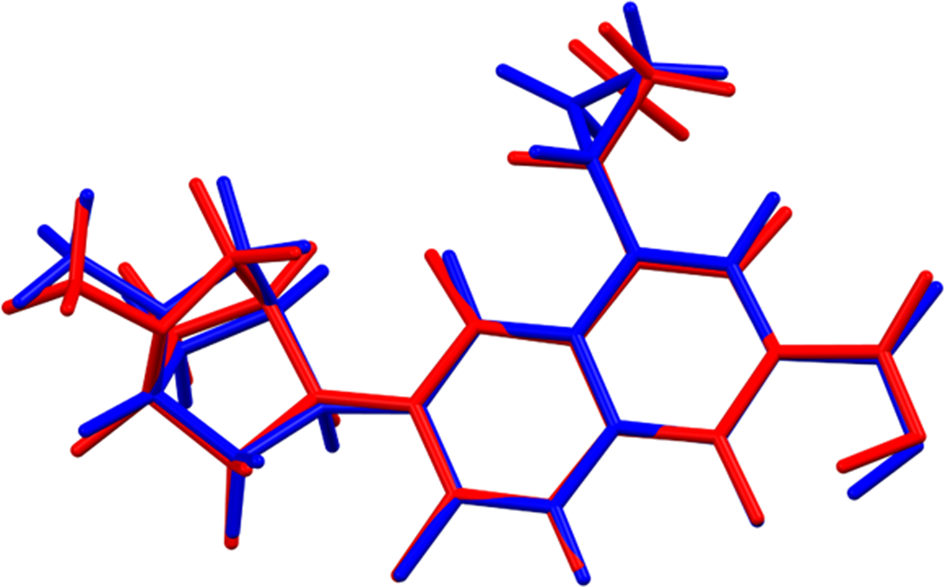
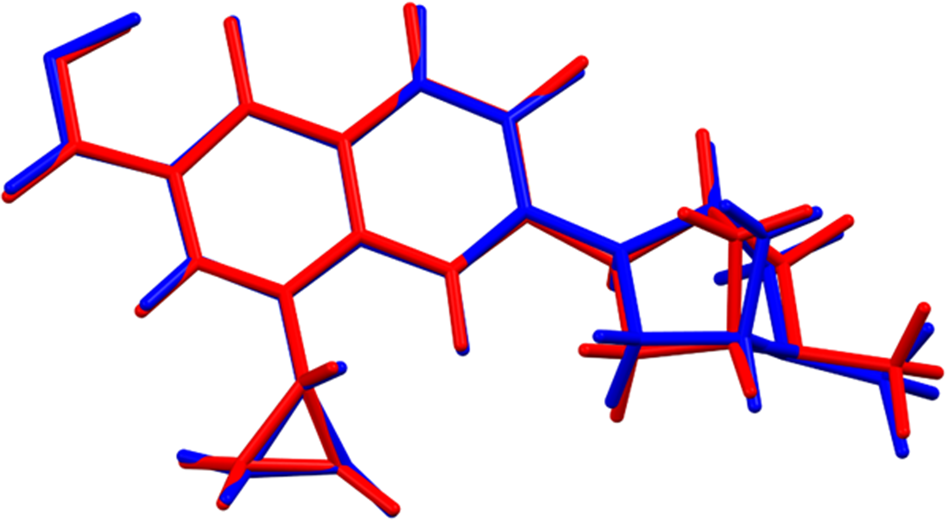
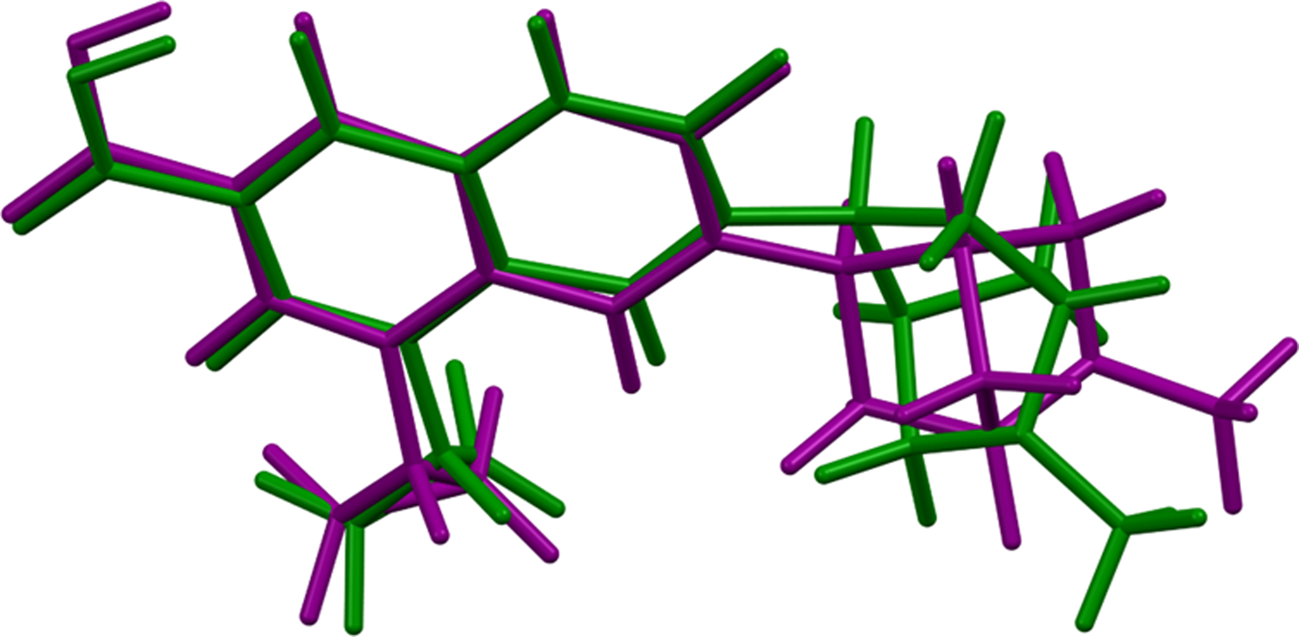
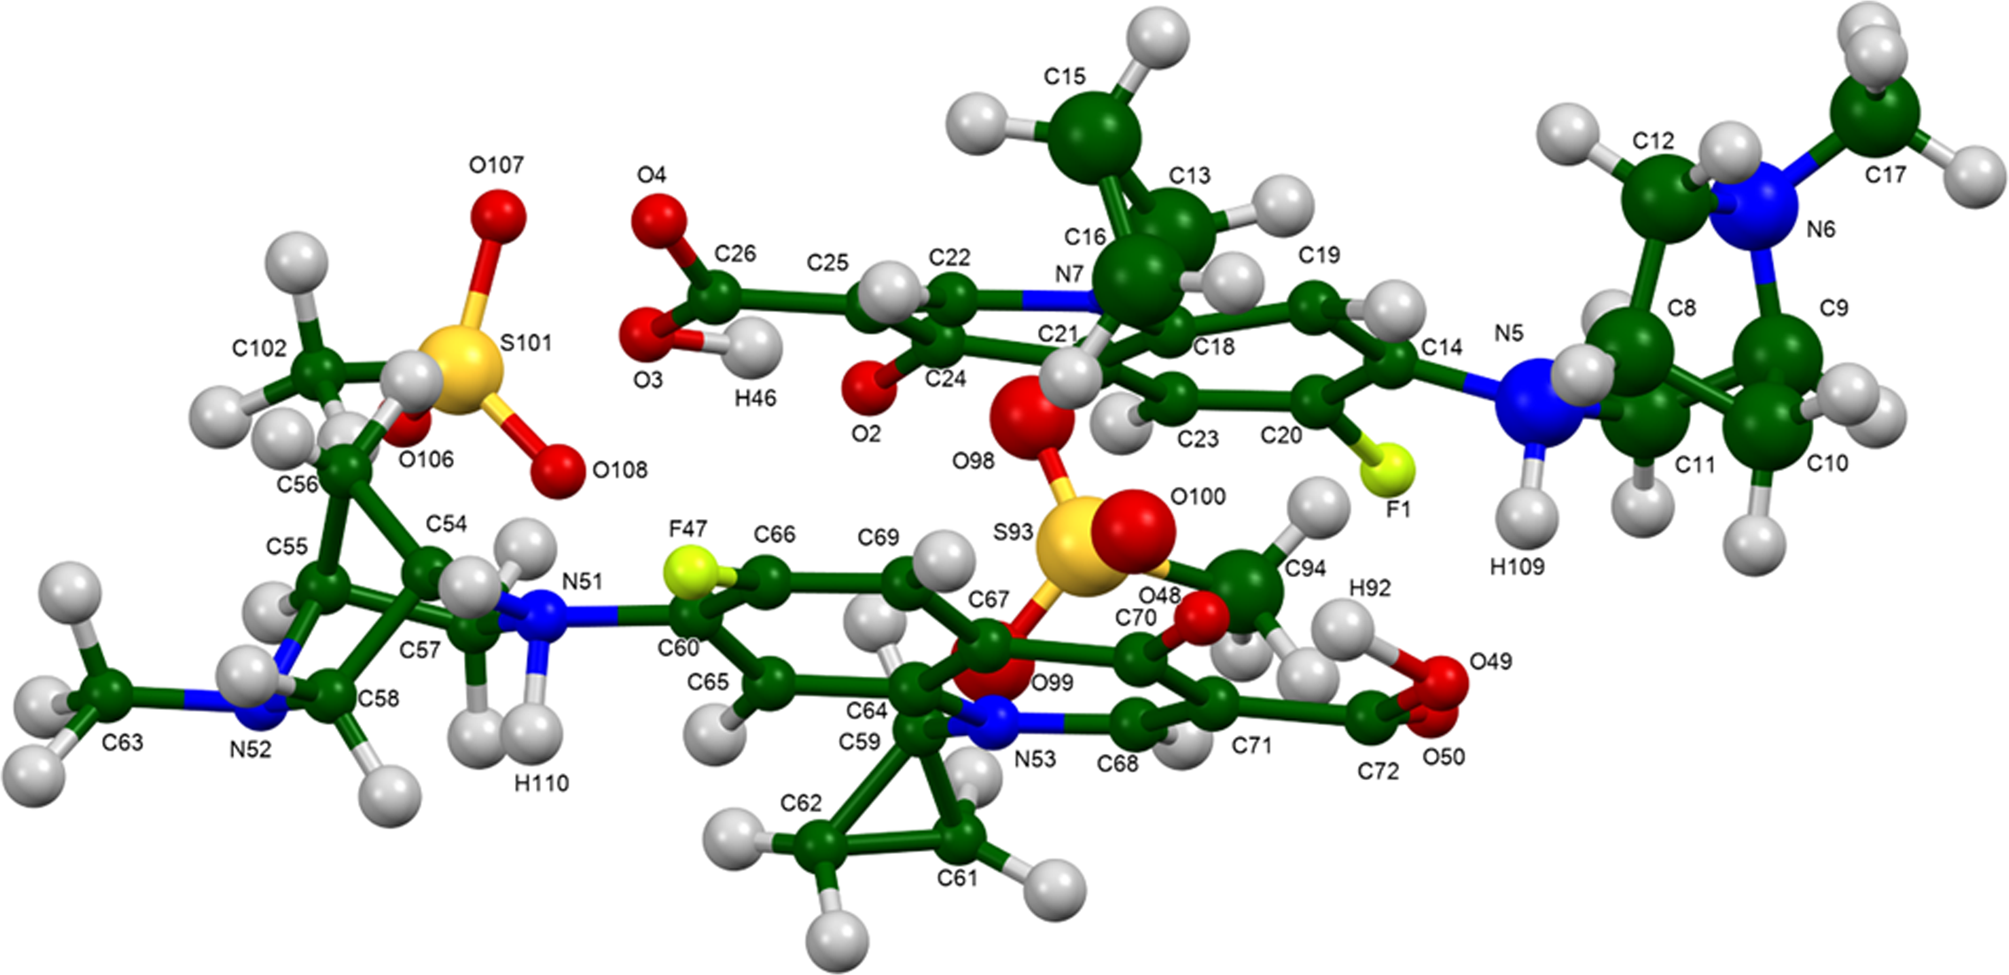
The root-mean-square Cartesian displacement between the Rietveld-refined and DFT-optimized structures of cation 1 (the lower atom numbers) is 0.353 Å (Figure 3). The similar quantity for the cation 2 is 0.266 Å (Figure 4). The agreements are within the normal range for correct structures (van de Streek and Neumann, Reference van de Streek and Neumann2014), and provide evidence that the refined structure is correct. The greatest differences are in the methyl groups on the diazabicycloheptane cages, and may indicate that protonation at N5 is not completely uniform; protonation on the “up” or “down” side of N5 results in a significant difference in the cage conformation. This discussion concentrates on the VASP-optimized structure. The rms difference between cation 1 and cation 2 is 1.209 Å (Figure 5). The major differences are in the orientations of the diazabicycloheptane cages; they differ in orientation by approximately 180°. The asymmetric unit (with atom numbering) is illustrated in Figure 6.
Comparison of the Rietveld-refined (red) and VASP-optimized (blue) structures of danofloxacin cation 1. The rms Cartesian displacement is 0.353 Å. Image generated using Mercury (Macrae et al., Reference Macrae, Sovago, Cottrell, Galek, McCabe, Pidcock, Platings, Shields, Stevens, Towler and Wood2020).
Comparison of the Rietveld-refined (red) and VASP-optimized (blue) structures of danofloxacin cation 2. The rms Cartesian displacement is 0.266 Å. Image generated using Mercury (Macrae et al., Reference Macrae, Sovago, Cottrell, Galek, McCabe, Pidcock, Platings, Shields, Stevens, Towler and Wood2020).
Comparison of the structure of danofloxacin cation 1 (green) and cation 2 (purple). The rms Cartesian displacement is 1.209 Å. Image generated using Mercury (Macrae et al., Reference Macrae, Sovago, Cottrell, Galek, McCabe, Pidcock, Platings, Shields, Stevens, Towler and Wood2020).
The asymmetric unit of danofloxacin mesylate, with the atom numbering. The atoms are represented by 50% probability spheroids. Image generated using Mercury (Macrae et al., Reference Macrae, Sovago, Cottrell, Galek, McCabe, Pidcock, Platings, Shields, Stevens, Towler and Wood2020).
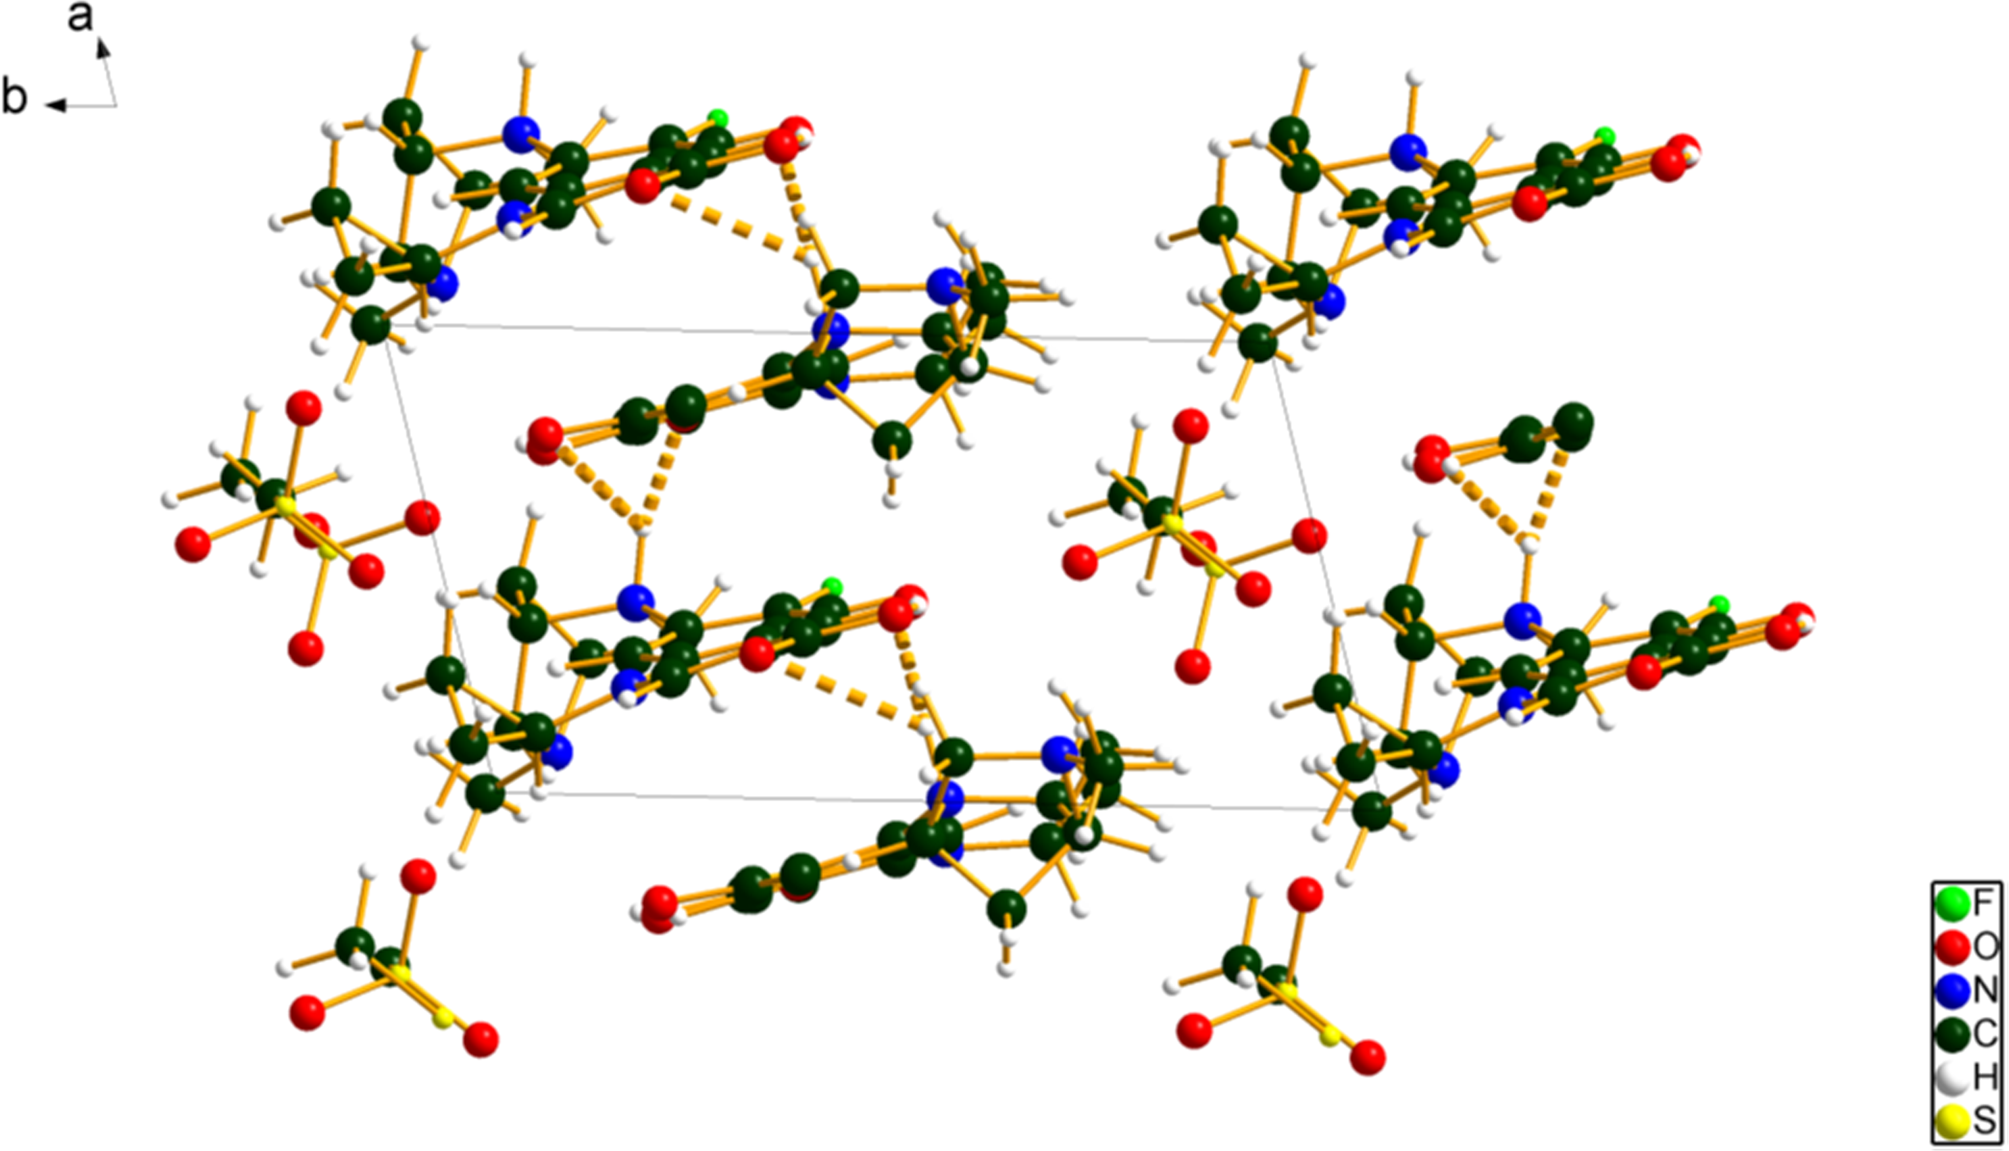
The crystal structure consists of alternating layers of cations and anions parallel to the ac-plane (Figure 7). There is parallel stacking of the oxoquinoline rings along the a-axis. The mean planes of the oxoquinoline rings are (11,6,2) for cation 1 and (12,6,−1) for cation 2. The Mercury Aromatics Analyser indicates one moderate interaction of 5.34 Å between the two cations. N–H⋯O hydrogen bonds link the cations into zig-zag chains along the a-axis.
The crystal structure of danofloxacin mesylate, viewed down the c-axis. Image generated using Diamond (Crystal Impact, 2022).
All of the bond distances and bond angles fall within the normal ranges indicated by a Mercury Mogul Geometry check (Macrae et al., Reference Macrae, Sovago, Cottrell, Galek, McCabe, Pidcock, Platings, Shields, Stevens, Towler and Wood2020). Torsion angles involving rotation about the C13–N7 (and C59–N53) bonds lie on the tails of bimodal distributions and are flagged as unusual. Torsion angles involving rotation about the C14–N5 (and C60–N51) bonds yielded either few or no hits. These reflect the orientation of the cage and oxoquinoline fragments at the protonated nitrogens and indicate that these danofloxacin cations are truly unusual.
Quantum chemical geometry optimization of the isolated cations (DFT/B3LYP/6-31G*/water) using Spartan ‘18 (Wavefunction, 2020) indicated that cation 2 is lower in energy than cation 1 by 2.5 kcal/mol. The global minimum-energy conformation (MMFF force field) is 5.4 kcal/mol lower in energy and has a very different conformation. The molecule curls up on itself to bring N6 and the carboxylic acid group close together. Thus intermolecular interactions are important to determining the solid-state conformation.
Analysis of the contributions to the total crystal energy of the structure using the Forcite module of Materials Studio (Dassault Systèmes, 2021) suggests that angle distortion terms dominate the intramolecular deformation energy. The intermolecular energy is dominated by electrostatic attractions, which in this force field analysis also include hydrogen bonds. The hydrogen bonds are better analyzed using the results of the DFT calculation.
The expected N–H⋯O hydrogen bonds between the cations and anions are not present (Table I). Each cation does make an N–H⋯O hydrogen bond to the other cation. The acceptors O50 and O3 in the carboxylic acid groups are more negative than the O atoms in the mesylate anions, so are reasonable acceptors in hydrogen bonds. The charges of these O atoms differ by the most between the two cations. The N–H⋯O hydrogen bonds link the cations in zig-zag chains along the a-axis, with a graph set (Etter, Reference Etter1990; Bernstein et al., Reference Bernstein, Davis, Shimoni and Chang1995; Shields et al., Reference Shields, Raithby, Allen and Motherwell2000) of C2,2(20). The energies of the N–H⋯O hydrogen bonds were calculated using the correlation of Wheatley and Kaduk (Reference Wheatley and Kaduk2019).
Hydrogen bonds (CRYSTAL23) in danofloxacin mesylate.
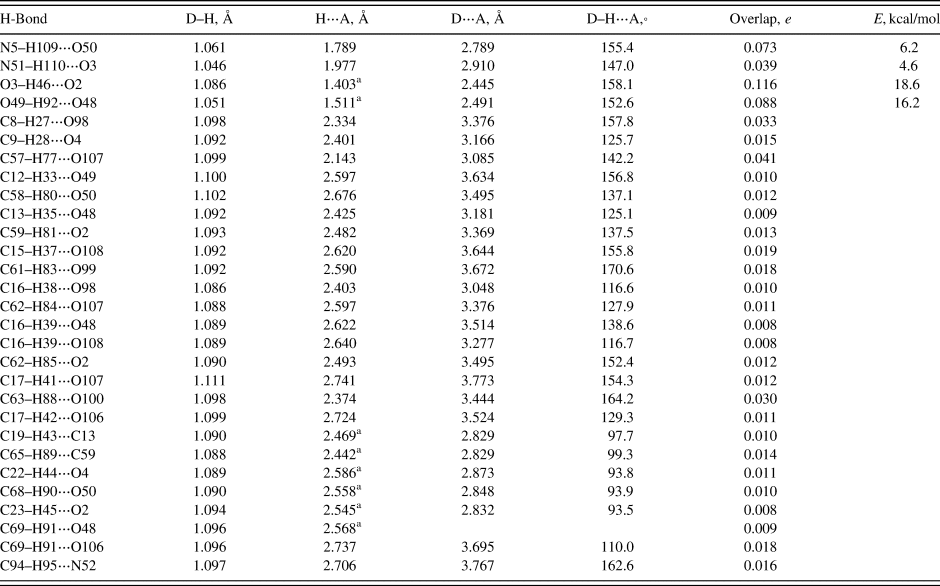
Top, molecule 1; bottom, molecule 2.
a Intramolecular.
Both cations have strong intramolecular O–H⋯O hydrogen bonds, as expected from the relative orientation of the carbonyl and carboxylic acid groups. The energies of the O–H⋯O hydrogen bonds were calculated using the correlation of Rammohan and Kaduk (Reference Rammohan and Kaduk2018). Each diazabicycloheptane cage makes a strong (judged by the Mulliken overlap population) C–H⋯O hydrogen bond to a mesylate anion. In one cation the donor is a methyne group and in the other, it is a methylene group. This is one of a number of subtle differences in the interactions of the two cations. There are a variety of other C–H⋯O hydrogen bonds, both to mesylates and O atoms of the cations. There is a C94–H95⋅⋅⋅N52 hydrogen bond from a mesylate anion to an N atom in a cation cage. Both cyclopropyl bridgehead carbon atoms C13 and C59 act as an acceptor in an intramolecular C–H⋯C hydrogen bond.
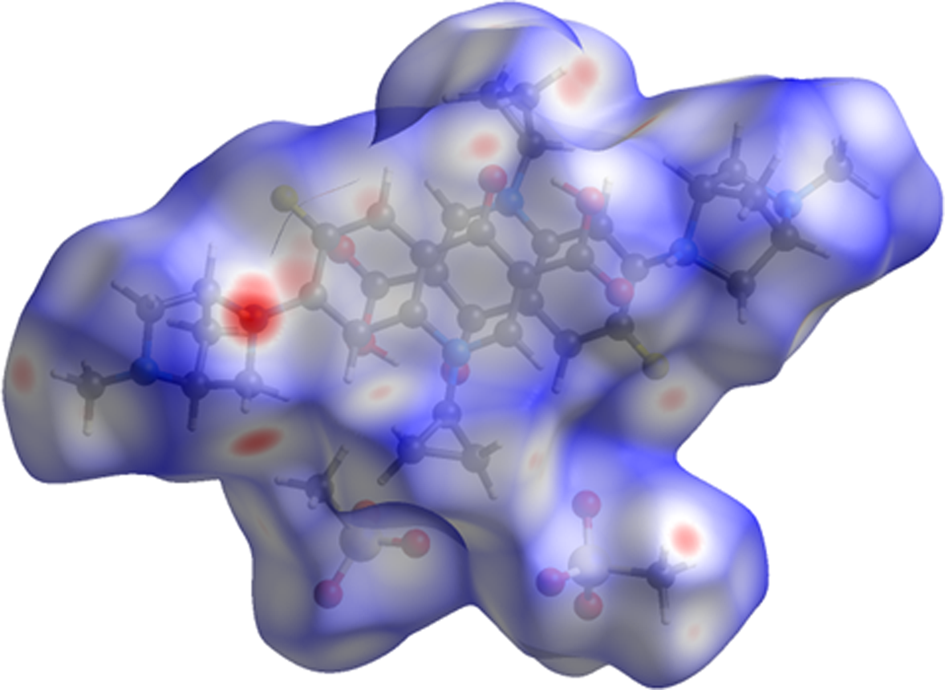
The volume enclosed by the Hirshfeld surface of the danofloxacin mesylate asymmetric unit (Figure 8, Hirshfeld, Reference Hirshfeld1977; Spackman et al., Reference Spackman, Turner, McKinnon, Wolff, Grimwood, Jayatilaka and Spackman2021) is 1034.25 Å3, 99.00% of the unit cell volume. The packing density is thus fairly typical. The only significant close contacts (red in Figure 8) involve the hydrogen bonds. The volume per non-hydrogen atom is smaller than normal, at 16.8 Å3.
The Hirshfeld surface of danofloxacin mesylate. Intermolecular contacts longer than the sums of the van der Waals radii are colored blue, and contacts shorter than the sums of the radii are colored red. Contacts equal to the sums of radii are white. Image generated using CrystalExplorer (Spackman et al., Reference Spackman, Turner, McKinnon, Wolff, Grimwood, Jayatilaka and Spackman2021).
The Bravais–Friedel–Donnay–Harker (Bravais, Reference Bravais1866; Friedel, Reference Friedel1907; Donnay and Harker, Reference Donnay and Harker1937) morphology suggests that we might expect elongated morphology for danofloxacin mesylate, with <100> as the long axis. No preferred orientation model was necessary, indicating that preferred orientation was not present in this rotated capillary specimen.
IV. DEPOSITED DATA
The powder pattern of danofloxacin mesylate from this synchrotron data set has been submitted to ICDD for inclusion in the Powder Diffraction File. The Crystallographic Information Framework (CIF) files containing the results of the Rietveld refinement (including the raw data) and the DFT geometry optimization were deposited with the ICDD. The data can be requested at pdj@icdd.com.
ACKNOWLEDGEMENTS
Use of the Advanced Photon Source at Argonne National Laboratory was supported by the U. S. Department of Energy, Office of Science, Office of Basic Energy Sciences, under Contract No. DE-AC02-06CH11357. This work was partially supported by the International Centre for Diffraction Data. We thank Lynn Ribaud and Saul Lapidus for their assistance in the data collection.
CONFLICTS OF INTEREST
The authors have no conflicts of interest to declare.


 Open access