




Introduction
At trial, many years after the incident, Sahebrao Gangawane, a ‘Mahar’ Dalit, would offer the following testimony about his encounter with an upper-caste lynch-mob in early November 2010. The mob had just razed the maize crop ripening in his fields and had proceeded to encircle him and his brothers. ‘You Mahars,’ Gangawane recalled their leader, Sunil Nagare, taunting him, ‘gotten so used to your free meals from the Government.’ ‘Do you even read the news in the papers?’ The question was rhetorical. Few Dalits in India at the time would have mistaken the chilling allusion in Nagare’s next utterance. ‘jasē khairalāṁgī (sic) prakaraṇ ghaḍalē’—‘Just like what happened in Khairlanji,’Footnote 1 Nagare had warned, ‘we will annihilate your entire family, and end your life’s journey.’ ‘You’re so proud of this blue flag, aren’t you?’, he went on, theatrically tearing up the flag that symbolized Dalit resistance. Brandishing it menacingly in Gangawane’s face, he warned, ‘You’re going to be buried in this flag.’ Afterwards, the ‘muddamal’ list submitted by the police to court would record the following items that were seized from the mob: ‘bangal (sic) pieces, sticks, chilly powder and catapults … ripen-hook, sickle, wooden logs, iron bars’.Footnote 2
The details of this incident are recorded in a corpus of around 1,400 ‘atrocity’ cases, that were brought to trial in the criminal courts of Aurangabad DistrictFootnote 3 in the western Indian state of Maharashtra during a 20-year period between 2000–2023. The cases were filed under the Scheduled Castes and Scheduled Tribes (Prevention of Atrocities) (POA) Act, a special ‘hate-crime’ statute passed in 1989 to prosecute crimes against Dalits and Adivasis in India—two important historically oppressed groups in India. Through an analysis of these cases, this article offers empirical insights into how hate crimes have fared in Indian courts.
Although frequently paired in administrative and judicial discourse, Dalits and Adivasis are historically and culturally distinct communities. ‘Dalit’ (lit. ‘broken people’) is a relatively modern self-identificatory category used to designate persons belonging to sub-castes that were formerly regarded ‘untouchable’ in India.Footnote 4 Article 17 of the Constitution of India 1950 abolished ‘untouchability’ in all its forms. However, in order to continue identifying these groups for affirmative action/‘compensatory discrimination’Footnote 5 schemes, the Indian Constitution specifically lists them in a ‘Schedule’. Consequently, these groups are referred to as ‘Scheduled Castes’ (SC) everywhere in Indian bureaucratic and legal discourse. Amended frequently over the years, the Schedule today contains the names of over a thousand different sub-castes spread across the country.Footnote 6 SC is, however, only partially a proxy-term for ‘Dalits’. Dalit Muslims and Dalit Christians—a sizeable population in India—are excluded from that category; only Dalit Hindus are counted as SC. According to the most recent census in India in 2011, SCs constituted about 17 per cent of the total population. It is estimated that the total Dalit population, including Muslims and Christians, would be close to a third of the current population.Footnote 7
‘Adivasis’ (lit. ‘First/Original Inhabitant’) refers to members of the many tribal groups/indigenous peoples in IndiaFootnote 8 who, along with the Dalits, were historically regarded as falling outside the mainstream Hindu religious fold.Footnote 9 As with the Scheduled Castes, for the purpose of affirmative action schemes, they are specifically listed in a Schedule under the Constitution. Today the list contains over 700 different named tribal communities (STs). Unlike SCs, their homelands in many states are constitutionally demarcated as ‘Scheduled Areas’, where they exercise a limited degree of autonomy over their internal affairs.Footnote 10 According to the 2011 Census, STs comprised 8.6 per cent of the Indian population.
In this article, I use both the bureaucratic categories SC/ST as well as ‘Dalit’ and ‘Adivasi’ interchangeably to refer to the victims of violence.
A quick note on my use of the term ‘hate crime’ in this article. The phrase ‘hate crime’ is a distinctly American statistical and scholarly category, used to designate crimes which target victims based on specific aspects of their identity. The Federal Bureau of Investigation (FBI) defines the term on its website as a ‘criminal offense which is motivated, in whole or in part, by the offender’s bias(es) against a race, religion, disability, sexual orientation, ethnicity, gender, or gender identity’.Footnote 11 Although India does not currently employ this termFootnote 12 it has, for over 50 years, had laws that punish a specific type of hate crime. In 1955, Parliament passed the Untouchability (Offences) Act (renamed The Protection of Civil Rights Act [PCR] in 1976) which included special punishments for violence directed against Dalits. Later, in 1989, Parliament passed the SC/ST Atrocities Act to group together and specially punish an even more expansive range of violent acts targeting both SC and ST persons. The two terms ‘hate crime’ and ‘atrocities’ share a curious history—they appear to have both started out as statistical categories which then grew to become special types of criminal offences.Footnote 13 Although the two terms are connected thematically, scholarship on these topics has proceeded on parallel tracks. ‘Hate crime’ has expanded within scholarship to become not just an American but a Western category—it is employed in discussions about similar types of identitarian crimes in Europe and the United Kingdom, even where no specific ‘hate-crime’ legislation exists in those jurisdictions.Footnote 14 ‘Atrocities’ meanwhile has languished as a parochial Indianism. In my description of SC/ST ‘atrocities’ as ‘hate crimes’, this article is a deliberate attempt to draw this topic centrally into a global conversation about hate crimes. It is founded on the wager that for any robust discussion on the subject of ‘hate crimes’, Indian atrocities are theoretically and empirically relevant.
While there is much in the account that follows that is specific to atrocity cases, several conclusions I reach are more pertinent to Indian criminal adjudication in general. As I demonstrate, there are patterns to how criminal courts evaluate evidence, disregard testimony, grant or deny bail, convict, and acquit. This is an ‘apparatus of disbelief’ which operates through a discontinuous set of features—hostile witnesses, documentary omissions, prosecutorial ineptitude, etc.—to produce acquittals. These are largely unstudied domains in Indian/post-colonial adjudication into which this article makes tentative strides.
In addition to the topic—hate-crime adjudication—this article also breaks new ground methodologically. I use computational methods to draw sociological and legal insights from the text of 400 judgments and 1,000 interlocutory orders. Making copious use of tables, graphs, maps, and plots, this article has had to experiment with modes of presentation such as ‘upset plots’ (see ‘Bail’ below) in order to convey its information with complexity and economy. There is no existing scholarly work in any branch of Indian law that ‘reads’ cases in this manner, or at this scale. In fact, it is difficult to find examples of work in any jurisdiction that employs similar methods. As much for the novelty of its method, this article is offered as an exemplar, for future researchers, of the variety of insights that can be derived using this method, which we may call ‘computational, quantitative close-reading’.
The article proceeds in three parts. The first part fleshes out the scholarly, administrative, and statutory contexts of this work. Scholarship about the criminal adjudicatory process in India has, so far, been mainly confined to either doctrinal or anthropological accounts. Recently, though, a growing body of empirical work, commissioned mostly by non-profits, has begun to give us a more granular, processual account of how crime is investigated and litigated. Some of this work has leveraged data about court cases available on India’s nationwide ‘e-courts’ website. Since this article is based on that data, I describe the website in some detail. Importantly, I was able to obtain both ‘metadata’ about cases and the texts of decisions which I present, respectively, in the second and third parts below.
Having described the statistical infrastructure that has enabled this article, the first part then proceeds to a schematic account of the criminal adjudicatory process followed in India, and the applicable statutory framework. Lastly in this part, I describe the background and key provisions of the POA Act—the primary focus of this article.
In the second part, I present insights from the metadata obtained from the e-courts platform which I juxtapose against data available from the State Government’s annual crime reports. I use these statistics to construct a picture of the institutional, geographical, thematic, and temporal distribution of atrocities in Aurangabad district. This part provides answers to questions about which courts try POA cases, how long they last, where in the district incidents have occurred, what kinds of allegations they involve, and the number of cases that arise each year.
In the third part, I move beyond the metadata to present insights drawn from the texts of the decisions themselves. I begin by investigating how frequently themes such as ‘land disputes’ or ‘sexual violence’ occur and overlap in this archive. I then use the texts as a sociological resource to extract information about the sub-caste-wise breakup of the accused and the victims, and the age and occupational distribution of the accused. The part then proceeds to sequentially draw insights from the texts of bail applications and final judgments respectively—the two largest categories of texts in this archive. With both categories, I examine the outcomes—whether bail was ‘granted’ or ‘denied’, or whether ‘conviction’ or ‘acquittal’ resulted—and attempt to profile the overlapping reasons offered by courts in arriving at these outcomes. With bail applications, I additionally present the amounts that courts levy and the conditions they attach to the granting of bail. With judgments, I provide a distribution of the sentences passed and the fines levied upon conviction. In addition, for both types of cases, I examine the patterns of outcomes by individual judges, defence counsel, and prosecutors of this court. In general, the courts of Aurangabad grant more bail applications than they deny and acquit accused far more than they convict. The bail amounts they impose are usually reasonable—most frequently, accused are required to tender personal bonds of around Rs 15,000 (less than US$200)—and the conditions they impose tend to be standard. In addition to convicting vastly fewer cases, the manner of conviction tends to vastly diminish the crimes that are being prosecuted. Even when convicted, accused are rarely found guilty of offences listed under the POA Act and are instead convicted of miscellaneous minor crimes under the IPC which carry lower sentences. This article attempts to explain these patterns by theorizing Indian criminal courts, in general, as possessing a durable ‘apparatus of disbelief’ that works through both textual techniques of dismissing evidence, and non-textual elements such as ‘hostile witnesses’. Taken together, these elements are generally, although not always, ‘acquittal producing’.
Finally, the concluding section of this article restates some of the key conclusions arrived at in different parts of this article and ends with some reflections on the mode of inquiry I have pursued. I draw on Wittgenstein to suggest that this article has sought to use texts to uncover the ‘language-game’ specific to the Aurangabad courts and criminal adjudication in India.
In order to add texture to the largely statistical content of this article, at various points I insert fragments drawn from cases in the archive, such as Gangawane’s fate with which we opened this article. These accounts are useful to introduce elements of the criminal adjudicatory process in action. They also have the added virtue of memorializing, in a small way, some of the vast unredressed violence that Dalits and Adivasis of this district have faced over the past two decades. For now, we turn to a brief segment locating this article within literature on criminal adjudication in India.
Scholarly, administrative, and statutory contexts
Scholarly research into criminal adjudication in India
Criminal adjudication is not a popular field of scholarly inquiry in India. The most penetrating accounts of criminal adjudication in India come from the extra-scholarly domain of ‘fact-finding’ reports by civil society organizations working on issues of caste, tribe, and gender. Although most reports in this genre endeavour to record the oral history of specific events/atrocities in their immediate aftermath, some tend to be diagnostic about the criminal justice system as a whole. Illustratively, in 2022, a coalition of three organizations—the Dalit Human Rights Defenders Network (DHRDNet), the Human Rights Law Network (HRLN), and the National Council of Women Leaders (NCWL)—issued a 150-page report on the nationwide implementation of the POA Act. Using information painstakingly acquired through information requests under the Right to Information Act (India’s Freedom of Information law), the report does more than tell us about the implementation of the POA Act—it offers us a rich phenomenological account of criminal adjudication in India today. Through this report, and many like it, we are able to understand criminal adjudication as a bureaucratic process in which statutory proclamations and promises are systematically undone by the staffing priorities, prejudices, and whims of the government at every level. Reports of this kind remind those who need reminding that convictions are at least equally about the complex logistics of getting a victim and witnesses to court as they are about the stilted language of a penal statute or evidentiary law.
Leaving aside robust, but rare, civil-society reports of this kind, the domain of peer-reviewed scholarship about criminal law in India can be drawn down roughly to four categories: 1) Most commonly, one encounters close, critical readings of appellate court decisions by legal scholars. The focus in this type of work is on reporting on the normative innovations or departures that the appellate judiciary makes; 2) Less frequently, one might encounter economic analyses of criminal statistics published by the Indian state. Due to the form in which those statistics are published (on which, more below), the analysis in these articles is seldom able to do more than draw insights from the high pendency-rate of cases;Footnote 15 3) A rich volume of feminist scholarship has focused on specific criminal cases to theorize the intersectional nature of violence that Dalits and Adivasis experience;Footnote 16 4) Finally, relatively more recently, one encounters rich anthropological accounts which follow the itineraries of specific cases at trial to offer idiographic snapshots of the domain of criminal adjudication. The analytic in this last branch of scholarship tends to focus on the subjective states of different actors—victims, police, judges, undertrials, bystanders, etc.—and contributes valuable insights to key topics within anthropological inquiry, such as ‘rule following’ behaviour and its slippages, the necessary conjunction of legal procedure and violence, or the infelicity of modern law’s categories and concepts to express, let alone address, structural injustices.Footnote 17
Notwithstanding the important work by this determined clutch of legal anthropologists, there remains room for more empirically grounded accounts of what goes on in criminal trials in India. An important factor constraining the production of such accounts is, obviously, the quality of data put out by the state.
Crime statistics in India
The Indian state publishes a copious quantity of statistics about crime in India annually, both at the state and national levels. From annual crime reports compiled at the state level, it is possible to gather an impressive amount of detail. From these reports, it is usually possible to know, for every district in the country, the aggregate number of cases registered, investigated, and forwarded for prosecution by the police under every criminal statute, the total number of cases tried by the courts, the numbers ‘disposed’, and the cases still ‘pending’. We know how many cases resulted in an acquittal and those that yielded a conviction. As a result of long activism and advocacy by Dalit, Adivasi, and women’s rights groups in India, the reports now have specific chapters devoted to statistics about crimes targeting members of these communities. We know what proportion of crimes against Dalits are ‘violent crimes’—involving charges of murder, kidnapping, rape, etc.—and how many of these involve women as victims. Continuing a pattern of data collection set during colonial times, these reports separately present statistics for offences under the Indian Penal Code 1860 (IPC)Footnote 18 and those under a host of ‘special’ criminal legislations such as the POA Act. Analogous reports and figures are available from most states, and aggregate statistics are obtainable at the countrywide level from reports issued annually by the National Crime Records Bureau (NCRB) and the Ministry of Social Justice and Empowerment. Illustratively, we learn that in 2021, in Aurangabad District, the primary site of our inquiries in this article, there were 82 incidents of violence against ‘Scheduled Castes’ and 20 where the victims belonged to ‘Scheduled Tribes’. Of these, roughly 60 involved offences against women.Footnote 19 Elsewhere in the report from that year, we learn that a total of six persons were arrested for crime under the POA Act in the entire district—a number which seems at stark odds with the number of reported cases.Footnote 20 Although the report does not tell us more about what happened to these cases at the district level, aggregate figures for the disposal of these cases in the entire state are given. A total of 5,016 cases under the POA Act (both newly commenced in 2021 and carried over from previous years) were tried by courts across Maharashtra state in 2021. Of these, trials appear to have been ‘completed’ in only 90 cases, resulting in 78 acquittals, four cases discharged, only two convictions, with the remaining cases ‘abated’.Footnote 21 A sombre record by any standards. Figure 1 summarizes the state-wide record of convictions and acquittals in trials that were completed under the POA Act between 2015–2022, along with a display of the number of pending cases at the start of each year. Although similar statistics are not available at the district-level, the figure does indicate patterns of low conviction rates from which, as we shall see in this article, Aurangabad does not differ.
State-wide pendency and disposal of cases under the POA Act (2015–2022).

Figure 1 Long description
Title text: “State-wide pendency and disposal of cases under the POA Act (2015–2022).” Legend text: “Convictions (SC Victim)”, “Convictions (ST Victim)”, “Total Trials Completed”, “Cases Discharged”, “Acquittal/Discharge (SC Victim)”, “Acquittal/Discharge (ST Victim)”, “Cases Pending”. Horizontal axis: years 2015, 2016, 2017, 2018, 2019, 2020, 2021, 2022. Left vertical axis label: “Cases Completed”. Range 0 to 3000. Right vertical axis label: “Cases Pending”. Range 0 to 18000. Line graph series (Cases Pending) with labeled values by year: 2015: 8559. 2016: 9287. 2017: 10004. 2018: 10477. 2019: 11304. 2020: 12206. 2021: 14537. 2022: 16919. Stacked bar totals (Total Trials Completed) with labeled values by year: 2015: 995. 2016: 1230. 2017: 1344. 2018: 1190. 2019: 1338. 2020: 432. 2021: 537. 2022: 1228. Stacked bar segment labels visible within the bars by year (values shown inside segments): 2015: 26, 0, 105, 865. 2016: 28, 0, 228, 865. 2017: 22, 0, 222, 927. 2018: 23, 0, 181, 862. 2019: 30, 0, 244, 992. 2020: 10, 0, 95, 256. 2021: 14, 0, 134, 384. 2022: 47, 0, 227, 827. Additional small numeric labels shown near the base of the bars by year: 2015: 0, 0, 106. 2016: 1, 0, 127. 2017: 0, 0, 193. 2018: 0, 0, 126. 2019: 0, 0, 120. 2020: 0, 0, 71. 2021: 0, 0, 125. 2022: 0, 0, 140. Overall patterns visible from the labeled values: Cases Pending increases every year from 8559 in 2015 to 16919 in 2022, with larger year-to-year increases after 2020 (12206 in 2020, 14537 in 2021, 16919 in 2022). Total Trials Completed is highest at 1344 in 2017 and lowest at 432 in 2020, then rises to 537 in 2021 and 1228 in 2022.
Figure 2 charts the conviction rates of major crimes in Maharashtra from 2019–2022 (excluding the pandemic year of 2020) drawn from the state’s crime reports.Footnote 22
Percentage conviction rates of major crimes in Maharashtra state, 2019–2022.
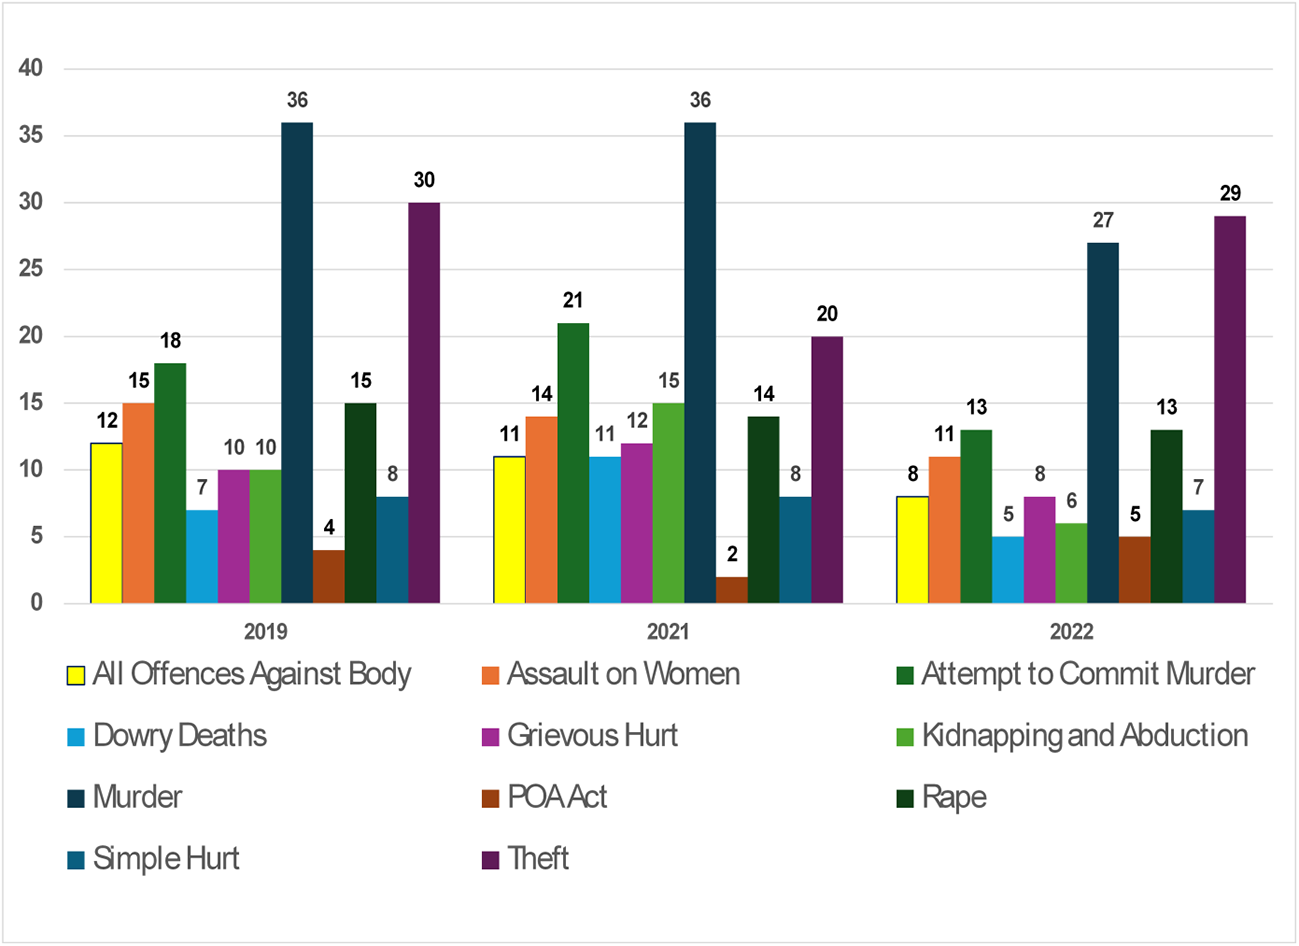
Figure 2 Long description
The bar graph displays conviction rates for major crimes in Maharashtra from 2019 to 2022. The vertical axis represents percentage rates ranging from 0 to 40, while the horizontal axis lists the years 2019, 2021 and 2022. Categories include all offences against body, dowry deaths, murder, simple hurt, assault on women, grievous hurt, P O A Act, theft, attempt to commit murder, kidnapping and abduction and rape. In 2019, murder had the highest conviction rate at 36 percent, followed by assault on women at 28 percent. In 2021, murder again had the highest rate at 36 percent, with assault on women at 21 percent. In 2022, murder was highest at 27 percent, with assault on women at 22 percent. The legend indicates different colors for each crime category. The graph highlights trends in conviction rates over the years, showing fluctuations in various crime categories.
Conviction rates for many types of violent crimes have not exceeded 15 per cent in the state. For instance, in 2021, only 12 per cent of all cases of ‘Grievous Hurt’ prosecuted in the state of Maharashtra resulted in convictions. Even set against this grim portrait of low convictions, POA outcomes are conspicuously poor.
As the data presented so far indicates, there is not quite a statistical drought in India. If we trust them to be accurate, these statistics provide valuable fodder for those interested in empirical analyses of criminal adjudication in India. Despite their enormous utility, however, large aspects of criminal adjudication in India remain opaque. The statistics that are available do little more than assign precise numbers to our anecdotal knowledge that conviction rates are poor in criminal cases and the number of cases pending is high. They are only capable of feeding a specific kind of discourse—about judicial delays and the shortage of judicial staff.
To serious students of judicial process these statistics are not capable of yielding granular answers to questions about criminal trials such as: How long do cases typically take to be adjudicated? How many hearings do parties generally have to attend? What kind of charges are typically brought? Who are the attorneys involved? How easy is it to get bail and what conditions do courts typically impose while granting it? What kinds of cases result in convictions and acquittals? What is the distribution of sentences awarded at trial? What evidence is offered at trial and in what manner do courts generally arrive at their decisions?
Although anthropology and fact-finding reports by civil society organizations provide some valuable context to these questions, a sustained understanding of the adjudicatory process in India at the trial level remains elusive. This is not a fault in the scholarship—the archive capable of yielding such insights, corpora of trial court decisions, has only begun to be publicly available in the past decade.
The e-courts platform
The National Informatics Center (NIC), the centralized government organization tasked with providing information and communications technology (ICT) services to central and state governments, has succeeded in rolling out, quite possibly the most advanced, nationalized, open-source, publicly accessible system of judicial reportage available in any country. Although its ‘ecourts’ website has its shortcomings, to the technologically equipped, empirically minded researcher, the NIC’s district court website has, over the past decade, made available some valuable infrastructure.Footnote 23 At the time of writing, for each district across India, the site allows users to access metadata about both ‘disposed’ and ‘pending’ cases that have been instituted in each court within that district. For criminal cases, this metadata includes the names of the parties, the names of their attorneys, the specific statutes and sections under which they have been charged, the current status of the case, and brief descriptions of the business transacted at every hearing conducted in the case. In some cases, the full texts of decisions—whether interlocutory or final—issued by the court can also be accessed as PDF files. While there are variations in the accuracy and degree to which these sites are updated by courts, by serially downloading and aggregating this information, it is possible to construct a rich picture of the functioning of any particular branch of law or local court system in India.Footnote 24 In May 2023, I was able to retrieve information about all cases filed under the POA Act that were either pending or had been disposed in 11 criminal courts across the district of Aurangabad.Footnote 25 By analysing this information I was able to arrive at the insights arrayed in this article.Footnote 26
I think I can validly claim this article to be the first systematic empirical study of criminal adjudication in India, even if it is restricted to a single district and a particular type of criminal case—atrocity cases. It is systematic, first in the way it examines criminal adjudication not just in terms of how legal rhetoric is deployed by appellate courts, but as a function of a range of questions about how statutes are used, how long cases take to be disposed, the sociological profile of the parties, the judges and lawyers involved, who gets bail and on what terms, what evidence is offered at trial, what reasons courts cite when acquitting and convicting, etc., and second, in the way it studies not just particular cases, but situates them within the universe of similar cases over a 20-year period. It is attentive to durable patterns of judicial reasoning and prejudice, to recurring motifs within disputes, to the way evidence is evaluated by judges.
The strength of legal anthropology is its ability to ‘close read’ disputes, to sketch the psychological states and tactical manoeuvres of different subjects in specific, exemplary disputes familiar to the investigator, and to infer from them possible profiles of moral conduct. Blind to such particulars, the utility of the empirical account I offer here is its ability to identify ‘genres’ of violence across hundreds of complaints, and to discover textual habits and epistemological patterns across the archive that determine individual cases.
The contents of this article are heavily statistical, but for all that, I need to also make clear that this not merely an empirical account—which would conceivably stop at the presentation of overall numbers such as those of acquittals and convictions. Going beyond such concerns, this article is a methodological experiment in what the literary theorist Franco Moretti calls ‘distant reading’.Footnote 27 In contrast to the standard ‘close reading’ mode of textual analysis, which he describes as ‘a theological exercise—very solemn treatment of very few texts taken very seriously’, distant reading involves remaining distant from texts, allowing one ‘to focus on units that are much smaller or much larger than the text: devices, themes, tropes—or genres and systems’.Footnote 28 What this method consists of, for Moretti himself, is a kind of secondary analysis or synthetic review of scholarly literary criticism within a target genre (e.g. detective novels). Select primary texts are still read ‘not as the beginning of the critical enterprise’, but in order ‘to test for evidence of your unit of analysis’.Footnote 29 The price that this method pays, according to Moretti, is to lose the ‘infinite riches’ of reality to the ‘poverty’ of theory. Despite these losses, however, its utility consists in its ability to apprehend ‘interconnections … shapes … relations … structures’,Footnote 30 in his case, the broad evolutionary pathways of systems of literature.
This article draws on some of these impulses but with important differences. Like Moretti, I focus on devices, themes, tropes within the corpus of POA decisions. However, unlike Moretti, I locate these elements not in secondary literature, but in the texts themselves. I do this by using computational methods to engage in a simultaneous reading of 1,500+ texts. The effect is not quite ‘close reading’ as it is commonly understood, and yet involves too high a degree of immediacy and intimacy with the texts to be described as ‘distant’. Unlike Moretti, the character of this reading is to not sacrifice details altogether, but to retrieve them selectively as sources of themes and tropes. This will become clearer, especially in the third part of this article. Like Moretti, I did end up ‘manually’ reading tens of individual decisions, ‘non-theologically’, to test the veracity of my extractions. In particular, I read them when they failed to yield up data in response to my extraction patterns. In doing so, I am attempting a new mode of reflection on Indian adjudication: one that is insistent in taking every case into its analytical sweep, and that treats its mass of factual details not as distractions from a discussion of law’s doctrine, but as essential to a beginner’s understanding of law.
Before getting to the data, let me provide a brief sketch of the process of criminal adjudication followed in India generally and the POA Act. Readers familiar with this history may wish to skip ahead to the ‘Metadata’ section of this article.
Criminal laws and adjudication in India
India follows a unified, pyramidical judicial system with trial courts at the district/city level, appellate High Courts at the state level, and the Supreme Court at the top of the hierarchy. Until 2024, the criminal adjudicatory landscape in India was governed mainly by three statutes. The Indian Penal Code 1860 (IPC) specified the substantive criminal law applicable to all Indians. It contained definitions of all major offences and stipulated their punishments. The Code of Criminal Procedure 1973 (CrPC) specified the jurisdiction of criminal courts, the powers of arrest and seizure, criminal investigation by the police, bail, the trial process, punishment, and appeals. The Indian Evidence Act of 1872 specified the evidentiary rules that would apply to both civil and criminal cases. In July 2024, in the midst of the research for this article, all three were replaced by statutes with Sanskrit namesFootnote 31 that mostly re-shuffled the order of sections contained in these colonial-era statutes without disturbing their wording. In this article, for simplicity, I do not refer to the names of the new statutes at all.
There are generally two common ways by which the criminal investigative process is set in motion across India. In most cases, a complaint called a First Information Report (FIR) is lodged with the police by an ‘informant’. If the FIR discloses details of a ‘cognizable offence’ (broadly any offence punishable with imprisonment for a duration of more than three years) the police must proceed to investigate it. If the police do not register an FIR, the informant has the option of initiating a ‘private complaint’ directly with a magistrate under Section 190(1) of CrPC asking them to direct the police to investigate the incident complained of.
During the investigatory process the police may collect evidence, search and seize items, and arrest any person suspected of committing the crime. If, upon completion of investigation, the police determine that there is sufficient evidence to proceed, they may file a ‘charge-sheet’ before the magistrate, who then ‘commits’ the case to trial in a Sessions Court. The Sessions Court frames charges against the accused based on the charge-sheet filed by the police, and the proceeds to try the case—a process that typically ends in either a conviction or an acquittal. Less frequently, the accused may be ‘discharged’ of the offence or the case may abate due to their death.
This schematic account of Indian criminal adjudication is sufficient to follow the details of this article. As this article progresses, additional details of Indian criminal procedure are provided, as necessitated by the topics discussed.
While the IPC is the general-purpose substantive criminal law followed in India, a host of ‘special laws’ define additional crimes at both the federal and state level, and stipulate their punishments. The POA Act belongs to this latter category, and the next section takes a close look at its aims and contents.
Overview of the POA Act
The law is not automatically implemented when it is enacted. It will be a big achievement if you could ensure that 1/10th of the law has been implemented.
Dr. G. S. Rajhans (Jhanjharpur)Footnote 32 Parliamentary Debates, 16 August 1989.
Praised at the time of its enactment as the most ‘daring legislation in any field since Independence’,Footnote 33 the POA Act defines and punishes a specialized list of roughly 20 ‘atrocities’ against Dalits and Adivasis in India.Footnote 34 The Act in its original version created specialized courts to try these offences and included measures to provide statutory compensation to victims out of public funds. Since its passage, between 2016–2019, the Act was amended a few times. The Act was substantially amended in 2016, when the clause defining atrocities was re-worded and expanded, so that it now lists over 30 discrete acts of ‘atrocity’ against Dalits and Adivasis. Although a full listing of these atrocities would occupy too much space, I reproduce a few key clauses in Table 1. The bare wording of these clauses conveys a grim impression of the severity and variety of violence that Dalits and Adivasis continue to face every day.
Sample of ‘atrocities’ under Section 3 of the POA Act

Table 1 Long description
The table lists selected acts treated as offences when committed by a person who is not a member of a Scheduled Caste or Scheduled Tribe against a member of those communities. Examples include forcing someone to eat or drink inedible or obnoxious substances and dumping excreta, sewage, carcasses, or other obnoxious material at or in premises they occupy. It also includes public humiliation such as garlanding with footwear or parading a person naked or semi-naked. Several entries focus on conduct in public view, including intentional insult or intimidation meant to humiliate and abusing someone by caste name. Sexual offences against women from these communities are included, covering non-consensual sexual touching and sexual words, acts, or gestures, with consent described as an unequivocal voluntary agreement communicated by words or gestures. Additional offences include causing physical harm or mental agony based on allegations of witchcraft and imposing or threatening social or economic boycotts. The table is a qualitative list of offence categories and does not provide counts, rates, or comparisons across time or locations.
In addition to increasing the number of atrocities punishable, the 2016 amended Act provided for the setting up of ‘exclusive courts’ to try these cases, and included a section providing for ‘Rights of victims and witnesses’, obligating both the trial court and the state to ensure the safety of victims and witnesses, to provide for their financial maintenance during trial, and protect their anonymity, if they desired. In a bid to speed up trials, the present version of the statute now requires courts to conduct ‘day-to-day hearings’ and ‘as far as possible’ complete trials within a period of two months from the date of filing of the charge-sheet.
In 2018, the Act was required to be amended to undo the effects of a controversial Supreme Court decision which had virtually rendered arrests for offences under the Act impossible. In Subhash Kashinath Mahajan v. State of Maharashtra,Footnote 35 the Supreme Court had required a special ‘preliminary inquiry’ by a deputy superintendent of police and a ‘prior approval’ from a superintendent of police to be sought before anyone could be arrested under the POA Act. In case ‘public servants’ were sought to be arrested, the process was even more difficult, with approvals being required from the agencies employing them. In response to the public outrage about the decision, Parliament swiftly amended the POA Act in 2018 to nullify the ruling.
There are many other features of the Act, and judicial controversies surrounding its interpretation that would be important for a complete understanding of the statute. The information offered in this section is, however, narrowly tailored to allow us to properly understand the data presented in the second and third parts of this article.
Statistical sketch of Aurangabad
Aurangabad is a district located in the western state of Maharashtra in India (see Figure 3). On most parameters, within the state, it ranks as an ‘average’ district. With an area of 10,107 square kms and a population of 3.7 million persons (51 per cent male), according to the last census in 2011, it is ‘mid sized’.Footnote 36 Roughly 14.5 per cent of its population are SC and about 3.9 per cent are ST. About 57 per cent of the population is ‘rural’ and the rest ‘urban’, with roughly 30 per cent of the population (1.1 million) living in and around the district headquarters of Aurangabad city.Footnote 37
Map of India highlighting Aurangabad. Source: Database of Global Administrative Areas (GADM).

Figure 3 Long description
The map of India highlights Aurangabad district in Maharashtra with a distinct color. The map outlines the state boundaries and shows Aurangabad located in the western part of the country. A scale bar at the bottom indicates a distance of 400 km. The map provides a clear view of the district's position relative to other states and regions in India.
It is also an ‘average’ district in terms of crime. The state publishes rankings of districts based on crime. Out of 46 ‘police districts’ in the state, two are located in Aurangabad District—Aurangabad Rural and Aurangabad Commissionerate. In 2022, they were ranked about 27th and 29th in terms of general ‘IPC’ crimes.Footnote 38 In 2021, Aurangabad Rural was ranked as high as 15th in terms of violence against SCs. In 2017, the two districts were ranked fourth and fifth, respectively, in terms of violence against STs. These, however, were the highest rankings these districts ever received between 2016–2022. During this period, both districts usually ranked above 20th in terms of violence against both SCs and STs.Footnote 39 Statistically, then, this is not a district that invites study because it has a particularly egregious record of atrocity crimes. Why, in that case, study Aurangabad? Unfortunately, the reason is somewhat self-serving. This was a district where I was able to download a large set of judgments in English as well as metadata to make a robust study out of.Footnote 40 The next part of this article introduces this data.
Metadata—time, crime, and punishments
I began this research in May 2023, by accessing the Aurangabad District Court website and searching each criminal court in that district sequentially for all cases that were either ‘Pending’ or ‘Disposed’ under the POA Act. This query yielded case details of some 2,590 ‘cases’, which I was able to download, along with roughly 1,600 PDF files. These files turned out to be about 1,000 brief interlocutory orders on motions (‘applications’ in Indian legal parlance) and around 500 final decisions either acquitting or convicting the accused—judgments. The landing page of all cases includes several heads of ‘metadata’ about them, including the type of case, the date it was instituted, the Act and section invoked, the names of the parties and their lawyers, the status of the case (whether ‘pending’ or ‘disposed’), the number of hearings in the case, and, occasionally, the full text of any order/judgment by the court. In this part, I focus on insights that can be drawn from the metadata before turning to the texts of the decisions.
Institutional distribution of cases
Table 2 presents information about the cases that make up this archive, the courts in which they were registered, the number of cases that were either pending or disposed in May 2023, the duration (in number of days) that they had been pending or had taken to be ‘disposed’, and the average number of hearings that had been held in each category of cases. As an additional detail, I have also included the number of PDF documents I was able to download, which forms the basis of my analysis in ‘Archival ethnography’ below.
Snapshot view of POA cases in Aurangabad
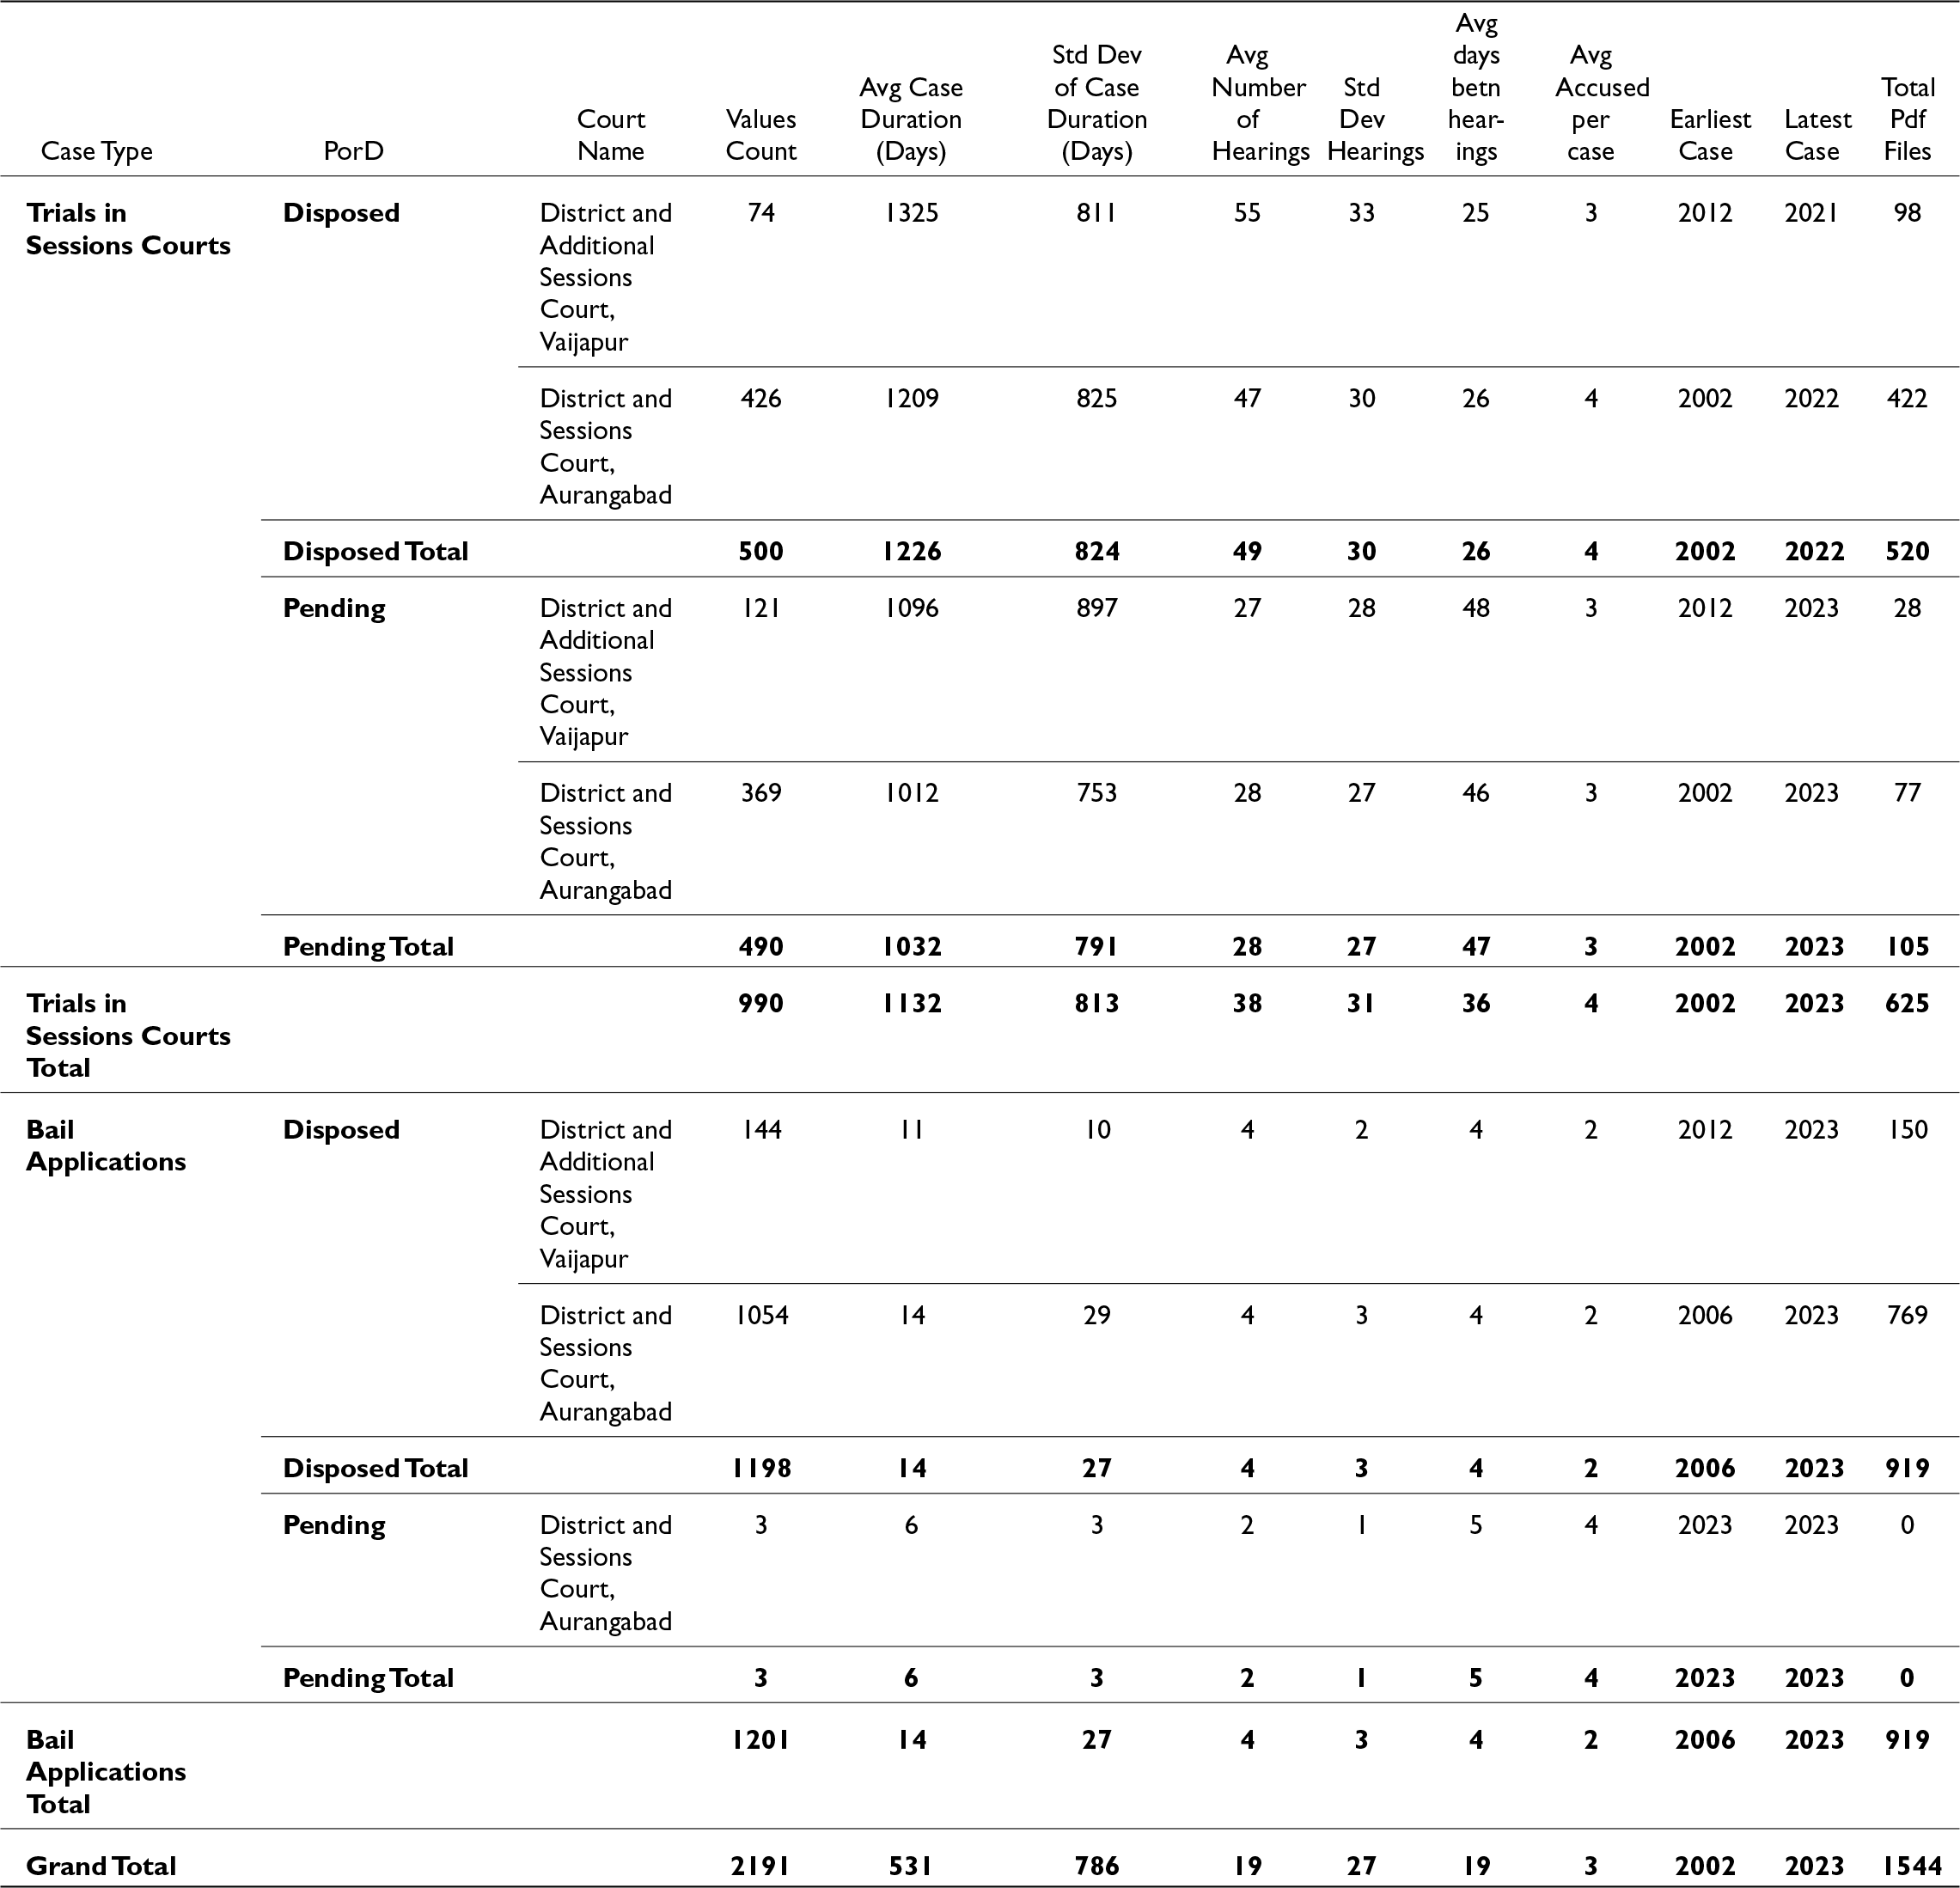
Table 2 Long description
The table summarizes POA case counts and timing metrics by case type (sessions trials and bail applications), status (disposed or pending), and court in Aurangabad district, including average duration, hearing patterns, accused per case, and PDF file totals. Overall there are 2,191 cases and 1,544 PDF files, spanning earliest cases in 2002 through latest cases in 2023. Sessions trials total 990 cases with an average duration of about 1,132 days, about 38 hearings on average, and roughly 36 days between hearings; disposed trials average about 1,226 days while pending trials average about 1,032 days. Within sessions trials, District and Sessions Court, Aurangabad has most volume (426 disposed and 369 pending) compared with Vaijapur (74 disposed and 121 pending). Bail applications total 1,201 cases with much shorter average duration (about 14 days) and about 4 hearings on average; nearly all are disposed (1,198), with only 3 pending in Aurangabad in 2023. Aurangabad court also dominates bail volume (1,054 disposed) compared with Vaijapur (144 disposed). Variability is high for sessions trial durations (standard deviations around 800 days), so averages may mask wide differences between individual cases.
As Table 2 indicates, the criminal cases under the POA in Aurangabad District are divided into two large groups—sessions trials and bail applications—about which some brief explanatory remarks will suffice.
Close to 1,000 cases in the archive were cases in which police had completed their investigation and the accused had been brought to trial before the Sessions Courts, the primary trial courts in India for most major criminal offences.Footnote 41 As the figures in Table 2 indicate, in the Aurangabad Sessions Court, the typical ‘Disposed’ trial under the POA Act took between three to four years to be decided and involved an average of around 50 hearing dates, scheduled about a month apart. This statistic needs to be read alongside the figures of ‘Pending’ cases—the average case that is pending before the Aurangabad Sessions Court is at least three years old, with the oldest case dating back to 2002. As mentioned previously, in 2016, the POA Act was substantially amended to require cases to be heard day-to-day and for trials to be concluded, ‘as far as possible’, within two months. To what extent has this legislative mandate been carried out? The figures in Table 3 present data about trials initiated after these amendments which indicate that they have not been successful: cases still take an average of one to two years to be adjudicated, and hearings in cases appear to be scheduled an average of a month to two months apart. The average ‘Pending’ case before the ‘Special POA Court’ has been pending for close to two years.
Trials of cases instituted after the 2016 amendments
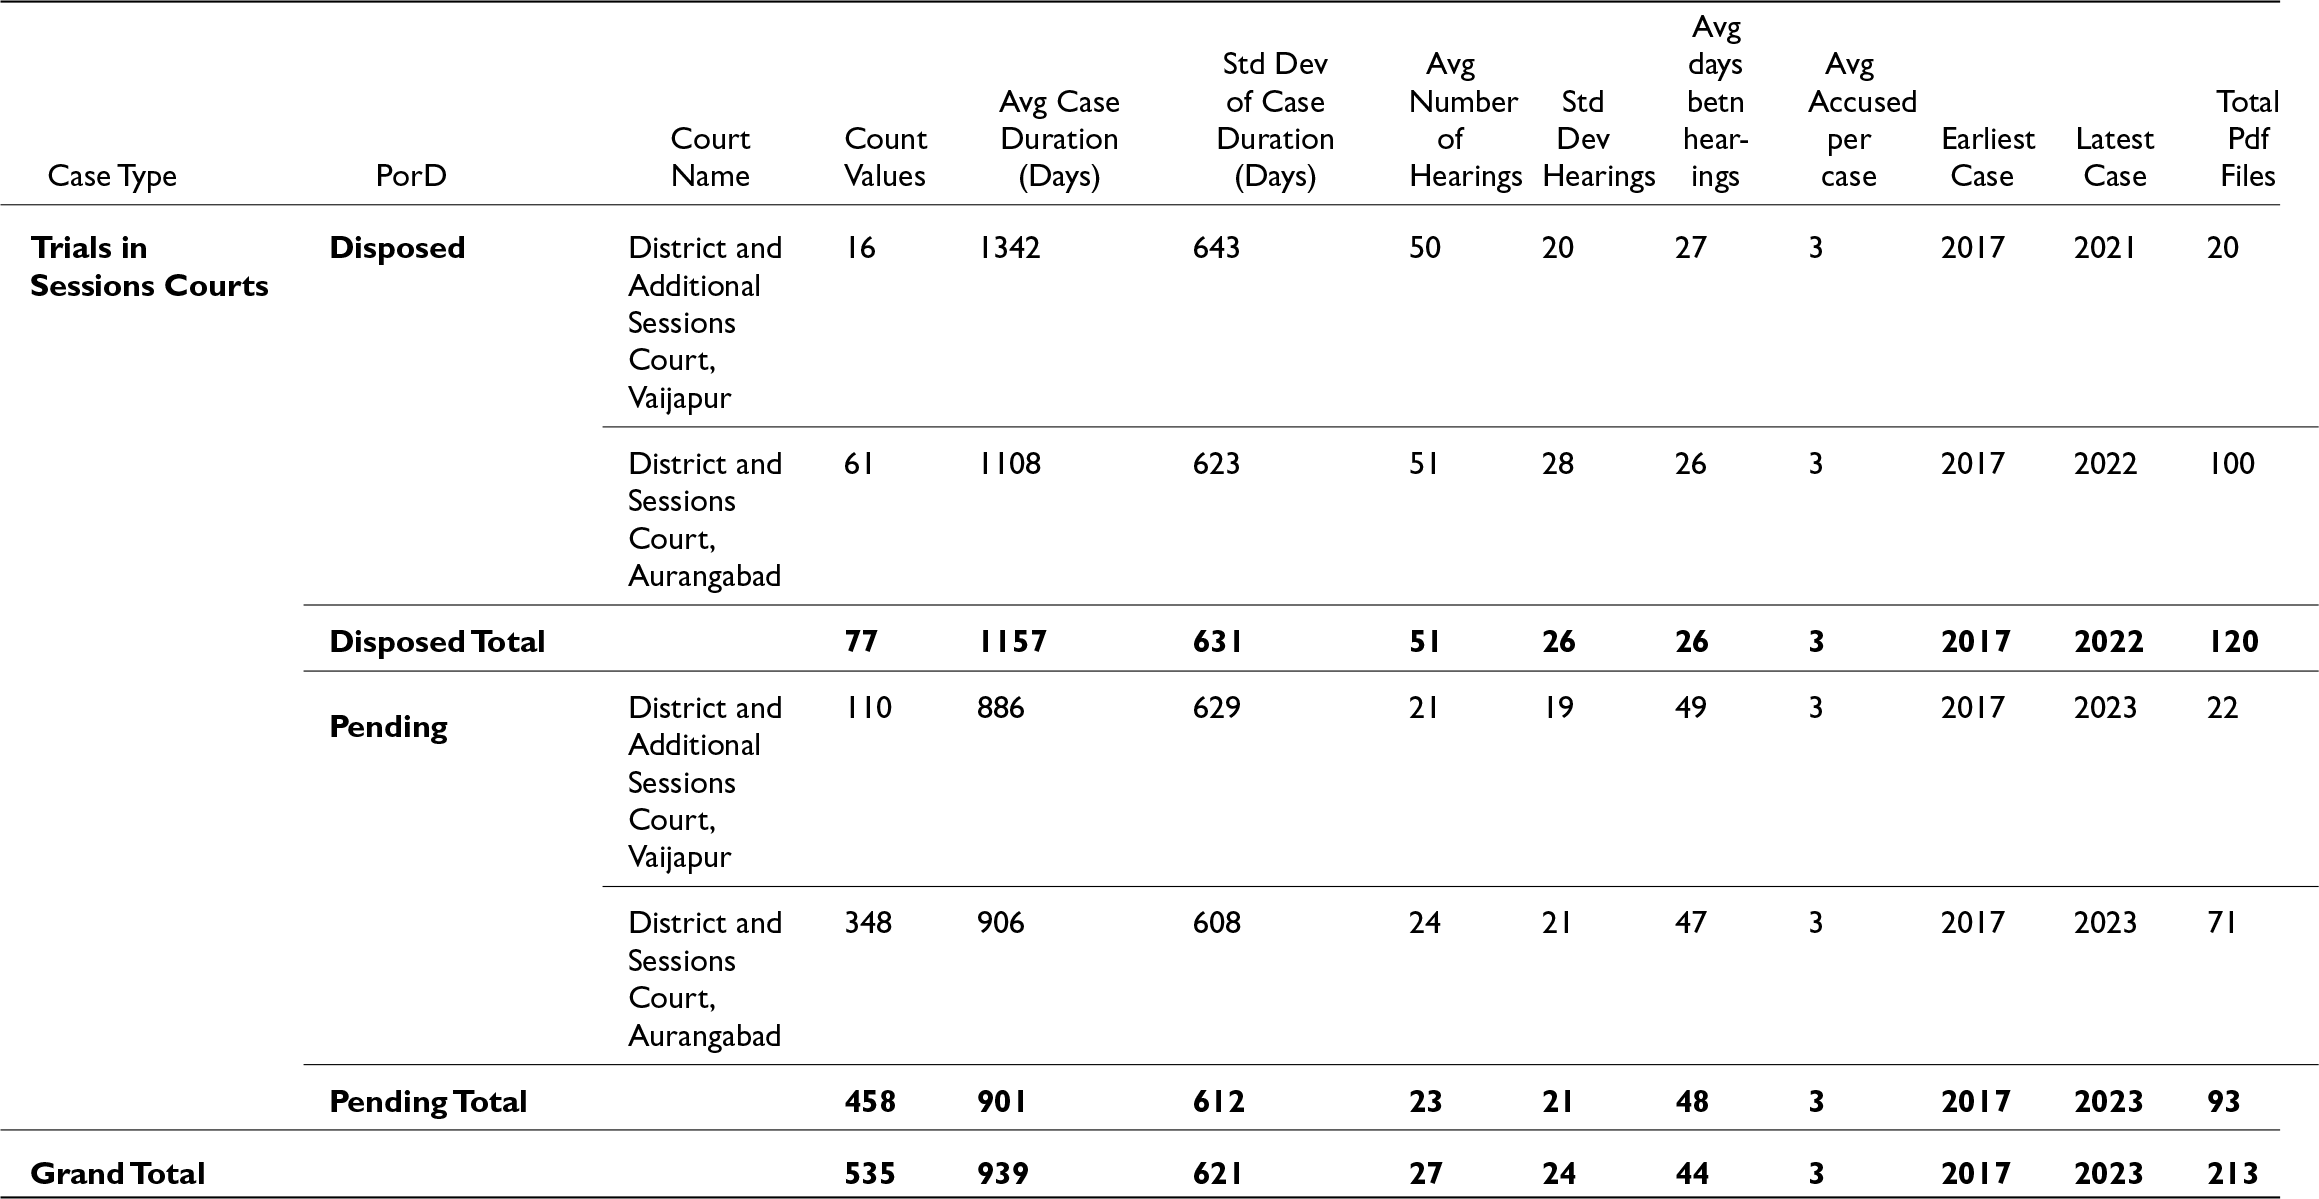
Table 3 Long description
The table summarizes sessions-court trial cases by status (disposed or pending) and by court, reporting counts, average case duration in days, hearing metrics, accused per case, year range, and total PDF files. Overall there are 535 cases with an average duration of 939 days, about 27 hearings per case, about 44 days between hearings, and about 3 accused per case, spanning 2017 to 2023, with 213 PDF files. Pending cases dominate: 458 pending versus 77 disposed, and pending cases have a shorter average duration (901 days) than disposed cases (1157 days). District and Sessions Court, Aurangabad has more cases than District and Additional Sessions Court, Vaijapur in both statuses (disposed 61 versus 16; pending 348 versus 110). For disposed cases, Aurangabad shows slightly fewer days between hearings (26) than Vaijapur (27), while for pending cases Vaijapur has slightly more days between hearings (49) than Aurangabad (47). Hearing counts are higher for disposed cases (about 51 on average) than pending cases (about 23), and variability is substantial for both duration and hearings as indicated by the standard deviations. The year fields indicate the earliest and latest case years in each group, not necessarily the full timeline of every case.
Other than trial cases, bail applications are the most numerous class of ‘cases’ in this archive. As Table 2 indicates, these applications are typically dealt with swiftly, with most taking about two weeks from their date of filing to be decided. Only three bail applications were listed as ‘Pending’ in any court across the district on the date this data was gathered.
In addition to the 2,191 trials cases and bail applications presented in Table 2, there were 395 additional miscellaneous cases that are part of this archive that are too trivial to include in my analysis.Footnote 42 This brings the total count of cases in this archive to 2,586.
Outcomes
How did the cases that were ‘Disposed’ end? Although one of the fields included in the metadata of each case is its ‘Manner of disposal’, aggregating this data does not yield useful or reliable insights. For example, Table 4 summarizes the ‘Manner of disposal’ in a narrower set of close to 500 Sessions Court cases. Although some of the court’s categories are straightforward and useful—‘Acquittal’, ‘Convicted’, ‘Abated’, etc.—others, such as ‘Decided’, ‘Judgment’, or ‘Disposed of otherwise’ are whimsical and obscure an understanding of the trends we are seeking.
Manner of disposal by the Sessions Courts in 499 cases

Table 4 Long description
The table reports how 499 Sessions Court cases were disposed of, split into contested and uncontested matters with a grand total for each outcome. Most cases ended in acquittal, with 284 cases, all of them contested. The next largest outcome is judgment with 123 cases, including 122 contested and 1 uncontested. Convicted and sentenced accounts for 45 cases, all contested, while several outcomes are rare at 1 case each, including conciliation, convicted and released on probation, and allowed otherwise. Uncontested cases are concentrated in transferred or made over with 16 cases and disposed of otherwise with 10 cases; smaller uncontested counts appear in abated and decided with 3 each. Overall, contested cases make up the vast majority with 459 cases compared with 40 uncontested. Some outcome labels may overlap in meaning, so categories should be interpreted as recorded rather than as mutually exclusive legal concepts.
Equally, all cases are labelled ‘Contested’ and ‘Uncontested’. These are not categories that seem to reliably indicate what they suggest—that the court proceeded ex-parte. We can only reliably discover what happened in these cases by reading the text of the decisions themselves where these are posted on the website. This is something I undertake later, in the third part of this article. Overlooking, momentarily, the vaguer categories in Table 4, and taking these figures at face value, it appears that during the past 20 years, acquittals under the POA exceeded convictions by a ratio of 6:1.
Although the e-courts website classifies these as 2,586 separate ‘cases’, this is because they are not grouped together, even when they refer to the same incident. Illustratively, an incident in Aurangabad may have led to the immediate arrest of the accused by the police. The magistrate’s order committing the case to trial, the several accuseds’ bail application(s) over the years, and the sessions case itself are each listed on the e-courts system as separate ‘cases’. In order to get a more accurate estimate of the actual number of atrocity ‘incidents’ currently being prosecuted in the district, I attempted to group the cases by the First Information Report (FIR) number and police station that they referred to.Footnote 43 This resulted in a smaller number of about 1,248 incidents reported to the police by FIRs and an additional 181 ‘private complaints’ made to magistrates under section 190(1) of the CrPC (i.e. not initiated through an FIR to the police), totalling about 1,429 distinct ‘incidents’. Table 5 provides details of the distribution of the number of court cases per incident/FIR and the total number of persons accused across all POA cases in the district.
Number of cases per FIR/total accused
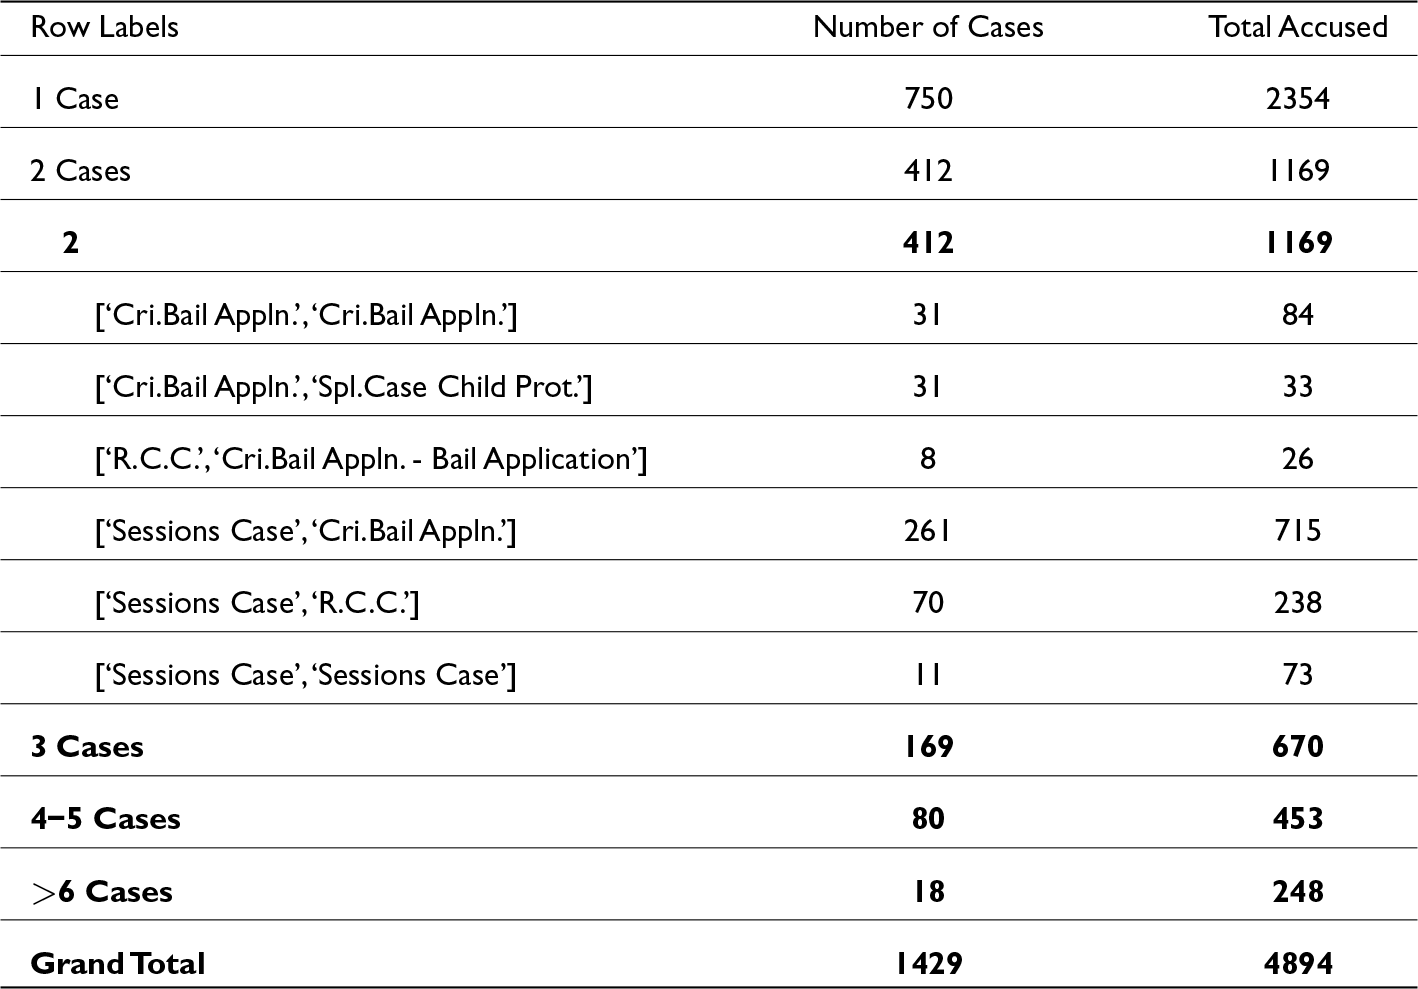
Table 5 Long description
The table counts how many FIRs fall into each category of number of cases per FIR and lists the corresponding number of cases and total accused. Overall there are 1,429 cases involving 4,894 accused. FIRs with 1 case are the largest group, with 750 cases and 2,354 accused. FIRs with 2 cases total 412 cases and 1,169 accused; the table also repeats this same 2‑case row and includes several subcategories for 2‑case combinations (for example Sessions Case with Criminal Bail Application has 261 cases and 715 accused, and Sessions Case with R.C.C. has 70 cases and 238 accused). As the number of cases per FIR increases, the number of FIRs generally declines: 3 cases has 169 cases and 670 accused, 4 to 5 cases has 80 cases and 453 accused, and more than 6 cases has 18 cases but 248 accused. This suggests higher‑case FIRs are rare but can involve many accused per FIR. Interpret with caution because the duplicated 2‑case row and the listed 2‑case subcategories may overlap rather than represent separate totals.
In Table 5, I have selectively expanded incidents which resulted in two cases within the district. As is evident, many incidents result in multiple cases because one or more bail applications are filed by the accused before the case is decided.
Geographic/temporal distribution of cases
The map in Figure 4 displays the number of FIRs registered under the POA Act at each police station in the district, and indicates the geographic distribution of caste atrocities over the past 20 years.
Map of Aurangabad District visualizing the number of FIRs registered under each police station.

Figure 4 Long description
The map of Aurangabad District visualizes the number of FIRs registered under each police station. Each station is marked with a circular symbol, with numbers indicating the count of FIRs. The highest concentration is seen in the central region, particularly around Chhatrapati, with 304 FIRs. Other notable concentrations include 148 FIRs in the southern area and 86 FIRs in the western region. The map uses a gradient of symbols to represent varying levels of FIRs, with larger symbols indicating higher numbers. The distribution shows clusters in the central and southern parts, with fewer FIRs in the northern and eastern areas.
As the map indicates, the largest percentage of atrocity incidents that were brought before courts in Aurangabad District—almost 30 per cent—occurred in and around Aurangabad city (the cluster of orange figures towards the centre of the map).Footnote 44 It is important to bear in mind that the incidents in my archive are spread over a 20-year period. Figure 5 charts the years in which these 1,248 cases originated as FIRs.
Year-by-year incidents of violence against Scheduled Caste and Scheduled Tribe persons in Aurangabad (2006–2023).

Figure 5 Long description
The graph includes a line and bar chart comparing violence against Scheduled Castes and Scheduled Tribes from 2006 to 2023. The horizontal axis represents years, while the vertical axis shows incidents ranging from 0 to 120. The line graph labeled 'Cases in My Archive' shows yearly data points: 2000: 25, 2001: 38, 2002: 84, 2003: 57, 2004: 37, 2005: 49, 2006: 69, 2007: 60, 2008: 53, 2009: 86, 2010: 88, 2011: 89, 2012: 65, 2013: 71, 2014: 63, 2015: 80, 2016: 101, 2017: 103, 2018: 107, 2019: 102, 2020: 108, 2021: 50. A dotted trendline indicates an overall increase in cases. Vertical bars represent 'Total ST plus SC Violence' from 2009 to 2020, with values matching the line graph for those years. The legend differentiates series: 'Violence Against SCs' and 'Violence Against STs' are represented by different colors and styles. Key trends include a peak in 2002 at 84 cases and a low in 2004 at 37 cases. The graph illustrates a general upward trend in violence cases over the years, with notable fluctuations and peaks.
The orange line charts the number of FIRs per year between 2006–2023, using information drawn from the cases in my archive. The vertical bars in the figure (for the years 2015–2022) represent data about POA incidents in Aurangabad reported in the Maharashtra State’s annual crime reports during those years.Footnote 45 I was interested in assessing the extent to which my data compares with official statistics put out by the state police. I did not expect them to align, but impressively, they seem to do so pretty closely. This indicates that the court’s website is current and accurately reflects cases in its system.
These figures indicate a broad stable-upward trend in atrocity incidents in Aurangabad District since the earliest case in my archive in 2005. This could be indicative of both the fact that caste violence has not abated in India, and that advocacy efforts by Dalit and Adivasi groups may have succeeded to some measure in getting more cases to court.
How soon after an FIR is filed do courts get involved? Roughly 90 per cent of all Sessions Court cases in my archive were commenced in the year following the registration of the FIR in the incident (see Table 6). In other words, the police typically complete their investigation and charges are framed by the court within a year of the incident. This is not particularly impressive since Section 4(2)(e) of the POA Act requires a charge-sheet to be filed by the police within 60 days of the FIR.
Time (years) from FIR to commencement of trial
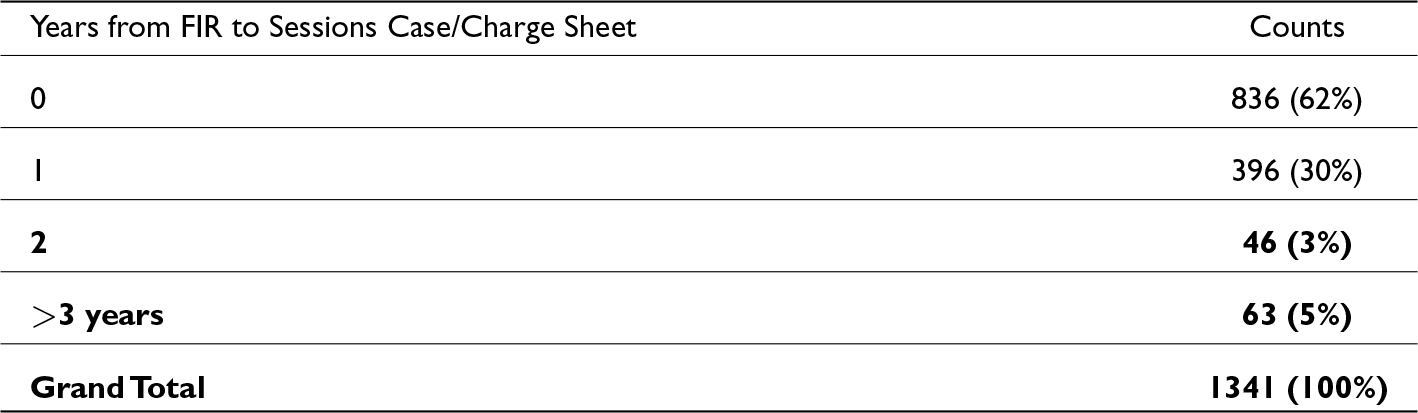
Table 6 Long description
The table reports how long it took from filing an FIR to the start of trial, with counts and percentages for each time band. Out of 1,341 cases, 836, or 62 percent, reached trial start in 0 years. Another 396 cases, or 30 percent, began after 1 year. Much smaller shares took longer: 46 cases, or 3 percent, started after 2 years, and 63 cases, or 5 percent, started after more than 3 years. Overall, the distribution is heavily concentrated in the earliest time band, with delays beyond 1 year affecting a minority of cases. Percentages are rounded as presented in the table.
The charge
What kinds of charges are typically brought against accused? What punishment do they face? By further manipulating the raw data, I was able to gain additional insights into these questions.
Prosecutorial overcharging—framing charges under multiple possible statutes and sections—is common across India, as it is in many jurisdictions. POA cases follow this pattern, with most accused being charged under multiple sections of the POA Act as well as any applicable sections of the Indian Penal Code. Of these, Table 7 picks out the maximal charging section in each case—the provision which carries the maximum punishment. I was able to do this for 1,391 cases out of 1,429 cases in my archive for which such information was reliably extractable.Footnote 46
Maximum sentence liable to be imposed upon conviction
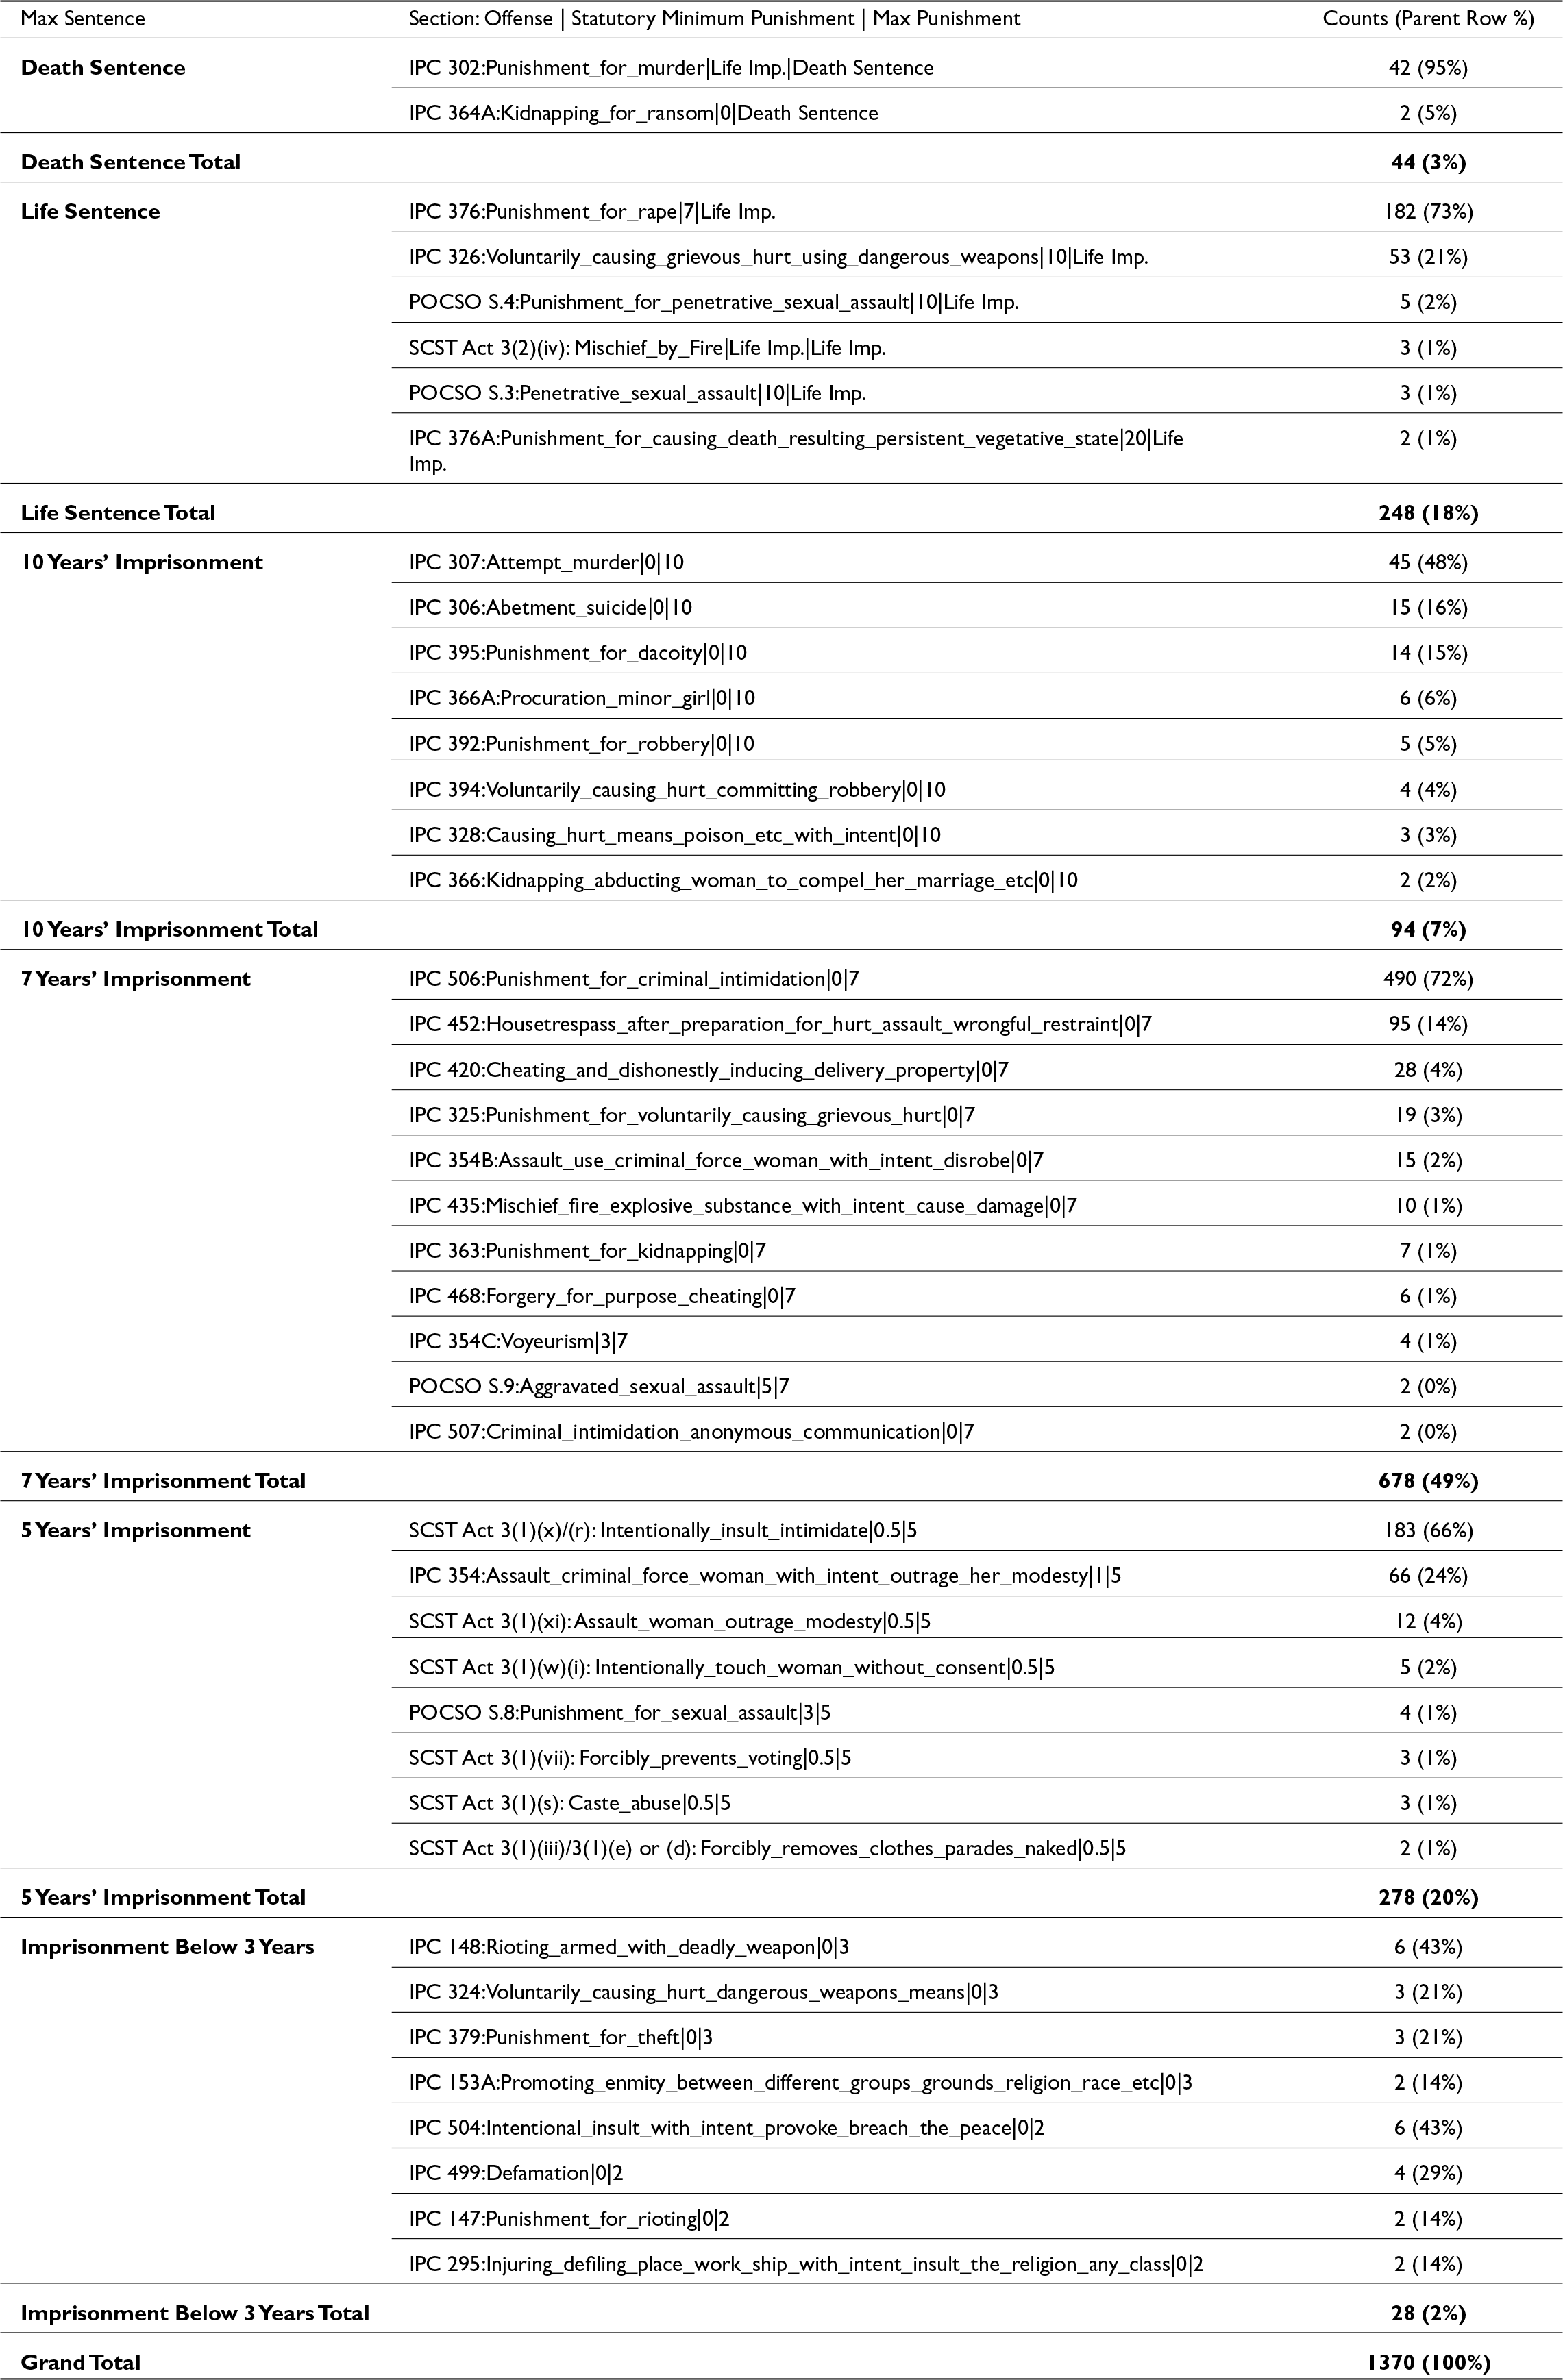
Table 7 Long description
The table groups 1,370 cases by the maximum prison sentence allowed for the charged offense and lists the main legal sections within each maximum-sentence group, along with statutory minimums and counts. The largest share is offenses capped at 7 years, totaling 678 cases, about 49%, dominated by criminal intimidation under IPC 506 with 490 cases, about 72% of that group. The next largest group is a 5-year maximum with 278 cases, about 20%, led by SCST Act 3(1)(x)/(r) with 183 cases, about 66% of that group, followed by IPC 354 with 66 cases, about 24%. Life-imprisonment maximums account for 248 cases, about 18%, mostly IPC 376 with 182 cases, about 73%, and IPC 326 with 53 cases, about 21%. Ten-year maximums are 94 cases, about 7%, led by attempt to murder under IPC 307 with 45 cases, about 48%. Death-penalty maximums are 44 cases, about 3%, almost all murder under IPC 302 with 42 cases, about 95%. A small remainder, 28 cases, about 2%, fall under maximums below 3 years, split across several offenses with low counts. Percentages shown for each offense are within its maximum-sentence group, while the totals show each group’s share of the overall dataset.
The title of the charging sections, reproduced in Table 7, gives us a preview of the varieties of violence to be encountered in this archive.Footnote 47 For instance, 42 cases involved murder, while 182 involved allegations of rape. In nearly half the cases in this archive, as Table 7 makes clear, the maximum sentence the accused faced at trial was seven years’ imprisonment, largely cases of alleged ‘Criminal intimidation’.
In addition, I was also interested in finding out how much of the POA Act was put to use by prosecutors and courts. In 1,248 cases out of 1,429 listed in my archive, among other charges, there is at least a single charge under the POA Act. Table 8 is a non-unique listing of all the sections of the POA invoked in my archive and their frequencies. Despite over 30 distinct categories of atrocities listed in the POA Act, a smaller group of about 10 of its sections appear to be its ‘meat and potatoes’ provisions. At the head of the table are two POA provisions dealing with caste abuse and intimidation. Although caste abuse is never the sole charge in any case, virtually every case in this archive contains detailed allegations of such abuse, as accompaniments to threats and physical violence. This is followed by two provisions—sections 3(2)(v) and 3(2)(va)—which provide for enhanced punishments for certain crimes under the IPC, when committed against SC/ST persons. The next four deal with sexual offences against women.
Frequency with which different sections of the POA Act are applied

Table 8 Long description
The table lists SCST Act provisions, their statutory minimum and maximum sentences, and how often each provision was applied. The highest frequency is for section 3(1)(x)/(r) intentional insult or intimidation, with 821 instances, followed by section 3(1)(s) caste abuse with 304. Next are section 3(2)(va) scheduled IPC crimes with 280 and section 3(2)(v) IPC crimes with a ten-year threshold, carrying life imprisonment, with 221. Several provisions related to offences against women appear frequently: 3(1)(w)(i) intentional touching without consent at 215, 3(1)(xi) assault to outrage modesty at 160, and 3(1)(w)(ii) words or acts of a sexual nature at 141; sexually exploiting a woman is lower at 58. Most remaining sections occur fewer than 40 times each, including dumping excreta at 39 and forcibly removing clothes or parading naked at 18. A small number of entries have no listed imprisonment term, such as forfeiture of property at 5 and bar against anticipatory bail at 4. Frequencies indicate how often sections were applied, not the number of unique cases or outcomes, and one row for section 3(2)(va) does not show sentence ranges in the table.
Lastly, using the description of the charging sections, I was able to group atrocities broadly into four overlapping sets based on a) whether any violence against women was alleged,Footnote 48 b) whether they involved serious non-sexual allegations of murder, grievous hurt, etc., c) whether the case involved not just individuals but groups of accused, and, finally, d) whether they involved allegations of ‘caste abuse’ or ‘intimidation’.Footnote 49 Figure 6 presents these four key sets of crimes as a Venn diagram indicating the level of intersectionality between these categories of crimes. Notably, about half of the crimes directed against women (around 260) were also group offences. Roughly a third involved ‘serious charges’ with possible punishments of over seven years.
Venn diagram showing the intersection of key charges in 1,244 POA cases in Aurangabad.

Figure 6 Long description
The figure is a four circle Venn diagram representing overlaps among four offence categories: Caste Abuse–Intimidation–Insult–Hurt (1155), Offences involving Violence Against Women (541), Murder, Kidnapping, Grievous Injury, Hurt with punishments from 7 years to death (288), and Group Offences–Rioting–Unlawful Assembly (813).
So far, this article has employed only the metadata from these cases to provide an account of how they are categorized and distributed institutionally across different courts and legal categories, spatially/geographically across the district, temporally over the years, and thematically depending on the nature of violence and the length of punishment. This data gives us some indication of the kinds of violence Dalits and Adivasis have faced and allow us to reasonably conclude that, for them, justice in the Aurangabad courts has been slow and rare. Useful as these insights are, to the sociologically and ethnographically minded researcher, they beg further questions such as: who the parties are, why courts arrive at the conclusions they do, what evidence they employ and how they reason, who represents the parties, how long do the accused spend in jail, and how easy is bail to obtain? These are questions for which the next part of the article mines the text of the decisions to provide answers.
Archival ethnography
As mentioned previously, I was able to download over 1,600 PDFs from the case pages on the e-courts website. What were these documents? Unfortunately, the labels on the court’s website are as unhelpful and unreliable in this detail as they are in accurately representing the outcome of the case.Footnote 50 A PDF could turn out to be anything from an interlocutory order to a final judgment or something else entirely. By computationally analysing their contents, I was able to classify these documents into eight broad categories (see Table 9).
Document types, year, and page lengths
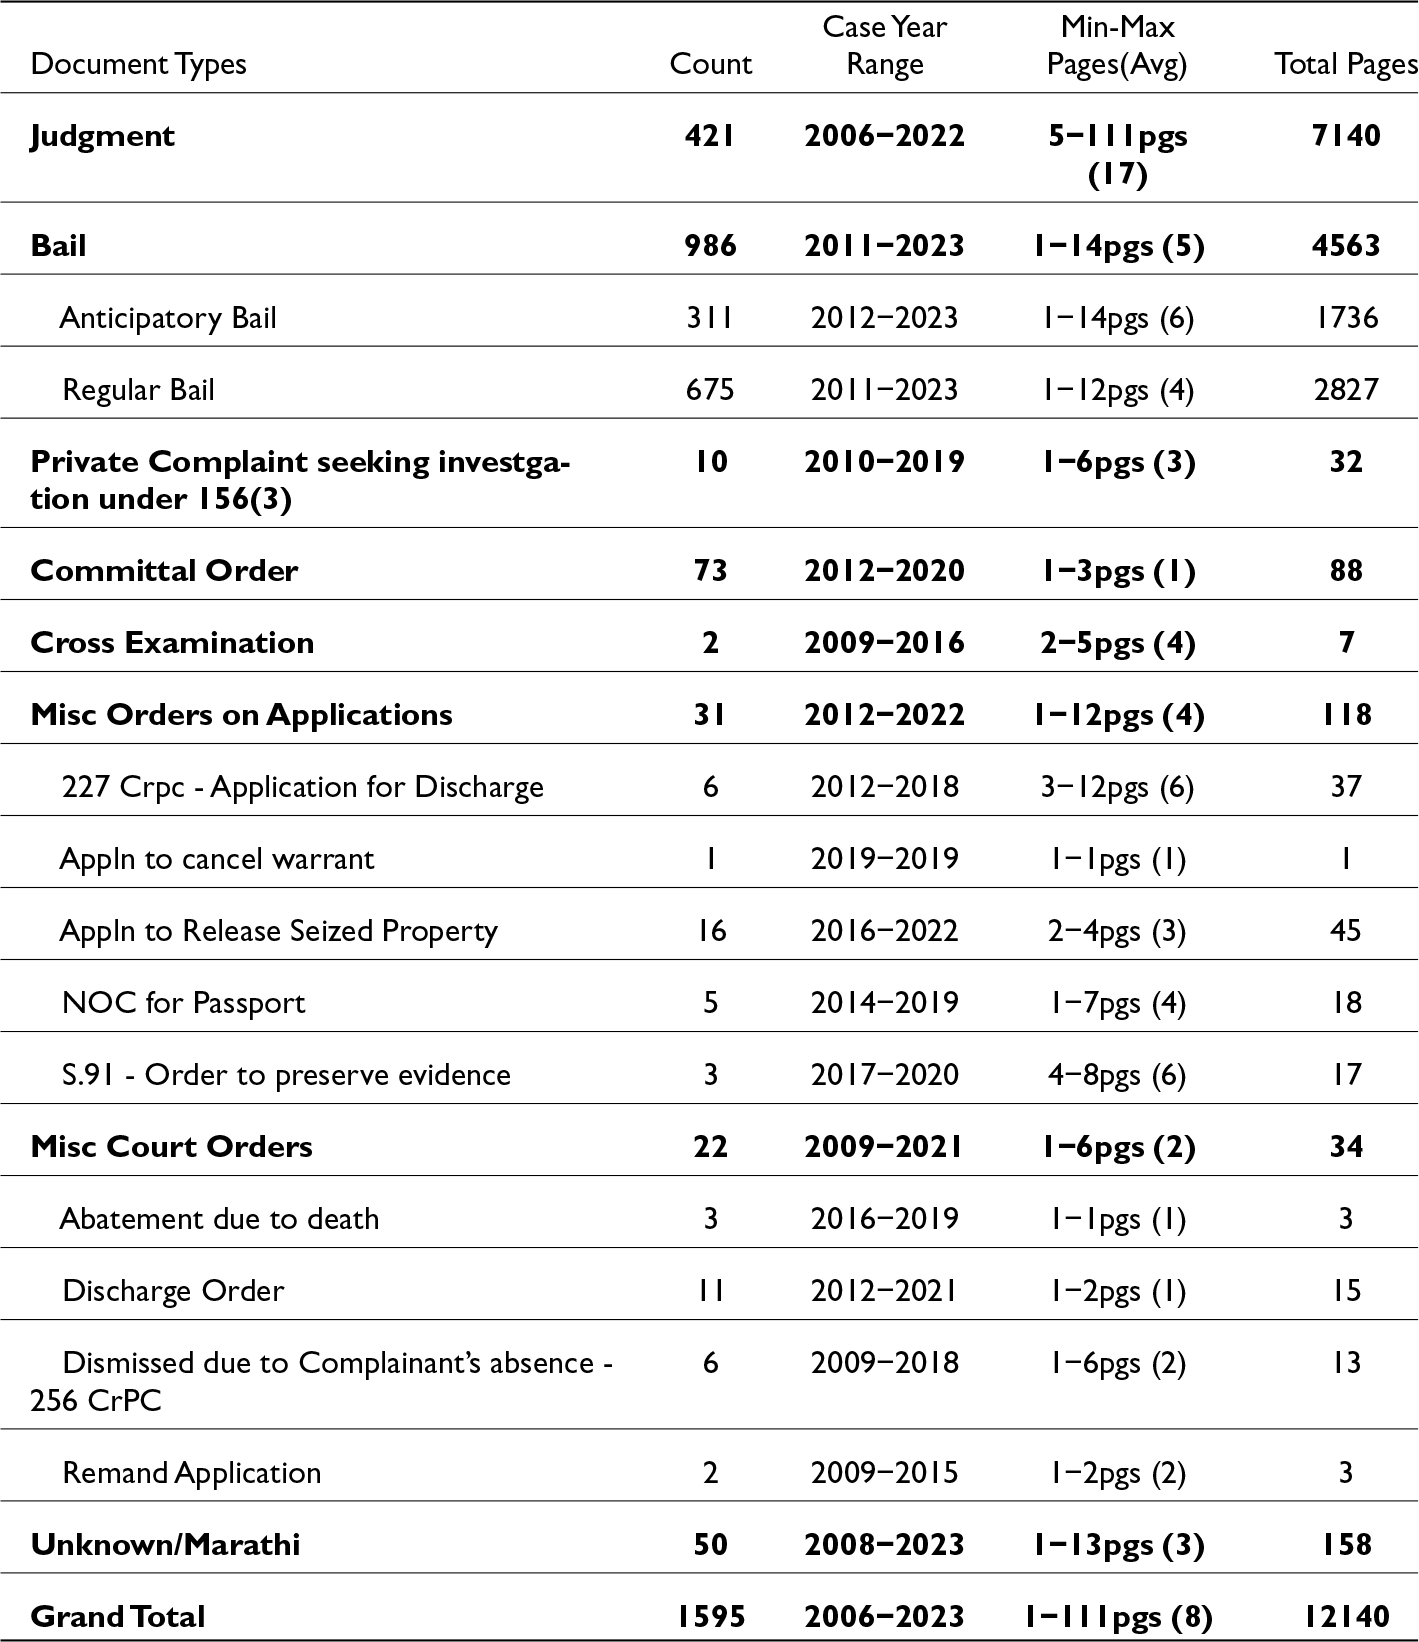
Table 9 Long description
The table lists legal document categories with their document counts, the years covered, typical page-length ranges with a central value in parentheses, and total pages per category. Bail is the largest group with 986 documents from 2011 to 2023 and 4,563 total pages, followed by Regular Bail with 675 documents and 2,827 pages, and Judgments with 421 documents and the highest total pages at 7,140. Judgments also have the widest page range, from 5 to 111 pages, while most other categories are short, commonly between 1 and 14 pages. Several categories are rare, including single-entry items like an application to cancel a warrant and very small groups such as cross examination and remand applications. An “Unknown or Marathi” category includes 50 documents from 2008 to 2023 and 158 pages. Overall, the dataset totals 1,595 documents across 2006 to 2023, with page lengths ranging from 1 to 111 pages and 12,140 pages in total. The page-length figures appear to summarize a range plus a typical value, so they should be read as descriptive rather than exact for every document.
After discarding files that were either duplicates or corrupted or irrelevant to the cases that they purported to be about, I was left with 1,595 documents connected with some 996 incidents out of 1,429 total incidents in this archive (see Table 5), That is, for about 430 incidents, my archive contained no supplementary documents.
Table 9 also provides information about the range of years during which the case was initiated (not the same as the years the documents themselves were issued), as well as the minimum, maximum, average, and total page lengths of the documents—an indication, for those curious, of the prolixity of criminal courts in this district.
The two categories at the head of the table—Bail Applications and Judgments—contain much usable ethnographic detail about the cases. These details frequently include a narrative of the incident, including the date and time, the people involved, the violence inflicted, the specific sub-caste of the parties, the names of their attorneys, etc. In addition, the text of these decisions allows us to discern patterns in the way courts adjudicate crime. Painstakingly extracted from these texts, these details form the basis of my analysis in the various sections that follow in this article. Although we will be ignoring the remaining documents mentioned in Table 9, their descriptions in that table indicate the diversity of documents within this archive. Of note, about 50 documents turned out to be in the regional Marathi language. Due to the increased complexity involved in reliably extracting and translating information from them, I have kept them out of my analysis.
In the sections that follow, I begin by using these legal texts as sources of sociological insight by briefly profiling the nature of disputes and the caste, occupation, and ages of the parties. I then turn my attention to a detailed study of bail decisions and judgments, examining the outcomes in each of these categories, who the judges, defence attorneys, and prosecutors were, and why the courts ruled the way they did.
Morphology of caste/tribe atrocities
Although the metadata presented so far does not reveal the specific details of any atrocity incident, the labels of the charging sections used in Table 7 are sufficiently loquacious for us to imagine what might have transpired. From details listed in that table—for instance, that in 42 cases, the accused were charged with murder, and in a further 43 cases, with ‘attempt to murder’—we get an abstract idea of the kind of violence that might have transpired. Read with the data presented in Figure 6, there is a high likelihood that these would be group violence incidents where the victims are women. Although this can be an instructive mode of reading these cases, those interested in a more granular account of caste/tribe violence in contemporary India are confronted with a dramatological deficit. Let me illustrate the shortcomings of this ‘imagining from metadata’ approach using two examples from my archive.
In ‘Spl.Case No.233/2021’, the 14-year-old daughter of the informant disappeared one night in early May 2021. A month later she was discovered by the police in the company of the accused, a legal adult, who was charged with offences of rape and kidnapping under the IPC and several offences under POCSO and the POA Act. The accused claimed in his defence that he and the victim had been in love, that he was a Scheduled Tribe person himself, and that the two had eloped and married, over the objections of her parents. Some aspects of this story appear to have been corroborated by the victim—at the time of her recovery, she recorded a statement before the police where ‘she affirms the love affair with accused and also states that, she married with the accused against the wish of her parents’. Accepting, provisionally, these statements as uncoerced, and not diminishing the seriousness of a minor’s vitiated consent in ‘statutory rape’ cases of this kind, the facts disclosed in this case differ from what is available to be imagined from its metadata. We encounter this case in the metadata as follows— ‘IPC 363:Punishment for kidnapping → IPC 366A:Procuration of minor girl → IPC 376:Punishment for rape → POCSO S.3:Penetrative sexual assault → POCSO S.4:Punishment for penetrative sexual assault → POCSO S.5: Aggravated penetrative sexual assault’. How frequently do ‘elopement’ cases of this kind—whether they involve minors or not—occur in this archive?
Consider another case, grouped under both the headings of ‘sexual violence’ and ‘group violence’ in Figure 6. ‘Bail Appln No.2134/202’ involved four accused, including two women, who were charged with a range of offences, including unlawful assembly and rioting, sexual assault against a woman, and criminal intimidation. The victim and her family appear to have been cultivating cotton on land over which the accused claimed to also have rights. This ‘civil dispute’ over land seems to have erupted into full-blown physical violence on the date of the incident. That day, according to the victim, the two women-accused accosted her, abused her caste, ‘pulled her hairs and dropped her on the ground … took bite to her right hand … assaulted by means of stick and also pressed her neck and snatched the Mangal Sutra (necklace)’. The male accused then joined in the assault ‘by means of fists and kicks blows’ and kicking her ‘on the private part’. The group departed, threatening her that if she ‘want(s) agricultural land’, she should ‘share two nights with them’ and that they would ‘commit rape … if (she) entered in the field (again)’.
Although ‘group violence’, ‘intimidation’, and ‘sexual assault’ are not inaccurate rubrics through which we may understand this case, they fail to disclose a key dynamic of the case—the attempted land-grab—which is incapable of being inferred from the charging sections listed alone. To what extent does the violence of POA cases centre around contests of this kind over land? Once again, metadata allows us no access to questions of this kind.
Actually solving a problem of this kind for an archive as large as this involves leaning on formalist techniques developed within the discipline of literary studies. For over a century, literary scholars have endeavoured to reduce the heterogeneity of plots encountered in folklore, mythology, novels, and similar fictional genres down to modular meaningful units for the purpose of analysis.Footnote 51 The operations developed within this discipline to classify fiction according to, say, their ‘motifs’, ‘functions’, or ‘genres’ are, it turns out, extendable to any archive of texts—including POA cases. Drawing inspiration from these approaches, I measured the frequency of nine recurring motifs among the facts of the decisions (from 897 cases in which the PDFs I had were sufficiently prolix). In other words, my solution turns out to involve an act of creating more metadata for the imagination to operate upon. Figure 7 displays the results of this ‘drawing-down-of-life-into-variables’ graphically, through a recently innovated visualization technique called an ‘upset plot’.Footnote 52 Due to the likely strangeness of upset-plots to lay readers, and the fact that I employ them several times in this article, let me briefly explain how they are to be read.
Frequent motifs in POA cases: upset plot.

Figure 7 Long description
Common Motifs in POA Cases. The UpSet plot combines a bar chart and dot matrix to visualize motif frequencies and intersections in 897 POA cases. The top bar chart represents intersection sizes, with the y-axis labeled 'Count' ranging from 0 to 50. The x-axis shows intersection groups, each corresponding to a column in the matrix below. The matrix lists motifs such as Loan Dispute, Political Rivalry and Land Dispute. Filled dots indicate motif presence in intersections, with vertical lines connecting dots to show combined motifs. The most frequent single motif is Loan Dispute, while the largest intersection includes multiple motifs like Political Rivalry and Land Dispute. The shaded band behind the rows serves as a visual separator. Key intersections include Loan Dispute with 50 cases and Political Rivalry with 40 cases.
Figure 7 lists the nine motifs that I identified in the texts, in ascending order of their frequency within this archive.Footnote 53 The horizontal bars to the left of the motifs indicate the total number of cases where they were encountered. For instance, a total of 134 cases included some reference to disputes over land; 184 cases involved allegations of child sexual abuse; 269 cases involved allegations of rape/sexual harassment (that did not involve any minors), and so on. The vertical bars to the right of the motifs indicate how frequently these motifs intersect uniquely. For instance, the first column indicates that in 126 cases ‘caste abuse’ and ‘physical violence’ were involved, and that none of the remaining motifs were encountered in these cases. These cases can be read to represent the ‘ordinary’ arbitrary violence of caste. In 36 cases (vertical column 4 in the plot) the facts disclosed only the motifs of ‘allegations of child sexual abuse’ and the suggestion of a ‘false promise to marry/love affair’. Although it takes some getting used to, the utility of a graphical representation of this kind is its ability to simultaneously convey the absolute frequency of these motifs (horizontal bars) and the extent to which they overlap with others (vertical bars) in these texts. The plot restricts itself to the top 25 intersections—cases where two or more motifs intersect.
What emerges from this plot is, hopefully, a more complex account of the variety and intersectionality of atrocities that Dalits and Adivasis experience. Leaving aside rape and child sexual abuse, a large proportion of the miscellaneous violence appears to have taken place against the background of land disputes or local elections. Roughly a third of all child sexual abuse cases (36+18+6) are either cases of false promise to marry by the accused or an alleged love affair between the parties.
In addition to these motifs, there is one other detail which the texts yield that may provide fodder for imagining atrocities. Most cases narrate the time and date of the incident that led to the complaint. I was able to extract this information and plot their distribution across the days of the week to put together the following chart of times when it is safest for a Dalit/Adivasi to ‘take a stroll’ (Figure 8).
Heatmap of days of the week and times of incidents.

Figure 8 Long description
The heat map is titled 'When's it safe for a Dalit/Adivasi to take a stroll in Aurangabad?' It displays incident counts extracted from over 600 cases, organized by days of the week and time ranges. The vertical axis lists time ranges: Midnight to 6 am, 6 am to 9 am, 9 am to 4 pm, 4 pm to 8 pm and 8 pm to Midnight. The horizontal axis lists days from Sunday to Saturday. The color gradient represents incident frequency, with darker shades indicating higher counts. Notable patterns include higher incidents on Saturday between 8 pm and Midnight, with a count of 854 and lower incidents on Tuesday between Midnight and 6 am, with a count of 1. The total incidents for each day are listed at the bottom, with Saturday having the highest total of 1222 incidents.
This is not exactly actionable information, but Fridays, followed by Wednesdays, it turns out, have been particularly deadly for Dalits and Adivasis in Aurangabad.
Sociological profiles of the accused and the victims
What can we say about the accused and the victims beyond just the offences they were charged with or subjected to? Many of the texts disclose information about the age and occupation of the accused, and frequently include details about the specific sub-caste of the parties. Harvesting this information yields a rough sociological account of the participants in caste violence in the district. Figure 9 displays the distribution of the accused’s occupations.
Occupational distribution of accused.

Figure 9 Long description
The treemap titled 'Occupational breakdown of Accused (Total = 1603)' illustrates the distribution of occupations among accused individuals. Each rectangle represents an occupation category, with size indicating the count of accused. The largest categories are Labour (248) and Agriculture (229), followed by Private Service (121) and Business (93). Smaller categories include Education (71), Construction (64) and Driver (61). Many other occupations have small counts, such as Tailor (11), Electrician (9) and Plumber (8). The treemap uses color for visual distinction, but color does not encode specific data. The data reflects a diverse occupational distribution, with Labour and Agriculture being the most prominent groups, while other occupations are fragmented across many smaller categories.
There is a whimsical quality to some of the descriptions used by the court: for example, ‘student’ and ‘education’ seem to be overlapping categories, as are ‘agriculture’ and ‘farming’. I have also had to combine some categories arbitrarily, rather than thematically, to fit them on the map. More than just describing the accused, a representation of this kind is useful as a snapshot of non-Dalit-Adivasi economic life in the district. The picture it yields is of a community largely comprising peasants, agricultural workers, a range of minor contract workers, and petty traders—jobs that require a secondary education, at most, and that do not usually yield a stable income. A handful of accused are described as government employees, legal or medical professionals, or teachers at different levels—indicating a fact that is somewhat obvious: education does not preclude the practice of caste.
In addition, the text of many cases mention the sub-caste of the accused. In cases where this information was not recorded by the judge, for the purpose of representation, I have manually classified the accused as ‘Unspecified Hindu’ (when their names were not discernibly Muslim), although it is likely that in these cases, the accused belong to the ‘Maratha’ sub-caste, dominant in the district. Figure 10 aggregates this information and conveys a sense of variations within the caste-landscape of Aurangabad.
Caste distribution of accused in 996 cases.

Figure 10 Long description
The bar graph presents the number of accused individuals categorized by different caste labels. The horizontal axis lists the caste categories, while the vertical axis represents the count of accused individuals. Each bar corresponds to a specific caste label, with bar height indicating the number of accused in that category. The graph allows comparison of accused counts across caste groups, highlighting variations in representation among the categories. Exact values can be interpreted from the respective bar heights or labels if provided.
Significantly, in the number of Muslims accused, it calls attention to the extent to which caste infiltrates all religious communities in India. Alternatively, although this is unverifiable, it could also be indicative of the greater ease involved in filing FIRs and prosecuting cases against Muslims, given the general rise of communalism in India.
In addition to their caste and occupation, the texts of judgments usually list the ages of the accused. Table 10 displays the age distribution of the parties gathered from 486 cases where this information was available. Somewhat expectedly, two-thirds of the accused are young, aged between 18–37.
Age distribution of accused in 486 cases

Table 10 Long description
The table reports the number and share of accused people by age group, totaling 1,970 individuals. The largest group is ages 18 to 27 with 757 people, representing 38 percent. Ages 28 to 37 are next with 562 people or 29 percent, followed by ages 38 to 47 with 312 people or 16 percent. Older groups are smaller: ages 48 to 57 have 191 people or 10 percent, ages 58 to 68 have 101 people or 5 percent, and those older than 68 have 47 people or 2 percent. Overall, the distribution is concentrated among younger adults and decreases steadily as age increases. Percentages are rounded, so small differences may be due to rounding rather than meaningful change.
Compared to the information available about the accused, the texts are less detailed about the victims’ biography. Ages are mentioned only in case of minor victims (some 216 cases out of 1,400+ involved minor victims) and their occupations are seldom mentioned with any clarity. Many decisions do mention the caste/tribe of the victim in a fairly idiomatic, if agrammatic way, for example, ‘The informant is belonging to Mahar Caste’, which enables extraction. Alternatively, most decisions quote the exact words of caste abuse complained of and these utterances sometimes specifically name the victim’s caste (e.g. ‘Bhilaṭyā jāsta mājalā kā? Paise gheūn kāmālā yet nāhī’Footnote 54 [Bhil] or ‘Mahardya Tula Va Tuzya Gharchya Lokas Marun Taku’Footnote 55[Mahar]). Figure 11 below presents this information for 830 victims extracted from 605 cases.
Caste distribution of victims/complainants in 605 cases.

Figure 11 Long description
The treemap illustrates the caste distribution of POA victims or complainants, totaling 829 individuals. The largest section represents Mahar with 360 individuals. Other significant categories include Mang with 144 individuals, Dhed with 133 and Bhil (ST) with 66. Smaller sections include Baudh with 48, Chambhar with 21 and Bhangiwar with 21. Additional categories are Mahadeo/Malhar Koli with 12, Pardhi (ST) with 14, Dhor with 12, Thakar (ST) with 8, Khatik with 9 and Gond (ST) with 10. Each section is labeled with the caste name and the number of individuals in that category.
Predictably for the region, Mahars constitute the single largest sub-caste against whom caste violence is directed. Roughly a seventh of the victims were members of Scheduled Tribes, mostly Bhils.
With this preliminary sketch of the parties and the kinds of disputes, we may now turn to how they fared before the courts. The next segment of this article presents data drawn from close to a thousand bail applications that make up this corpus. This is followed by the final section of this part where we examine insights draw from judgments delivered by the courts.
Bail
As a way into this topic, let me offer the following account from the archive of a quotidian situation in which bail is sought. In December 2012, Maya (name changed) a Bhil (ST) woman and a cook in the local government high school was sexually harassed by her co-worker, Gorakh Sonawane, the school peon. Sonawane appears to have cornered her one morning in the school kitchen (‘caught her left hand with ill intention’) and offered her Rs 1,000 if she would accompany him to the nearby Jowar fields. Upon her refusal, he warned that he could jeopardize her position at the school and even threatened to kill her. Fearful and distraught, she returned home and narrated the incident to her mother-in-law. Both women returned to the school and complained about the incident to the headmaster, following it up with a written complaint to him the next day. When no consequence followed, they filed a First Information Report (FIR) with the police a week later when Maya’s husband, who had been away on work, returned to the village.
Fearing arrest, towards the end of the month, Sonawane filed an application for ‘anticipatory bail’ under Section 438 of the Code of Civil Procedure—an Indian legal novelty that permits anyone apprehending arrest to obtain bail in advance of being arrested.Footnote 56 He had been ‘falsely implicated’, he claimed. Maya had sought to borrow Rs 1,000 from him, he alleged, and her complaint was an act of revenge against his refusal to advance her this amount. There was a suspicious delay of a week in filing the FIR. His lawyer, Mr Gore, cited a Bombay High Court ruling from 2006 which had held that such delays, accompanied by ‘smell of political rivalry’, and the offence not having occurred ‘in a public view’, would entitle a person accused to anticipatory bail. The local police objected to his being granted bail. Sonawane belonged to the ‘Sutar’ caste, classified officially among ‘Other Backward Classes’.Footnote 57 He was ‘having relations with the political persons’ and ‘there is possibility of riots in the village’, they said. In a short decision, the judge S. D. Agrawal rejected Sonawane’s bail application. The FIR was lodged in a timely way and so the High Court precedent did not apply. The case was not false, he wrote, because ‘no lady will lodge any false report on the stake of her reputation or prestige’.Footnote 58
A month later, Sonawane was arrested by the local police on charges of Section 354 of the IPC and 3(1)(xi) of the POA Act—both punishing the offence of ‘outraging a woman’s modesty’.Footnote 59 If the plot of this story so far has been about the tenacity of caste/tribe survivors in seeking justice, the way it ends prompts us to imagine how difficult it must be to sustain this stance for any length of time. A week before Sonawane’s arrest, in late January, Maya filed an affidavit in a local court effectively withdrawing her complaint against him: ‘there was only altercation between her and accused, and due to misunderstanding she had lodged FIR’, she had declared. On the basis of this volte-face, Sonawane’s application for regular bail under Section 439 was granted, two weeks after his arrest. His release was ordered by the same judge who had rejected his anticipatory bail application. He was ordered to supply a personal bond of Rs 15,000 (roughly $200) along with a solvent surety. As is typical, his bail was ordered on condition that he would not ‘tamper the prosecution evidence and witnesses’.Footnote 60 Six months later, when his case was brought to trial, he was acquitted by the Sessions Court on all charges. Both Maya and her mother-in-law testified at the trial, but turned hostile (‘both the witnesses are not supporting the prosecution case’, wrote the judge).Footnote 61
Compared to the lively interest that the topic continues to receive in other common-law countries like the United States,Footnote 62 bail in India has historically not received much serious scholarly attention. Within the corpus of studies on the topic, the state’s scholarship, in the form of Law Commission reports and Appellate Court decisions, has, until recently,Footnote 63 towered over academic work. There have been two standard frames within which bail has been studied, both set by the state’s non-academic scholars over the past 75 years. Bail has been studied as a device to check police powers, widely acknowledged in India, even by the state in its own reports, to be given to arbitrariness. Alternatively, bail has been studied as a key dynamic in the demographic, logistical, and humanitarian problem of overflowing prisons and custodial undertrials. The only statistics of relevance to the topic published by the state are the overall figures of bail granted each year and the number of custodial undertrials at the end of each year. This has constrained the form that discourse on bail has been able to take. Articles and reports alike typically open with the imperatives of improving these numbers and then proceed to review the statutory provisions on bail and appellate jurisprudence on arrest safeguards, with a nod to questions of the importance of legal aid. Although this is important, careful work, there are only two kinds of diagnoses that such accounts are capable of yielding—high figures of undertrials must either be an effect of imperfect laws, or due to the imperfect implementation of judicial safeguards and legal aid.Footnote 64 Within this arid landscape there have been a few oases of exceptional luminescence—recent civil society reports which have mixed ethnographic and data-driven methods to broaden and deepen our understanding of the process and its impacts.Footnote 65 This section of the article is a continuation of this strand of scholarship and offers insights into what happens when the accused approaches the courts for bail.
Let me offer a brisk overview of the different circumstances under which the CrPC permits under-trials to seek bail. During the investigation of any ‘cognizable offense’Footnote 66—such as all the offences under the POA Act—the police may arrest any suspects without a warrant (Section 41 CrPC). Before this happens, anyone who ‘apprehends arrest’ usually has the option of applying to the High Court or a Court of Sessions for anticipatory bail (Section 438 CrPC). If successful, an order of this kind entitles the applicant to be released immediately upon arrest. Absent such an order, however, normally anyone arrested is to be produced before a magistrate within 24 hours (Section 56 CrPC). At this time—colloquially called the ‘First Production’—the magistrate has the option of ordering the release of the arrested person on bail (Sections 436/437 CrPC). Alternatively, they may permit the accused to remain in custody with the police (‘police custody’) for no longer than 15 days after the initial arrest (Section 157 CrPC). After this period, or without ordering police custody, the magistrate may order the accused to be sent to jail (‘judicial custody’) for a period of up to 90 days if the offence is punishable with prison terms of more than seven years, or for 60 days in other cases. If the police complete their investigation during this period and the magistrate/Sessions Court decides to proceed to trial, the accused’s incarceration can continue indefinitely until either their bail application succeeds or they are acquitted/discharged by the court. A person so ‘remanded’ to police or judicial custody has the option of approaching the Sessions Court or High Court for bail (Section 439 CrPC).
To this broad-strokes account, there is one additional detail that bears mentioning, unique to POA cases. The POA Act absolutely bars anticipatory bail applications (Section 18). When, in 2018, the Supreme Court attempted to circumvent this prohibition, as discussed above in ‘Overview of the POA Act’, Parliament amended the statute to reinstate and reinforce this prohibition.Footnote 67
This is not an account that does justice to the many idiosyncrasies of bail law in India.Footnote 68 However, it has the virtue of conveying as much of the law as is useful for the discussion in the following pages.
The texts of bail decisions in my archive are either 438 CrPC ‘anticipatory bail’ cases or 439 CrPC ‘regular bail’ applications filed by accused who have already been previously remanded to judicial custody by magistrates. We do not have an account of what happens at ‘First Production’ in Aurangabad. While this would have been useful for a ‘complete’ picture of bail, official statistics allow us to discern broad patterns of what happens to those arrested at First Production. In 2022, some 6,831 persons were arrested in Aurangabad District under both offences related to the IPC and other criminal laws. Of these, about 6,678—fully 98 per cent—were reportedly enlarged on bail by the courts during the year.Footnote 69 The trend for the previous five years is similar. Although this statistic does not tell us how long, on average, each person spent behind bars, it does suggest that the courts in this district do not appear to be unusually carceral in their approach towards undertrials. This is a useful preliminary impression to bear in mind as we dig deeper into the data.
Figures 12 and 13 convey an overall picture of the bail decisions in this archive by outcome and over time.
Bail outcomes (n=986).

Figure 12 Long description
A stacked vertical bar graph titled Bail outcomes left parenthesis n equals 986 right parenthesis. Legend: Anticipatory Bail and Regular Bail. Horizontal axis categories: Bail Denied, Bail Granted, Other Outcomes. Vertical axis scale: 0 to 700. Bail Denied stacked bar values: Anticipatory Bail 160, Regular Bail 190, total label 350. Bail Granted stacked bar values: Anticipatory Bail 128, Regular Bail 459, total label 587. Other Outcomes stacked bar values: Anticipatory Bail 23, Regular Bail 26, total label 49.
Regular and anticipatory bail outcomes: 2011–2023 (n=937).

Figure 13 Long description
The graph plots years from 2011 to 2023 on the horizontal axis and count of bail orders on the vertical axis, ranging from 0 to 160 in increments of 20. Four categories are shown as stacked segments within each bar, as listed in the legend: Anticipatory Bail Denied, Anticipatory Bail Granted, Regular Bail Denied and Regular Bail Granted. Labeled totals appear above each bar as follows. 2011: total 1. 2012: total 16. 2013: total 2. 2014: total 24. 2015: total 14. 2016: total 2. 2017: total 66. 2018: total 112. 2019: total 112. 2020: total 70. 2021: total 102. 2022: total 139. 2023: total 138. An additional labeled value of 108 appears on the 2023 bar and a separate bar at the far right of the chart carries a labeled total of 35. The segment breakdown visible across bars shows that Regular Bail Granted forms the largest portion in most years. Notable labeled segment values include: 2015 showing 19, 22, 10 and 15; 2016 showing 22 and 32; 2017 showing 18, 14, 20 and 14; 2018 showing 47, 22, 27 and 16; 2019 showing 47, 25, 29 and 11; 2020 showing 29, 25, 21 and 25; 2021 showing 78, 17, 7; 2022 showing 52, 22, 15 and 13; 2023 showing 7 and 6. Totals are low from 2011 to 2016, rise sharply from 2017 onward and reach the highest recorded counts in 2022 and 2023.
Out of 986 bail decisions in my archive, bail was granted in 587 (65 per cent) cases and denied in 350.Footnote 70 More bail applications were granted than denied over the 12-year period that this archive spans, but the numbers are not as starkly in favour of granting bail as the system-wide statistics described previously. Forty-eight applications had ‘other outcomes’—such as withdrawal of the bail application before decision, ‘partially allowed’ applications, and a small number of cases where it was not possible to identify the outcome computationally. Figure 13 excludes these ambiguous applications and plots those applications that had either been granted or denied during the years 2011–2023.
Of particular interest in Figure 13 is the slim yellow band of anticipatory bail applications that were granted after 2018. As mentioned above, in 2018, Parliament reinforced a statutory prohibition against granting anticipatory bail in POA cases. However, almost immediately following this amendment, several High Courts across India and a recent Supreme Court decision have held that anticipatory bail can still be granted in POA cases if the allegations do not make out a prima facie case under that Act.Footnote 71 This has opened up a productive avenue for defence counsel and trial courts to continue seeking and granting anticipatory bail.
Is there a pattern to the facts in cases where bail is granted or denied? Our common-sense expectation is that bail would be more difficult to obtain in cases where the allegations are more severe. Section 437(1)(i) of the CrPC appears to codify this impulse by barring courts from granting bail in cases where it appears that ‘reasonable grounds’ exist ‘for believing that [the accused] has been guilty of an offence punishable with death or imprisonment for life’. In such cases, however, bail may still be granted ‘if such person is under the age of sixteen years or is a woman or is sick or infirm’ or if the court determines that ‘it is just and proper … for any other special reason’.
Figure 14 investigates the working of this section by charting bail outcomes against two parameters—the maximum possible sentence the accused would face upon conviction, and whether sexual violence was involved—the hypothesis being that these are reliable proxies for the severity of the crime.
Bail outcomes by maximum punishment/type of dispute (n=933).

Figure 14 Long description
The bar graph compares bail outcomes based on maximum punishment and type of dispute. The horizontal axis represents the number of cases, ranging from 0 to 350. The vertical axis lists categories: '5 Years Maximum Punishment', '7 Years Maximum Punishment' and '10 Years Maximum Punishment', each with subcategories such as 'Misc Violence', 'Rape/Sexual Harassment', 'Murder' and 'Child Sexual Abuse'. The legend indicates 'Bail Granted: Regular Bail', 'Bail Granted: Anticipatory Bail', 'Bail Denied: Regular Bail' and 'Bail Denied: Anticipatory Bail'. Quantitative values are shown for each category, such as 'Misc Violence' under '5 Years Maximum Punishment' with 47 cases of regular bail granted and 11 cases of anticipatory bail granted. 'Rape/Sexual Harassment' under '10 Years Maximum Punishment' shows 138 cases of regular bail granted and 67 cases of anticipatory bail granted. The graph uses horizontal bars to display data, highlighting differences in bail outcomes across categories and punishment levels.
Although a greater proportion of bail applications appears to fail as the severity of punishment escalates beyond seven years, this does not appear be an absolute impediment in granting bail. About as many applicants were granted bail as were denied among, say, persons accused of child sexual abuse and facing life terms. As is clear from Figure 14, over 150 accused facing charges of up to life imprisonment or the death sentence were granted bail by the Aurangabad Sessions Court. The texts of these decisions seldom discuss the ‘special reasons’ that qualify these accused for bail.
How long do accused spend in jail on average before they are released on bail? Bail decisions unevenly record a series of dates as part of their brief narrative segment—the date of the incident, the date the FIR was lodged, and the date the arrest was made. Extracting this information, where available, yielded the average figures displayed in Table 11.
Average days from incident to FIR to arrest to bail

Table 11 Long description
The table summarizes average time gaps in days across case outcomes, including incident to FIR, FIR to arrest, and arrest to bail decision, along with how many documents support each average. For bail granted cases, there are 587 total documents; incident to FIR averages 15 days based on 138 documents, FIR to arrest averages 24 days based on 131 documents, and arrest to decision averages 27 days with a range from 0 to 440 based on 259 documents. For bail denied cases, there are 350 total documents; incident to FIR averages 16 days based on 85 documents, FIR to arrest averages 237 days based on 19 documents, and arrest to decision averages 83 days with a range from 0 to 1023 based on 60 documents. Incident-to-FIR timing is similar across outcomes, differing by about one day on average. The largest contrast is FIR to arrest, which is much longer for bail denied than for bail granted. Decision times after arrest are also longer on average for bail denied, and the range is wider. Interpret results cautiously because the number of documents varies by metric and is especially small for the bail denied FIR-to-arrest average.
Turning these figures into a narrative, in the average successful bail application in this archive, the FIR was lodged about 15 days after the original incident. It took a further three to four weeks to effect arrests. Those who got bail spent between zero days to 440 days in prison, with the average duration of undertrial incarceration being a little under a month.
On what grounds do courts justify their decision to either grant or deny bail? What factors are persuasive either way? While it is difficult to answer this with precision, Figure 15 plots the frequency and the interrelations of 12 statements recorded by judges while granting bail that I consider revelatory of their motives. While some of the statements aggregated here have the appearance of valid legal justifications for granting bail (‘The purpose of bail is to secure the accused’s presence of trial’), others may be classified as prejudice that nonetheless plays a significant role in the outcome. In a number of rape cases, for instance, the judge speculates that the ‘victim may have consented’ and in others, he employs a distinctly Indian judicial patois phrase—‘counter blast’—to conjecture that perhaps the victim filed a false charge against the accused due to a previous dispute (blast?) between them. Most frequently, judges felt that the risk that the accused might intimidate the victim or witnesses could be countered through the imposition of appropriate conditions upon the accused.
Reasons courts grant bail.

Figure 15 Long description
Court’s considerations in Granting Bail. The matrix dot plot displays 12 statements related to bail considerations, numbered from 1 to 12 on the left side. The top axis shows numbers from 1 to 48, representing individual bail applications. Each row corresponds to a specific statement and each column represents a bail application. Black circular markers indicate the presence of a statement in a particular application. Vertical stacks of black markers show statements that frequently co-occur across multiple applications. The statements are: 1. Victim consented, 2. Case filed as a 'Counter Blast', 3. Offence not punishable by death or life imprisonment, 4. Accused belongs to SC/ST, 5. Accused is a minor, 6. Delay in filing FIR, 7. Purpose of bail is securing accused's presence at trial, 8. Bail is the rule, jail is the exception, 9. Accused has no criminal record, 10. Accused is not a flight risk, 11. Investigation is complete, 12. Risk of witness intimidation mitigated through conditions. The tallest stack appears in column 48, indicating frequent co-occurrence of statements 1, 2, 3, 4, 5, 6, 7, 8, 9, 10, 11 and 12. Other columns show shorter stacks, indicating less frequent co-occurrence of these statements. The plot highlights patterns in judicial reasoning for granting bail, with certain statements appearing together more often.
It bears noting that in most cases—about 450 out of the 483 represented in Figure 15—the decision records either the fact that the public prosecutor opposed the bail, or the victim was given notice and had objected to the accused’s application either personally or through their lawyer.
What kind of conditions do courts impose when granting bail, and what amounts do they usually fix for bail? Section 437(3) of the CrPC requires courts to impose conditions when granting bail to anyone suspected of committing an offence punishable with imprisonment of seven years or more. These include the requirements of ‘regular attendance’, ‘not committing a similar offense’, and ‘not tampering with the evidence/threatening anyone from testifying’. Courts are also given the discretion to impose other conditions that they consider necessary ‘in the interests of justice’.Footnote 72 These requirements, however, do not apply to Sessions Courts or the High Court exercising their power to grant bail under Section 439 of the CrPC but are nevertheless treated as persuasive. Figure 16 tabulates the kinds of conditions imposed by courts in 574 bail applications—both anticipatory and regular.
Typical conditions attached to bail.

Figure 16 Long description
The title reads: Typical Conditions Attached to Bail. The figure contains two aligned sections: a frequency bar chart and a dot matrix showing condition intersections across bail applications. The total number of applications is stated as 574. The bar chart section shows frequency counts along the vertical axis, labeled in counts of applications. The horizontal axis represents distinct combination sets of bail conditions, numbered from 1 onward. The first column has the tallest bar, indicating the highest frequency among all sets. The bars drop steeply after the first few columns, forming a long declining tail across the remaining columns, with most columns toward the right showing very low counts near zero. The dot matrix section below the bar chart lists the following bail conditions along the vertical axis: Shall not enter jurisdiction where victim resides, Good behaviour, Shall not commit similar crime, Shall not travel beyond jurisdiction, Shall keep court informed of address or place of stay, Shall attend hearings and not be absent from court, Weekly or as directed attend at Police Station, Shall not tamper with evidence or pressure witnesses and Personal Bond with Surety. Each column in the dot matrix corresponds to a combination set. Filled dots appear in a column to indicate which conditions are present in that set. Vertical lines connect filled dots within the same column, showing which conditions appear together. The columns with the highest bar frequencies contain dots for Personal Bond with Surety and one or two additional conditions. Columns further along the horizontal axis show more complex combinations with multiple connected dots, though these occur less frequently.
In 89 of these cases, the maximum punishment faced by the accused was less than seven years, indicating that courts impose conditions in a wider range of cases than is strictly required by procedure. The labels in Figure 16 convey a sense of the kinds of restrictions courts have added to those mentioned in the section.
How much bail do the courts usually impose? In close to 70 per cent of the cases in this archive, spread evenly over the past decade, the court required applicants to tender a bond in the amount of Rs 15,000 (Table 12). In some cases, the amount nudged upwards to Rs 25,000 but this does not appear to be related to the severity of the offence. Neither have the courts seemed to adjust for inflation over the past decade. Although the CrPC requires courts to be mindful of the affordability of bail for the accused, the texts of the decisions do not indicate that courts inquire into this aspect at all while setting bail. An interesting feature of bail in this district is that it is almost entirely collected through a personal bond with a ‘solvent surety’. Cash bail was not levied in a single case. It is not clear whether or how courts assess the solvency of a surety or whether they ever collect on these bonds. They do, however, scrupulously cancel all bonds when they acquit.
Bail amounts by maximum sentence liable to be imposed

Table 12 Long description
The table cross-tabulates case counts by bail amount and dispute type against the maximum prison sentence category (3, 5, 7, 10, 100, and 1000 years), with overall totals. Across all bail levels, the largest sentence category is 7 years with 279 cases, followed by 5 years with 87 and 100 years with 145; 1000 years is rare with 9 cases, and the grand total is 570. Bail of 15,000 dominates with 393 cases overall, driven by Misc Violence at 241, Rape or Sexual Harassment at 87, and Child Sexual Abuse at 65. Within the 15,000 bail level, 7-year maximum sentences are most common across all three dispute types (161 Misc Violence, 48 Rape or Sexual Harassment, 23 Child Sexual Abuse). The next largest bail level is 25,000 with 100 cases, again concentrated in 7-year and 100-year categories, including 42 Misc Violence, 31 Child Sexual Abuse, and 27 Rape or Sexual Harassment. Higher bails are less frequent: 50,000 totals 25, 30,000 totals 20, 100,000 totals 7, and 200,000 appears only for Misc Violence with 2 cases at 10 years. Counts reflect frequency in the dataset and do not indicate severity or outcomes beyond the listed bail and maximum-sentence categories.
What other factors underly the courts’ rejection of bail applications? Figure 17 charts some of the common statements encountered in decisions rejecting bail.
Bail rejection reasons/factors.

Figure 17 Long description
Factors influencing Bail Rejection (235 applications)
The image combines a bar chart and a dot matrix plot to illustrate factors influencing bail rejection.
Bar Chart:
The bar chart represents the frequency of each factor contributing to bail rejection. The x-axis is labeled 'Factors' and the y-axis is labeled 'Number of Applications'. The dominant factor is 'No change in circumstances since previous bail application', with a count of 53 applications. Other significant factors include 'Delay in lodging First Information Report' with 19 applications and 'First Information Report shows offense as public order/heinous case' with 19 applications.
Dot Matrix Plot:
The dot matrix plot below the bar chart shows intersections of factors. Each row represents a specific factor and dots indicate the presence of that factor in the rejection decision. Lines connecting dots represent combinations of factors.
Factors listed include:
1. No change in circumstances since previous bail application
2. Delay in lodging First Information Report
3. First Information Report shows offense as public order/heinous case
4. First Information Report shows applicant anticipatory bail
5. First Information Report not annexed might influence witness
6. Offense is serious in nature
7. Investigation is at crucial stage
8. Serious First Information Report bar
9. Prosecution opposed bail; objections against the grant of bail
The plot effectively visualizes how multiple factors intersect to influence bail rejection decisions, with the most common intersections involving the dominant factor and other listed factors.
In most cases, the prosecutor or the complainant appeared and objected to the granting of bail. However, as we have seen, this is also a feature characteristic of successful bail applications, so this does not appear to have been the decisive element. In many anticipatory bail cases (90), the court appears to have discussed the embargo of Section 18A as a factor in its decision.
To what extent does the prospect of bail depend on the judge, the defence counsel, or the prosecutor assigned to the case? Are there particular judges who always grant bail and others who never do? Figures 18, 19 and 20 list the top 10 judges, defence attorneys, and prosecutors in terms of bail outcomes. These names were not extractable from the texts of all decisions, but I was still able to get enough data to convey overall patterns and introduce us to some of the more prominent among this district’s POA ‘cast’. Figure 18 displays the top 10 judges who ruled on bail decisions during the 11-year period covered by this archive.
Top 10 judges (years orders issued): bail outcomes.

Figure 18 Long description
The stacked horizontal bar graph compares bail outcomes for the top 10 judges over various years. The x-axis represents the number of bail orders, ranging from 0 to 270. The y-axis lists judges: SD Agrawal (2012–2013), KA Kothare (2014–2017), DL Talwalkar (2015–2017), MA Mohodand (2019–2023), SMIT SS Naik (2015–2018), SB Adhikari (2015–2021), IA Patangaskar (2016–2020), DS Shinde (2013–2019), PS Shinde (2012–2017), S Kanjay Paul (2011–2023). The legend includes Regular Bail Granted, Regular Bail Denied, Anticipatory Bail Granted and Anticipatory Bail Denied. S Kanjay Paul has the highest total orders with 124 Regular Bail Granted, 48 Regular Bail Denied, 38 Anticipatory Bail Granted and 42 Anticipatory Bail Denied. SB Adhikari follows with 55 Regular Bail Granted, 16 Regular Bail Denied, 15 Anticipatory Bail Granted and 28 Anticipatory Bail Denied. DS Shinde and PS Shinde have identical outcomes: 41 Regular Bail Granted, 17 Regular Bail Denied, 34 Anticipatory Bail Granted and 18 Anticipatory Bail Denied. SD Agrawal shows 5 Regular Bail Granted and 2 Regular Bail Denied, with no anticipatory bail outcomes. KA Kothare has 16 Regular Bail Granted and 3 Regular Bail Denied, with no anticipatory bail outcomes. DL Talwalkar shows 8 Regular Bail Granted and 1 Regular Bail Denied, with no anticipatory bail outcomes. MA Mohodand has 6 Regular Bail Granted and 1 Regular Bail Denied, with no anticipatory bail outcomes. SMIT SS Naik shows 23 Regular Bail Granted and 5 Regular Bail Denied, with no anticipatory bail outcomes. IA Patangaskar has 45 Regular Bail Granted, 37 Regular Bail Denied, 18 Anticipatory Bail Granted and 22 Anticipatory Bail Denied. The graph highlights S Kanjay Paul as having significantly more orders than other judges.
Top 10 defence attorneys (years active): bail outcomes.

Figure 19 Long description
The horizontal axis represents the number of cases, ranging from 0 to 70. The vertical axis lists the attorneys: Gopal Pandey, A S Bangar, S N Shirsath, Raviraj Shinde, S Sachin Shinde, D A Khandagle, K G Bhogale, A K Thakre, N S Ghanekar. The legend indicates four categories: regular bail granted, anticipatory bail granted, regular bail denied, anticipatory bail denied. Bars are horizontal and stacked, with different colors representing each category. Key values include: N S Ghanekar with 27 regular bails granted and 17 regular bails denied; D A Khandagle with 24 regular bails granted and 6 regular bails denied; Gopal Pandey with 10 regular bails granted and 25 regular bails denied. The graph highlights differences in bail outcomes among attorneys, showing variations in success rates.
Top 10 prosecutors by bail outcomes (n=345).

Figure 20 Long description
The stacked bar graph lists 10 prosecutors on the vertical axis: AB HVRHUL left parenthesis 2015 to 2016 right parenthesis; ST SHRISHA left parenthesis 2014 to 2021 right parenthesis; AP BAGUL left parenthesis 2021 to 2022 right parenthesis; BR LOV left parenthesis 2016 to 2019 right parenthesis; UP PANDI left parenthesis 2016 to 2018 right parenthesis; SB BANGAR left parenthesis 2016 to 2020 right parenthesis; AU AMOSU left parenthesis 2015 to 2020 right parenthesis; NS JASTAP left parenthesis 2015 to 2022 right parenthesis; MA AHER left parenthesis 2015 to 2021 right parenthesis; BW MAHED left parenthesis 2012 to 2023 right parenthesis; KN PAWAR left parenthesis 2021 to 2022 right parenthesis. The horizontal axis is labeled with tick marks at 0, 10, 20, 30, 40, 50, 60, 70 and 80. Each prosecutor has one horizontal stacked bar with four labeled segments. Legend labels: Regular Bail Granted; Anticipatory Bail Denied; Regular Bail Denied; Anticipatory Bail Granted. Values shown inside the bars: AB HVRHUL left parenthesis 2015 to 2016 right parenthesis: 3, 1, 0, 0. ST SHRISHA left parenthesis 2014 to 2021 right parenthesis: 3, 1, 0, 0. AP BAGUL left parenthesis 2021 to 2022 right parenthesis: 4, 0, 1, 0. BR LOV left parenthesis 2016 to 2019 right parenthesis: 5, 0, 0, 0. UP PANDI left parenthesis 2016 to 2018 right parenthesis: 8, 0, 7, 4. SB BANGAR left parenthesis 2016 to 2020 right parenthesis: 11, 7, 5, 6. AU AMOSU left parenthesis 2015 to 2020 right parenthesis: 15, 11, 7, 6. NS JASTAP left parenthesis 2015 to 2022 right parenthesis: 19, 0, 11, 9. MA AHER left parenthesis 2015 to 2021 right parenthesis: 21, 0, 11, 6. BW MAHED left parenthesis 2012 to 2023 right parenthesis: 26, 0, 17, 6. KN PAWAR left parenthesis 2021 to 2022 right parenthesis: 34, 0, 0, 0.
Continuous with the overall trends for bail applications, at the individual level, judges tend to grant more bail applications than they decline, with minor variations. A person accused under the POA would, say, prefer to avoid Judge Kothekar’s court and try his luck, if he can, in Judge Nair or Judge Gaidhani’s courts. It is very likely, however, that their application would be heard by Judge Sanjay Kulkarni, the special Sessions Judge in charge of Aurangabad’s POA ‘Special Court’. Even then, our applicant would have decent odds of being granted bail—Kulkarni has historically granted at least twice as many bail applications as he has rejected.
Does it help an arrested person’s chances to be represented by Aurangabad’s ace POA defence attorney? Close to 500 different lawyers appeared for the various accused in this archive, indicating that there is not a shortage of legal representation in the district. While there is evidence of some concentration and specialization—the top 40 lawyers appeared in 50 per cent of the cases—these numbers indicate a diverse criminal defence bar in the district. Figure 19 charts the success of the top ten defence counsel encountered in this archive. The most prolific among them, N. S. Ghanekar, only won a few more bail applications for his clients than he lost. Perhaps he is losing his touch? During the same period, his rival Kandagle did half the volume of bail applications, but with a much more satisfactory 27:6 win/loss record. He seems to have done much less anticipatory bail work though. Taking one’s business to Raviraj Shinde and Sachin Shinde does not seem to have paid off. While they share family names with two prominent sessions judges of the Aurangabad District Court, their win record is no better than that of Ghanekar.
Unsurprisingly, the prosecutors’ performance in this district is the chiral complement to the defence attorney’s performance—they lost more than they won. The decisions contained references to 29 different prosecutors who were specifically named. Figure 20 plots the top ten prosecutors by bail applications.
POA-accused who had N. S. Jagtap assigned as the prosecutor for their case might have favoured their odds. What losses the prosecutors suffered cannot be attributed to lack of enthusiasm—I could not find a single bail application in the entire archive in which the prosecutor failed to oppose the granting of bail. Most decisions record the following formula, almost verbatim: ‘The learned APP [Assistant Public Prosecutor] objected the application … submitted that the offence is serious and investigation is in the progress … there is possibility to pressurize the witnesses.’ One almost imagines the court clerk entering it into the draft of every decision without troubling the prosecutor to actually make the utterance.
Let me conclude this section with another anecdote from the archive that ties many of these details together and attests to the shocking arbitrariness and intensity of violence that Dalits face. One evening in November 2022 Bhagwan Kharat, a young Mahar man, was sent out on an errand by his mother to purchase cooking oil and did not return. He was discovered the following evening, unconscious, dumped in a shallow open-sewer at the outskirts of the village with severe burn injuries to his body.Footnote 73 Three villagers (at least some of whom were SC themselves) had abducted him the previous night and taken him to a field where he was thrust into a pit ‘6–7 feet deep’. There, he was disrobed and forced to consume alcohol. He was then ordered to dig deeper until he found ‘hidden wealth (Gupt Dhan)’. While this was going on, he was assaulted ‘with burning firewood’. It is unclear when or why the assault stopped, but there is some indication that his shrieks attracted villages and his assailants appears to have hastily dumped him in the sewer. During the week following the incident, ‘he was taken and shifted in the different hospitals for his treatment’, eventually leading to his right leg being amputated from the thigh-down. It was at this point on 7 December that his mother, ‘the informant’, gathered up the courage to lodge an FIR with the local police. A key witness was a speech-impaired person, Machindra Pawar, who had himself been nabbed by the trio earlier that evening but had somehow been able to flee their clutches and hide unseen in nearby fields. Once the investigation began, the accused lost no time in setting their legal defence in motion. On 20 December at least two of them filed applications for anticipatory bail. ‘The FIR [by the informant] was delayed,’ argued their lawyer A. M. Nimbalkar. One of the accused was a Scheduled Caste person themselves, and so the POA should not apply, he argued. These arguments and their applications were rejected by Judge Kulkarni, considering the severity of the allegations. ‘Applicant and accused both are residing in the same village,’ he noted, continuing, ‘Considering the financial status and overall background of the family of injured and accused, possibility to pressurize the prosecution witnesses also cannot be ruled out.’Footnote 74 Within the next two weeks, they were arrested and charged under Sections 326 of the IPC (‘Grievous hurt’) and 3(2)(v) of the POA Act—both carrying the possibility of life-imprisonment terms—as well as an offence under the Maharashtra Prevention and Eradication of Human Sacrifice and … Black Magic Act, 2013.Footnote 75 The accused then proceeded to file at least two more ‘regular bail’ applications in January and March 2023, including one through N. S. Ghanekar whom we just encountered in Figure 19, leading the table of criminal defence attorneys in the district. Each of these bail applications was rejected by the same judge. ‘Here it needs to (be) remember(ed),’ he wrote, ‘that, serious allegations of attempt to human scarifies for searching hidden wealth (Gupt Dhan) (have been) made against the accused.’ In each instance the ‘informant’ is reported to have appeared through counsel and opposed the granting of bail.Footnote 76
Not all bail applications, of course, show the judges in such favourable light as this anecdote. Their prejudices are usually more on display in cases that they choose to grant bail than when they reject it. However, it is important to bear in mind that they do possess the capacity to exhibit pragmatic fair-mindedness, as seen in this instance.
Having been released on bail, or kept incarcerated, how did the accused fare at trial? We examine this question in the next and final section of this article.
The trial
Over 400 PDFs in my archive were ‘judgments’—final decisions from the Sessions Court that either convict and pass sentence or acquit the accused. I was interested in analysing these documents, not just to extract their eventual outcomes with precision, but also in order to understand the pattern of punishments imposed, and the logic employed by courts in evaluating evidence. While scholarship has studied records of individual trial court decisions, a system-wide study of decision-making at this scale has never been attempted.
The statistics presented previously in this article have already prepared us for the broad contours of the account that follows. According to the metadata (Table 4 and Figure 1 above), acquittals exceed convictions in this district by a vast magnitude. Tables 13 and 14 confirm this trend and present outcomes of judgments drawn directly from the texts. Out of over 400 decisions in this archive, only 50 resulted in convictions. Table 13 presents the number of convictions and acquittals classified according to whether the victim was SC or ST. Table 14 classifies this data based both on the three categories of violence previously employed in this article—child sexual abuse, sexual harassment, and miscellaneous violence—and the maximum sentence that the charges potentially carried at the time these cases were brought to trial. These decisions were delivered between 2008–2023 and pertain to cases commenced between 2006–2023.
Judgment outcomes by target group

Table 13 Long description
The table reports case outcomes and their shares of the total, broken down by target group categories SC and ST. Out of 404 cases overall, 354 ended in acquittal and 50 ended in conviction. Within acquittals, SC accounts for 306 cases and ST for 48 cases. Within convictions, SC accounts for 37 cases and ST for 13 cases. Acquittals greatly outnumber convictions for both groups, and SC contributes the larger number of cases in both outcomes. Percent values are presented as shares of the overall total, so subgroup percentages do not represent within-group rates.
Trial outcomes by dispute type and maximum possible punishment

Table 14 Long description
The table breaks down trial outcomes into acquitted and convicted counts, with column percentages, by violence type and the maximum possible punishment. Overall, there are 405 cases: 355 acquittals and 50 convictions, so acquittals dominate across the dataset. Misc violence is the largest category with 231 total cases, including 214 acquittals and 17 convictions; within misc violence, the seven-year maximum punishment group is the biggest at 133 total cases. Child sexual abuse totals 65 cases, with convictions concentrated in life-maximum cases (12 convictions out of 46 total in that punishment level) and a single conviction in death-maximum cases. Rape or sexual harassment totals 109 cases, mostly in the five-year and seven-year maximum punishment groups (29 and 56 total cases), with relatively few convictions overall (16). Across categories, life-maximum cases show a higher share of convictions than shorter maximum punishments, while death-maximum cases are rare. Percentages are column-based, so they describe how each punishment level contributes to all acquittals or all convictions rather than conviction rates within a row.
Below we will take a closer look at the actual sentences passed, but focusing just on these overall figures, a few trends may be noted. On the face of it, these numbers indicate a greater density of conviction for sexual violence cases—roughly one conviction for every three child abuse cases that results in an acquittal, compared to a 1:13 ratio in cases of ‘Miscellaneous violence’. However, the overall picture remains bleak, especially if we add the number of ‘Pending’ cases in this archive to the acquittals. As indicated in Table 2 earlier in this article, between 100–400 cases are classified as ‘Pending’ before the Sessions Courts.Footnote 77
Poor conviction rates of this kind typically do little more than invite conjecture about ineffectual prosecution or prejudicial adjudication. The utility of having access to the texts of the judgments is that they allow us to go beyond conjecture and investigate the logic employed by courts in support of their decisions. What kinds of evidence do courts employ? Do prejudice and incompetence leave textual traces in the way evidence is evaluated?
Let me begin this analysis by remarking on the overwhelmingly testimonial character of evidence used in trials. In virtually every case, the court had to consider testimonial evidence presented exclusively by witnesses called by the prosecution. This is consistent with a criminal legal system in which the prosecution bears the veridical burden of proving the guilt of the accused ‘beyond reasonable doubt’. A total of about 2,800 witnesses testified for the prosecution before the Aurangabad courts in 395 cases (out of a total of 404 decisions) in which I was able to identify this information (Table 15). In most cases the prosecution’s witnesses would include the informant(s)/victim(s), the police officer conducting the investigation, and the stock ‘Panch’ witness.Footnote 78
Prosecution witnesses

Table 15 Long description
The table groups cases by the number of prosecution witnesses and reports how many cases fall in each witness range. Out of 395 total cases, the largest group has 5 to 8 witnesses with 208 cases. The next largest group has 1 to 4 witnesses with 131 cases. Far fewer cases have 9 to 12 witnesses with 50 cases. Very high witness counts are rare: 13 to 16 witnesses appear in 5 cases, and more than 17 witnesses appears in 1 case. Overall, case counts drop sharply as the number of witnesses increases beyond 8. The table summarizes counts by ranges, so it does not show the exact witness number within each range.
The documentary evidence was almost exclusively of three kinds: ‘seizure panchnamas’ recording the items seized from the accused, school certificates, and caste certificates of the victims, used to prove their ages and castes. In the absence of the caste certificate, the court usually draws an adverse inference about their caste, that is, it doubts their status as Dalits/Adivasis and does not attempt to satisfy itself by other means, as through testimony about these fairly obvious social facts. In addition, it is customary for one or more medical officers to testify where injuries are alleged. Frequently, material such as fibre collected from the scene is sent to the Forensic Science Laboratory (FSL) for ‘chemical analysis’. DNA evidence was used in only four cases involving sexual assault. Both in the case of medical and expert scientific testimony, the evidence proffered is treated by the court as any other type of testimony—useful only insofar as it corroborates or fails to match the exact wording of the allegations in the FIR. Scientific analysis and evidence certainly do not appear to have the function of establishing guilt or exonerating the accused conclusively as it does in popular ‘CSI’ TV shows. The testimony of medical/scientific officers is never challenged on scientific grounds, by confronting them with contradictory science. Instead, expert witnesses are merely quizzed, by defence counsel, about whether they can rule out any other possible explanations, however improbable. In the archive, one encounters the following sentence frequently: ‘in the cross-examination medical officer admits that all injuries may be possible due to fall on the ground’. Aggregating all the medical evidence in this archive, one cannot but surmise that Dalits and Adivasis must be the clumsiest, most accident-prone people on earth.
Compared to the loquacity of the prosecution, the defence is relatively taciturn—there were only six cases in which the defence put up any witnesses of their own. This does not mean that they remain mute through the trial. Section 313 of the CrPC empowers the court to ‘question’ the accused ‘generally on the case’ in order to elicit an explanation for ‘any circumstances appearing in the evidence against him’. These ‘statements’ given by the accused are not under oath, and the section specifically immunizes the accused against charges of perjury if they make false statements during this inquisition. Although the court’s inquisitorial power under this section is discretionary, it appears to be routinely exercised by criminal courts across India. In the present archive, 350 judgments specifically mention the ‘313 statement’ of the accused. In most cases, the content of their statement amounts to nothing more elaborate than a ‘total denial’ of their involvement, and a suggestion of ‘false implication’. Apart from this statement, the accused may also submit written statements to the court, but this is rare.
If the defence ‘speaks’, it is mainly through the device of the cross-examination of prosecution witnesses. In virtually every decision, the prosecution witnesses are described approvingly or disapprovingly by the judge as having ‘stood the test of cross-examination at the hands of defense counsel’ (for example, ‘This witness stood for test of cross examination to impeach his credibility’). Many judgments mention the ‘defense theory as put forward during cross-examination’—indicating that courts expect and interpret cross-examinations as having not merely a negative function of impeaching the witness on their specific assertions, but a positive function of establishing an alternate theory of the case. But even this appears not to be absolutely essential. The ‘defence-theory-as-disclosed-by-cross-examination’ is not so much a coherent alternative version of events advanced by the defence, as a matter of determined judicial divination and authorship—something the judge carefully looks for and invariably gives voice to.
Given the high acquittal rates in this branch of crime, Indian defence attorneys at the district level ought to rank among the world’s most talented cross-examiners. However, the character and the ends of cross-examination in the Aurangabad courts do not appear very sophisticated. A successful cross-examination is one in which the defence attorney is able to establish that the witness’s testimony in court exceeded or even trivially contradicted the contents of the FIR or if the contents of the medical report failed to match, verbatim, the allegations in the FIR. Like the pettiest of medieval scholasts, judges and defence counsel in Aurangabad’s trial courts treat the most trivial of differences and omissions between witnesses as significant. If two witnesses testify slightly differently to the combinations of slur words used against them, the judge treats the accusation as having failed entirely. The result is a criminal defence practice that does not have to trouble itself to produce any witnesses—the word ‘alibi’ does not occur in any decision. Cases can be won much more easily by harnessing the inevitability of linguistic iterability, by simply asking different prosecution witnesses to narrate the same episode and seizing on even the most trivial of differences to impeach their credibility.
There are only two technical evidentiary objections that the defence raises with any frequency in this archive. The first is ‘hearsay’. The word seems, however, to be invoked, both by the defence and the court, loosely, without a serious appreciation of the intricacies of the common-law bar against hearsay evidence. For example, consider the following statement appearing in one judgment: ‘Though PW-7 and PW-8 were hearsay witnesses but still the version deposed by them and as told to them by the prosecutrix was consistent in all material particulars and as already observed above, their cross-examination yielded no result in favour of the accused, that is to say that their testimony could not be rebutted.’Footnote 79
In general, the court dismisses any testimony by a witness who is not present at the scene as ‘hearsay’, without any awareness that the rule has exceptions depending on what fact exactly the statement is offered to support. Instead, as exemplified in the quotation above, the court has apparently invented an exception of its own that would set any evidentiary scholar’s teeth on edge: hearsay evidence may be admissible if the testimony offered is ‘consistent’ and has not been ‘rebutted’ by the prosecution during cross-examination!
Other than hearsay, defence counsel frequently challenge the admissibility of documentary evidence such as caste certificates and school-leaving certificates of the victim (used to establish their age). Mostly, this challenge involves nothing more intricate than suggesting that the copy adduced is a photocopy, and hence ought to be treated as entirely inadmissible.Footnote 80
Witnesses and victims turn ‘hostile’ far more frequently than they crumble under the pressure of cross-examination. In some decisions, prosecution witnesses are explicitly described as having turned ‘hostile’, which gives the prosecution, under Section 154 of the Indian Evidence Act, the right to cross-examine them. In other decisions, witnesses, frequently the informant or the complainant themselves, are described, less technically, as having ‘not supported’ the prosecution’s case. Maya’s sexual harassment case, discussed previously in this article exemplifies a typical situation where the ‘hostility’ of witnesses occasions a swift acquittal. The high incidence of witnesses turning hostile reflects poorly on the criminal justice system’s ability to guarantee the safety of witnesses.
The issue of the security of witnesses at trial was one that came up repeatedly during the parliamentary debates during the passage of the POA Bill in 1989. ‘But whole question is about the witnesses,’ announced Ram Ratan Ram, during the parliamentary debates. A Dalit himself, and member of the then ruling Congress Party, he was keenly aware that merely adding offences to the statutory books would not result in convictions. ‘The court will have to proceed according to the witnesses. The court cannot hang anybody simply on my saying, as a member of a Scheduled Caste or a Scheduled Tribe, that my daughter has been raped or my son has been murdered by this man or that man. The Court of Law cannot convict a person like that,’ he explained. ‘So, witness is necessary. Wherefrom will the witness come? … They still terrorise the people by saying that if they go to the court as witnesses, none will be allowed to remain in the village, all of them will be burnt or murdered … People are afraid. When my whole village gets burnt and when we will not survive, what will the court do?’Footnote 81 Many other members of Parliament echoed this concern, with some even calling for a specialized secret agency to investigate such crimes.Footnote 82 Although no witness protections were included in the Act originally passed in 1989, in 2015, Parliament attempted to do so through the insertion of a new section, 15A, that provided ‘Rights of victims and witnesses’. The new provision made it ‘the duty and responsibility’ of states to ‘to make arrangements for the protection of victims, their dependents, and witnesses against any kind of intimidation or coercion or inducement or violence or threats of violence’. The court overseeing the trial is required to ensure ‘complete protection to secure the ends of justice’ as well as ‘travelling and maintenance expenses’ to ‘a victim, his dependent, informant or witnesses’. It is not apparent from the text of the judgments in this archive that courts have taken this new responsibility seriously.
How frequently do witnesses turn hostile? And what other evidence do judges and judgments take into account? In Figure 21, I return to my favoured device, another upset plot, to display the frequency with which ‘hostile witnesses’ occur across all decisions in this archive, along with a few additional elements commonly encountered. Together, they give us an abstract model of the materials that courts typically work with in coming to a decision.
Frequent elements in a POA trial (upset plot).

Figure 21 Long description
Frequent Elements in a POA Trial, based on 404 decisions. The plot is an upset plot with three components: a horizontal bar chart showing set sizes, a vertical bar chart showing intersection sizes and a dot matrix showing which categories belong to each intersection. All bar values represent counts of decisions. The seven categories listed along the dot matrix rows are: Evidence sent to Chemical Analysis Division, Hostile witness testimony altered, Accused's defense is not aware, One or more Hostile Prosecution Witnesses, Accused claims to be falsely implicated, Crude Credit is unverified and No witness or evidence led by defense. In the dot matrix, filled dots connected by vertical lines indicate which categories are combined in each intersection column. The vertical intersection-size bars at the top show the count of decisions for each combination. The largest intersection, involving Evidence sent to Chemical Analysis Division combined with Hostile witness testimony altered, has a count of 38 decisions. The intersection involving Accused's defense is not aware combined with One or more Hostile Prosecution Witnesses shows a count of 28 decisions. The intersection involving Accused claims to be falsely implicated combined with One or more Hostile Prosecution Witnesses shows a count of 24 decisions. The intersection involving Crude Credit is unverified combined with One or more Hostile Prosecution Witnesses shows a count of 247 decisions. The intersection involving No witness or evidence led by defense shows a count of 387 decisions. The horizontal set-size bars extend leftward from each category row, indicating how frequently each category appears across all 404 decisions. Evidence sent to Chemical Analysis Division and One or more Hostile Prosecution Witnesses have the longest set-size bars, indicating the highest individual category frequencies.
As is clear, one or more hostile witnesses appear to feature in roughly 60 per cent of the decisions (247) in this archive. What kind of judgments does an epistemic framework of this kind, entirely reliant on testimony but starved of key voices at critical moments result in? Let me offer a typical example from the archive.
You cannot make this stuff up. Sometime in 2015, the caste residents of Bodhwad village assembled at a panchayat and decided to levy a fine of Rs 11,000 on Narayan Lathe, a ‘Boudh’ Dalit, for allegedly ‘abusing the Maratha community’ (the dominant ‘caste’ in the village and the state of Maharashtra), under the influence of liquor.Footnote 83 If he did not pay up, the panchayat declared, his family would be boycotted. Terrified, Lathe paid the amount into the local Hanuman temple’s coffers as directed and was even issued a receipt. Even caste atrocities, it seems, do not displace such minor rituals of fiscal prudence. ‘Due to this incident he was under tension,’ the judgment notes ‘his mental condition was not good.’ It took two weeks for his mental condition to recover. Gathering up courage he approached the police and appears to have been assured of their ‘support’. The investigating officer duly recorded his complaint and, during the course of investigation, ‘at the instance of the accused’, appears to have ‘seized fine amount of Rs. 11,000’ and the copy of the receipt-book from the temple. Only a copy of his caste certificate was collected from Lathe. No arrests appear to have been made, but the leader of the panchayat, Uttamrao Bhaurao Gavhane, was charged later that year with offences under Section 384 IPC—‘Extortion’ and 3(1)(x) of the POA Act—‘Intentional Insult and Intimidation of an SC/ST person in any place within public view’. At trial, the accused’s ‘313 statement’ was typically laconic: ‘due to politics false case filed against him’. The judgment further notes that ‘He has not examined himself on oath, nor adduced defence evidence, nor submitted additional written statement’. Seven witnesses were produced by the prosecution, of whom three appear, from their names, to be related to the accused—Vithal Sandu Gavhane, Saluba Trimbak Gavhane, and Suryabhan Ananda Gavhane. They turned hostile, as did the stock ‘Panch’ witness. The judge, P. S. Shinde, undertook to evaluate the remaining evidence ‘carefully and intelligently’. Going over Lathe’s testimony, he found it ‘not cogent, convincing, reliable and worthy of credit’. Lathe had omitted key details when reporting the crime to the police. The money had been paid into the temple by his father, he testified at trial, and not by himself as it seems to have appeared in his initial complaint. He admitted at trial that he had not stated to the police that ‘his mental condition was not good and he was present at house’. Mr. S. V. Ekbote, advocate for the accused, had extracted these important contradictions from Lathe during his impressive cross-examination. Lathe had admitted that there was an ongoing land-dispute between himself and the accused and that ‘on account of politics enmity is in between the persons by surname Gavhane’. These admissions and omissions by Lathe were complemented by prosecutorial lapses. The prosecution had led no evidence that the intimidation had occurred in ‘public view’. The investigating officer had not collected the receipt from Lathe. The temple’s receipt-book which had been seized by the investigating officer was not introduced into evidence at trial by the prosecution attorney. Consequently, it had not been proven that any amount had ever been collected from Lathe. The court labelled Lathe’s FIR an ‘afterthought’ and acquitted the accused of all charges. The accused next claimed a return of the amount of Rs 11,000 seized by the police. Perhaps this finally would have crossed some bounds of injustice that the judge was unwilling to participate in. Instead, he settles for illogic. He orders that ‘The amount of Rs.11,000/- deposited in court’ would be ‘credited to the government’ after the expiry of the period of appeal. Judicial illogic must also, it turns out, sedulously obey norms of fiscal prudence. The receipt books seized, but not produced as evidence, were ordered to be destroyed after the same period.
Not all judgments of acquittal are so determinedly obtuse, but I would like to suggest that this is their general character, to a greater or lesser degree. It takes an immense and determined amount of judicial incredulity to make a POA judge. Not anyone will do. More than just stating this, Figure 22 attempts to quantify this intuition, by gathering together some of the common things that courts say when they acquit—a POA-judge’s textual toolbox of incredulity. This is a modular apparatus that produces acquittals and innocence and makes such effortful conclusions appear inevitable.
Reasons courts offer when they acquit.

Figure 22 Long description
The chart is titled 'Reasons cited by courts to acquit.' It is structured in two parts. The first part is a horizontal bar chart. The y-axis lists individual reasons courts cite when acquitting. The x-axis label is not legible at this resolution and exact numeric values on bars are not fully readable. The bars are ranked from most to least frequent, with the longest bars at the top. The top-ranked reasons visible include 'Medical evidence does not match every detail of the FIR,' 'No proof of case occurrence,' 'No proof of the act at the time of the occurrence,' 'Victim consented or is a false complaint,' 'Judges consider witnesses interested or not independent,' 'Prosecution witnesses are interested or not independent,' 'Delay or more,' and 'Court likely Prosecution.' Additional reasons are listed below these but carry shorter bars. Exact bar values are not legible. The second part is a dot and line combination matrix positioned directly beneath the bar chart. Each column in the matrix corresponds to one combination of reasons. Filled dots indicate which reasons are present in that combination. Vertical lines connect dots within the same column, indicating that those reasons appear together. The number of columns decreases from left to right, consistent with the ranking above. Exact column totals or frequency counts in the matrix are not legible at this resolution.
If one accepts the postulate of this ‘toolbox’, how does one account for the slim volume of cases that resulted in convictions? Recall that 50 cases resulted in convictions— roughly one for every eight acquittals. Why was the court able to set aside its disbelief in these cases? In place of explanations, I can only offer patterns. Returning to the figures in Table 14, roughly two-thirds of convictions under the POA Act were for sexual offences, indicating, perhaps that the court treats such cases with relatively more seriousness than quotidian ‘Miscellaneous’ caste/tribe atrocities.
However, let me also suggest that convictions by themselves are not unambiguously satisfactory outcomes in POA cases. As Hirabai Pawar, a Bhil (ST) survivor of caste-violence, would learn, even convictions sometimes bear the appearance of an acquittal.Footnote 84 An elected ‘Zilla Parishad’ member, Pawar ran the government ‘Fair Price’ shop in her village, responsible for distributing subsidized grain and supplies. Ostensibly jealous of these attainments, one day, three villagers from the dominant ‘Maratha’ caste barged into her shop, demanding their own ‘ration cards’—identity cards used to access grains from Fair Price shops. These were documents that she neither possessed, nor had the power to issue. They accused her of ‘hiding the rationing cards of all the villagers’. When she directed them to make their inquiries at the appropriate Tahsil Office, they abused her tribal identity, robbed her of all her cash, amounting to Rs 5,050, slapped and beat her with sticks, forcibly shut down her shop, and threatened to kill her if she ever returned. Four years after the incident, the Sessions Court handed down its verdict convicting the trio, finding her evidence and the testimony of the medical officer credible—a rare win for the district’s public prosecutor. Accurately assessing the accused’s motives, the court recorded that they were ‘not pleased for her membership in the Zilla Parishad and also earning in the village by running a Fair Price Shop’. This belief by the court turned out to be the only justice Hirabai received in court. Although the accused had been charged with offences, including robbery and criminal intimidation, which would have attracted prison terms of between seven to 10 years, the court sidestepped these charges, convicting them, instead, on the comparatively minor charge of ‘voluntarily causing hurt’. The exact stick that was used to assault her, and the amount of Rs 5,050 had never been recovered from the accused, the court noted, and so proceeded to declare the charges of assault and robbery not proven. Even upon the reduced charges, the accused theoretically faced punishments extending to two years’ imprisonment. This was, however, not what was handed down. The court took heed of defence counsel’s plea that ‘lenient view be taken’. ‘To deter the accused for adopting hoodlum against the complainant’, the court finally held, it would ‘meet the end of criminal justice’ if the accused were punished with ‘imprisonment till rising the court’ and fines of Rs 3,000 each. The ‘convicts’ were able to walk out of court without a minute spent in jail, or even troubling to return the money that they had robbed.
Although this did not occur in every case, two other cases in this archive levied the same ‘punishment’. In the remaining convictions, there is a pattern of awarding sentences much lower than the statutory maximum. Table 16 takes a closer look at the convictions in this archive and compares the sentences levied by the court against the maximum possible sentence that the original charges would have resulted in. Most rape accused received punishments of less than three years in prison. Of the accused in 18 cases who faced life terms, not a single one ended up being awarded that sentence. In 16 cases where the maximum term was seven years, the court ordered reduced sentences of under three years.
Possible maximum sentences/ sentence passed by the court

Table 16 Long description
The table cross-tabulates prison terms awarded by the court against the maximum possible sentence under the sections charged, split into Child Sexual Abuse, Rape or Sexual Harassment, and Miscellaneous Violence. Overall there are 50 cases, with maximum possible sentences most often being life imprisonment at 18 cases, followed by 7 years at 16 cases; death is listed as the maximum in 6 cases. Child Sexual Abuse totals 17 cases, mostly charged with a life maximum at 13 cases, and awards cluster at 10 years with 5 cases and 7 years with 3 cases; one case received a life term. Rape or Sexual Harassment totals 16 cases, most often charged with a 7-year maximum at 8 cases and a 5-year maximum at 4 cases; awards are mainly shorter terms such as 1 year with 4 cases and 6 months with 3 cases, with one life sentence. Miscellaneous Violence totals 17 cases and includes the most severe maxima, with death as the maximum in 4 cases and life as the maximum in 2 cases; awards include 4 life terms and several short sentences such as “till rising of court” with 3 cases. Totals by maximum possible sentence are 7 cases with a 5-year maximum, 16 with a 7-year maximum, 3 with a 10-year maximum, 18 with a life maximum, and 6 with a death maximum. Blank cells indicate no cases for that combination, and the table does not explain why awarded terms may be lower than the maximum possible under the charged sections.
Let me add to these figures some details that are not captured in the table. It bears noting that the court exclusively ordered ‘rigorous’ imprisonment for all prison terms in all cases.Footnote 85 Of a total of 222 persons tried in these 50 cases, only 116 were convicted, with the remaining receiving full acquittals. In roughly a third of all convictions, the accused were Muslim. This appears somewhat disproportionate considering the overall number of Muslim accused in this archive (see Figure 10).
Importantly, and somewhat strikingly, in only 15 cases were accused convicted for offences under the POA Act. The remaining convictions were for offences under the Indian Penal Code—the accused were specifically acquitted of all POA charges in those cases. Typically, the charge dismissed would be under Section 3(1)(x)/(3(1)(r) or 3(1)(s), relating to caste abuse and intimidation. There is not a single case in this archive in which the accused were convicted of uttering a caste slur. This is striking because in virtually every case, the judge scrupulously reproduces the specific caste abuse allegedly hurled by the accused. These are odious, humiliating, violent utterances. If the accused were in fact innocent of these charges, then for the past 20 years, over a thousand Dalits and Adivasis in Aurangabad have engaged in an elaborate ruse to abuse themselves through the unlikely medium of a court judgment in a false case.
Most offences under the IPC are punishable with both prison terms and a fine. In 46 cases in this archive, fines were added to the prison terms. If the fines are not paid, the convict is ordered to undergo a further minor term of ‘simple’ imprisonment ranging from a few weeks to a few months. Section 357 of the CrPC also permits courts to order ‘compensation’ to be paid by the convict to the victim. This discretionary power was used in only 10 cases in this archive.
Table 17 charts the total fines levied in each case against the compensation amounts awarded, if any. As is clear, in most cases, convicts paid under Rs 10,000 in total fines, although in one case, this was accompanied by an order for compensation of Rs 100,000.
Fine and compensation amounts

Table 17 Long description
The table cross-tabulates ranges of total fines with the amount of compensation awarded, including a no-compensation category and row and column totals. Across all fine ranges there are 46 cases, and 36 of them received no compensation. The largest group is fines from 1,000 to 10,999 with 31 cases, including 27 with no compensation and one case each with compensation of 4,000, 5,000, 10,000, and 100,000. Fines from 11,000 to 20,999 total 7 cases, with 4 receiving no compensation, 2 receiving 10,000, and 1 receiving 20,000. Fines from 21,000 to 30,999 total 6 cases, with 3 receiving no compensation, 2 receiving 10,000, and 1 receiving 30,000. The remaining fine ranges shown have only one case each, and each of those cases received no compensation. Overall, compensation amounts are rare and scattered, with 10,000 appearing most often among compensated cases.
Is there a pattern to how individual judges ruled? Figure 23 charts the top 10 judges by acquittals and convictions. Predictably, they issue more acquittals than convictions, with some judges, such as P. S. Shinde, Kachare, and R. R. Gandhi, being more one-sided than others.
Top 10 judges by acquittals and convictions.

Figure 23 Long description
The horizontal bar graph plotted between Judge vs Acquitted. The y axis label reads Judge. The x axis label reads Acquitted and Convicted Decisions. The x axis ranges from 0 to 100 with tick labels at 0, 10, 20, 30, 40, 50, 60, 70, 80, 90, 100. A legend shows Acquitted and Convicted. Y axis categories from top to bottom: R R GANDHI (2010-2011), R RAVESH KADAM (2010-2012), A O KOTHARE (2015-2017), S B GADHAVI (2017-2021), MA MOHIDDIN (2021-2023), R B PIPER (2014-2017), S B KACHARE (2011-2015), DS SHINDE (2013-2022), S D SONAV KULKARNI (2015-2021), P S SHINDE (2015-2022). Values shown on the bars: R R GANDHI (2010-2011): Acquitted 7, Convicted 0. R RAVESH KADAM (2010-2012): Acquitted 7, Convicted 0. A O KOTHARE (2015-2017): Acquitted 9, Convicted 1. S B GADHAVI (2017-2021): Acquitted 15, Convicted 2. MA MOHIDDIN (2021-2023): Acquitted 19, Convicted 2. R B PIPER (2014-2017): Acquitted 30, Convicted 1. S B KACHARE (2011-2015): Acquitted 33, Convicted 10. DS SHINDE (2013-2022): Acquitted 37, Convicted 30. S D SONAV KULKARNI (2015-2021): Acquitted 67, Convicted 17. P S SHINDE (2015-2022): Acquitted 90, Convicted 27.
Table 18 provides details of the sentences passed by these judges. Due to their low overall conviction rates, it is difficult to find a pattern. The two judges with the highest conviction rates—D. S. Shinde and Kulkarni—very rarely convicted the accused for sentences longer than seven years. Despite high numbers of acquittals issued by P. S. Shinde, four of his seven convictions were for terms in excess of 10 years.
Judge-wise sentences

Table 18 Long description
The table lists how many sentences each judge issued, grouped by sentence length categories from till rising of court through life sentence, with a total count per judge. Across all judges there are 50 sentences in total. The most frequent category overall is 1 to 3 years with 15 sentences, followed by less than 1 year with 7 and 3 years with 6; 10 years also has 6, and life sentences total 6. K Sanjay Kulkarni has the highest total with 17 sentences, including 9 in the 1 to 3 years category and the only entries shown for 20 years and life sentence in that row. DS Shinde is next with 10 total, spread across till rising of court, less than 1 year, 1 to 3 years, 3 years, and 10 years. PS Shinde has 7 total and accounts for 3 of the 6 life sentences. Several judges have only 1 or 2 total sentences recorded, so comparisons among those judges are limited by small counts.
Let me draw this section to a close by offering one last example from the archive—a ‘conviction’ which both exemplifies the random, quotidian, life-threatening violence that Dalits and Adivasis face, and further illustrates the ambivalence of classifying such convictions as ‘justice’. In September 2013, Bhaskar Sarode, a Mahar (SC) farmer, president of his taluka’s Panther Republican Party (RPI), attended a district-wide conference of the party in Aurangabad with six of his friends. On their way back, in a jeep decked with the blue flag symbolizing the RPI, the group stopped for refreshments at a minor truck-stop intersection called ‘Farshi Phata’. As the judge tells it: ‘They reached at Farshi Phata at about 7.45 p.m. and parked their jeep in front of Hotel Shivshakti, but took the snakes and tea in another hotel [Hotel Jai Malhar] which is situated in front side of Hotel Shivshakti.’ ‘When, after taking the tea and snakes, they reached near their jeep’, they were accosted by ‘the owners of Hotel Shivshakti, Hotel Jay Yogeshwar and Hotel Navnath’, who appeared furious that ‘they had parked the vehicle in front of their hotel and went to take the tea in another hotel’. Very likely, the ostentatious display of blue flags on the victim’s vehicle identified the travellers by caste and added to the hotel-owners’ fury.
Figure 24 is a Google Street View screenshot of the same road in 2025 with key locations marked. Although Hotel Shivshakti does not seem to exist any more, the other hotels named in the decision are marked. Notably, this is a public road where both everyone and no-one has the right to park wherever they find the space. Also of note, every establishment on the entire street prominently displays the orange flag of the Shiv Sena Party, signifying ‘Maratha’ caste pride. The symbolism of the blue RPI flag would have stood out on such a street.
Google Street View screenshot of ‘Farshi Phata’, Mahal Kinhola, Phulambri, Aurangabad, February 2025.

Figure 24 Long description
A Google Street View panorama captured on a road in Aurangabad, looking ahead along the road. Three hotel locations are marked with labeled arrows pointing to their respective buildings. Hotel Navnath is on the left side of the road, closer to the viewer. Hotel Taj Jagdamba is also on the left side, further ahead along the road than Hotel Navnath. Hotel Jai Malhar is on the right side of the road. All three hotels are positioned along the same road, with two on the left and one on the right. The road has a central divider with a directional sign visible. A small inset map is present in the bottom left corner of the image.
Returning to the narrative of this case, the ‘questioning’ by the hotel owners soon turned to abuse and violence. ‘You lowly Mahars,’ they are reported to have said. ‘Wandering around with your blue flags, and blue on your foreheads. How dare you park in front of us and eat somewhere else.’ Then, turning to the assembled mob, they said ‘We don’t spare the lives of Mahars who enter our village! Come, let us finish them off’ (‘āpalya gāṁvāta yēvūn āpalyālā hē mahārḍē lōk bōlatāt yāṁnā jivaṁt sōḍāycē nāhī’).
Four of Bhaskar Sarode’s associates were able to flee before the beatings began. However, he and one of his friends were lynched by the mob that had brought ‘sticks and iron rods from their hotels’. At some point, the mob was joined by ‘15 to 20 unknown villagers’ who ‘approached there and assaulted to them by means of fists and kicks’. During the lynching, Sarode was robbed of his money. At some point a police jeep arrived and was able to rescue the two and take them to a local hospital who made careful note of the ‘contusions’ and ‘abrasions’ on both their bodies.
Pursuant to their FIR, six villagers were arrested, but were released on bail three weeks later. They were charged and tried for a range of offences including Attempt to Murder (Section 307 IPC) and Causing grievous hurt (Section 326 IPC), carrying possible prison terms of 10 years and life respectively, as well as under Section 3(1)(x) of the POA Act—intentional insult and intimidation. In addition, they were charged with a series of lesser offences—simple hurt, etc.— carrying lower sentences. Although the trial opened three months after the incident, it took nearly nine years to complete and involved 126 hearing dates. The accused were represented by N. S. Ghanekar, whom we have already encountered previously in this article. Judge Sanjay Kulkarni was satisfied that ‘After facing searching and elaborate cross-examination on the point of assault, the prosecution witnesses stuck-up to their version.’ However, this ‘sticking up’ by the victims was only sufficient to establish all the minor charges, for which the accused were awarded prison terms of one year each (minus the three weeks they spent during the initial arrest).
Significantly, the judge framed this as a parking and not a caste dispute: ‘dispute was arisen when prosecution witnesses parked their jeep in front of the hotel of accused but took tea and snakes in another hotel’, he wrote. It was, he said an ‘altercation’ that advanced ‘into assault at the spur of movement’. As a consequence, he ruled this not to be a caste-atrocity: ‘it cannot inferred that, accused assaulted to the witnesses only because they belong to the Scheduled Caste’.
Were the accused guilty of caste-abuse towards the victims? The FIR lodged by the victims on the night of the incident had clearly mentioned the specific words of caste abuse uttered by the accused. However, at trial, one of the prosecution witnesses, Deelip Ingale, deposed that the accused uttered a slightly different set of slurs which only contained threats to severely beat up, but not kill, the victims.Footnote 86 The judge seized on these trivial differences to acquit the accused entirely of charges relating to caste intimidation and insult. The accused ‘had no knowledge about the caste of witnesses’, he wrote. Besides, it was ‘unlikely to happen’, he wrote, ‘that all accused would have uttered those abusive words in the name of caste in chorus’.
Conclusion
By way of conclusion, I would like to offer a brisk summary of some key insights from this article. In doing so, I will also incorporate elements of the decision in Gangawane’s case with which I opened this article.
1) Slow, unreliable justice for Dalits, Adivasis. For victims of SC/ST atrocities in Aurangabad, justice continues to be slow and unreliable. Out of 1,400+ incidents over 20 years, trials were completed in only a quarter of the cases lodged, with only 50 incidents resulting in convictions. Trials last between four and five years on average, with many taking even longer (Table 2). Gangawane’s case, with which we opened the article, ended with all 18 accused being acquitted in a trial that lasted eight years. In addition, the large number of cases that are currently still described as ‘Pending’ began proceedings on an average of four to six years ago. While the usual frame within which judicial delay has been studied in India has been as a denial of justice to the accused, in this specific branch of law, I have suggested that we view such delays as functional acquittals. Delays of this kind are not reflections of the complexity of a case. In most cases the prosecution produces fewer than eight witnesses (Table 15) and very rarely over 12, while the defence seldom produces any witnesses at all. At any rate, in over half the cases (Figure 21), by the time the trial is completed at least one, if not several, witnesses have turned hostile. For a court to be unable to find time to examine eight witnesses for more than six years ought to suggest other explanations than the mere ‘complexity’ of the case.
2) Sexual violence is a large component of caste violence. Over 40 per cent of POA cases involve sexual violence against women (Figure 6). By itself, this statistic is somewhat unsurprising. The tactical use of sexual violence as an element of how caste operates has been robustly theorized by gender and caste scholars. However, folded into this category is an emergent sub-set of cases involving teenage runaway couples whose attempt to transgress caste and communal lines is sought to be halted by their parents (Figure 7). Although it is difficult to put exact numbers to this phenomenon, bringing these cases under the ambit of the POA represents an attempt to use atrocity law to uphold caste boundaries.
3) Bail is easy and cheap. To those accused who apply for it, bail seems to be both easy to obtain and inexpensive to post. In Aurangabad, the courts usually only require personal bonds of Rs 15,000, backed by sureties, regardless of the severity of the offence (Table 12). For advocates of bail reform in India, this is good news. There is no evidence that courts have an unhealthy appetite to keep the accused in jail. It is unclear if the court has any mechanism to verify the solvency of the sureties or if they ever do enforce bonds where the accused fails to appear in court. In addition to requiring the accused to remain on good behaviour, and desist from influencing witnesses, courts have innovated in the kinds of conditions they attach to bail (Figure 16). Anticipatory bail continues to be granted by the Aurangabad courts even after the 2018 amendments, although this appears to be relatively infrequent.
4) Testimonial nature of scientific evidence. Although scientific evidence in the form of medical and chemical evidence is offered at trial, I have argued in this article that the character of this evidence is overwhelmingly testimonial rather than technical. What I mean by this is usefully exemplified by the treatment of medical evidence at Gangawane’s trial. Gangawane had testified that he had been ‘assaulted by sickle on his forehead’. His brother testified that he had been assaulted ‘by sickle and iron rods’ as a result of which ‘he sustained head injury and became unconscious’. A third brother had testified to receiving a ‘blow of sickle on his head and back’. All three were taken by the police to the local hospital for treatment after which they were transported to a hospital in Aurangabad city. At trial the medical officer of the rural hospital testified that he had issued a medical certificate about the lacerations he had seen on their bodies. The court dismissed his testimony since he had not brought the hospital register to confirm that the victims had been admitted. Likewise, the doctor at the Aurangabad city hospital had testified that he had diagnosed one of the victims with a ‘linear undisplaced fracture’ on his head based on a CT scan. His testimony was deemed ‘not worthy of credit’ since his medical certificate had classified the injuries as ‘grievous’, whereas his assistant had issued another certificate classifying the injury as ‘simple’.Footnote 87 In effect, the court ruled that none of the victims had been injured at all. Importantly, in neither case was the accuracy of the medical observation sought to be questioned medically or scientifically. The use to which medical evidence is put is to either corroborate or contradict the contents of the FIR or the testimony of witnesses, not to positively assign blame or exonerate.
5) The judicial apparatus of disbelief. Acquittals exceed convictions in POA cases by an order of almost 8:1 (Table 13). While this ought to be concerning, this seems to accord with the generally poor conviction rates of the courts state-wide across most categories of violent crime (Figure 2) which rarely exceed 15 per cent. Nevertheless, caste-prejudice among judges, police, and prosecutors cannot be ruled out as causal factors for this poor outcome in POA cases. As Sunil Nagare had bragged to Gangawane, ‘Polīs sṭeśan tahasīlmadhe āmchī oḷakh āhe, Dillīparyant āmche nete āhet, śāsan āmche kāhī vākaḍe karaṇār nāhī’—‘The entire Police force and Tehsil Officers are in our contact. We have our people in politics all the way up to Delhi. The State won’t touch us.’ I would like to suggest that in addition to this implicit official casteism that runs ‘all the way up to Delhi’, the accused may also locally depend on a robust ‘apparatus of disbelief’ that judges employ in adjudicating crime, across the board. This apparatus consists of a set of statements, judicial dispositions, evidentiary mischaracterizations, prosecutorial lapses, and predictable accidents (witnesses turning hostile) that together systematically devalues prosecutorial evidence (Figure 22) and produces acquittals through its normal operation. One visible sign of this toolkit in operation is the fact, noted in ‘The trial’ above, that across this archive, defence counsel’s role appears to be entirely confined to cross-examining prosecution witnesses in order to elicit the most trivial of inconsistencies. They do not appear to have the need to present their own witnesses or evidence—even in fairly extreme, egregious cases of violence. Instead, they seem able to rely, with confidence, upon the operation of the judicial apparatus of disbelief to secure an acquittal.
Aspects of the way in which Gangawane’s case resulted in an acquittal bear out this insight. Eleven witnesses, including Gangawane, were deposed at trial. The defence counsel in this case was ‘Atrocity Specialist’ N. S. Ghanekar (Figure 19) who cross-examined each of them and confronted them with a topographical survey map of the village on which they were asked to identify their field exactly. They were also asked to explain why the police had not recorded several key details of their complaint in the FIR. ‘The Police also not recorded that the witness Deepak Dabhade sustained head injury. The Police also not recorded that the witnesses Deepak and Uttam became unconscious.’ The judge characterized their inability to answer both questions as evidence of their unreliability (‘not worthy of credit’). The account of one witness, described by the judge as an ‘eye-witness’ was dismissed as ‘hearsay’.Footnote 88
6) Acquittals disguised as convictions. Even within the slim volume of cases that resulted in convictions, I have argued that these are ambiguous outcomes when we consider the judicial reasoning employed, and the kinds of sentences handed to accused. Across the board, there is a pattern of judges imposing significantly lower sentences than the offences charged would allow. This is achieved by judges acquitting the accused of the more severe charges faced by them, and convicting them instead of only the minor charges. In other words, even when SC/ST victims are believed, their evidence will only go so far. In these partial-acquittals, judges activate the same apparatus of disbelief that I mentioned in the previous point. Convictions then, at best, represent ambiguous affirmations of the truth of the victim’s allegations. Even once the graver charges are dropped, courts tend to punish on the lower end of the plausible spectrum. In three cases out of 50 convictions, the accused were sentenced to imprisonment ‘Till the rising of the Court’.
7) It wasn’t an atrocity. A related sentencing pattern is the reluctance of judges to convict for any charges under the POA Act. In only 15 out of the 50 convictions in this archive were accused convicted for any offence under the POA Act. The lengths to which courts will go to dismiss charges under the POA Act is exemplified in Gangawane’s case. The use of a specific caste-slur by his assailants, and the fact that they had been embroiled in a land dispute for some years (and so knew each other well), was regarded as insufficient proof by the judge that they knew his caste. Even otherwise, the judge ruled, ‘there is no evidence whether the abuse heard by any member of the public’. Gangawane’s 18 assailants had mostly been from the same family,Footnote 89 so the court concluded, in other words, that this was not a ‘public’ mob.
Let me close this article by offering some reflections on the picture of the law that I have tried to construct in this article. This article draws inspiration from Wittgenstein in its impulse to study law as a practical activity, as a ‘form of life’,Footnote 90 with the added wager, inspired by Derrida, that this ‘life’ may validly be studied entirely through texts—grammatologically.Footnote 91 Within such an approach, understanding law depends less on the careful study of nostrums in legal textbooks and appellate judgments, than on acquiring adeptness with the ways in which language is deployed in courts, occasionally in opposition to statutory and textbook language.
While not unconcerned with assessing the fidelity with which the letter and intent of the POA is reflected in decisions rendered by the Aurangabad courts, this article attempts to go beyond and discover rules specific to adjudicating atrocity crimes in Aurangabad. Statutory texts have as much utility in explaining law as textbooks of grammar when faced with the variety of actual modes of expression and understanding—that is to say that they are not entirely useless. Statutory laws are not like arithmetic formulas which determine in advance the right answer to every combination of problems. Instead, we need to make room for the troubling notion that what constitutes a rule in any ‘life-world’, like the Aurangabad criminal courts, is the collective use of the rule—established by custom, agreement. Espousing this orientation has its costs—it requires us to abandon any expectation of statutory law and appellate decisions as a kind of comprehensive calculus which would allow us to predict correct and incorrect outcomes. Even worse, it makes it difficult to assign individual blame. When a judge grants anticipatory bail in derogation from the express wording of the law, our ordinary temptation is to treat this as an intentional private departure from the statute by a casteist judge. While this is certainly an available mode of interpretation, I would like to open up an additional possibility—that this departure from statutory law obeys a rule of a different kind, which could only be established through a gradual, uncoordinated agreement within the local legal life-world of Aurangabad, but guides action no less reliably. This is a rule whose content could be stated as follows: ‘occasional departures from 18A (and any statutory rules for that matter) do not derogate from the judicial activity of “applying the law’’’. This is not to justify such ‘agreements’ but merely to direct some attention to the system that produces such departures as normal. To live in a constitutional state is, of course, to expect not to be subject to ‘agreements’ of this kind.
Acknowledgements
I would like to thank Mayur Suresh and Sruti Chaganti for their critical feedback on early drafts of this article. Thanks to my friends Matthew John, Lawrence Liang, Rajiv Kadambi, Brajesh Ranjan, Aseem Prakash, Mohsin Khan, Pranav Sharma, and Prakhar Sharma for their ongoing support. I am grateful to Professors Sudipta Kaviraj, Partha Chatterjee, and Timothy Mitchell for their encouragement. Finally, I thank the editors, the anonymous reviewers as well as the editorial team at Modern Asian Studies for their insight and guidance.
Competing interests
The author declares none.

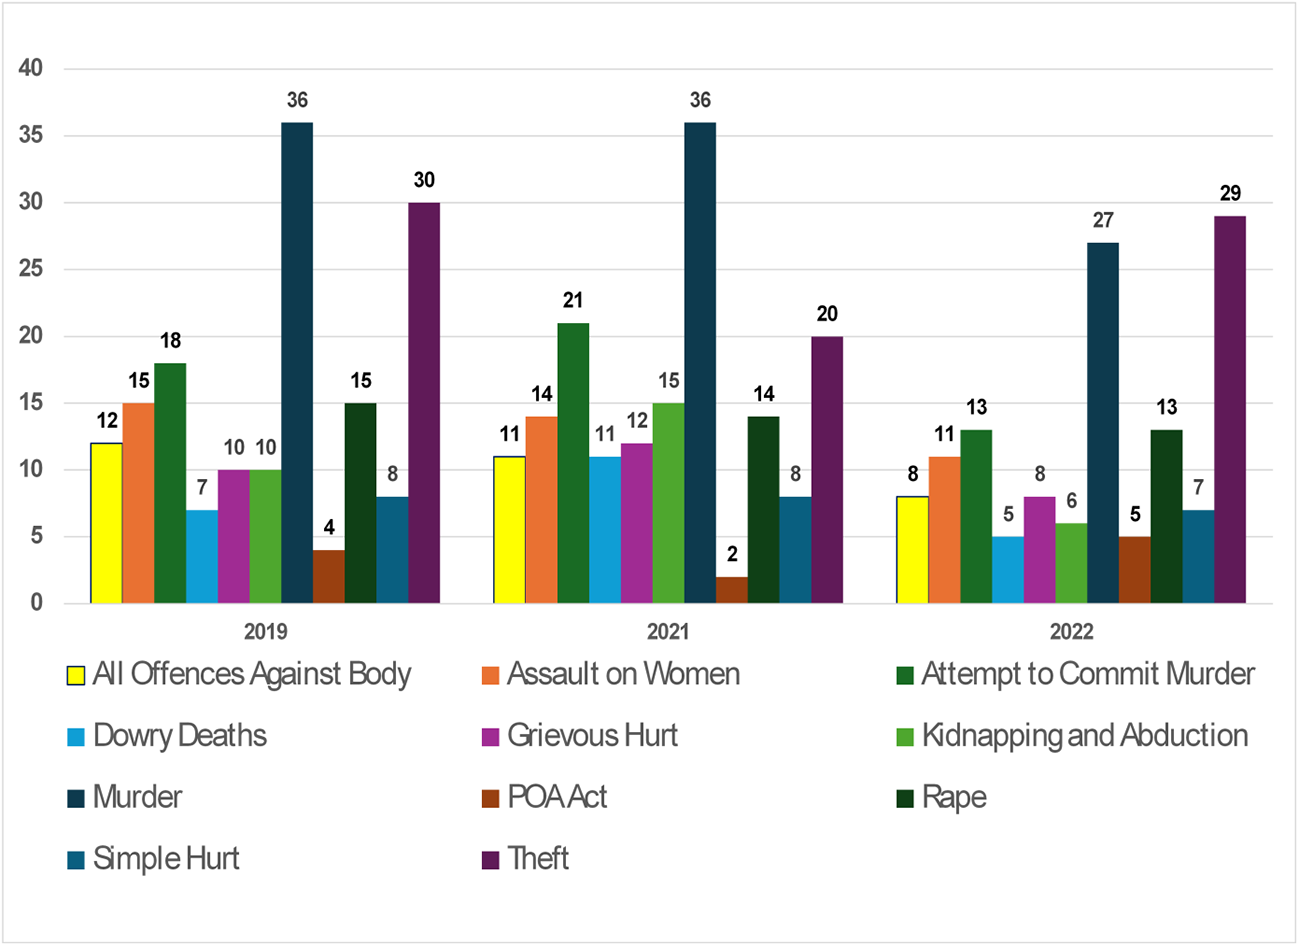
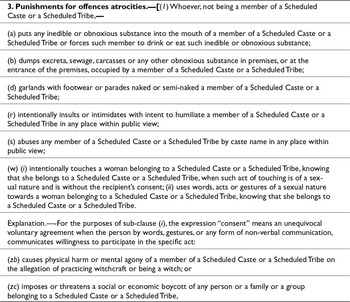
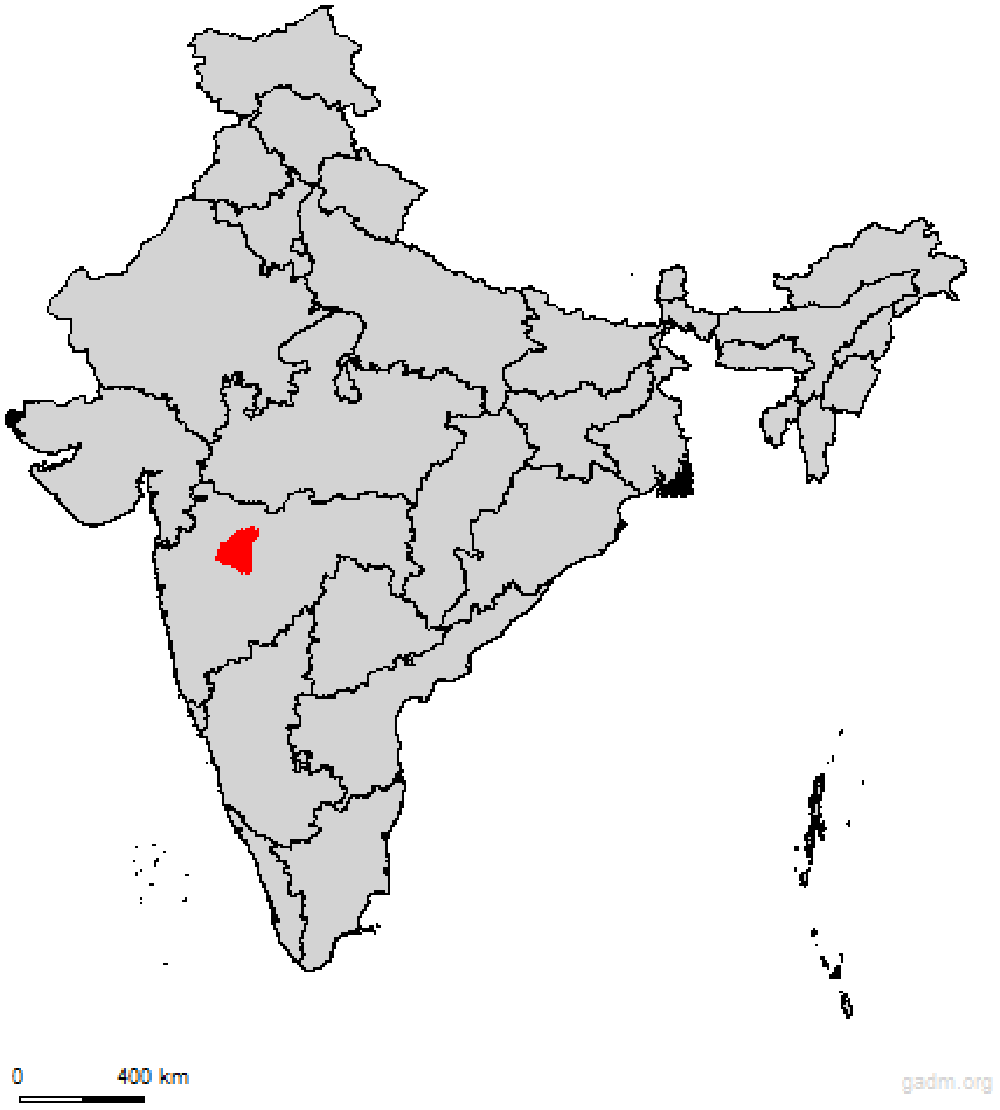
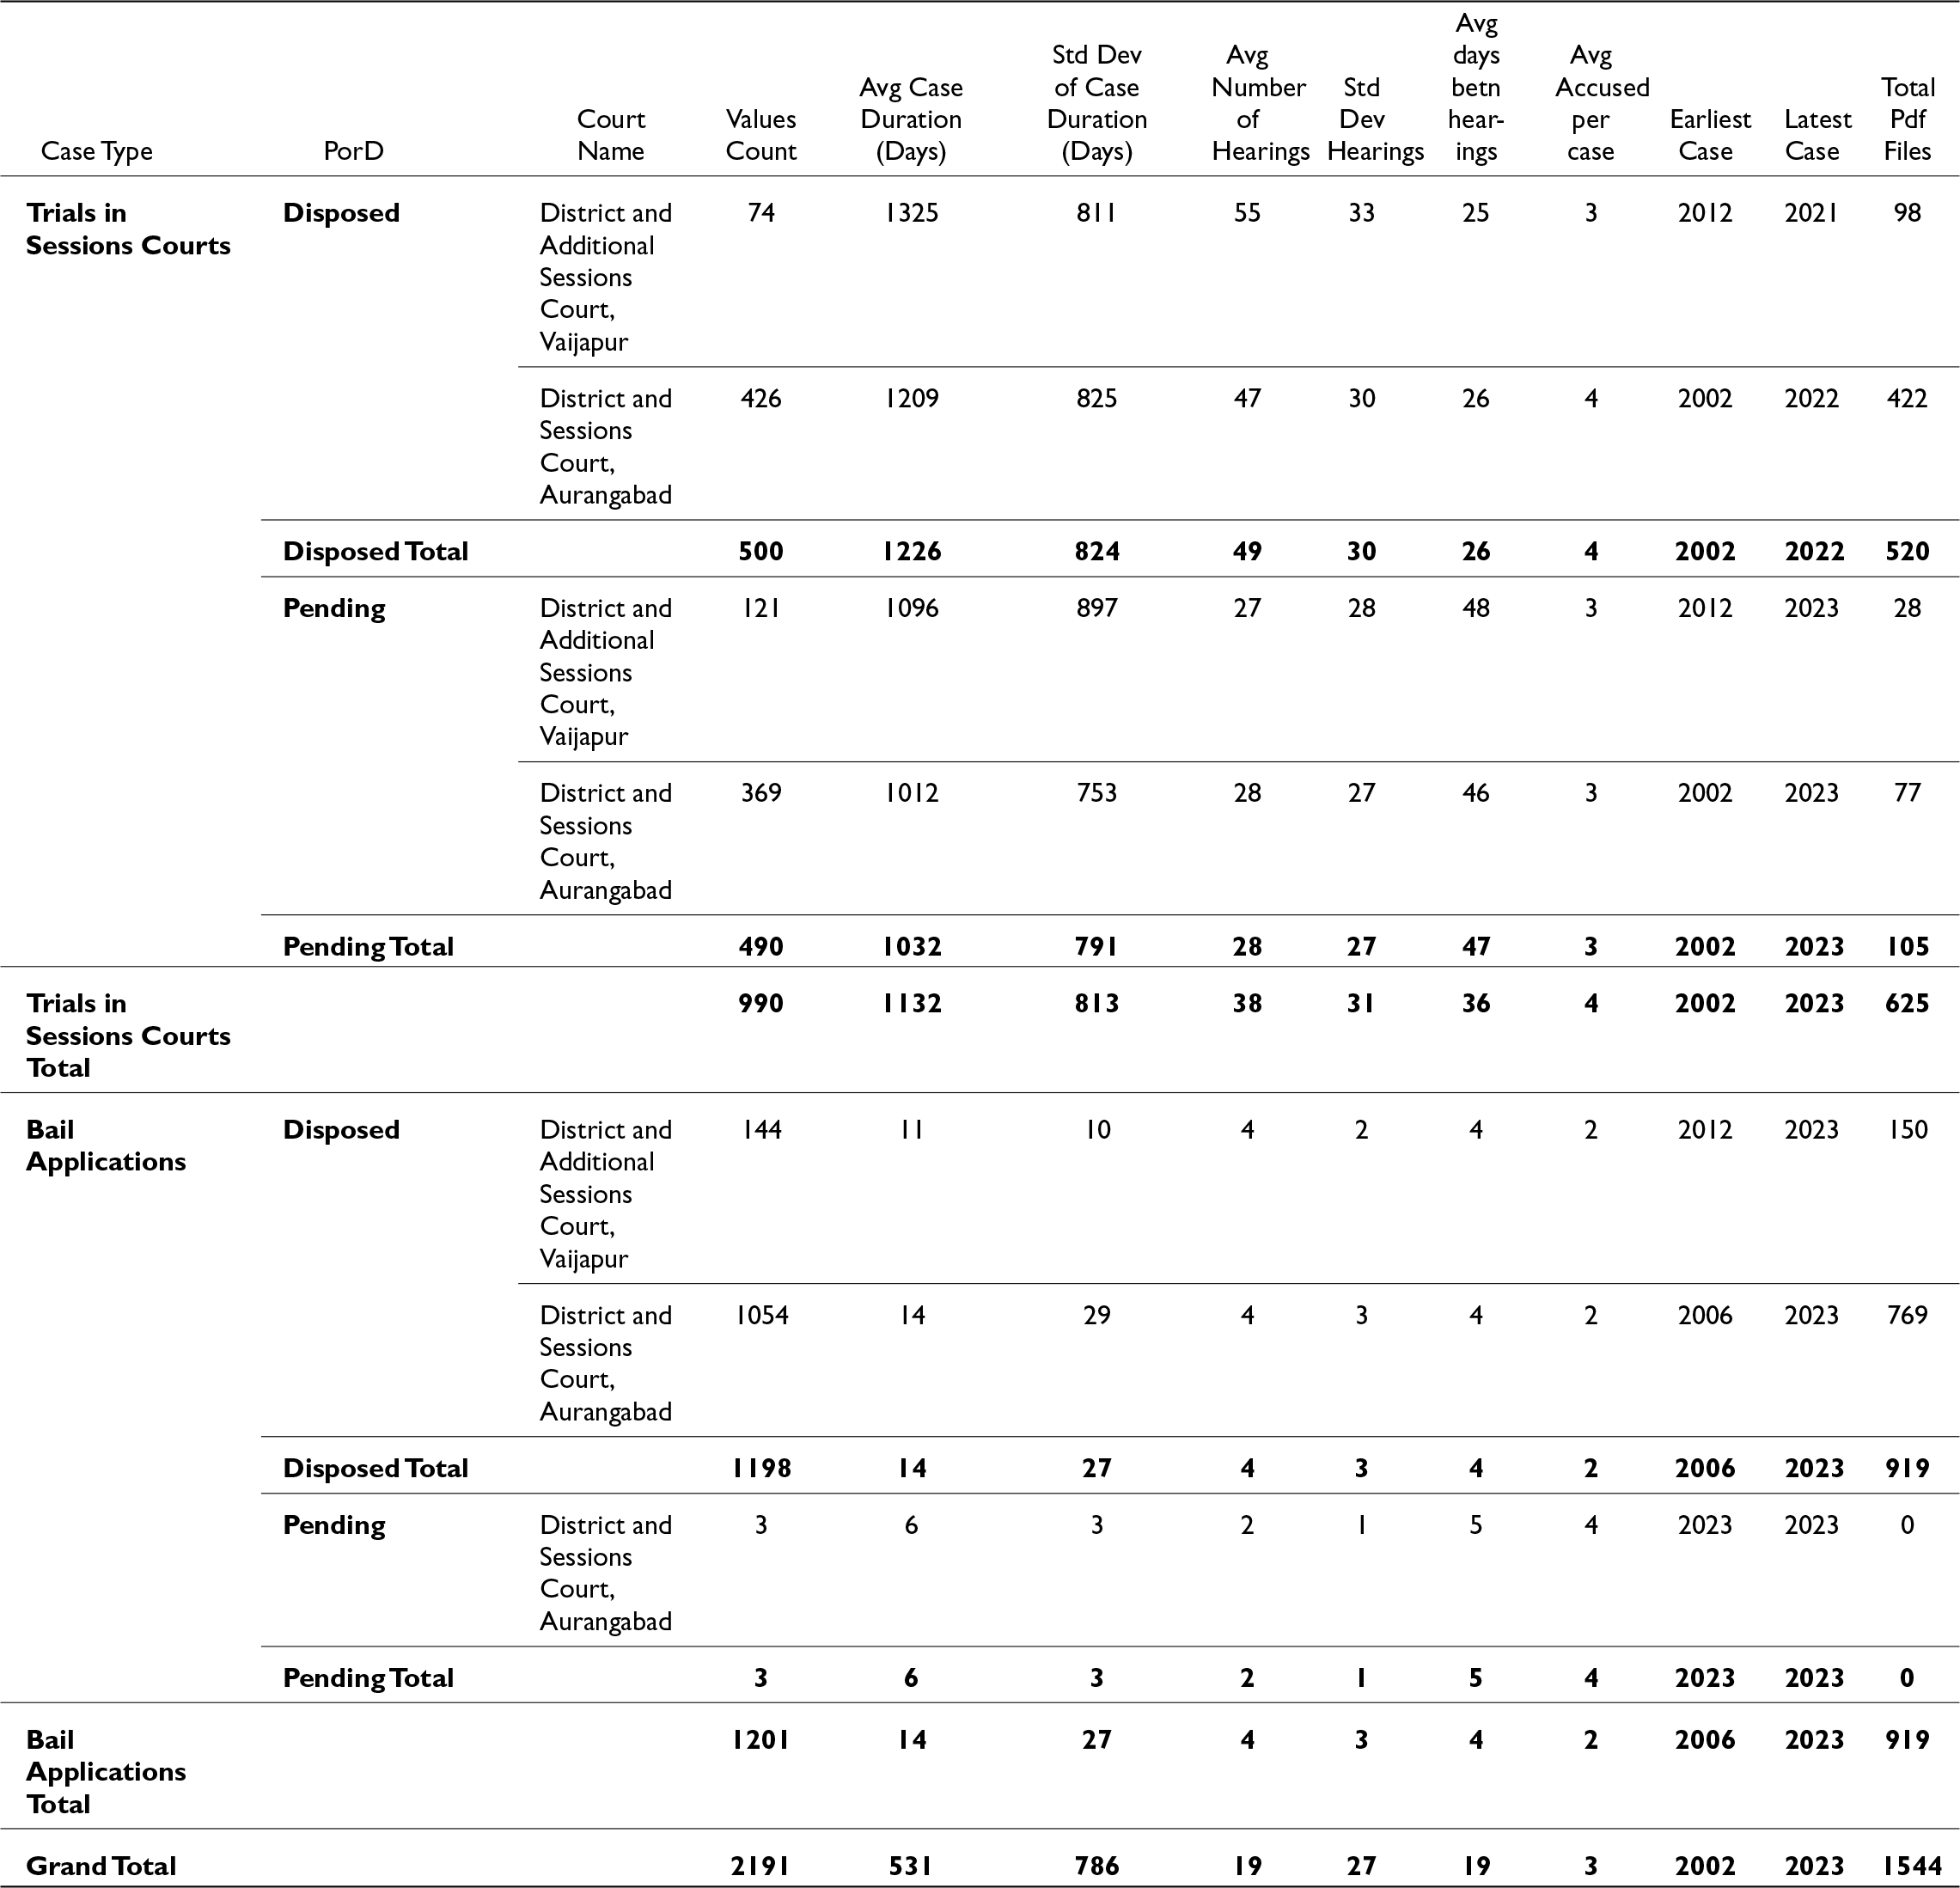
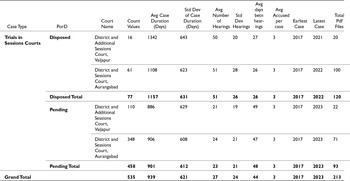
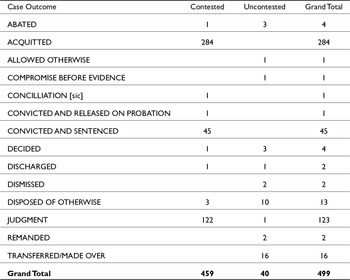
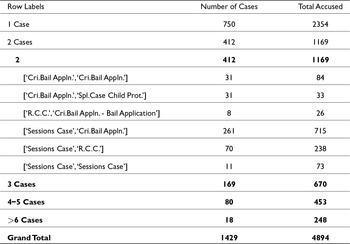
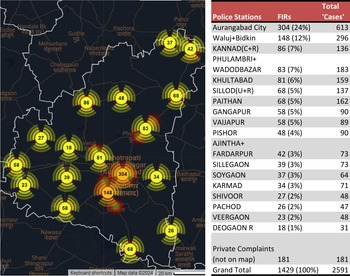

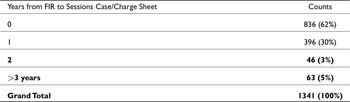
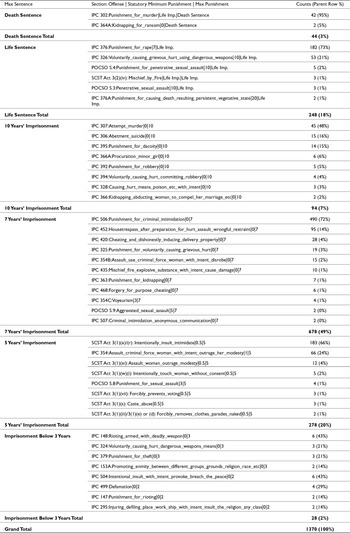
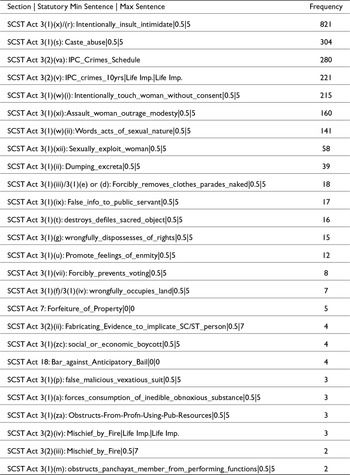
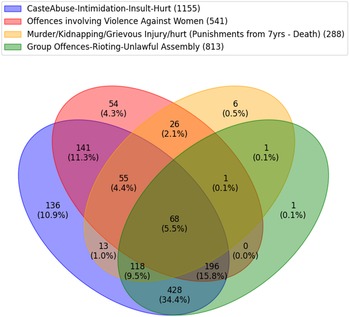
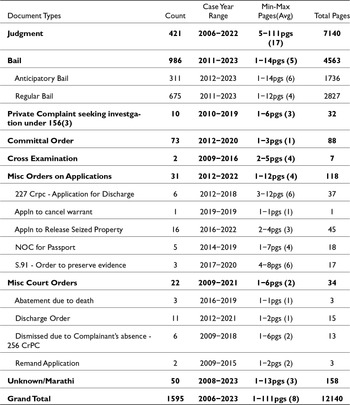

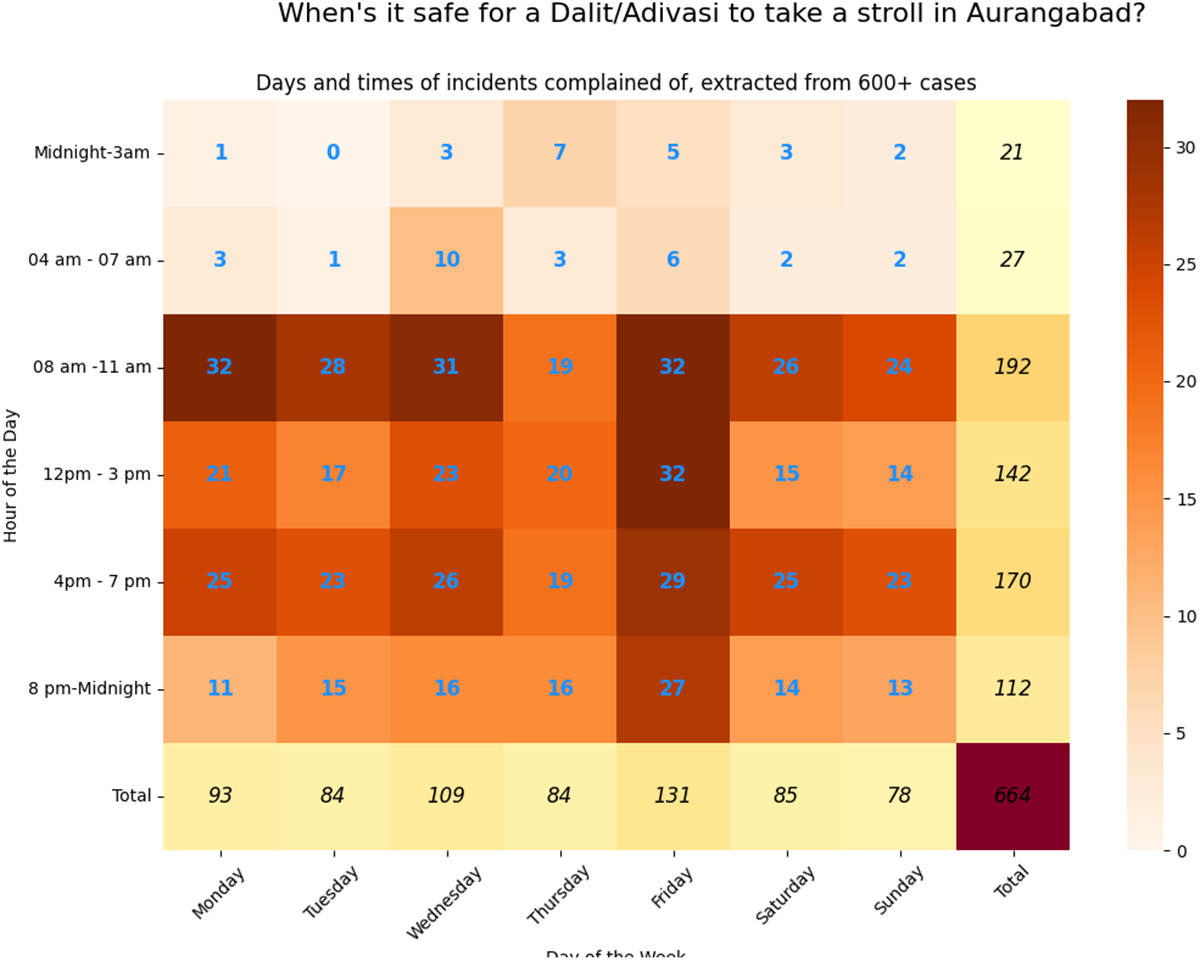


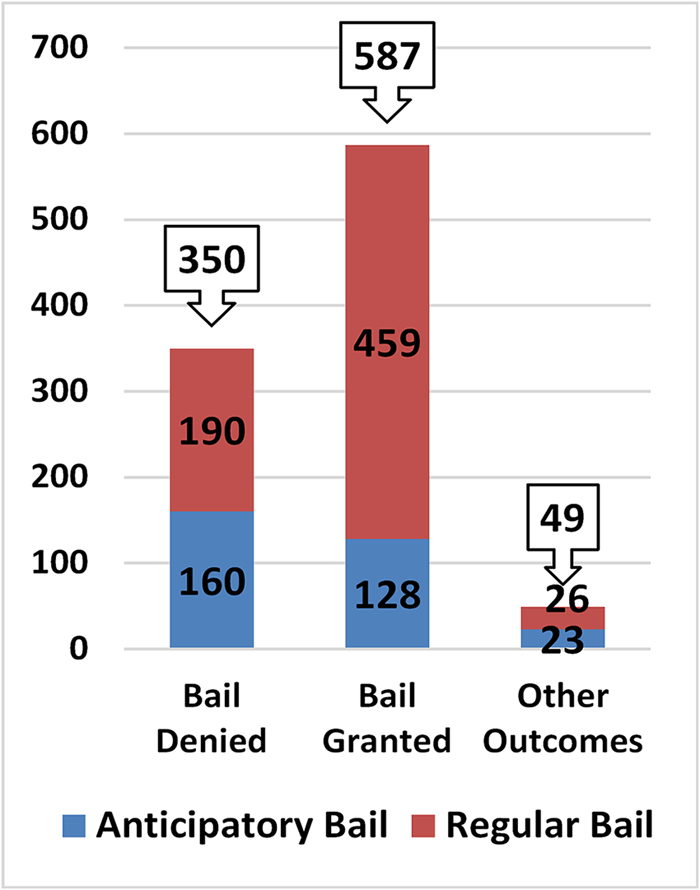
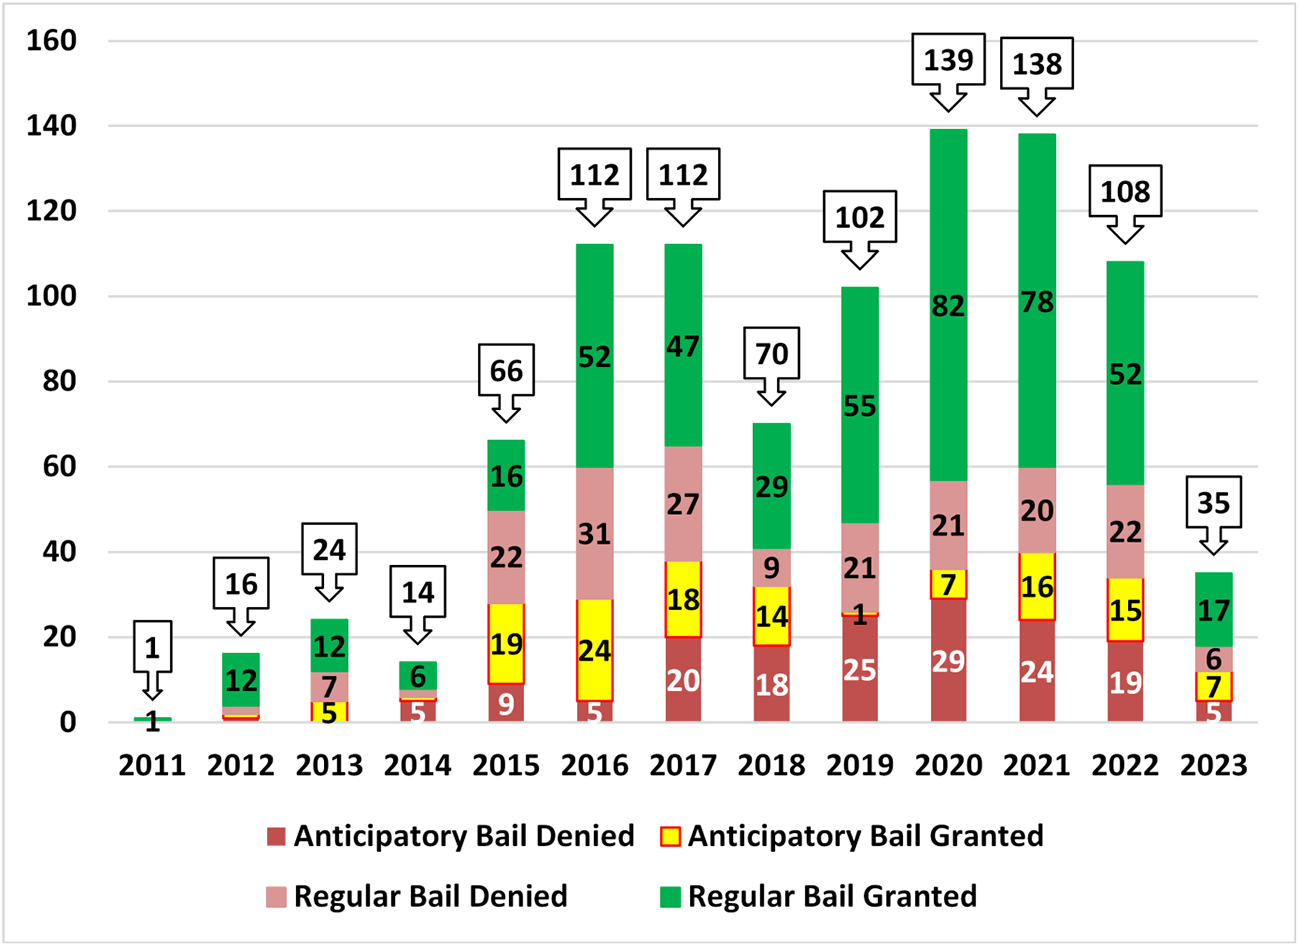
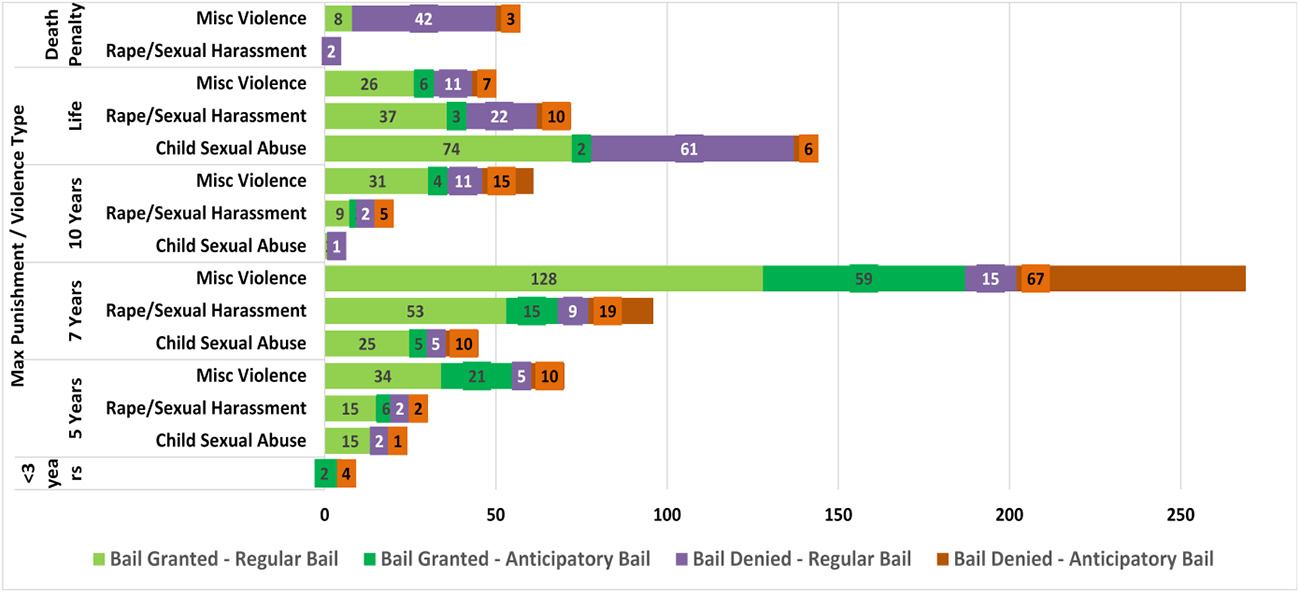



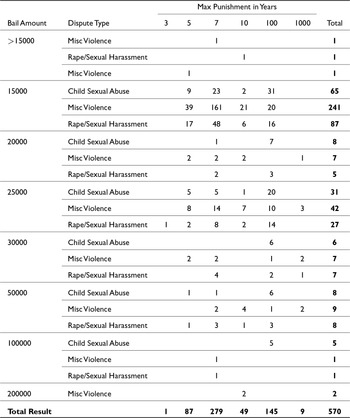

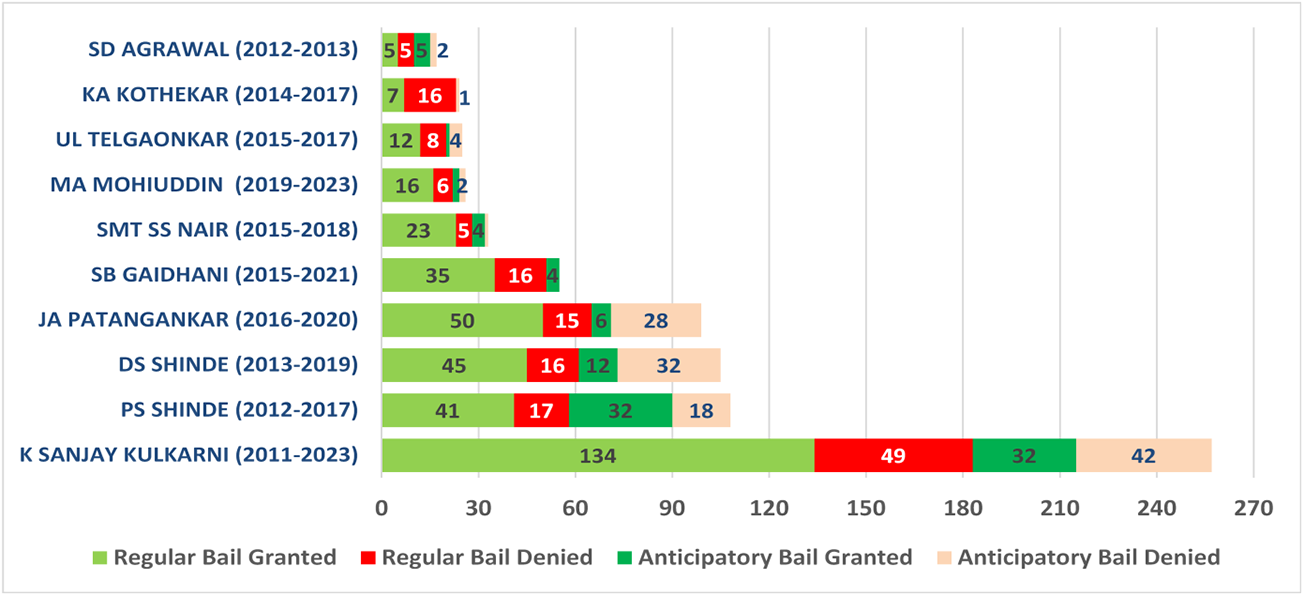
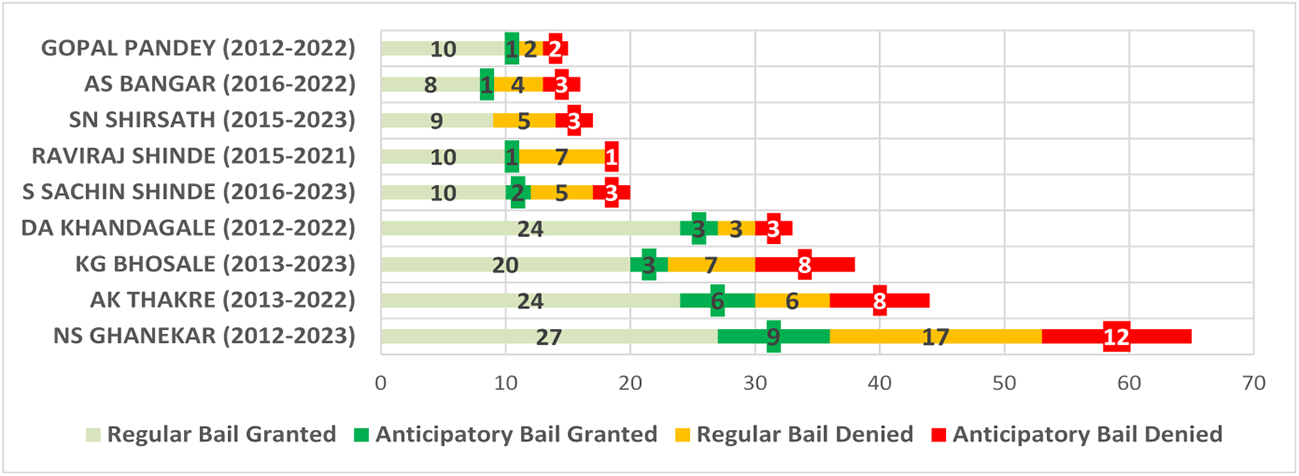
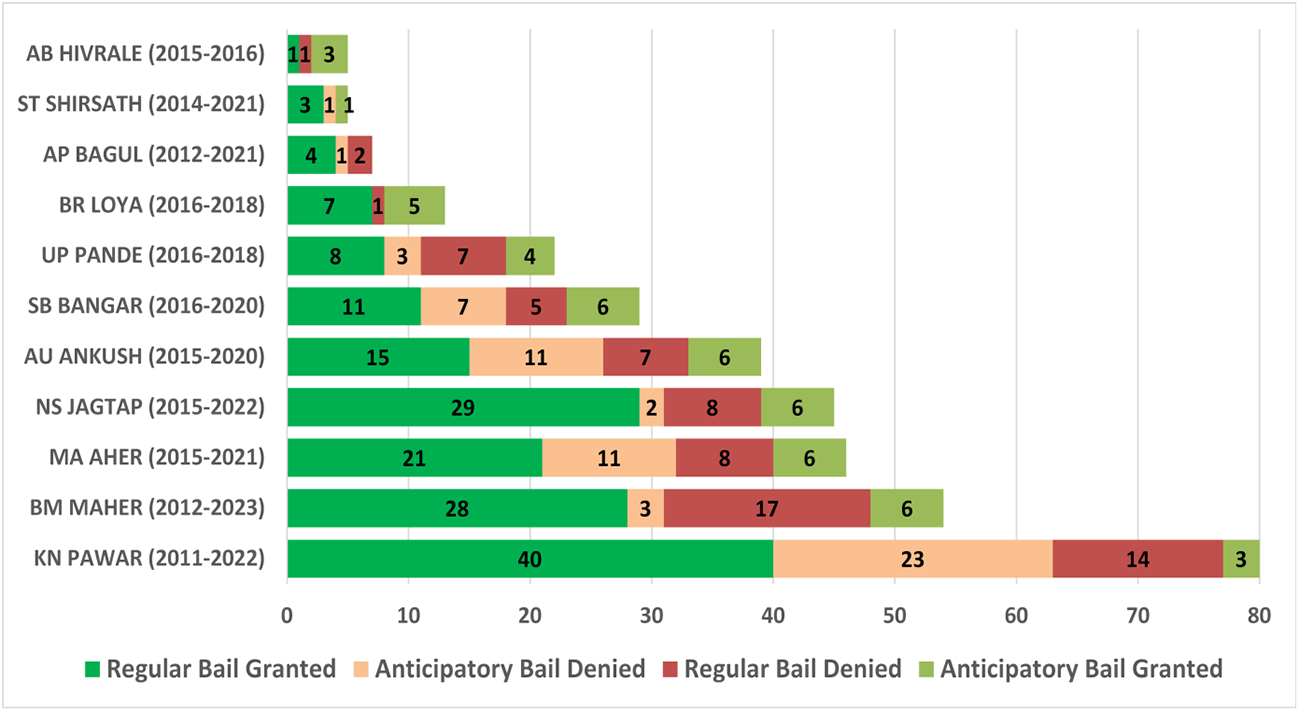
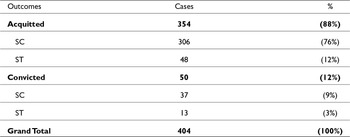
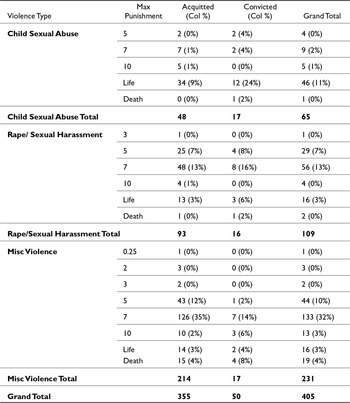
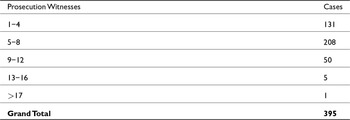


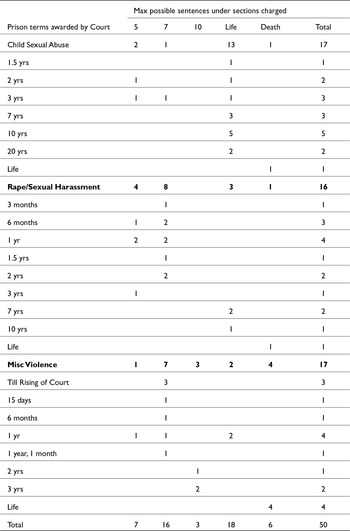

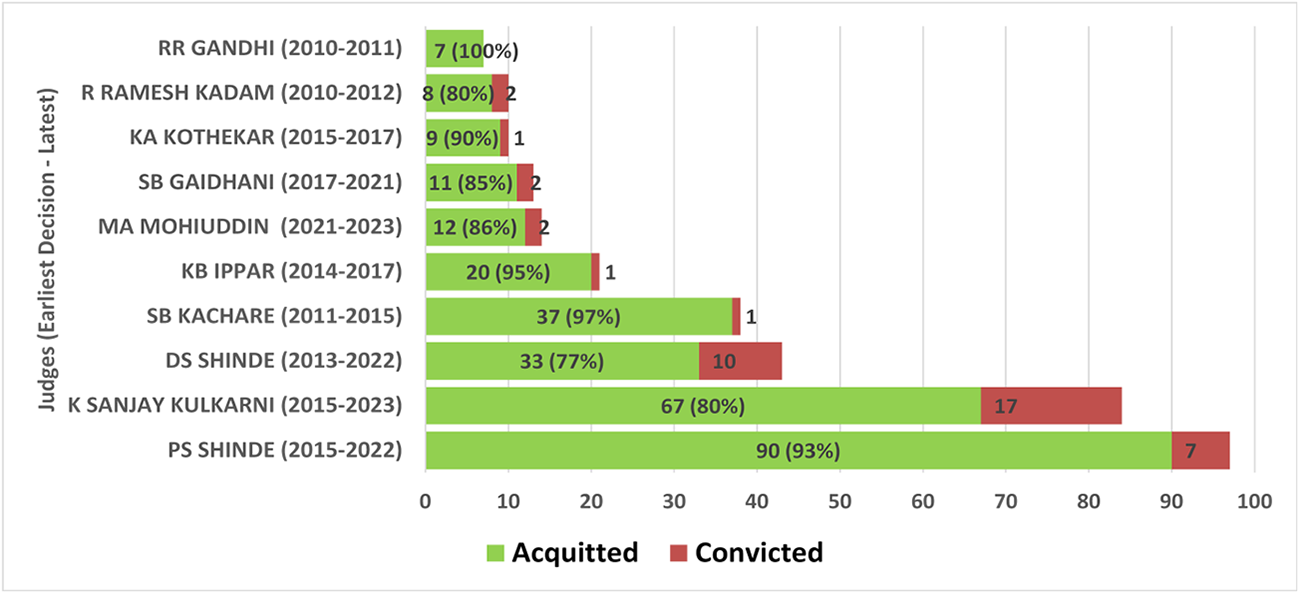
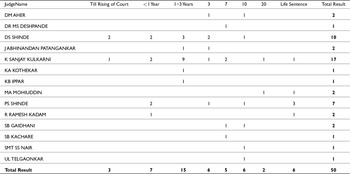


 Open access

