


I. INTRODUCTION
The I13 beamline at Diamond Light Source enables investigations spanning a wide range of length scales. The beamline operates two independent branches (Pešic et al., Reference Pešic, de Fanis, Wagner and Rau2013): the imaging branch offers full-field imaging with different modalities and offers microtomography (de Fanis et al., Reference de Fanis, Pešic, Wagner and Rau2013), grating interferometry (Marathe et al., Reference Marathe, Storm, Kuppilli, Harrison, Das, Schroeder, Cipiccia, Döring, David and Rau2019), and transmission X-ray microscope (TXM) setups. The Coherence branch uses coherent diffractive imaging and ptychography to go beyond the optical resolution limit (Rau et al., Reference Rau, Wagner, Pešic and de Fanis2011).
I13 is a long beamline with two independent undulator sources. The experiments are situated 220 m from the source. This layout is advantageous for both branches: the coherence branch has a significantly increased coherence length, and the beam size in the imaging branch is 12 × 6 mm² (full width at half maximum) to allow microtomography of larger objects.
The TXM setup (Vila-Comamala et al., Reference Vila-Comamala, Bosgra, Eastwood, Wagner, Bodey, Garcia-Fernandez, David and Rau2016; Storm et al., Reference Storm, Cipiccia, Marathe, Kuppili, Döring, David and Rau2018) is located on the imaging branchline I13-2. This branch is equipped with a double Bragg Si-111 monochromator and a multilayer monochromator (MLM) with three different coatings allowing access to different X-ray energies and bandwidths.
Zernike phase contrast with X-rays (Schmahl et al., Reference Schmahl, Rudolph, Guttmann, Schneider, Thieme and Niemann1995; Stampanoni et al., Reference Stampanoni, Mokso, Marone, Vila-Comamala, Gorelick, Trtik, Jefimovs and David2010) can improve the signal-to-noise ratio for weakly absorbing samples significantly. This allows investigating such samples in a high-energy TXM experiment. Using high photon energies is advantageous both from a sample and beamline perspective: For the sample, using a higher energy corresponds to a less absorbed dose in the sample. Because of the condenser, the flux density on the sample is significantly higher than for a microtomography at the same beamline. Using typical settings at I13-2, the flux density on the sample is about 200× higher than for the comparable microtomography setup at the same energy. For the experimental setup, a higher energy simplifies the experimental setup because absorption from X-ray windows and air paths is strongly reduced. In addition, the working distance of the X-ray optics increases, which makes integration of in situ environments easier as the spatial constraints are relaxed.
II. EXPERIMENTAL SETUP
A. Mechanical setup
The beamline is equipped with a U22 in-vacuum undulator source with a minimal gap of 5 mm. The peak flux at 12 keV is 1.11 × 10¹² photons mm−2 s−1 at 0.1% bandwidth. A mirror with a fixed reflection angle is installed in the imaging branch. This mirror has silicon, rhodium, and platinum surface stripes which allows to select different cut-off values for higher energies.
The double MLM with a Mo/B4C coating allows working at a larger energy bandwidth of ~0.3% which yields a significant flux increase compared to the Si-111 monochromator. However, the achievable resolution is slightly reduced because of the chromatic aberrations of the optics. An in-vacuum slit system close to the experiment is used to limit the beam size to the acceptance of the optics.
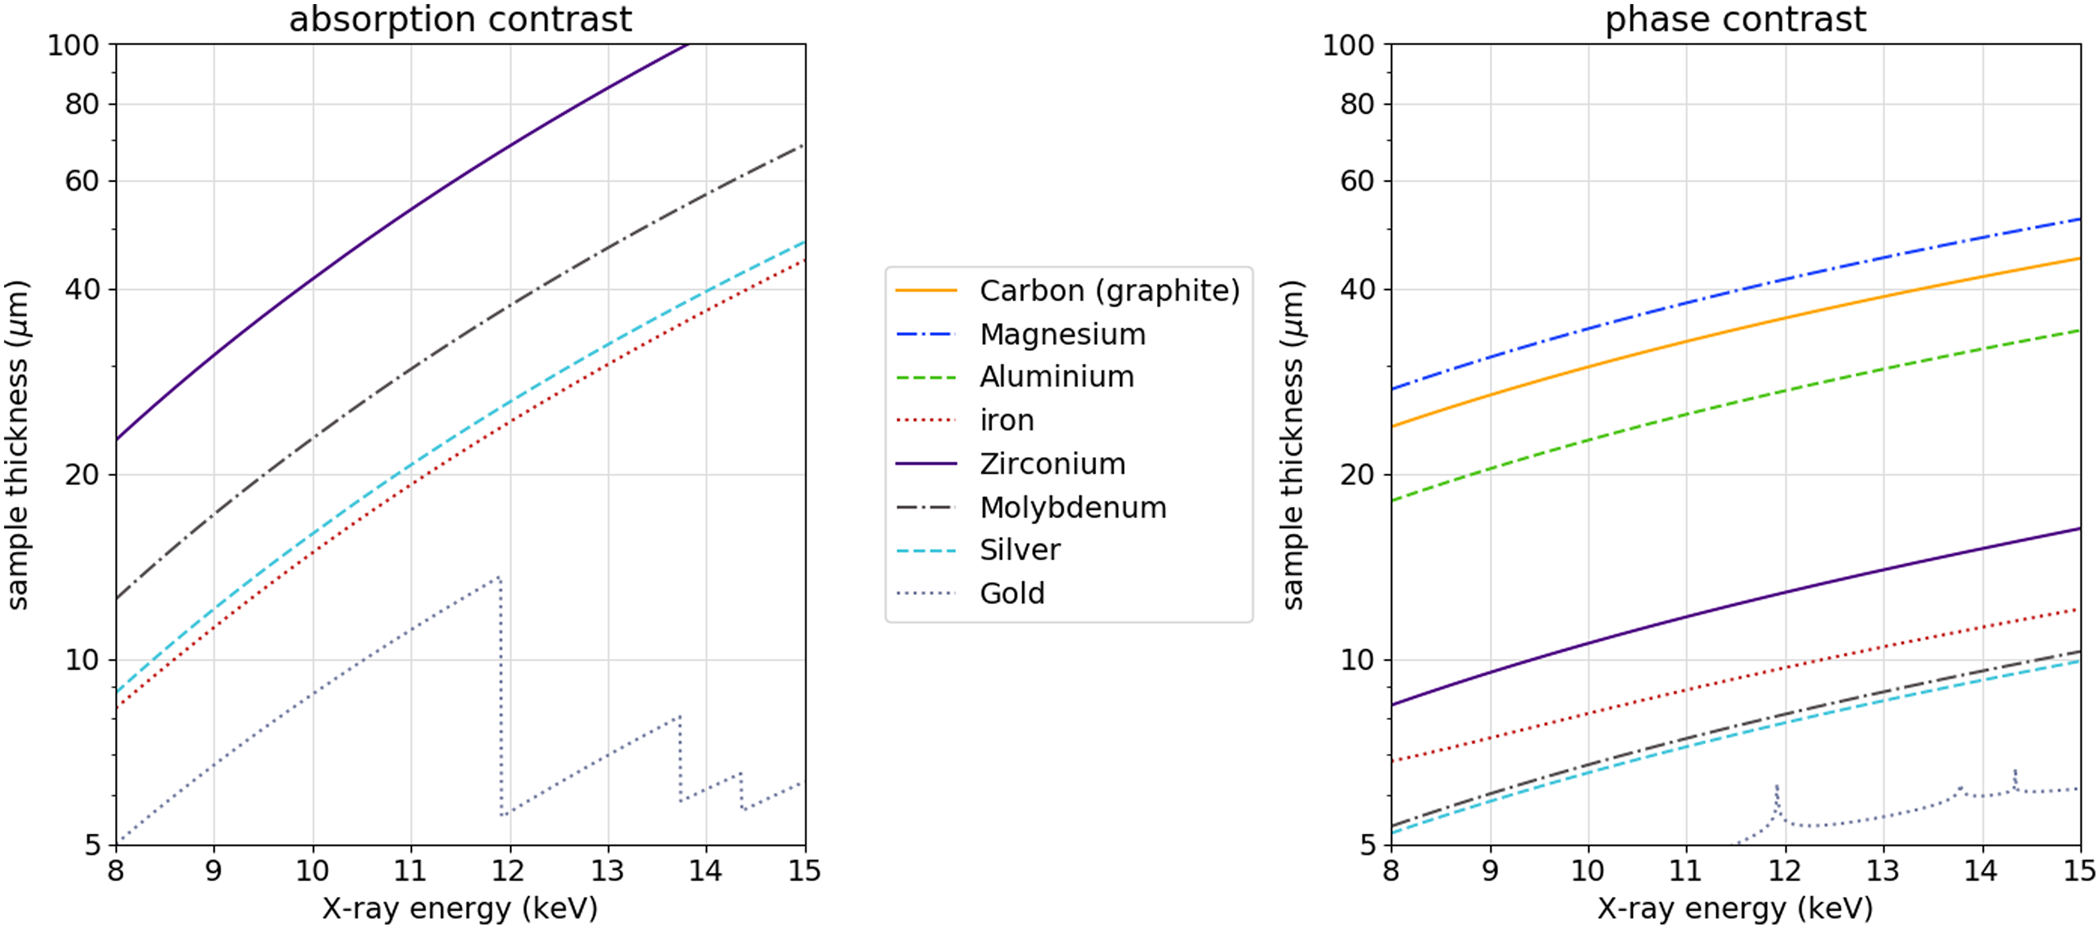
The current TXM experiment is integrated in the microtomography setup of the imaging branch. It is designed to operate in the energy range of 8–15 keV. A beamline upgrade to reduce the length of air paths and the number and thickness of X-ray windows is planned to push the accessible energies even lower. The energy range from 8 to 15 keV is well suited to investigate many elements, from very low Z elements like carbon and magnesium up to heavy elements like gold. The ideal thickness t of a sample with the linear attenuation coefficient μ in tomography is t = 2/μ (Grodzins, Reference Grodzins1983). Figure 1 shows that the energy range of 8–15 keV covers a huge range of materials and thicknesses. For phase contrast, the optimum thickness was calculated to give a phase shift of 2π.
Calculation of the best-suited sample thickness (or energy, respectively) for some exemplary materials. For the absorption contrast, the optimum condition is t = 2/μ (Grodzins, Reference Grodzins1983), and for phase contrast, a phase shift of 2π was used for the calculation.
The vacuum system exit window is installed 1.6 m from the sample position. This allows installing the condenser up to 1.5 m upstream from the sample. A rotating diffusor can be installed in front of the condenser to reduce the degree of coherence. The MLM stability requirements match the needs for the full-field microscope and help eliminating potential artefacts of the microscope (ringing) in a similar way the diffusor does.
All optical elements – condenser, central stop, order sorting aperture (OSA), zoneplate, and phase ring – are mounted on SmarAct SMC2430 stages, and a micos UPR-270 rotation stage is used for tomographic measurements.
All components are mounted in air and evacuated flight tubes are installed between the components. All components, except for condenser and detector, are mounted on a common base to increase the relative stability and minimize drifts. A Hamamatsu C12849-101U camera with a sCMOS chip with a 6.5 μm pixel size and a 10 μm Gadox scintillation layer is used as a detector system. A slit system in front of the detector is used to limit the field of view to the area covered by the central stop.
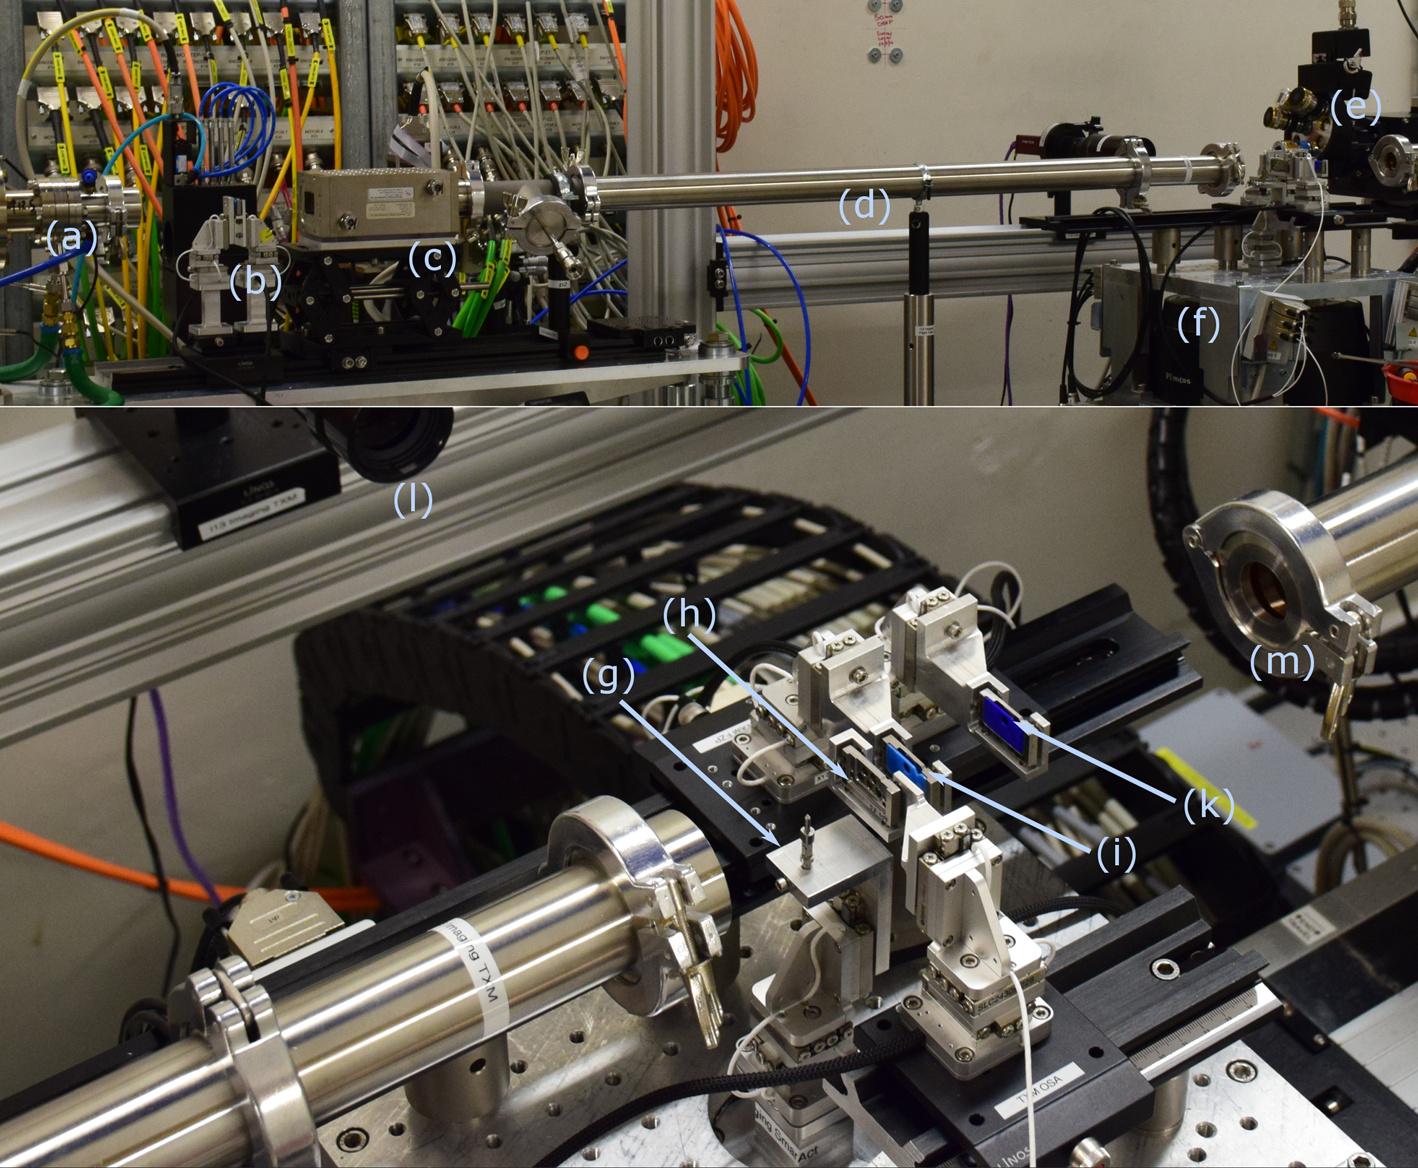
A photograph of the setup is given in Figure 2. Not depicted are the detector and the slit system in front of the detector used for blocking the zeroth order.
The setup of the TXM experiment. Items in the picture: (a) beamline diamond vacuum window; (b) condenser and central stop; (c) ion chamber; (d) evacuated transfer pipe; (e) high-resolution detector system for optics alignment; (f) air-bearing rotation stage; (g) sample on xyz translation; (h) order-sorting aperture; (i) Fresnel zone plate; (k) Zernike phase ring; (l) side-ways optical camera for sample alignment; and (m) evacuated transfer pipe to the detector. The detector, which is 8.5 m downstream of the sample, is not shown. In addition, a diffusor can be installed between (a) and (b) to reduce the coherence (not installed in photograph).
B. Optical setup
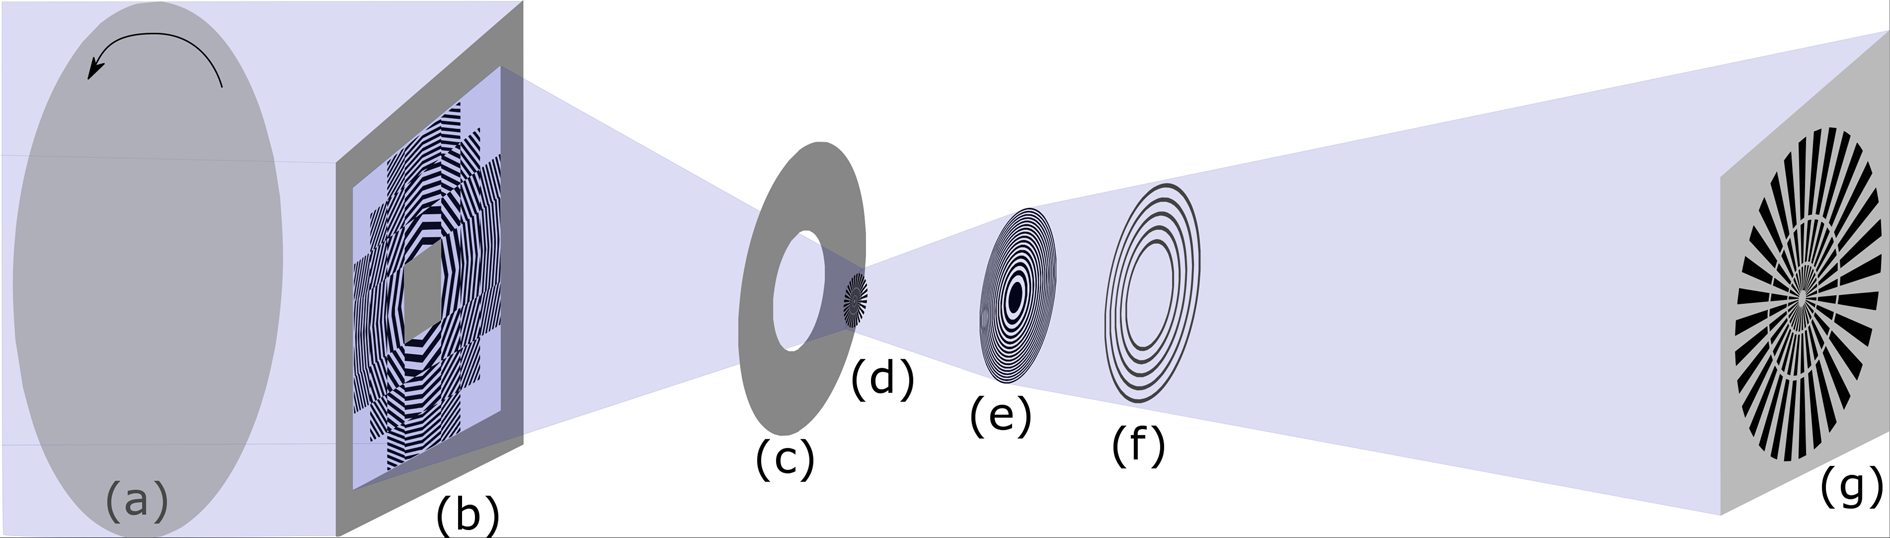
The X-ray Optics and Applications group of PSI fabricates the optics used in the TXM using electron beam lithography (Vila-Comamala et al., Reference Vila-Comamala, Gorelick, Färm, Kewish, Diaz, Barrett, Guzenko, Ritala and David2010). A beamshaping condenser (BSC) with square fields (Vartiainen et al., Reference Vartiainen, Mokso, Stampanoni and David2014) provides the illumination of the sample. The illuminated area can be selected by choosing the field size of the BSC to match the size of the sample and optimize the efficiency of the experiment. The first diffraction order is selected by an OSA which blocks other orders. A Fresnel zone plate acts as objective optics and projects the magnified image of the sample on the detector. It is manufactured from iridium and has an outermost zone width of 50 nm, a height of 104 nm, and is available in radii of 90, 120, 150, and 180 μm to allow different X-ray magnifications. Zernike phase rings (ZPRs) can be used to achieve phase contrast imaging if the absorption contrast from the sample is weak. The phase rings can be installed in the Fresnel zone plate (FZP)'s back-focal plane, and the ZPRs are tailored to the illumination of the BSC. The optical layout is given in Figure 3.
The optical layout of the TXM experiment. (a) A rotating diffusor to reduce the coherence (optional), (b) a guard slit and a central stop limit the incoming illumination to the beam-shaping condenser; (b and c) the order-sorting aperture allows only the first diffraction order of the BSC to pass; (c and d) the sample is mounted in the working position of the optics; (d and e) the Fresnel zone plate focused the magnified image of the sample on the detector system (f and g). If the absorption signal is very weak, Zernike phase rings (e and f) can be installed in the back-focal plane.
Since the FZP also diffracts into the zeroth order, i.e. the direct beam, a central stop needs to block any beams that would directly hit the detector. A selection of central stops in different sizes are available to optimize the illumination depending on the size of the sample. The maximum distance bettween the sample and the detector is limited by the experimental hutch to 8.5 m. At working distances between 30 and 150 mm, this corresponds to X-ray magnifications between 56× and 283×.
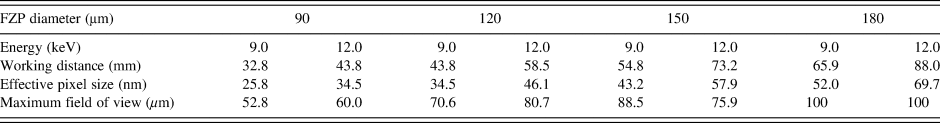
ZPRs are available for energies of E = 9 and 12 keV. A combination of different BSCs and FZPs with different diameters allows covering a large range of optical parameters. A list of the available experimental setups is given in Table I. The energies of 9.0 and 12.0 keV have been selected because ZPRs are available for these energies. Apart from this limitation, the energy is freely selectable. A selection of central stops with different diameters is available to optimize the flux on the sample. The sensitivity of the Zernike setup depends on the width of the phase rings. In theory, the required width of the phase rings could be determined by source geometry and zone plate focal spot size, i.e. they could be below 100 nm in width. The wider the rings are, the stronger the required refraction signal from the sample to shift the beam off the phase ring: the sensitivity of ZPC setups drops with an increasing ring width. On the other hand, there are practical considerations for an experimental implementation: (i) the setup should be robust enough for user experiments and forgiving of minor drifts; (ii) the setup and alignment time increases exponentially with thinner phase rings because the alignment needs to be more precise; and (iii) the fabrication quality of the phase rings which require a specific height. We use phase rings with widths of 300 and 500 nm in this setup, which are a good working compromise between sensitivity and experimental requirements.
Overview of available optical layouts for the I13-2 TXM experiment. All FZPs have outermost zone widths dr of 50 nm.
III. RESULTS
A. Optical performance
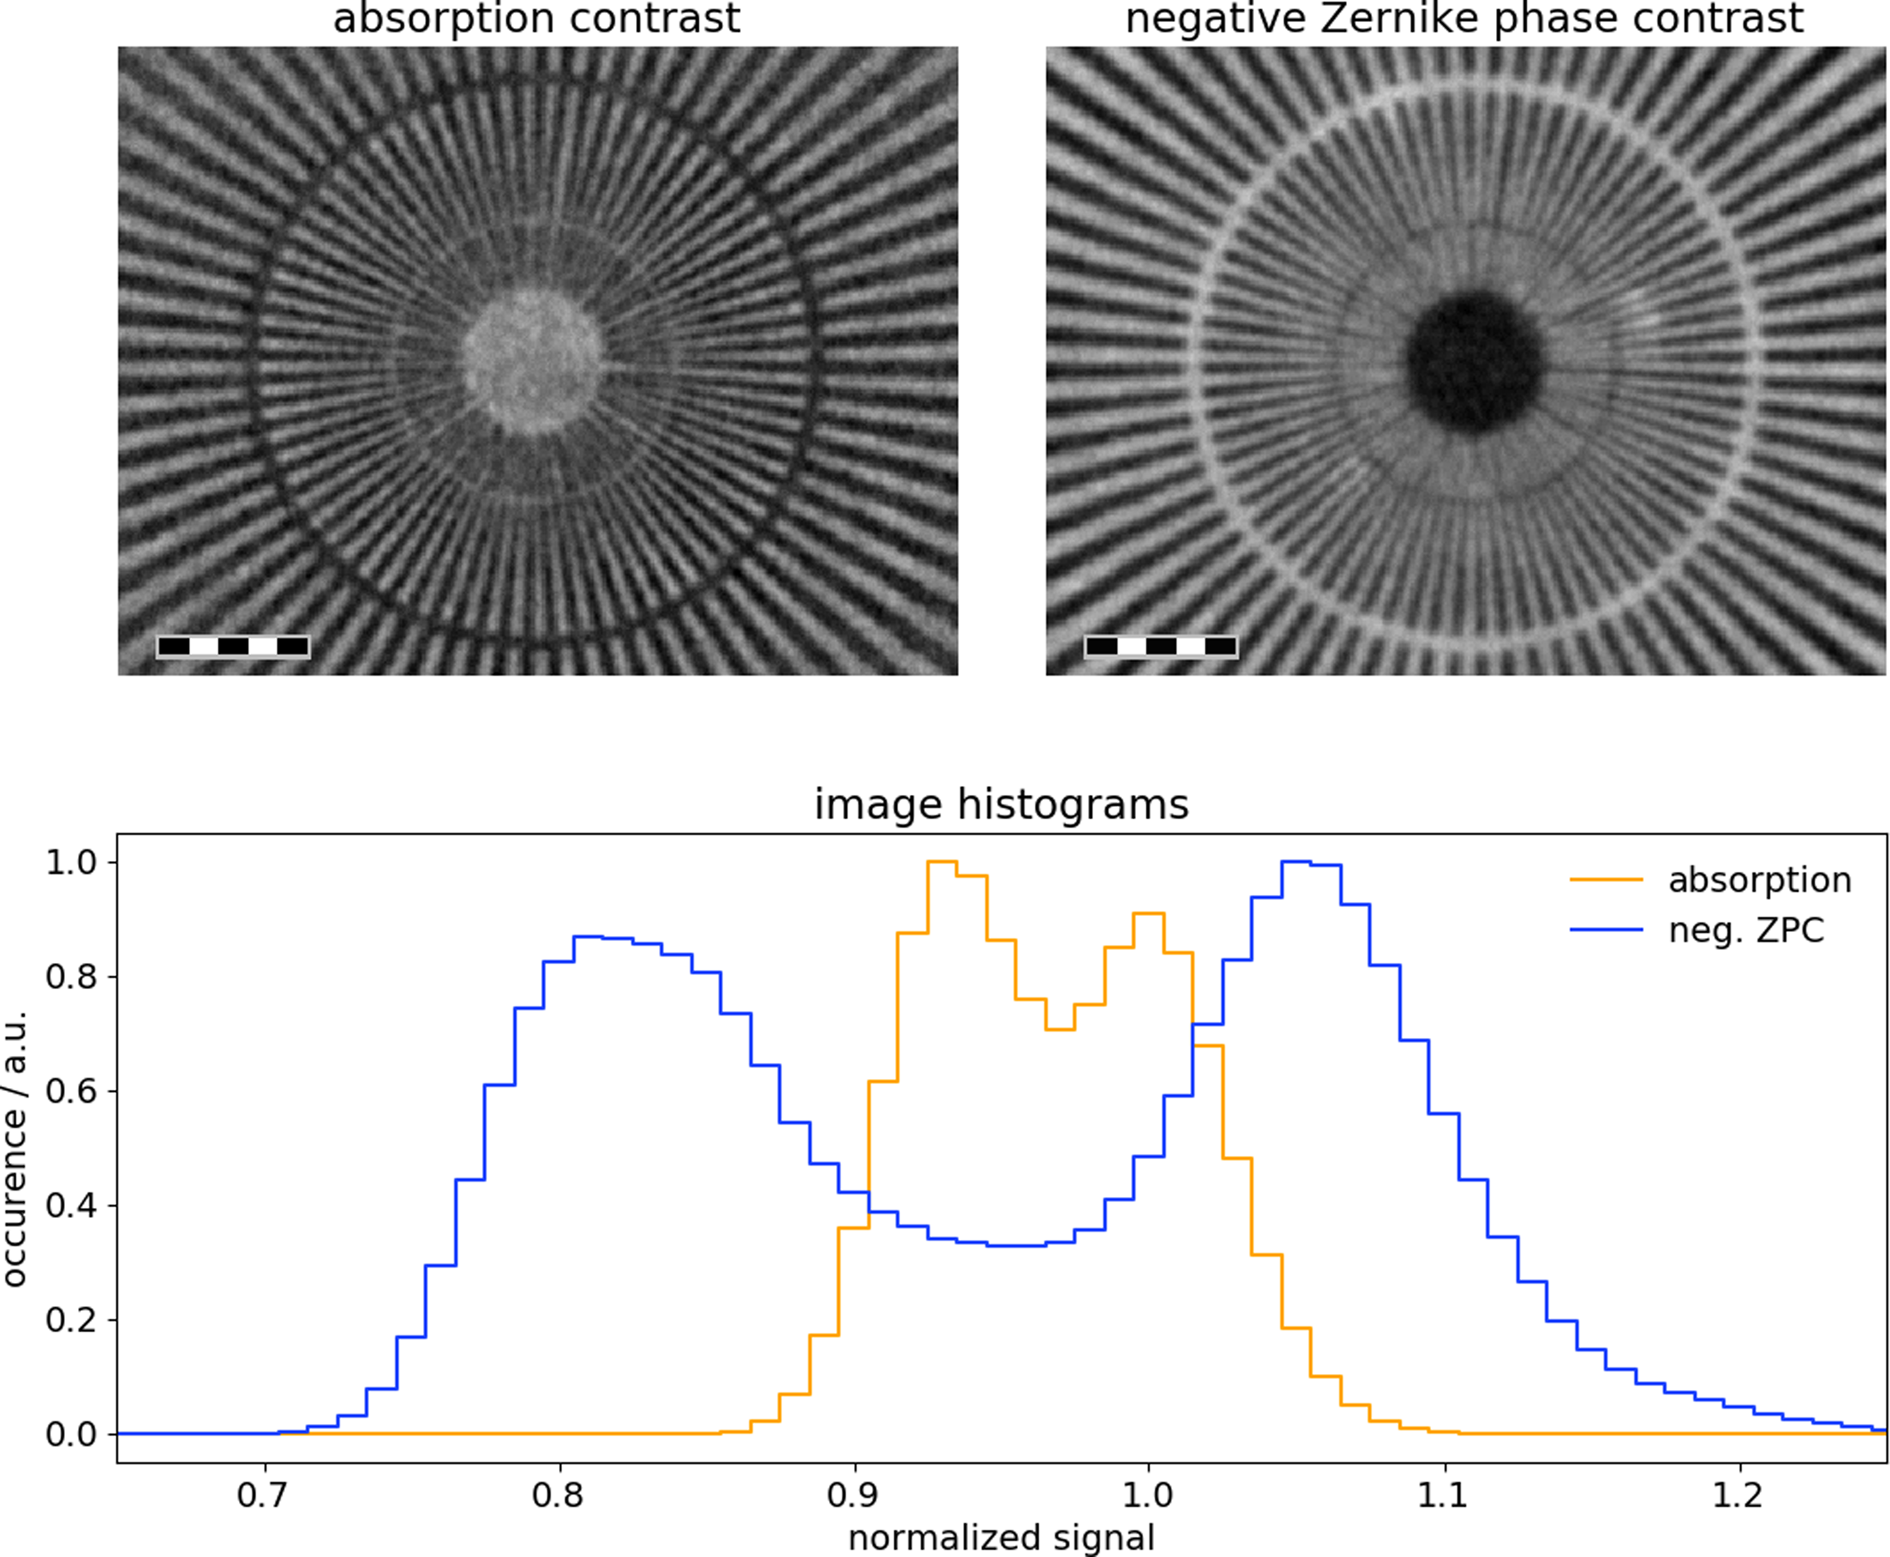
The use of FZPs with an outermost zone width of 50 nm limits the achievable resolution to 61 nm (Rayleigh criterion). The detector's resolution limit according to the manufacturer is approx. 5 pixels (line pair). Therefore, the limiting factor in all the setups described in Table I is the detector, not the X-ray optics. An example image is given in Figure 4. The half-period resolutions, determined by Fourier shell correlation (FSC) and using the 1/2 bit resolution criterion (van Heel and Schatz, Reference van Heel and Schatz2005), are113.9 nm for the Zernike image and 125.4 nm for the absorption image, respectively. These numbers are only slightly larger than 105 nm, which corresponds to 3 pixels at 34.8 nm effective pixel size and shows the limit of the detector system. The histogram in Figure 4 exemplarily shows how using Zernike phase contrast can improve the signal quality in the data.
Demonstration of the achievable resolution using a test pattern (gold structures, height = 500 nm, smallest feature siyz 50 nm, the rings are located at 100 and 200 nm feature sizes, respectively). The experimental parameters were E = 12 keV, effective pixel size 34.8 nm, and total FOV 48.7 μm (h × v). The width of the scale bars is 5 μm. The inner ring corresponds to 100 nm line and space, and the second ring corresponds to 200 nm line and space structures. As the absorption is very weak, using Zernike phase contrast can improve the signal, as shown in the separation of the two peaks in the histogram.
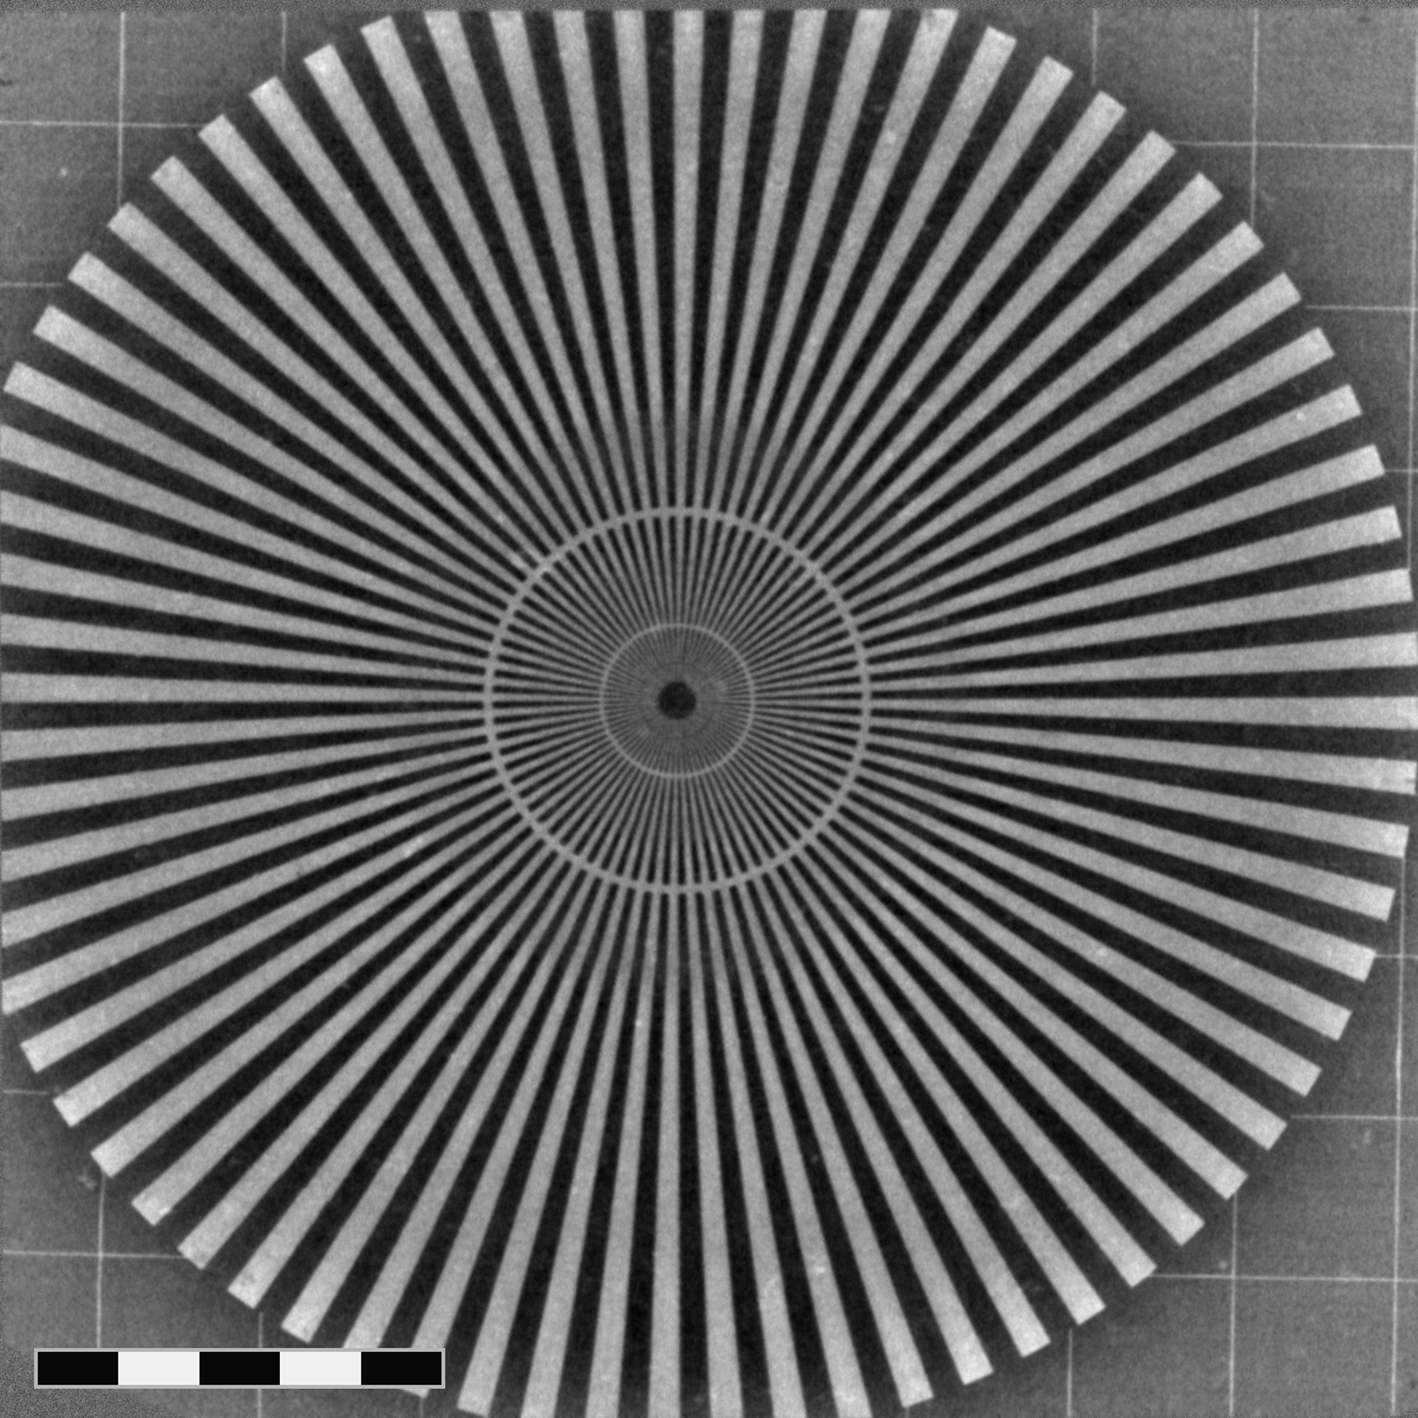
Larger field of views can be easily accommodated by using larger FZP diameters, which increases the working distance and reduces the X-ray microscope's total magnification. The pixel size scales with the field of view (FOV). However, there is a strong user case for these setups as many material science applications do not require the highest magnifications and prefer to investigate larger samples. The achievable resolution in this type of setup is only limited by the detector system. Figure 5 shows an exemplary image using a large FOV of 88 μm at 58.3 nm pixel size. The resolution, determined by FSC, is 171.3 nm, which corresponds to roughly 3 pixels.
Example projection of the large FOV TXM setup. The image size is 88.5 μm × 88.5 μm. The scale bar corresponds to 25 μm. The smallest features are 50 nm in size, innermost ring (dark) corresponds to 100 nm line and space, the middle ring to 200 nm line and space, and the outermost ring to 500 nm line and space.
B. Experimental performace
Typical exposure times to fill the detector (16 bit) are between 200 and 1500 ms, depending on energy, magnification, and field of view (i.e. central stop size). A fly-scan protocol (continuous rotation of the rotation axis) has been implemented to reduce the scanning overhead. At present, the overhead per image is only 25 ms. This allows very quick scans, and typical scan times are around 5–15 min. When performing fly-scans, the movement within each frame will induce blurring. The blurring can be calculated using this formula:
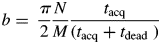 $$b = \;\displaystyle{\pi \over 2}\displaystyle{N \over M}\displaystyle{{t_{{\rm acq}}} \over {\lpar {t_{{\rm acq}} + t_{{\rm dead}}\;} \rpar }}$$
With N the number of pixels, M the number of projection angles, and t acq and t dead the acquisition and dead times, respectively. For example, a sample of 1000 pixels width at 1500 projections (t acq = 0.3 s and t dead = 0.025 s) would be blurred by less than 0.97 pixels in the outermost regions, which is well below the detector resolution limit.
The advantages of a fly-scan are numerous. The scan is much faster and requires less scantime per sample because the acceleration and deceleration times of the rotation stage can be eliminated. A shorter scan time also corresponds to a reduced dose on the sample if no fast shutter is installed. Because of the strongly increased flux density on the sample, samples which are deemed radiation-hard in microtomography experiments might not be any more in TXM. A shorter scan also reduces any possible drifts induced through changing environmental conditions or changes in the sample itself which can be caused, for example, by sample handling.
Another advantage of fly-scans is the continuous motion, which only requires a single angular acceleration and deceleration at the beginning and end of the scan, respectively. For delicate samples that might be excited and vibrate, this can make an important difference.
C. Example: photonic glass
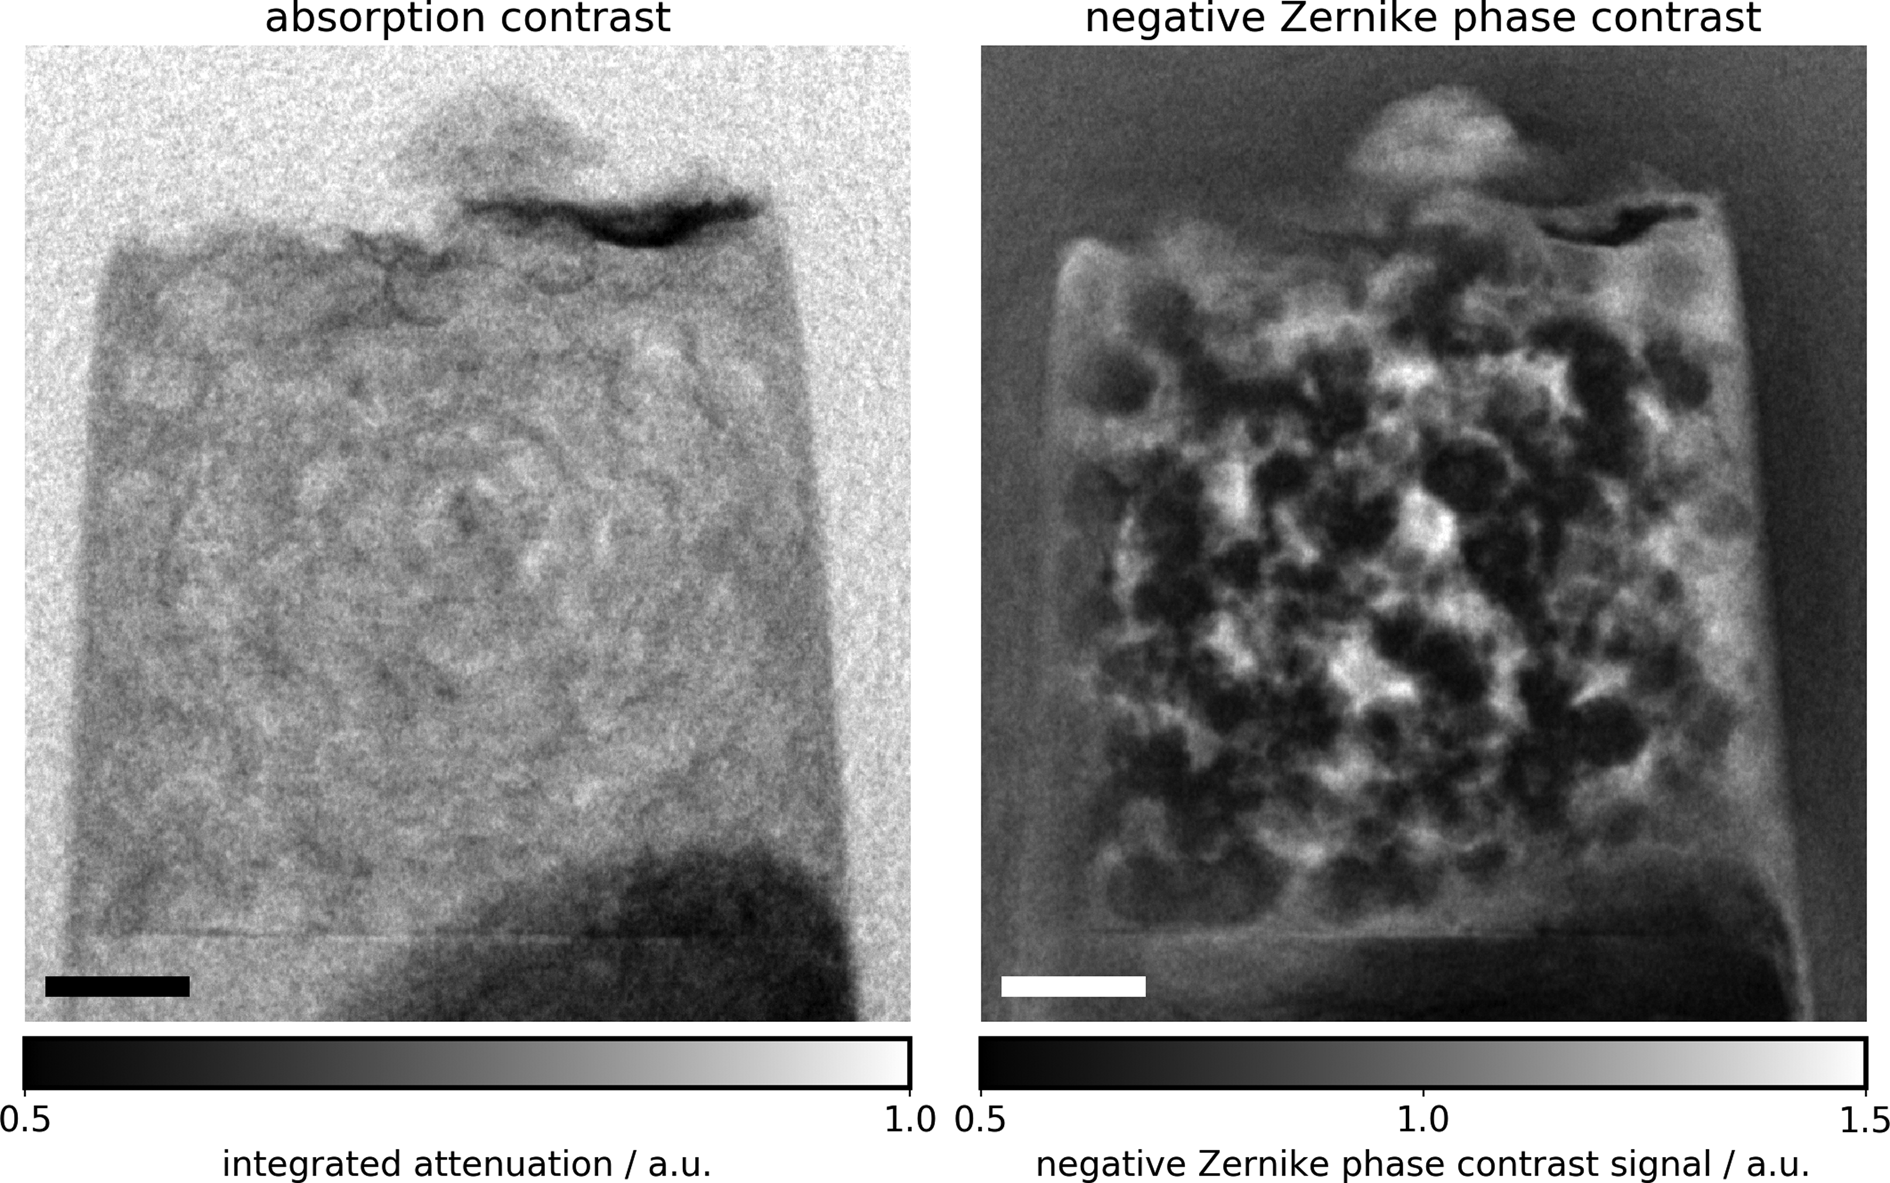
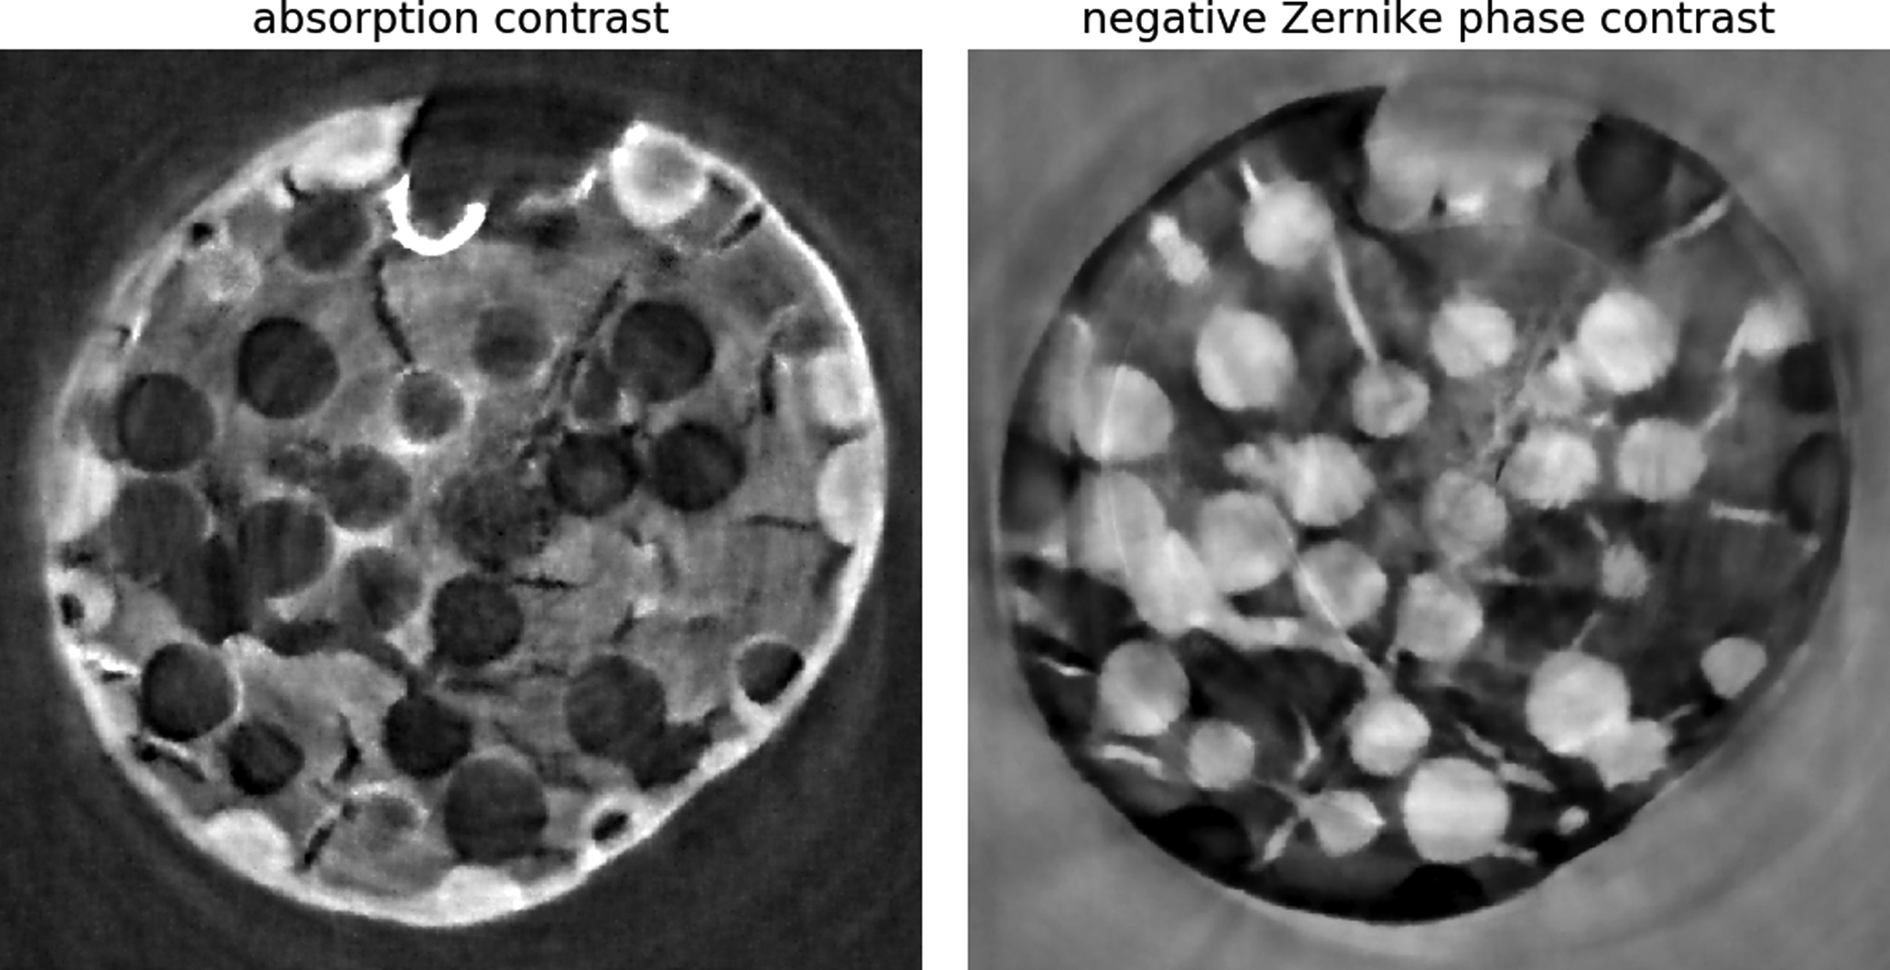
An inverse photonic glass has been scanned with both absorption and Zernike phase contrast. The sample is fabricated from a template of 2 μm polystyrene spheres which have been coated with Zirconia in an ALD process. Finally, the polystyrene is burned at the high temperatures required to sinter the Zirconia.
Figure 6 shows representative projections of the sample with absorption and Zernike phase contrast. The phase-contrast image shows much more of the inner structure of the sample at otherwise identical experimental settings. A tomography has been performed with both contrast modes, acquiring 1500 projections each with an exposure time of 0.3 s. Reconstructed slices are shown in Figure 7. The matrix and pores are much better distinguished in the Zernike phase-contrast image. However, the phase contrast is less well suited to resolve density differences of very dense material like the redeposition zone around the sample, and there are clear artefacts visible.
Exemplary projections of the photonic glass sample with absorption and Zernike phase contrast at otherwise similar beamline settings. The improvement in contrast with Zernike phase contrast is significant. The scale bars correspond to 5 μm.
Exemplary reconstructed slices of the photonic glass sample with absorption and Zernike phase contrast. The inner part of the sample consists of the Zirconia matrix and porosity, while the sample preparation with focused ion beam milling left a dense layer of gallium/zirconia around the sample (redeposition) which also fills easily accessible voids around the edge. The very distinct spot in the top of the image is probably platinum which has been used to coat the sample with a protective layer and could infiltrate the sample through open porosity.
IV. OUTLOOK
An upgrade plan has been developed to move the endstation upstream in the experimental hutch. This would increase the maximum distance between the sample and the detector to 15 m. Using the same optics and working distances which are currently in use, this could reduce the effective pixel size by 43%. While this change would also reduce the field of view by a similar amount, at present most configurations do not use the full detector size because it is beneficial to use a smaller central stop to increase the number of usable photons. As the central stop's projection on the detector increases by the same ratio as the distances, i.e. 43%, there is no additional cost in beamtime for changing the setup.
An upgrade of the detector system with a detector that includes an additional optical magnification is also planned to push the achievable resolution.
V. CONCLUSION
The I13-2 TXM experiment is well suited to cover a large range of achievable field of views and energies to enable investigation on a broad range of material science applications. Currently, the resolution is limited by the detector system and has not yet reached the limit of the optics. The experiment allows quick scans of only a few minutes which makes it suitable for in situ applications. The long working distances of more than 40 mm have been chosen to give ample space to allow installing sample environments.
ACKNOWLEDGEMENTS
The authors acknowledge Diamond Light Source Ltd. and the University of Manchester for funding for the instrument. The authors also acknowledge Diamond Light Source for beamtime (proposals MT19746 and MG24892). We would like to acknowledge Joan Vila-Comamala (ETH Zürich), Silvia Cipiccia (DLS), and Simon Logan (DLS) for contributions to the experimental setup.


 Open access