

Key messages
Chapter 2.1 tackles risk pooling. Risk pooling refers to the way prepaid funds are combined and then used to provide care for a covered population. Pooling is an often underappreciated aspect of health financing which shapes the overall health system. Key learning includes that:
Pooling prepaid funds is central to progressing towards universal health coverage (UHC). It bolsters health system efficiency and equitable access to services.
Pooling maximizes redistributive capacity and allows the health system to align funding with needs and social priorities.
Having multiple risk pools can be problematic, particularly if:
○ pools have too few people;
○ if everyone in the pool has similar risks; and
○ if there is no redistribution of resources across pools.
Structuring and managing risk pools well can offset problems associated with fragmentation by:
○ reducing duplication or overlap, making purchasing and service delivery more effective;
○ avoiding disproportionately large financial burdens falling on particular pools; and
○ minimizing risk selection and “cream-skimming”, whereby pools try to exclude high-risk (and therefore high-cost) individuals.
Policy-makers can use a range of pooling strategies to enhance efficiency, equity and access but path dependencies, politics and context matter. Options include:
○ encouraging the integration (i.e. consolidation or merger) or coordination of pooling schemes;
○ boosting funding for less endowed pools;
○ equalization through risk adjustment across pools via direct transfers between schemes;
○ making membership compulsory; or
○ aligning data systems, benefit packages and payment infrastructure across pools.
Introduction
We first outline what pooling is and its purpose. We explain how risk pooling works and introduce the problems of incomplete risk pools and pool fragmentation that are particularly apparent in low- and middle-income countries (LMICs) and are key to much of what follows in the rest of chapter.
Pooling as a health financing function is concerned with the assignment of prepaid funds to the institutions that purchase health services on behalf of some or all of the population. As such, pooling is a policy instrument: pooling structures and related mechanisms can be changed as part of policy reforms to achieve wider objectives.
Pooling interacts significantly with other health financing functions. For example, revenue raising affects the overall magnitude of prepaid funds, i.e. the total amount that can be pooled. While pooling determines the redistributive potential of any given level of prepaid funds, redistribution only happens when the funds are spent, i.e. during purchasing. The method of pooling chosen can affect the overall efficiency of the health system: pooling structures can influence the extent of duplication or overlap in purchasing and service delivery, and help make purchasing incentives more or less coherent. However, even with a good pooling structure, poor purchasing or budgetary discipline can limit the amount of redistribution that actually takes place. So to properly understand pooling, it is important to understand how it aligns with other health financing functions.
The primary purpose of pooling is to maximize the redistributive capacity of prepaid funds and is referred to as risk pooling, which allows the decoupling of payments from service use. This means that the cost risks that ill health poses to individuals and households are also in effect pooled. Though risk pooling aims to redistribute resources according to need, it is difficult to predict an individual’s or a household’s future need for health services. Without mitigating measures in place, potential illness and disease expose individuals and families to huge health and financial risks. For this reason, societies have developed various approaches towards pooling risk, so that the randomness is shared across a broader population, reducing the aggregate risk confronting that population. Such pooling is in effect an insurance function that usually entails redistribution from healthy to sick and, to the extent that poorer persons are in worse health, from wealthy to poor (Smith & Witter, Reference Smith and Witter2004).
Risk pools can be formed at different levels of a health system and vary in size, from the whole nation to a local hospital which pools risks by offering free or subsidized access to a group within the local population. The nature of risk pools in a particular health system may result from historical path dependency and wider political decisions as much as explicit design choices. No society lacks pooling, nor is pooling ever complete – so all are on a spectrum of degrees of pooling which places individuals at a greater or lesser level of exposure to risk, often in the form of out-of-pocket (OOP) payments or barriers to access for health services.
Decisions about risk pooling are crucial to the operation of the health system and health care markets. However, recent papers argue that risk pooling issues have received much less attention than other health financing functions in the global literature (Mathauer, Saksena & Kutzin, Reference Mathauer, Saksena and Kutzin2019). Pooling also raises inherently political issues, as it is central to the distribution of costs and benefits across different social groups. In many LMICs, risk pools are incomplete – individuals remain exposed to coverage and payment risk – and fragmented, which means that an individual may get very different protection depending on which pool they belong to. Pool fragmentation means that, for any given level of prepaid funds in a health system, there are barriers to redistribution (e.g. across insurance funds, or across levels of government). Therefore, pool fragmentation undermines risk pooling because the more fragmentation that exists in a system, the lower the redistributive capacity of the aggregated prepaid funds. Fragmentation thus contributes to inequities in access and use, poor financial protection and inefficient purchasing (WHO, 2010).
High reliance on OOP payments, which is a feature of many low-income settings, is an indicator of limited fiscal capacity that leads to low levels of public funding for health, and hence constrains the aggregate level of funds that are pooled in a health system. Poor pooling arrangements limiting the redistributive capacity of these funds (either across individuals or time) compound the problem.
In this chapter, we first examine what makes a good pooling system and then go on to describe how risk pools are organized in practice and the strategies adopted to overcome their problems of incompleteness and fragmentation. We present a case study of Thailand’s reform of its pooling system and draw on this and other work on the political economy of health reforms to understand how best to manage the politics of pooling reforms.
What makes a good pooling system?
Pooling creates opportunities for the efficient redistribution of resources to support equitable access to needed services, with financial protection arising from any given level of prepaid funding (Mathauer et al., Reference Mathauer2020). Ensuring redistribution at the system level and across different pools is key to making progress towards UHC. Closely related health financing actions are to decouple contributions, such as taxes or premiums, from health needs or risks, and move towards uniform benefits packages (WHO, 2010).
However, fragmented pooling creates its own set of problems. It often contributes to inequities, where people in different pools have different benefit entitlements; for example, de facto through varying levels of per capita funding across pools. It can contribute to health system inefficiencies, too, due to a duplication of tasks that results in higher overall health system administration costs, as well as, potentially, less effective purchasing, if providers are able to shift costs between multiple, uncoordinated purchasers (Mathauer, Saksena & Kutzin, Reference Mathauer, Saksena and Kutzin2019).
Desirable attributes of pooling
In response to the problems of fragmentation, the World Health Organization’s (WHO’s) health financing progress matrices highlight two main desirable attributes for pooling: integrating, or at least coordinating, pooling schemes and increasing the ability to redistribute available prepaid funds according to needs and social priorities (Jowett et al., Reference Jowett2020). Where there are multiple pools, risk adjustment between them can ensure that average per capita expenditure on health, adjusted for the pool members’ health risks, is equal or similar across pools, but this option is relatively complex to administer. Other corrective mechanisms include establishing common benefits packages and merging data systems across schemes.
Further desirable attributes of pooling include:
compulsory membership (to avoid adverse selection, whereby only those with high needs join the pool, and cream-skimming, whereby insurers encourage membership only by healthier members, for example);
payments by members being unrelated to utilization (otherwise it negates the sharing of risks); a large population size (to ensure diversity of risks and ability to cross-subsidize during health shocks) (Mathauer et al., Reference Mathauer2020); and
administrative feasibility (for example, for health insurance, the pool has to have the capacity to check on membership, ensure that entitlements are fulfilled, avoid illegitimate calls on funds and check on provider performance).
There are a number of rudimentary universal indicators of the success of risk pool harmonization arrangements (Smith & Witter, Reference Smith and Witter2004), which include:
the number of different pools in a health system and the population affiliated to or benefiting from each;
variations in expenditure on the package of care: the extent to which there exist differences between risk pools in the expenditure per member, which may influence the real level of benefits available for covered individuals in each pool;
variations in quality: the extent to which there exist qualitative differences in health care received by members of different risk pools; for example, in the form of waiting time variations, which may be a consequence of the level of per capita subsidy;
variations in OOP spending: the extent to which there exist differences between risk pools in the OOP charges experienced by individuals in receipt of health care.
Some observed variations between pools may be due to factors other than risk pool fragmentation, such as variations in purchaser efficiency. However, large variations in such indicators offer strong prima facie evidence of the harmful consequences of fragmentation.
Evidence of poor risk pooling
Challenges can be seen in LMICs, in particular, regarding a lack of effective coverage and pooling demonstrated in variations of utilization, quality of care and financial protection (which also relate to health care supply features). WHO’s 2019 UHC monitoring report, for example, found that in many systems poor people have lower coverage even for basic services such as immunization, sanitation and antenatal care (WHO, 2019). For these basic services, rural areas generally have lower coverage than urban areas. In addition, the global incidence of catastrophic health expenditure (Sustainable Development Goal indicator 3.8.2), defined as large OOP spending in relation to household consumption or income, increased continuously between 2000 and 2015. As risk-rated private insurance affiliation is low in most LMICs, it may pool risks over time but not across individuals, while community-rated health insurance schemes have typically suffered from adverse selection, whereby only the poor and sick join and risk pooling collapses (Ekman, Reference Ekman2004).
Fragile and conflict-affected settings have higher need and unmet need for health services as well as significantly higher OOP expenditure, external dependency and health-related impoverishment (Witter et al., Reference Witter2020). Overall financing for health tends to be low and also inequitably distributed, and low trust and conflict undermine pooling and prepayment, as well as the stable institutions to oversee risk pooling. Risk pools therefore tend to be highly fragmented and with poor coverage, with populations further segmented where there are substantial refugee and displaced populations, having varying protection provided by different humanitarian agencies, each with their own mandate, resources and focus. These complex emergencies have been particularly challenging in the WHO African and Eastern Mediterranean regions.
The indicators of pool harmonization outlined above mask those who cannot afford to use care, which can be a prima facie indicator of inadequate risk pooling arising primarily from shortcomings on the revenue raising and supply side. Analysis shows that the incidence of catastrophic health expenditures or impoverishment due to OOP health expenditures (using global poverty lines) is negatively correlated with the share of compulsory prepaid and pooled expenditure (government spending) in total current health spending, and hence positively correlated with the share of OOP health spending in total health expenditure. The 2019 report also found that the majority of household OOP health spending is related to medicines and outpatient care, and not necessarily to larger but more infrequent hospital bills (WHO, 2019). Further recent research has highlighted challenges for specific populations, such as women, female-led households and the large informal employment sector, when health coverage is linked to employment (Vijayasingham et al., Reference Vijayasingham2020). It is important to focus on the indicators of failures in practice, rather than de jure pronouncements. The experiences of pool members can often vary considerably from their theoretical entitlements.
The objectives embedded in the concept of UHC offer good guiding principles for the design of risk pools, and the financial transfers between them. UHC is a set of health policy objectives that applies to an entire system and population, so calls for harmonization of benefits across that population (see Chapter 2.2).
How can countries organize risk pools?
Risk pooling typologies and features
A paper examined key features of risk pools for health care globally, highlighting the importance of the basis for enrolment (whether it is voluntary, compulsory or automatic), the number of risk pools, whether they are in competition, whether they cover specific population segments, and the extent of territorial overlaps. This led to eight different scenarios which can operate singly or multiply within a country (Fig. 2.1.1).
Pooling arrangement classifications
Comp: compulsory; Pop.: population; Vol: voluntary.

Figure 2.1.1 Long description
The flowchart starts with Pooling, and divided into 2 branches: Single and Multiple. Single moves to a compulsory measure: 1. Single, national pool with compulsory or automatic coverage. Multiple branches to Non-competing and Competing. Non-competing branches to No population segmentation and Population segmentation. No population segmentation branches to Territorially distinct (compulsory: 2. Territorially distinct pools (stage level, or provinces)) and Territorially overlapping (compulsory: 3. Decentralized pools with overlapping pop. and service coverage responsibilities). Population segmentation splits to a compulsory-for-some measure (4. Different pools for different pop. groups, compulsory for same only) and another compulsory measure (5. Non-competing pools with explicit coverage for all). Competing moves to No population segmentation, with a compulsory measure: 6. Multiple pools, competing for members. Further, there are two voluntary measures as well: 7. Voluntary health insurance as principal coverage for parts of the population. 8. Complementary or supplementary voluntary health insurance.
Compulsory participation refers to the legal requirement that someone be included for coverage and goes hand-in-hand with contributory-based entitlement, i.e. there must be a specific contribution made by or on behalf of the covered person. The “on behalf” may come from public budgets for specific groups of individuals whose participation is fully or partially subsidized, or it may come from traditional insurance contributions that cover individuals beyond the contributor (e.g. family members).
Automatic participation is typically based on legal or constitutional obligations, and the basis for entitlement is noncontributory, deriving from citizenship, residence or other factors, such as poverty status, etc. As such, automatic entitlement is typically solely funded from general budget revenues. However, mandatory coverage is often not implemented effectively because it is difficult to enforce, while the de facto experience of automatic entitlement often differs from the de jure promise due to underfunding relative to promised entitlements, leading to supply shortages, informal payments or both.
Enforcement is a particular problem in countries where a large proportion of the population works in the informal economy. The result is that even where it is legally mandatory for the entire population, it is de facto voluntary coverage. For example, Ghana instituted “compulsory” social health insurance (SHI) in 2003 with numerous population groups covered by national subsidies, but by 2021 only 35% of the population was covered (Smith & Witter, Reference Smith and Witter2004) (for multiple reasons, including residual access costs for these groups and reimbursement delays). This means that de jure pooling is not translated into de facto pooling of risks, leaving these population groups still exposed to access and financial barriers for health care.
What are the different ways countries can administer risk pooling? Are there key contrasts in decentralized versus centralized administration, or those formed by sociodemographic characteristics?
Most countries have limited and multiple funding sources and use different pools to fund specific programmes, with voluntary health insurance (VHI) sometimes existing in parallel. Where pools are multiple, they may compete for members (for example, through offering greater convenience or quality), or may cover different populations, such that there is no competition between them. Although there is an argument for competition driving choice and innovation, the evidence for this in practice is weak, and cream-skimming can occur, which adversely affects progress towards universal health coverage (Mathauer, Saksena & Kutzin, Reference Mathauer, Saksena and Kutzin2019). For those countries with insurance competition, such as Germany, the Netherlands or Switzerland, considerations need to be made about what combination of ex ante risk adjustment and ex post reconciliation will adequately reduce insurer interest in cream-skimming.
A one-pool system
However, some countries do have a single main national pool funded from general government revenues, covering the whole population. This may be administered by a ministry of health, through budgets to providers or via an independent purchasing agency. The agency, often a health insurance fund, may pool general tax revenues and insurance contributions from employers and employees. Both of these options offer maximum redistributive capacity from prepaid funds because of the integration of the main public revenue sources (social insurance contributions and general revenues, or just general revenues), into a single fund. A growing number of countries, for example, Kyrgyzstan and Moldova, have reformed their pooling arrangements to unify multiple funding sources into a common pool. In such cases, it is important to build on existing capacities and ensure that there are clear roles for any new fund and lack of duplication with the ministries of health, alongside a strengthening of the purchasing functions (Kutzin, Cashin & Jakab, Reference Kutzin, Cashin and Jakab2010).
Employment-based pools
Pools may be segmented based on employment status (e.g. formal employment), demographic status (e.g. older people or young), health status (e.g. pregnant women), location (targeting specific regions) or wealth (certain schemes being only affordable to higher income groups, or government-funded programmes for low-income persons, for example). Segmentation raises risks of inequity reflected in differences in benefits across pools.
Pools based on geographical area or administrative level
Decentralization can create separate risk pools by area or by administrative level of the system (with funds covering specific services and populations at each level, although there is sometimes duplication of coverage across levels, as in the former USSR (Union of Soviet Socialist Republics), where rayons and cities within oblasts often managed overlapping health networks and budgets). This can raise efficiency, capacity and stability concerns, if risk pools are small, as well as concerns about redistribution across pools (Mathauer, Saksena & Kutzin, Reference Mathauer, Saksena and Kutzin2019). A paper on health financing in devolved settings, which included seven case studies (Burkina Faso, Indonesia, Kenya, Mozambique, Nigeria, Philippines, Uganda), concluded that devolution contributed to fragmentation of the pooling function, making equitable distribution of resources across subnational units more difficult (ThinkWell & WHO, 2022). The study authors found that subnational territories differed in terms of their fiscal capacity relative to their needs, thereby requiring fiscal equalization arrangements (this was also at the core of the pooling reforms in Kyrgyzstan and Moldova (Kutzin, Cashin & Jakab, Reference Kutzin, Cashin and Jakab2010)). Yet the existing intergovernmental grant transfers were not adequate to equalize these differences across territorial units, which is a common challenge. The authors also remarked that it is challenging to strike a balance in horizontal transfers between multiple considerations, such as the needs of health versus other sectors and allocating resources according to fiscal need, while also incentivizing fiscal effort.
Category-specific risk pools
Risk pools may be territorially overlapping but addressing different disease or condition categories. For example, in the USA it is common to find that health care costs associated with particular conditions (such as mental illness or end-stage renal failure) are “carved out” of regular risk pools, and placed in a condition-specific risk pool (Smith & Witter, Reference Smith and Witter2004). A similar approach was taken by the Seguro Popular (People’s Health Insurance) in Mexico. The intention is to remove very unpredictable but high-cost needs from the regular health care pool, and to transfer the associated risk to a higher level of aggregation (for example, from state to federal level, which has a larger population across which to share risks). However, in countries with limited health budgets, this can be regressive, with relatively small numbers of well-connected patients benefiting from support from the dedicated fund (e.g. to fund renal dialysis) while basic services used by the majority remain underfunded (Witter, Reference Witter2010).
Overcoming the inequities of fragmentation: reforms to risk pooling
Where pools cover different socioeconomic groups, this often creates fragmentation and inequities, with better protection for more privileged groups such as civil servants or the formal employment sector through social or private health insurance, while mandates for the less powerful population segments, such as user fee exemptions for the poor, are typically underfunded and face challenges of quality and coverage (Witter, Reference Witter2009). Such arrangements typically fail to redistribute effectively, especially when relying on de facto voluntary enrolment and contributions; for example, for the informal sector (Mathauer, Saksena & Kutzin, Reference Mathauer, Saksena and Kutzin2019).
Provide automatic coverage, retain separate pools
Some countries have successfully provided automatic coverage for their populations despite retaining risk pools which are segmented by population groups. For example, Thailand managed to increase equalization of funding for its Universal Coverage Scheme (UCS) and avoided eroding the existing benefits received by civil servants (Prakongsai, Limwattananon & Tangcharoensathien, Reference Prakongsai, Limwattananon, Tangcharoensathien, Chernichovsky and Hanson2009). This option can be politically easier, though while the Thai reforms introduced since 2002 have reduced fragmentation, they have not eliminated it (see the Evidence in practice section) (Mathauer, Saksena & Kutzin, Reference Mathauer, Saksena and Kutzin2019).
Risk adjustment of revenues
A few countries, such as the Netherlands, combine competition among insurers with individual choice of insurer and compulsory participation. This is commonly referred to as a competitive SHI arrangement. Each of the insurance schemes thus constitutes a separate pooling agency. A critical requirement of this pooling arrangement is risk adjustment of the revenues that go to each insurer, either from a national fund or between pools, to reduce risk-based selection and inequalities of revenues and therefore benefits across pools (Mathauer, Saksena & Kutzin, Reference Mathauer, Saksena and Kutzin2019). If effective, this risk adjustment, which is more typically found in HICs, can reduce or eliminate the consequences of fragmentation while retaining devolved administration.
VHI generally covers small population segments. Premiums are often risk rated, and voluntary insurance may offer supplementary or duplicating services to the main risk pool. Typically, members have higher incomes and entitlements. South Africa provides the most extreme example, with 42% of its health expenditure coming from voluntary insurance in 2020, but only covering 15% of the population (Mathauer & Kutzin, Reference Mathauer and Kutzin2017). Such schemes can be highly distorting, allowing enrolled members to disproportionately benefit from underlying public subsidies in terms of trained health staff and infrastructure. Supplementary insurance can fill gaps in publicly funded coverage but still risks increasing inequities unless it is covering a large part of the population (Thomson, Sagan & Mossialos, Reference Thomson, Sagan and Mossialos2020).
Mathauer and colleagues set out four options for addressing fragmented risk pools, which can be used individually or in combination (Mathauer et al., Reference Mathauer2020).
The first is consolidation or merger of pools, with the aim of increasing their size and the diversity of members’ health needs and risks, so reducing administrative costs while at the same time increasing purchasing power and internal redistributive capacity. Consolidation may occur as part of wider changes, for example, recentralization, where regional pools are merged into a national one, or as vertical merging, where funds covering different levels of care for overlapping populations are merged. It could also take the form of merging coverage of population segments, i.e. bringing together health insurance programmes covering, for example, the informal sector and mandatory schemes for public servants. This type of merger typically generates more resistance as members of some pools may view the reforms as risking a dilution of their benefits. There may also be concerns about the institutional and administrative limits to the optimal size of purchasing agencies linked to risk pools; however, effective data systems can mitigate such concerns.
Despite these challenges, some countries have managed to merge risk pools in the past two decades, including Indonesia, the Republic of Korea and Türkiye (Mathauer et al., Reference Mathauer2020). In each of these countries, the merging of pools significantly increased the risk diversity in the merged pool and was the starting point for reducing inequities in access to health services. However, in a review of these changes, authors noted that some undesirable effects also ensued; for example, when state budget transfers to finance the coverage of poor and vulnerable population groups were “captured” by better-off groups with better access to services (e.g. in urban areas) and therefore higher utilization. This reinforces the point that pooling alone only creates the potential for redistribution; other health system features have to be aligned to produce redistributive benefits. Indonesia provides a clear example of this: the Indonesian National Health Insurance Scheme, Jaminan Kesehatan Nasional, has national pooling, but there are major supply-side imbalances across the country, and at least for inpatient care, the payment methods relate to service use. Thus, the national pool is distributing to where the providers are, not to where the needs are (for example, in more remote rural areas) (Nugraheni, Mubasyiroh & Hartono, Reference Nugraheni, Mubasyiroh and Hartono2020).
A second option which may reduce the risk of those stakeholders who benefit from the status quo resisting reforms to pooling is to retain separate risk pools, but compensate for differences between them by, for example, increasing the funding to less endowed pools. Redistribution is achieved by providing budget transfers and gradually increasing these, with the ultimate aim of achieving equitable access to health services and harmonized benefit packages. Countries that have pursued this pooling reform option include, for example, Colombia, Gabon, Mexico, Peru and Thailand (Mathauer et al., Reference Mathauer2020). In these countries, reforms have substantially reduced the differences in per capita expenditure between different population groups, and thus helped to improve financial protection and equitable access to health services.
Equalization through risk adjustment across pools is a more systematic approach to ensure equal spend per capita across pools. That can occur through direct transfers between insurance agencies or via a national risk adjustment fund, but also through adjustments of fiscal equalization arrangements between areas in a devolved context (see Box 2.1.1). ThinkWell and WHO’s (2022) multi-country study of devolved health financing, for example, found that more focus on health needs (rather than health infrastructure) was required in resource allocation and revenue sharing formulae in order to protect more disadvantaged areas. Conditional grants to local administrations, as used in countries like South Africa, and central government subsidies for health insurance coverage for the poor can indirectly contribute to resource equalization across subnational territories (ThinkWell & WHO, 2022).
Prospective risk adjustment between risk pools is almost invariably accompanied by a retrospective stage in which prospective allocations are altered in the light of actual expenditure experience (Smith & Witter, Reference Smith and Witter2004). A number of arrangements exist for handling retrospectively variations in actual expenditure from the prospective budget. These include renegotiating the budget retrospectively with the central payer, running down (or contributing to) the pool’s reserves, varying the future premiums or local taxes paid by the pool members, varying the user charges paid by the patients, varying the package of benefits available to patients, and delaying or rationing health care to the population at risk. However, some of these may perpetuate inequities between pools.
From a public policy perspective, in a competitive SHI context risk adjustment needs to be sufficient to reduce or eliminate the incentive for insurers to invest in risk selection. The combination of ex ante and ex post risk adjustment is adequate to the extent that it eliminates such socially unproductive investment.
In addition, where the above are challenging to achieve, is what the authors called “as-if pooling” (Mathauer et al., Reference Mathauer2020), meaning taking measures such as harmonizing data systems, benefits packages, contracting and provider payments across pools. These actions fall outside of pooling but can mitigate the consequences of fragmentation and pave the way for future reforms to risk pools.
The role of external actors in fragile and conflict-affected settings is typically larger, and the ideal of integrating their funds into pooling arrangements to support broad packages of services may be limited by organizational policies as well as low trust in public financing systems (Witter et al., Reference Witter2020). Strategies to address this may be similar to “as-if pooling”, including stronger aid coordination mechanisms and shadow alignment. In these settings, policies to increase financial access and decrease OOP payments (for example, through user fee exemptions, health equity funds, health insurance, vouchers and cash transfers, conditional or unconditional) play an increased role, given the combination of low, unstable and inequitable incomes; social and cultural barriers to access, and high health needs.
Finally, making membership of risk pools compulsory is an important reform, although for lower income populations it will likely require public funding to support its realization. Reviewing experiences in reforming risk pools in transitional economies, Kutzin and colleagues observed that early health reformers had identified a number of expected gains from the introduction of compulsory health insurance (Kutzin, Cashin & Jakab, Reference Kutzin, Cashin and Jakab2010). These included higher funding levels, improved accountability, greater efficiency and higher quality, through new payment incentives and the separation of purchaser from provider. Experience with the introduction of compulsory health insurance in LMICs elsewhere in the world suggested, however, that such reforms tend to worsen inequities and duplication by setting into motion the establishment of separate, segmented health financing (and often delivery) systems for the insured (often formal sector) and uninsured (often informal) populations. The core lesson for implementing compulsory risk pool membership reforms is thus to pool contributions from SHI schemes with general revenues from the outset, to ensure that contributors and non-contributors are in the same pool with the same benefits, rather than starting with the formal sector and then attempting to expand into the informal sector from there.
A sequencing of reforms will be contextual but might start with consideration of merger possibilities, depending on the political economy, which we discuss below. If those are not possible, compensation or equalization should be considered, which may meet less resistance as they do not directly threaten existing favoured group interests. This was the course taken by pooling reforms in Thailand, for example and Mexico (Mathauer et al., Reference Mathauer2020). If neither of these approaches is possible, then mitigation strategies such as harmonized data systems to prepare for future pooling reforms could be pursued.
Evidence in practice: the UCS in Thailand
The following example is based on the analysis carried out by Bertone, Pholpark and Witter (Reference Bertone, Pholpark and Witter2022).
Political background
During its modern history, Thailand has alternated periods of democracy with others of military rule. A major turning point was the 1997 Constitution (the “People’s Constitution”), which was the first to be drafted by a popularly elected Constitutional Drafting Assembly and entailed a reformist approach and renewed attention to civil liberties and public participation. This had important effects on the political and cultural context and influenced the results of the 2001 elections, paving the way for social reforms, including in the health sector.
However, the struggle to get the Constitution passed became intertwined with the Asian Financial Crisis of 1997. Thailand was one of the fastest growing economies in Asia between the 1960s and 1990s, but experienced cyclical economic crises, including the 1997 crisis, which led to the country relying on an International Monetary Fund support package to ensure recovery. The country completed the repayment of loans in 2003, but it took almost 10 years for gross national income per capita to reach 1997 levels. However, despite political and economic crises, social and health development has always been prioritized in Thailand, with a focus on pro-rural health development to help fight poverty.
In the 2001 elections, the newly formed, populist Thai Rak Thai Party led by Thaksin Shinawatra agreed with a proposal by health reformists to introduce a universal coverage programme that appealed to the mass electorate and won with a large popular mandate. Since 2001, the political history of Thailand has been dominated by the rise and fall from power of former Prime Minister Thaksin Shinawatra, and conflict over the rising military influence in politics.
Risk pooling context and reforms
Prior to the 2000s, there were multiple health risk pools in Thailand, including (i) the Civil Servant Medical Benefit Scheme (CSMBS) for government employees; (ii) SHI for private sector employees; (iii) a Health Welfare scheme for low-income households; (iv) a health coverage programme for older people; and (v) a public subsidized voluntary scheme for other population groups. Some 30% of the population was not affiliated to one of these explicit coverage programmes.
In 2002, the National Health Security Act was passed to set up the UCS, to provide essential health services for the population not covered by the civil servant and private sector employees’ schemes. This resulted in consolidation, with the low-income scheme, older people scheme and voluntary scheme all eliminated and explicit affiliation extended to all. This was later followed by the extension of health coverage to the stateless population in 2010, to ensure health coverage through annual budget subsidies for 0.45 million people, mostly marginalized minorities living in the mountainous northern provinces. Subsequently, there were several attempts to harmonize the three public health insurance schemes (CSMBS, SHI and UCS), without success. A new (successful) attempt started in 2012, with a focus on emergency medical services. Migrant VHI to provide health coverage to informal/undocumented migrant health workers was implemented in 2014, but with limited success because the scheme remains voluntary and needs to be purchased at designated one-stop service centres only in provinces where migrants reside.
Key features of the UCS
The aim of the creation of the UCS was to extend health coverage to the entire population. The scheme was tax-funded, initially with a co-payment of Baht 30 per visit or admission (which was then terminated in November 2006), to cover automatically those who were not covered by the civil servants’ or private employees’ schemes. It established a comprehensive benefits package, including a negative list, with a primary care focus and gatekeeping function. Strategic purchasing was introduced with a fixed annual budget per member (capitation based) and a cap on provider payments (age-adjusted capitation for outpatient services, and diagnosis-related groups within an annual global budget for inpatient services), which aimed to put a “hard” limit to the budget and contain costs. The reform also introduced a provider-purchaser split through the establishment of the National Health Security Office, responsible for purchasing health services, and its multistakeholder governing body, the National Health Security Board. The Board is chaired by the Minister of Health, and includes government officials, including the Ministry of Finance; representatives of local governments, nongovernmental organizations, health professionals and private hospitals; and experts in insurance, medical and public health, traditional medicines, alternative medicines, financing, law and social science. Overall, the reform has been considered a major success and has improved access to essential health services, especially for the poor and all the informal sector. It has decreased catastrophic expenditure and increased the satisfaction of the UCS’s beneficiaries and health care providers.
Analysis of the political economy of UCS reform
Analysis of the political economy of the UCS reforms using the WHO framework highlights the role of the change team in the design, adoption and implementation of the reforms. Technically strong, politically savvy and well-connected, the change team was ideologically committed to UHC, but seen as politically impartial and free from conflicts of interest. The change team was a close-knit group with key contacts inside and outside of the Ministry of Public Health. The change team demonstrated not only their technical skills and knowledge, but also their experience in navigating bureaucracy and governmental politics and their capacity to mobilize different sources of power at political, societal and international levels and use effective strategies to move the reform agenda forward. They saw themselves (and were in practice) policy entrepreneurs or “match makers” between evidence and politics.
Political leadership played a key role – UHC was promised in the Thai Rak Thai political manifesto and generated great popularity for the party, enabling it to win the election. Civil society was also a key player, strongly aligned to the UCS and working in alliance with the change team. The Ministry of Public Health was not a strong advocate as its financing authority was transferred during the reforms to the National Health Security Office as new purchaser. However, health workers were supportive of the scheme, having witnessed directly the access difficulties of the poor and informal sector workers, especially for high-cost interventions. The private hospital association and clinics were worried about losing business to public providers and wanted to maintain fee-for-service charging. The Ministry of Finance was neutral on the scheme, being mainly concerned with budget neutrality. International partners held less leverage, in that Thailand is not an aid-dependent country, but played a role in relation to normative power, with some players (such as the World Bank) being opposed initially, while others (such as WHO) were supportive and were mobilized by the change team.
In relation to strategies to manage the process of adoption, use of evidence and information was very important, along with coalition building, and enhancing the legitimacy of the policy (for example, by connecting to traditional social values in Thailand). Mobilizing support (for example, by creating alliances with civil society) and addressing opposition (for example, from beneficiaries of existing schemes who feared dilution of their benefits, from the Ministry of Public Health because of changes to its role, and from private providers) by meeting some of their demands were also key. In Thailand, the change team made strategic use of the evidence available and its capacity to generate locally relevant knowledge, based on experience and international literature. In relation to external actors, the change team drew on international learning early in the process, but also used international approbation to cement the reforms as the Thai experience was shared internationally and received a strong positive reaction. The successful reform of the scheme also highlights more overt political adoption strategies, including changing the decision-making processes (for example, shifting budget decisions to the Prime Minister to bypass challenges from the Ministry of Finance). Some of these, such as the establishment of the National Health Security Board and later the National Health Assembly, not only increased supporters for these reforms but also likely changed the margins of manoeuvre for future reforms.
Thailand’s reforms: summary
Thailand has managed to provide near-universal access to essential health care by establishing a risk pool on the basis of automatic entitlement which covers all who were not already members of the civil servants’ and private sector employees’ schemes, including the previously unaffiliated 30% of the population. The UCS replaced three previously existing schemes but did not change the status of those for civil servants and private sector employees. Instead, it compensated for the existence of those two by extending coverage to the population groups that did not have access to them and gradually increasing the level of per capita subsidy to the new UCS as a means to reduce inequities in benefits, which was a more politically expedient route. Tangcharoensathien and colleagues (Reference Tangcharoensathien2019) highlighted this as an example of path dependency: although a merger of pools would have been ideal, compromises had to be made to reduce threats to existing beneficiaries of other schemes, enabling overall gains despite reduced efficiency and equity relative to an optimal design.
The political economy of risk pool reforms
Risk pooling reforms are inherently controversial and political as they rely on a shared objective to move towards UHC, which itself depends on the existence of social solidarity – a willingness by the better-off and healthier to redistribute resources to the less well-off and sicker – and a feeling of connectedness with social groups despite their diversity (of ethnicity, religion, gender, region, caste, etc.). An investigation into solidarity for health risks across 24 countries in 2010 found wide support for assisting the poor and sick with health care costs, but only to some extent (most supported subsidies of half of the cost or less) (James & Savedoff, Reference James and Savedoff2010). Although results varied by country, there was also evidence of self-interest in that healthier respondents were less likely to express solidarity. This suggests mixed support for pooling reforms that focus on redistributing benefits. These reforms are also quite public in that the changes in entitlement commonly require legislative change too, which is more complex to manage than reforms in other areas of health financing which can be achieved through technical reforms (e.g. adjusting provider payments).
WHO has developed a framework for analysing the political economy of health financing, which is structured by six main domains (Sparkes et al., Reference Sparkes2019). It is interesting to consider each of these in relation to risk pooling and the kind of strategies which might enable more successful risk pooling reforms. The section below draws on work by Özçelik and colleagues (Reference McIntyre, Doherty and Gilson2003) to describe the potential political dynamics that play out during pooling reform, as well as strategies that were undertaken in a set of countries that successfully moved forward reform to manage these dynamics.
Interest group politics
Reforms are hard to achieve when perceived losses are focused on organized or higher profile groups, while potential winners are diffused. Where there is an entrenched private sector, or high-income group within society, that has claimed certain benefits and sees itself as standing to lose from reforms to pooling (as is the case with the challenges made to the adoption of the National Health Insurance in South Africa) the resistance can be protracted and well resourced (McIntyre, Doherty & Gilson, Reference McIntyre, Doherty and Gilson2003). The communication strategies around these reforms (and reform resisters) are often quite sophisticated, as the perceived losses may not accrue to the beneficiaries themselves, but rather to enterprises that enable coverage. This can be connected with inherent insurance market failures where relevant, whereby cream-skimming or risk profiling occurs by private sector actors in a way to maximize their profits rather than providing benefits for the whole. Strategies to manage interest group politics include building coalitions with groups that might favour reforms, engaging civic and professional groups before reforms and during the consolidation phase after they are implemented, mobilizing public support and ensuring a participatory approach to policy development. In recognizing the potential opposition to pooling expansion or consolidation, health reform leaders employed these strategies in Mexico and the Republic of Korea (Kwon & Reich, Reference Kwon and Reich2005).
Bureaucratic politics
Pooling reforms may threaten the role, resources and interests of influential organizations such as ministries and social insurance agencies, leading to blocking and other forms of resistance. This is particularly relevant in many LMICs where the government civil service often comprises a large share of the formal sector. This can create both a potential conflict of interest where a scheme already exists that extends preferential benefits to civil servants, and can also lead to capture, whereby SHI for the formal sector is put forward as a first step towards universal coverage reform. For example, these dynamics were present in Türkiye, but it was possible to put strategies in place to mitigate these bureaucratic interests. Beginning in 2001, plans were put in place to consolidate five pools under a new umbrella organization (Sparkes, Bump & Reich, Reference Sparkes, Bump and Reich2015). Strategies to manage resistance from the Ministry of Labour and Social Security, which operated the largest social security system in the country, aimed to persuade, placate and reassure those whose interests it represented. These strategies included: developing a clear vision in the Ministry of Health and its reform team; establishing an interministerial committee to voice and incorporate concerns from key ministries; using close personal relationships with the Prime Minister to address resistance; bundling the health care legislation with measures to address Ministry of Labour and Social Security concerns about retirement ages; and guaranteeing that no one would lose benefits through the reforms.
Budget politics
Reforms to pooling are often seen as presenting public finance risks to the Ministry of Finance in cases where the focus is on expansion of coverage expansion, while the Ministry of Health is seen as an advocate for more resources (though not always an effective advocate). To proactively manage these two sets of concerns, in Mexico, during the design of the Seguro Popular (People’s Health Insurance), the Ministry of Health set up an Economic Analysis Unit to produce technical evidence to support its plans and built a reform team within the ministry with technical, political and communication skills (Gomez-Dantes, Reich & Garrido-Latorre, Reference Gomez-Dantes, Reich and Garrido-Latorre2015). By institutionalizing the relationship between the Ministry of Health and the Ministry of Finance, concerns around fiscal sustainability could be incorporated into the reform plans as a way to build a coalition and assuage resistance. However, despite these efforts, the actual efforts to establish a single, unified risk pool at each state level did not succeed in Mexico.
Leadership politics
In the face of competing political and ideological interests, getting support from the head of government and making the risk pooling reforms a central part of a wider political manifesto can be effective, as illustrated in the Thai UHC reforms and, less successfully, in Mexico ((Tangcharoensathien et al., Reference Tangcharoensathien2019; Gomez-Dantes, Reich & Garrido-Latorre, Reference Gomez-Dantes, Reich and Garrido-Latorre2015). Framing policies in line with local historical and social values is key here. For example, in Ethiopia, it has been argued that the policy idea of health insurance secured elite commitment due to its fit with deeply held ideas within the ruling coalition concerning the importance of self-reliance and resource mobilization for development (Lavers, Reference Lavers2019).
Beneficiary politics
The implications of reforms in relation to changes in contributions and in benefits are not simple to communicate to the public and can also be subject to political capture. Where coverage has been extended to new population groups through expanded risk pools, this has often been communicated through political campaigning, making electoral promises through the media. This was the case in Ghana with the introduction of its National Health Insurance Scheme, which has gained traction with the public (previously widely opposed to the “cash and carry” user fee) to the extent that it is hard to envisage new governments or parties being able to withdraw the offer (Novignon, Lanko & Arthur, Reference Novignon, Lanko and Arthur2021). Democratic politics tend to encourage policies which increase coverage, though there are risks where this is done without adequate funding or implementation support (Witter & Adjei, Reference Witter2007; Yates, Reference Yates2009).
External actor politics
External actors can play a crucial role in the design and implementation of health financing policies in LMICs (Chi & Bump, Reference Chi and Bump2018) and often have distinct agendas, which are sometimes in competition with one another as well as domestic policies. In particular, historically, global health institutions have funded priority programmes, creating fragmentation of risk pools by disease area (Biesma et al., Reference Biesma2009). Domestic fiscal capacity is a key factor, but even in aid-dependent settings, domestic reform teams can influence external actor policies through the development of clear national strategies, evidence and capacity to deliver, as well as drawing on their local legitimacy. A number of key pooling reforms, such as the National Health Insurance Scheme in Ghana and user fee removal in Uganda, took place despite, not because of, external actors, although they were engaged in technical support after the decision had been taken. However, despite these reforms, in both countries vertical, disease-oriented risk pools persist to this day, showing how powerful these interests can be in a system.
Policy relevance and conclusions
Risk pooling is critical for reducing the exposure of individuals and their families to health-related financial risks and securing equitable access to health services, alongside other relevant health financing reforms as described. Historical performance in relation to UHC has been significantly associated with the level of pooled financial resources for health per capita (Global Burden of Disease Health Financing Collaborator Network, 2018). As risk pooling becomes more integrated, the uncertainty associated with health care expenditure can be reduced. Its importance is well recognized, as reflected in the WHO Health Financing Progress Matrices, which set a norm that pooling structures and mechanisms across the health system enhance the potential to redistribute available prepaid funds, and that health system and financing functions are integrated or coordinated across schemes and programmes (Jowett et al., Reference Jowett2020).
Risk pooling also affects and is affected by other health financing functions, including the health financing institutions, their governance, information flows and trust placed in them (Smith & Witter, Reference Smith and Witter2004). Revenue-raising policies determine the prepaid share of health expenditure and whether funds are raised equitably (Mathauer et al., Reference Mathauer2020). Pooling reforms are necessary but not sufficient to achieve redistribution if appropriate arrangements for purchasing health services are lacking (Kutzin, Cashin & Jakab, Reference Kutzin, Cashin and Jakab2010). These arrangements include setting suitable and coherent incentives for providers to deliver quality and equitable health care services. Provider payment methods and amounts of payments to health care providers should in general (unless there is a need for enhanced benefits) be the same for all members of the pool, independent of whether people pay direct contributions or not.
Misalignment of pooling and purchasing arrangements is common, including in systems funded from tax revenues with universal entitlement on a noncontributory basis, in which the health budget is the dominant pooling arrangement; for example, if budgets and funds are poorly allocated across programmes and areas (and hence those programmes and areas become distinct pools) or if payment methods reflect and reinforce the distribution of service providers and infrastructure rather than population health needs. The nature of the benefits package is also key to the type of risks pooled (and the degree to which they are predictable or not) and the extent to which any cost-sharing obligations effectively limit the OOP liability of individuals relative to their capacity to pay. Effective public financial management procedures are also key, including those that determine how budgets are formulated and implemented.
Wider epidemiological factors are also crucial for risk pooling – as chronic illnesses rise, for example, risks become more predictable for some population groups (for example, those who are HIV-positive or diabetic), which present predictable health care needs. These reduce the redistributive capacity of the pools; a substantial emphasis on prevention and health promotion will therefore be appropriate to reverse that trend and maintain risk pooling.
The evidence is clear on different pooling arrangements, their effects and how they can be mitigated in theory (through the various strategies for defragmentation, linked to appropriate changes to other connected health financing function), but understanding how to manage the politics of reform is more challenging, and this is an important focus for evidence gathering at present (Witter et al., 2024). Work is underway to document comparative lessons in how to overcome political economy blockages to reforms in different settings (and how these link to context features, such as the history and political settlement), as well as how shocks, such as the COVID-19 pandemic, may (or may not) be used to enable reforms (Witter et al., 2025). Lessons on sequencing, engagement strategies for the wide range of actors (internal and external) with power to advance or block agendas, and the capacities needed will be important to the next wave of pooling reforms globally.Footnote 1
Key messages
Chapter 2.2 investigates the design and implementation of health benefits packages (HBPs) in different contexts. A benefits package is the range of health care goods and services that people covered by a system or scheme are entitled to or should be able to access. Key learning includes that:
All health systems have budgetary constraints and set some limits to entitlement, and therefore have some kind of benefits package.
Benefits packages may be explicitly defined or implicit only, with the latter more common in high-income countries (HICs) and the former more common in low- and middle-income countries (LMICs).
What is included or excluded, and the ways these decisions are made, vary widely but well-designed benefits packages should address population health needs and ensure the efficient use of health system resources.
Defining a package of care is complex and often highly sensitive – using evidence and economic evaluation to determine what to include (or exclude) supports efficiency and equity and allows policy-makers to explain and defend their choices.
There are a range of evidence-led instruments that can support policy choices such as health technology assessment (HTA), which incorporates economic evaluation.
Any decision-making process should:
○ gain agreement and buy-in from key stakeholders on the ultimate goals of the benefits package and the level of explicitness;
○ take into account the specific characteristics of the setting where the benefits package will be implemented, including its cultural values, market configuration, political system and wealth.
Introduction
Every country’s health care system embodies some form of benefits package – the range of health care treatments or services that should be accessible to those individuals entitled to health services in the country concerned. In countries with a national health service or national health insurance, this would normally be the whole population. In countries with social security or private insurance health care, the entitled individuals would be the members of the insurance plan. Explicit HBPs can serve several purposes, including setting standards for health care, or specifying the basic services that should be made available to all eligible individuals. They also offer the possibility for using analysis, such as HTA, incorporating economic evaluation, to determine which services should be included or excluded. However, in many HICs the HBP may be implicit, or defined only in general terms (e.g. free access to primary and secondary care services). Therefore, the role of analysis in setting the benefits package tends to be limited to decisions on whether new health technologies should be reimbursed. Explicit benefits packages, with more definition of the services included, are more common in LMICs, often in the context of initiatives to implement universal health coverage (UHC) (Jehu-Appiah et al., Reference Jehu-Appiah2008; Youngkong et al., Reference Youngkong2012). However, in HICs, in the absence of explicit benefit catalogues, inpatient and outpatient remuneration schemes often have the character of implicit or less explicit benefit catalogues (Schreyögg et al., Reference Schreyögg2005).
When elaborating on population coverage and benefits packages it is important to define the terms used as well as the scope of this chapter. We follow the definition of the EU HealthBasket project (Schreyögg et al., Reference Schreyögg2005) and use the term “benefit basket” to be synonymous with “benefits package”; we differentiate these from “benefit catalogues”. Benefits package refers to the totality of services, activities and goods covered by publicly funded statutory/mandatory insurance schemes (i.e. social health insurance (SHI)) or by national health services. Benefit catalogues are defined as the documents (e.g. for inpatient and outpatient care or for pharmaceuticals) in which the different components of the benefits package are stated in detail. These benefit catalogues can either be defined rather generally (e.g. inpatient care after acute myocardial infarction (AMI)) or by enumerating services or procedures in a more detailed way (e.g. insertion of stents after AMI) (Schreyögg et al., Reference Schreyögg2005). Especially in LMICs, but also in HICs, there may be a disconnect between the aspirational health plans and the actual availability of funds and resources. It thus seems important to distinguish the benefits package offered in theory and the care actually received by patients (Glassman et al., Reference Glassman2016).
Further, a given benefits package can be characterized by different dimensions of coverage. “Breadth” can be defined as the extent of the covered population (e.g. certain parts of the population or full coverage). “Depth” is defined as the number and character of covered services (e.g. hip replacement for all persons up to the age of 80 years). The third dimension, “height”, specifies the extent to which costs of the defined services are covered by financial resources (e.g. full reimbursement of services versus cost-sharing requirements for certain services) (Busse, Schreyögg & Gericke, Reference Busse, Schreyögg and Gericke2007). Fig. 2.2.1 displays the three dimensions of a benefits package. An ideal HBP would fill this box as much as possible. In this chapter we mainly focus on the “depth” dimension (service coverage).
A benefits package involves consideration of coverage in terms of cost, service and population

In terms of service coverage, there are different ways of defining which services are included in the benefit catalogues forming a benefits package. Definition may be based on need, if enough financial resources are available to cover all the services required to address population needs. However, since most countries recognize the scarcity of resources, criteria such as effectiveness, cost–effectiveness or budgetary impact are often taken into consideration. An explicitly defined benefit catalogue, and more general benefits package, usually requires the formulation of evidence-based allocation criteria.
This chapter discusses the role of explicit benefits packages in achieving efficiency and equity in health care provision. It reviews the arguments for and against explicit benefits packages, provides examples from different health care contexts, and discusses the challenges in setting a benefits package. Although the chapter discusses a broad range of issues, one specific focus is on the use of evidence in determining the benefits package, in particular the use of HTA, incorporating economic evaluation.
The case for and against explicit benefits packages
The advantages of setting an explicit benefits package have been documented by Glassman et al. (Reference Glassman2016) (Box 2.2.1). The advantages, along with the potential limitations, have been further discussed by Smith and Chalkidou (Reference Smith and Chalkidou2017), using the English National Health Service as an example. They argue that an explicit package would: (i) encourage equitable access to health services, by reinforcing the principle of horizontal equity (i.e. equal access for equal need); (ii) ensure maximum benefit from the funds available, if appropriate cost–effectiveness criteria were used for coverage; (iii) improve transparency and clarity for the public, thereby empowering individuals in dealing with providers; (iv) provide clear signals to the market, by identifying which services will and will not be reimbursed; (v) protect politicians and clinicians from special pleading, reducing the risk of undue influence and corruption; and (vi) promote clarity for those involved in planning, funding and operating the health care system, by helping to identify where the highest priorities exist.
1. It creates explicit entitlements for patients, whose access to services might otherwise be largely determined by clinical professionals, with the consequent potential for arbitary variations in access.
2. It helps to identify whether funds are being spent wisely on services that create the maximum benefit for the society.
3. By specifying the services to be delivered, it facilitates important resource allocation decisions, such as regional funding allocations, and other planning functions, creating a precondition for reducing variations in care and outcomes.
4. It facilitates orderly adherence to budget limits, which might otherwise be attained only through arbitrary restrictions on access and services.
5. It reduces the risk that providers will require informal payments from patients to secure access to high-value services.
6. The entitlements created empower poor and marginalized groups, who cannot be made aware of any specific entitlement without an explicit health benefits package.
7. It create the preconditions for a market in complementary health insurance for services not covered, with a number of potential benefits for the health system as a whole.
Furthermore, Smith and Chalkidou (Reference Smith and Chalkidou2017) identify some of the potential challenges in setting an explicit benefits package: (i) the practical difficulties in specifying a package; (ii) the possible inhibition of innovation, if the package is not regularly updated; (iii) restrictions on legitimate variations in services, if local needs vary from place to place or among individuals; (iv) the creation of serious political and legal difficulties, if the package is perceived as giving priorities for some groups over others, or inappropriately rationing care; (v) the difficulties caused by existing rigidities in the health care system, making changes in care difficult or costly; and (vi) the creation of uncertain financial liabilities, by making it difficult to limit access to services even if there is no budget.
In addition, politicians may be reluctant to engage in discussions on allocation decisions being inevitably linked to setting explicit benefits packages. The openness of societies to discuss allocation decisions in health care is certainly also determined by the culture and history of a given country (Torbica, Tarricone & Drummond, Reference Torbica, Tarricone and Drummond2018). While, for instance, in the United Kingdom allocation decisions based on cost–effectiveness thresholds are commonly acceptable, historically, decision-makers in Germany have tended to avoid public allocation discussions as they may be too politically contentious. Moreover, since HICs use reimbursement schemes as benefit catalogues, they have to consider the incentives for providers and patients. Fee-for-service (FFS) schemes explicitly listing single items to be reimbursed may lead to an overprovision of services.
The fact that relatively few HICs have a detailed explicit benefits package, listing items to be reimbursed, suggests that these limitations are perceived to be more important than the potential advantages, at least by the decision-makers who would be responsible for setting an explicit package. Many of the practical difficulties, such as the information required to set and update a package, could be overcome, albeit with some effort. This will be discussed later. However, it may be more difficult to overcome decision-makers’ views about the political problems arising from setting a detailed explicit package, if it is perceived to make rationing more explicit or to reduce budgetary control. Nevertheless, it is important to recognize that failure to specify an explicit benefits package can cause similar political problems. The most obvious manifestation of this is the problem observed in many Latin American countries, where health is considered a basic right under the constitution. This has led to a situation where individuals often take legal action (known as “right-to-health litigation”) to secure access to expensive health technologies that are not routinely available in the country’s health care system (Reveiz et al., Reference 195Reveiz2013). This can pose a threat to the health care budget, and/or distort health care priorities.
Evidence in practice: examples of setting explicit HBPs
Despite the practical challenges of setting an explicit HBP, several examples of doing this exist. Five case studies are discussed in this section, reflecting different health care settings and challenges for the process of developing and implementing a benefits package. The first case study on Italy exemplifies the approach of a HIC, with a decentralized national health service, to update its existing benefit catalogues. The second case of German inpatient care illustrates the trend in several HICs to move from rather implicitly defined to more explicitly defined benefit catalogues, including the challenges involved with this. The third case discusses a value-based approach for determining access to medicines, in a private health insurance setting of the USA. The fourth case study describes how Chile, an upper-middle-income country (UMIC), used an HBP to improve the quality of, and access to, health care for all of its citizens.
The final case study considers the establishment of HBPs in a LIC, and shows how an analytic framework based on economic evaluation can be used to support the development of an explicit benefits package. It might be argued that this poses additional challenges, since the relevant data and skills, although not absent, may not be as available as in HICs. In addition, the criteria considered in setting the package may place a greater weight on improving the equality of access to services, particularly for vulnerable groups and family welfare more generally. For example, in their work considering the inclusion of health interventions in the benefits package in Thailand (a UMIC), Youngkong et al. (Reference Youngkong2012) applied the criteria of “economic impact on household expenditure” and “equity, ethical and social implication”, alongside criteria such as effectiveness, disease severity and size of the population affected.
Example 1: Evolving a benefits package over time in the Italian National Health Service
The Italian National Health Service (INHS), known as Servizio Sanitario Nazionale, is characterized by universal coverage, providing comprehensive health care services to all citizens and residents across national territory. The issue of an HBP in Italy is deeply embedded in the history of the INHS and its reforms over the past four and a half decades. One of the main features of these reforms has been a progressive decentralization of the health care system, with regional governments gaining greater decision autonomy in planning, organizing and delivering health care services to their residents. While decentralization aimed to allow regions to tailor health care services to meet the unique requirements of their populations, it inevitably led to shaping a complex relationship between the central state and the various regions over a series of issues. The definition of what should be included in the HBP has been much debated within Italy’s health care system. The benefits package, intended as the overall set of services guaranteed to citizens under public coverage across the whole country, has changed over the years in its form, contents and objectives to become increasingly explicit.
From 1978 to 2017
The principle of a benefits package available to all citizens irrespective of age, social condition or income was introduced when the INHS was established in 1978. Although the law introducing it listed the areas in which treatments were to be delivered directly by the INHS and used the expression “levels of care”, it was only in its health sector reforms of 1992/1993 that the national government explicitly defined the set of services to be provided under INHS coverage (“uniform levels of care”, livelli uniformi di assistenza, LUA). Since then, regions have been held accountable for providing the services included in the benefits package with the budgets allocated from the central government. In cases of overspending, the regions are financially responsible to cover the extra expenditure in order to guarantee the provision of the benefits package. They can also expand the services beyond what is set at the national level provided that they use their own resources. But there were demands for the benefits package to be made more explicit still. In the late 1990s, the National Health Plan produced guidelines as to what else was needed: a definition of principles (decision criteria), the amount of per capita funding required to provide guaranteed services, and a set of tools to monitor the implementation across regions. Subsequent reform, in 1999, specified guiding principles to determine the health care services to be included the benefits package – human dignity, effectiveness, appropriateness and efficiency. Underlining the importance of the equity principle in the access of care, the reform introduced a new expression – “essential level of care” (livelli essenziali di assistenza, LEA). Much debated during the years since, LEAs are considered key policy tools to regulate the relations (mainly financial) between the state and the regions and to ensure territorial equity within national borders. The services included at different levels of care, from community to hospital services, were defined at that time in a national law of 2001, and remained a pivotal element of the Italian HBP until its most recent redefinition in 2017.
Italy’s health benefits package today
The services included in the benefits package are now defined at three major levels: (i) collective prevention and public health; (ii) community health care services; and (iii) hospital/inpatient care. A Permanent Committee within the Ministry of Health has responsibility for verifying and monitoring the provision by the regions of all services in the benefits package in line with the principles of appropriateness and efficiency in the use of resources, as well as ensuring congruity between the services to be provided and the resources made available by the central government. In 2020, a National Commission responsible for updating the LEA was established with a three-year remit to ensure systematic and regular updating of the benefits package.Footnote 1
HTA, and more specifically economic evaluation, is also playing a role in shaping the benefits package in Italy, though so far it is largely limited to the evaluation of health care technologies for reimbursement decisions, namely pharmaceuticals and medical devices.
For pharmaceuticals, the Italian Medicines Agency (Agenzia Italiana del Farmaco, AIFA) undertakes the assessments. The decision-making power is concentrated in the Price and Reimbursement Commission (Comitato prezzi e rimborso, CPR), a technical body with 12 expert members that oversees the appraisal process. The criteria for appraisal include the degree of innovation, availability of existing products and extent of therapeutic benefit using clinical effectiveness, cost–effectiveness, risk-benefit ratio and budget impact studies, which constitute a support tool in the decision-making process. This type of assessment is used to support pricing and eligibility for reimbursement decisions and de facto determines which pharmaceuticals are included in the Italian benefits package and which are not.
The evaluation of medical devices is undertaken as part of the National Health Assessment Technology Programme for Medical Devices. The Programme was introduced by the Italian Stability Law of 2015, after a highly participatory, stakeholder-engaged, structured process of harmonization and centralization to address the hitherto fragmented system of appraisal and approval (Tarricone et al., Reference Tarricone2021). The main objective is to ensure effective stewardship and guarantee equal access to innovative technologies in all parts of the nation, notwithstanding the decentralized nature of the INHS. The Programme includes the most updated methods in assessing medical devices, coherent with those developed by EUnetHTA (www.eunethta.eu) and other international scientific consortia, such as, MedtecHTA (www.medtechta.eu), and links the recommendations of HTA with the most relevant policies in the health domain: coverage, reimbursement and procurement of medical devices. This initiative has the potential to break the traditionally “siloed” mentality and to foster a value-based approach in prioritizing, assessing, introducing and diffusing new technologies in the INHS.
Example 2: Germany: from an implicitly defined to an explicitly defined benefits package
A core principle of the German health care system is the sharing of decision-making powers between the governments of the federal states, the federal government and designated self-governmental institutions. Responsibilities are traditionally delegated to self-governing institutions of payers and providers that are involved in financing and delivering health care. Payers (sickness funds) and providers (physicians, dentists and hospitals) are represented by their associations, which are recognized as corporate bodies. These bodies constitute the structures of self-government that operate the financing and delivery of benefits covered by the Statutory Health Insurance scheme within the legal framework of the Social Code Book V. The most important body for the benefit negotiations between sickness funds and providers, concerning the scope of benefits, is the Federal Joint Committee (G-BA). Based on the legislative framework, the Committee issues directives relating to all sectors of care. The main body of the Committee consists of five representatives of the sickness funds, five representatives from provider groups, two neutral members and a neutral chairperson. The directives of the Committee are legally binding for all actors in the Statutory Health Insurance scheme. These directives primarily concern the coverage of benefits and ensure that Statutory Health Insurance services are adequate, appropriate and efficient. Beyond these general goals, the actual criteria for benefit definitions vary largely between sectors and types of catalogues (Blümel et al., Reference Blümel2020; Busse, Stargardt & Schreyögg, Reference Schreyögg2005).
In the outpatient sector, a service provided must be proven to fulfil the criteria “expedience, necessity and cost–effectiveness” to be included in the catalogue of services and benefits. In contrast, health care services in the inpatient sector will only be excluded from the benefit catalogue of the sickness funds if the criteria are proven to be unfulfilled (Busse, Stargardt & Schreyögg, Reference Schreyögg2005). For this reason, several health care services provided in the inpatient sector are not included in the benefit catalogue of the outpatient sector. In other words, any authorized new procedure or service in inpatient care can be provided by hospitals on behalf of the Statutory Health Insurance scheme. The ability of hospitals to provide a certain service is primarily regulated by prices via the diagnosis-related group (DRG) catalogue and its appendices for cost-intensive drugs and procedures (see Chapter 3.2). The rationale behind this practice of setting the benefits package is that new (experimental) services should first be incorporated and tested in inpatient care before they are allowed to diffuse into outpatient care. For pharmaceuticals, like the benefit regulation in inpatient care, the benefits package includes all authorized products launched on the German market. There is no positive list for pharmaceuticals. The availability of a given pharmaceutical on the German market, and therefore being part of the benefits package, is mainly determined by price regulation.
The decisions on benefits taken by the G-BA finally shape the benefit catalogues of the different health care sectors, which were originally introduced for reimbursement purposes. Thus, the level of explicitness varies between sectors. FFS-based catalogues in outpatient care, such as the Einheitlicher Bewertungsmaßstab for physician services or the Einheitlicher Bewertungsmaßstab für zahnärztliche Leistungen for dental care services, list most reimbursable services and procedures in detail. In contrast, the DRG catalogue for inpatient care started in 2003 with 664 DRGs, which were meant to reimburse all services unless excluded by the G-BA. Therefore, in 2003 the approach of defining the benefit catalogue in inpatient care could be characterized as quite implicit. However, Gibis, Koch and Bultman (Reference Gibis, Koch, Bultman, Saltman, Busse and Figueras2004) anticipated that the DRG catalogue would be extended over time to a more detailed benefit catalogue, where most approved interventions are listed and grouped around the relevant diagnoses.
Indeed, in the last 10 to 20 years, the German health care system has moved towards a more explicitly defined benefits basket. Since the inception of the G-BA in 2004, the number of issued directives on reimbursement of benefits has increased substantially compared with its predecessor committees. This has led to more inclusions and exclusions of benefits in inpatient and outpatient care, and has certainly contributed to a more explicit definition of benefits and in reimbursement catalogues. However, the most noteworthy change towards a more explicit definition of benefits took place in inpatient care.
In 2003, the DRG catalogue was introduced for inpatient care with the ambitious aim of reimbursing all inpatient services across all care structures, including academic medical centres with highly complex services. With 664 DRGs, the diagnoses-led catalogue acted as a rather implicitly defined benefit catalogue. It soon became clear that a given DRG did not sufficiently cover certain cost-extensive services and led to the threat of implicit rationing of certain services. This exerted a lot of pressure on the self-governing institutions to split DRGs and add reimbursement components. Thus, the DRG catalogue has been slowly transformed into a procedures-based catalogue with 1275 DRGs (50% of those is triggered by at least one procedure) and 275 fixed supplementary payments for explicitly mentioned high-cost drugs and procedures. On top of this, several other reimbursement components, such as separate payments for new technologies and negotiated supplementary payments for more established new technologies, were introduced (Ex & Henschke, Reference Ex and Henschke2019).
The case of the German DRG-catalogues reveals how what started out as an implicitly defined diagnoses-led catalogue can be transformed to an explicitly defined benefit catalogue without changing the rules for inclusion or exclusion of benefits. However, this development had certain side-effects. The more procedure-based catalogue led to incentives to increase treatment volume and treatment intensity (Bäuml & Kümpel, Reference Bäuml and Kümpel2021; Schreyögg et al., Reference Schreyögg2014). It also created incentives to favour operative procedures over conservative procedures, since operative procedures receive a higher reimbursement price (see Chapter 3.2 for more on methods for paying hospitals).
Example 3: HBPs under private health insurance – the Premera Blue Cross value-based formulary in the USA
The private health insurance sector of the USA’s health care system comprises more than 900 health plans. These plans offer individuals and their employers health care coverage for an annual premium, and also stipulate co-payments for some services. An important component of the HBP is the drug formulary, which determines the access to medicines for plan enrollees. Typically, health plan formularies contain most available drugs, organized in tiers, with the level of patient co-payment varying by tier, with inexpensive generic drugs being placed on a tier associated with a low co-payment. Branded drugs and expensive specialty drugs would be placed on tiers associated with higher levels of co-payment. In most health plans, formulary placement decisions are made by a Drug and Therapeutics Committee. Clinical evidence of drug effectiveness and safety is considered, but the use of economic evidence is sparse.
Premera Blue Cross is a large not-for-profit health plan in the Pacific Northwest which has used economic evaluation as part of its decision-making in the adoption of new health technologies. In 2010 it decided to implement a value-based drug formulary, in which drugs would be placed on tiers based on their value for money, rather than based on their acquisition cost. It was considered that aligning the individual drug’s co-payment to its specific value might yield greater clinical and economic benefits. However, in making this change, the health plan was also conscious of any impact it might have on enrollees’ costs or utilization of medicines, since health plans in the USA operate in a competitive environment. This is different from setting a benefits package in a publicly funded or social security system, where individuals cannot change their basic health insurance because of changes in the benefits package, although they do have the option of paying for supplementary private insurance.
The design, implementation and first-year outcomes of the value-based formulary were analysed and discussed in academic literature (Sullivan et al., Reference Sullivan2015). Value was assessed primarily by cost–effectiveness analysis, with the value for money of each drug assessed by the level of the incremental cost–effectiveness ratio (ICER) compared with the most relevant alternative (e.g. basic supportive care or an alternative drug). The value-based formulary was designed as a four-tier system, plus a “preventive” tier, for which the co-payment was set at zero. Higher rates of co-payment were set for the other four tiers based on commonly used cost–effectiveness thresholds identified from a literature review (Sullivan et al., Reference Sullivan2015). To allow for the fact that the ICER does not consider all the factors that might be relevant for formulary listing decisions, a “special case” category was created to allow for other aspects of social value, such as treatment for serious rare conditions for which there was no other acceptable treatment. The main difference between the value-based formulary and a standard formulary was that drugs with higher acquisition cost were not automatically assigned to a higher tier. They might be assigned to a lower tier if the benefits outweighed the costs. The tiers, ICER thresholds and co-payment levels are shown in Table 2.2.1.
| Tier | Typical case ICER threshold | Special case ICER threshold | Co-payment (US$)Footnote a |
|---|---|---|---|
| Preventive | Not applicable | Not applicable | 0 |
| Tier 1 | Cost saving or <US$ 10 000/QALY | Cost saving or <US$ 50 000/QALY | 20 |
| Tier 2 | US$ 10 000–<US$ 50 000/QALY | US$ 50 000–US$ 150 000/QALY | 40 |
| Tier 3 | US$ 50 000–US$ 150 000/QALY | >US$ 150 000/QALY | 65 |
| Tier 4 | >US$ 150 000/QALY or insufficient evidence to determine ICER | Insufficient evidence to determine ICER | 100 |
ICER: incremental cost–effectiveness ratio; QALY: quality-adjusted life-year.
a Amount of the retail co-payment for 30-day supply of medicine.
In constructing the formulary, the clinical safety and effectiveness assessment followed Premera’s normal practice. The value assessments were made by reviewing available ICER estimates from a variety of sources including: (i) economic models provided by manufacturers in their formulary submission; (ii) published economic studies; (iii) the Tufts Cost–Effectiveness Analysis registry (Tufts Medical Center, 2021); (iv) Cochrane Collaboration reviews; and (v) reviews by health technology agencies. In cases where no suitable evidence existed, Premera conducted its own economic analyses. Within the first year, value assessments were produced for drugs in each of the 25 highest volume drug classes used by Premera members in the previous year, accounting for approximately 75% of total drug utilization within the plan.
Since Premera was the first health plan to develop a value-based formulary, the level of acceptability to enrollees was unknown. Therefore, the new value-based formulary was initially only offered to Premera’s employees and dependents enrolled in the standard preferred provider organization (Premera Associates Plan). Sullivan and colleagues (Reference Sullivan2015) report the results of the first-year evaluation. The distribution of drugs across the tiers were markedly changed, with 39.9% being on the new “preventive” tier, 14% on Tier 1, 36% on Tier 2, 7.4% on Tier 3 and 2.7% on Tier 4. Pharmacy costs decreased by 3% compared with the previous 12 months and 11% compared with expected costs. There was no significant decline in medication use or adherence to treatments for patients with diabetes, hypertension or dyslipidaemia. Sullivan and colleagues (Reference Sullivan2015) argue that these results suggest that it is possible to implement a value-based formulary in a USA employer-based health plan and achieve efficiency and value gains.
A longer-term evaluation of the value-based formulary, using an interrupted time series of employer-sponsored plans from 2006 to 2013, was reported in another paper by Yeung and colleagues (Reference Yeung2017). They compared 5235 beneficiaries exposed to the value-based formulary with 11 171 beneficiaries in plans without any changes in pharmacy benefits. The primary outcome compared was medication expenditures from member, health plan and overall (member plus plan) perspectives. Secondary outcomes were medication utilization, emergency department visits, hospitalizations, office visits and nonmedication expenditures. It was found that member medication expenditures increased by US$ 2 per member per month (95% CI US$ 1–US$ 3), whereas plan medication expenditures decreased by US$ 0 (95% CI US$ 18– US$ 2), resulting in a net decrease of US$ 8 (95% CI US$ 15– US$ 2). This translated into net savings of US$ 1.1 million. Utilization of medicines moved into lower tiers increased by 17%, but total medication utilization, health services utilization and nonmedication expenditures did not change.
Example 4: Using the development of a health benefits package to improve the access and quality of services in a middle-income country – the Acceso Universal con Garantias Explicitas (AUGE) in Chile
Like several countries in Latin America, Chile relies on SHI to provide health care to a substantial proportion of its population. However, its insurance scheme has been criticized over the years for having two separate components. The first is a large public insurer (Fonasa), using mostly public providers, covering about 75% of the population including those on low and middle incomes and indigent citizens. The other component consisted of several private insurers (Isapres), using mostly private providers, covering a further 16% of higher income citizens.
This fragmentation led to differences in the content and quality of services, and the level of access to them. Prior to 2005, Fonasa did not have an explicit benefits package and there was rationing of care through queues, denial of services and provision of low-quality services. Also, different Isapres could offer different health plans, with a different range of services of different levels of quality. The lack of a benefits package was seen as a major weakness of the scheme overall, which allowed for divergences in coverage between Fonasa and Isapres and for risk selection and limited risk pooling in the Isapres (Bitran, Reference Bitran2013).
Therefore, in 2005, Chile’s government introduced the Universal Access with Explicit Guarantees (Acceso Universal con Garantias Explicitas – AUGE), which defined a basic HBP consisting of guaranteed and explicit treatments for 56 priority health problems. This was expanded to 69 priority problems in 2010 (see Table 2.2.2).
Priority health problems in tde AUGE benefits package
1. End-stage chronic renal failure
2. Operable congenital heart disease (under 15 years of age)
3. Cancer of the uterus or cervix
4. Cancer pain relief and palliative care
5. Acute myocardial infarction
6. Diabetes mellitus type I
7. Diabetes mellitus type II
8. Breast cancer (15 years of age or more)
9. Spinal dysraphia
10. Scoliosis surgery (under 25 years of age)
11. Cataract surgery
12. Total hip replacement in people with severe osteoarthritis of the hip (65 years of age or more)
13. Cleft palate
14. Cancer (under 15 years of age)
15. Schizophrenia
16. Testicular cancer (15 years of age or more)
17. Lymphoma (15 years of age or more)
18. HIV/AIDS
19. Ambulatory care lower acute respiratory illness (under 5 years of age)
20. Ambulatory pneumonia (65 years of age or more)
21. Primary or essential arterial hypertension
22. Epilepsy (non-refractory) (1 to 15 years of age)
23. Prevention and education for oral health (6 years old)
24. Prematurity – retinopathy of prematurity –deafness of prematurity
25. Conduction disturbance for those with pacemakers (15 years of age or more)
26. Bladder cancer preventive cholecystectomy
27. Gastric cancer
28. Prostate cancer
29. Adult leukaemia
30. Strabismus (under 9 years of age)
31. Diabetic retinopathy
32. Retinal detachment
33. Haemophilia
34. Depression (15 years of age or more)
35. Benign prostatic hyperplasia
36. Acute stroke
37. Chronic obstructive pulmonary disease
38. Bronchial asthma
39. Newborn respiratory distress syndrome
40. Orthesis and aids (65 years of age or more)
41. Deafness (65 years of age or more)
42. Ametropia (65 years of age or more)
43. Eye trauma
44. Cystic fibrosis
45. Severe burns
46. Alcohol and drug dependency (10 to 19 years of age)
47. Pregnancy and delivery integral care
48. Rheumatoid arthritis
49. Knee arthrosis (55 years of age or more) and hip arthrosis (60 years of age or more)
50. Intracranial aneurysm and venous malformation rupture
51. Central nervous system tumours
52. Herniated nucleus pulposus
53. Dental emergencies
54. Dental care (65 years of age or more)
55. Politrauma
56. Traumatic brain injury
57. Retinopathy of prematurity
58. Bronchopulmonary dysplasia of prematurity
59. Bilateral sensorineural hearing loss of prematurity
60. Epilepsy in patients over 15 years of age
61. Bronchial asthma in patients over 15 years of age
62. Parkinson disease
63. Juvenile idiopathic arthritis
64. Secondary prevention of chronic renal failure
65. Hip dysplasia
66. Integral oral health in pregnant women
67. Multiple sclerosis
68. Hepatitis B
69. Hepatitis C
The AUGE not only guaranteed access to treatments for these priority programmes, but it also guaranteed quality of care by explicit definition of the interventions to be provided and the treatment protocols to be used, the adoption of maximum waiting times for treatment and limits on out-of-pocket (OOP) spending for health care. The Ministry of Health and Ministry of Finance determine the content of the benefits package, taking into account the burden of disease, the share of the population suffering from the disease, the expected cost per beneficiary, the supply capacity of the health network and the effectiveness of the interventions. Since the AUGE reform, there has been a sizeable increase in total health spending from both public and private resources, but by 2013 it had stabilized at around 7.5% of gross domestic product (GDP) (Bitran, Reference Bitran2013). The financial management of the AUGE has mainly been at an aggregate level, by monitoring the average cost per beneficiary, rather than by cost–effectiveness assessments of the services provided.
As reported by Bitran (Reference Bitran2013), there have been several evaluations of the AUGE. Bitran, Escobar and Gassibe (Reference Bitrán, Escobar and Gassibe2010) assessed the impact of AUGE on access to care, treatment outcomes, hospitalization rates and medical (sick) leave rates for six chronic conditions, including hypertension, diabetes and depression. For most of these conditions the reform increased access to services, increased coverage and in some cases reduced hospital fatality rates. A study by Valdivieso and Montero (Reference Valdivieso and Montero2010) found that AUGE’s access guarantee has been a powerful instrument to improve equity in health care.
However, the consequences of AUGE for health system efficiency had not been measured by 2013, and there have been few assessments of the cost–effectiveness of individual health care interventions in Chile. Nonetheless, Bitran (Reference Bitran2013) suggested that allocative efficiency may have been improved by the selection of cost-effective treatments in AUGE’s benefits package, and that productive efficiency may have also improved through the adoption of explicit treatment protocols. However, an increased use of HTA including economic evaluation, particularly in the adoption of new treatments within AUGE, may generate further benefits. The opportunities and challenges of using economic evaluation in a LMIC are discussed in the next case study.
Example 5: Economic analysis in supporting the development of a health benefits package in Malawi
The constraints on the availability of public resources for health care in LMICs limits access to necessary services and shifts costs to patients and their households, inevitably resulting in financial hardship. Consequently, the development of HBPs is becoming increasingly frequent in these countries in relation to SDG 3.8 – UHC. Benefits packages have the potential to guide investment and strengthen weak health systems, while being mindful of budget constraints. However, the process of benefits package design in these contexts is often opaque and not informed by explicit analysis. In particular, one of the greatest limitations in the low-resource setting is that the health opportunity cost of decisions is rarely accounted for.
Ochalek and colleagues (Reference Ochalek2018) reported on the development of an analytic framework to guide resource allocation within the Malawi Health Sector Strategic Plan (HSSP) 2017–2022. The framework needed to inform the following key questions posed by the Ministry of Health.
What is the appropriate scale of the HBP?
Which interventions represent “best buys” for the health care system and should be prioritized?
Where should investments in scaling up interventions and health system strengthening be made?
Should the package be expanded to include additional interventions?
What are the costs of the conditionalities of donor funding?
How can objectives beyond improving population health be considered?
Since including an intervention in the HBP commits resources that could otherwise be used to fund alternative interventions that also improve health, it is important that the opportunity costs in foregone health care are considered. Therefore, an empirical estimate of the costs and effects of a range of health interventions was made using data from the Tufts Global Health Cost–Effectiveness Registry (Tufts Medical Center, 2021) and WHO-CHOICE analyses (Bertram et al., Reference Bertram2021). Budgetary analysis to determine the total cost of the package used drug and supply costs from a 2014 midterm review of the previous strategic plan. The size of the eligible patient populations for each intervention and an assessment of the extent to which interventions were implemented in Malawi in 2014 were obtained from data available locally.
The estimates of the cost per disability-adjusted life-year (DALY) averted for interventions for which all required data were available are shown in Fig. 2.2.2, ordered from lowest to highest. The height of each bar represents the intervention’s effectiveness–cost ratio, and the width of each bar represents the intervention’s total cost. Previous research has indicated that US$ 61 spent on health care at the margin would be expected to avert one DALY (or 61 DALYs per US$ 1000). Bearing in mind a possible budgetary limit of US$ 265 million, this would imply that interventions 1–48 would be included in the benefits package (see vertical line A). Vertical lines B and C show the implication of higher budgets, representing higher willingness-to-pay thresholds per DALY-averted.
A framework can be used to help identify “best buys” and priorities for the health system given different budget thresholds

Ochalek et al. (Reference Ochalek2018) highlighted that while Fig. 2.2.2 provides a useful way to visualize the budgetary implications of using a higher or lower “threshold” value, cost per DALY-averted ratios are not useful for prioritizing interventions because they do not indicate the scale of the potential health impact. Therefore, Ochalek et al. (Reference Ochalek2018) also present data in their paper ranking interventions according to the net DALYs averted that they would achieve, assuming that they were fully implemented, or implemented to the extent they were in 2014.
These analyses were intended to provide an analytic framework for supporting the development of the benefits package, rather than prescribing decisions. Decision-makers in Malawi added other decision-making criteria (in addition to health maximization) such as equity (whether an intervention was for at risk or marginalized groups), continuum of care (where interventions are linked), complementarities (where interventions are a linked part of a given package of services), and exceptional donor-funded interventions that were expected to remain stable in the medium term.
Other issues emerged in the deliberative process. For example, some interventions that were good value for money were likely to be difficult to implement because of reluctance on the part of the population (e.g. male circumcision), or because some donors were rigid about the types of intervention they would and would not fund. There were other rigidities in the funding arrangements that made investment and disinvestment in various services difficult. Also, data limitations meant that complete evidence of cost–effectiveness and budgetary impact was not available for some services. However, the analyses performed showed that there were potentially substantial gains from investing in policies to reduce these constraints to implementation. The analytic framework developed provided a basis for conducting these debates and considering ways to improve the allocation of resources.
Policy relevance and conclusions
Key issues in setting a benefits package
The case studies presented above show that countries take very different approaches to drawing up a benefits package. Although it is acknowledged that benefits packages have the potential to strengthen health care systems and respond to population health need while controlling expenditure, the approach followed for each health care system strongly depends on cultural values, market configuration, political system, level of wealth and other determinants. Therefore, whatever system is used, it is important to gain agreement from key stakeholders (e.g. politicians and health professional groups) on the need for an explicit benefits package and on what the benefits package should seek to achieve (i.e. ensure equity, control costs).
Given the various contexts, it is ambitious to draft a generic framework for setting a benefits package. Fig. 2.2.3 visualizes the core steps involved in doing so, inspired by the approach taken by Glassman et al. (Reference Glassman2016). We have extended their framework by the process of implementing benefit decisions into benefit catalogues. Thus, our framework essentially contains two processes that are linked to each other. In the first process, inclusion and exclusion of benefits are defined, while in the second process benefit decisions that result from the first process are implemented into benefit catalogues.
A generic framework for setting a benefits package will require context-specific interpretation

Figure 2.2.3 Long description
The flowchart represents a cyclic process (the last step feeds back into the first one), where steps 1 through 6 represent the Process of inclusion and exclusion of benefits or health technology assessment process, while steps 7 through 12 represent the Process of implementation of benefit decisions into benefit catalogues. The steps are as follows. 1. Determine overall principles. 2. Define decision-making bodies. 3. Operationalise criteria. 4. Decide on methods and framework. 5. Undertake appraisals and budget impact assessment. 6. Take a decision on the inclusion or exclusion of benefits. 7. Decide on structure and type of benefit catalogues. 8. Choose taxonomy and grouping criteria. 9. Determine degree of explicitness. 10. Integrate benefit decisions into benefit catalogues. 11. Manage benefit catalogues. 12. Define updating procedures and review.
The different steps of the two processes require more in-depth explanation.
1. Determine the overall principles: in the first step the guiding principles for setting a benefits package should be clearly stated by policy-makers and closely aligned with the general goals of the health care system. Typically, these principles are set by the parliament of a given country, in the context of national health service systems or SHI systems. The parliament of a given country will be held accountable to the general public for setting the package and monitoring its implementation. This may differ according to jurisdictions, but the overall principles should be rooted in broad support from the population.
2. Define decision-making bodies: responsibilities must be defined for the subsequent steps. In particular, the final decision-maker who determines the inclusion or exclusion of benefits, the structure and type of benefit catalogues, and the degree of explicitness of benefit catalogues must be defined. Decision-making bodies could either be ministries and parliaments or self-governmental institutions and committees. SHI countries have a long tradition of delegating responsibilities to self-governing institutions (e.g. in France, Germany and the Netherlands), while in national health service countries ministries and committees play an important role in this process (e.g. in Italy and United Kingdom). For example, in the case study on Italy, the Ministry designed the process and criteria for updating benefits which were then implemented by a commission.
3. Operationalize criteria: coherent with the overall principles, criteria for benefit decisions must be defined. Results of the EUHealthBasket project demonstrated that the criteria used for inclusion and exclusion of benefits varied considerably between European countries. While most countries used variations of effectiveness, cost and cost–effectiveness, Denmark used need as the central criterion and Spain used efficacy, efficiency and safety as the main criteria (Schreyögg et al., Reference Schreyögg2005). Criteria often also differ according to benefit catalogues of different sectors or different types of health technologies; for example, different criteria for pharmaceuticals than for medical devices.
4. Decide on methods and frameworks: most countries, especially HICs, use some kind of health technology framework including economic evaluation to determine the inclusion and exclusion of benefits. Although most countries in fact apply a framework with different criteria, as shown in the case studies above, not every country publishes the applied criteria in a transparent way, for example, the Netherlands (Stolk et al., Reference Stolk2009). Schreyögg et al. (Reference Schreyögg2005) found that in European countries, criteria for the inclusion in or exclusion from benefit catalogues are often fairly opaque.
5. Undertake appraisals and budget impact assessment: the formulated frameworks and criteria must be applied by a designated institution. Often, this institution is not the decision-making body, but it has the role to systematically collect evidence on (new) technologies and services as input to appraisals. This institution, often a HTA agency, may also perform a budget impact assessment to inform the decision-making body. One of the lessons from the Malawi case study above, and from attempts to use economic evaluation in the development of an HBP in the Netherlands (Stolk et al., Reference Stolk2009), is that assessments of clinical and cost–effectiveness may not be readily available for all the services or treatments in the benefit catalogue. Therefore, either substantial resources may be required, or priorities need to be set for which services to assess. Tackling this issue is likely to be the main practical challenge in setting a detailed explicit benefits package.
6. Take decisions on inclusion or exclusion of benefits: after evidence is available and synthesized for decision-makers, the defined decision-making body has to make the final decision on inclusion and exclusion of benefits. At this point, services or technologies may be included/excluded completely or partially (e.g. tied to specific conditions). For instance, in several European countries, positron emission tomography-computed tomography scans are not regularly reimbursed, but are reimbursed for specific conditions such as suspected bronchial carcinoma. Decisions in certain countries may also allow regional differentiation. For example, Spain and Italy allow regions to include additional services in their benefits packages, which are not included at national level (Torbica & Fattore, Reference Torbica and Fattore2005; Planas-Miret, Tur-Prats & Puig-Junoy, Reference Planas-Miret, Tur-Prats and Puig-Junoy2005).
A benefit catalogue may also be complemented by a negative list, explicitly listing services that are excluded from reimbursement (see Chapter 2.3). For instance, Germany uses a negative list for pharmaceuticals, clarifying that, among others, expectorants and laxatives are not reimbursable. Beyond this it may be a general principle to decide that all services can be reimbursed unless explicitly excluded; for example, in the German inpatient setting (see case study above). Finally, it is worth noting that inclusion/exclusion decisions can and should take account of considerations beyond the synthesized evidence (e.g. equity, continuity of care), consistent with the general criteria specified earlier (3. Operationalize criteria).
7. Decide on structure and type of benefit catalogues: benefit catalogues can be of very different structures and types. They may take the structure of aggregate and implicit definitions of certain service areas through reimbursement schemes (as one type of benefit catalogue); for example, the DRG system for inpatient care, often used by HICs. In contrast, LMICs often maintain detailed lists of services not indicated for reimbursement but give a guarantee that at least the listed benefits will be reimbursed if needed. For instance, in Chile, benefits are listed in the Plan AUGE as a minimum guaranteed health benefit catalogue, whereby prioritized services are made available to the entire population (Glassman et al., Reference Glassman2016; Bitran, Reference Bitran2013).
8. Choose taxonomy and grouping criteria: The decision on taxonomy and grouping criteria is relevant for further steps in the process, as it has a direct impact on the degree of explicitness and the ability to integrate new technologies at a later stage of updating. European countries use some kind of taxonomy structured along medical specialities such as DRG classifications for inpatient care, or some kind of procedure-based classification for outpatient care; for example, the Common Classification of Medical Procedures in France. Regarding grouping criteria within taxonomies, the situation is quite heterogeneous including criteria such as age, comorbidity, area of care product group and procedures (Schreyögg et al., Reference Schreyögg2005).
9. Determine degree of explicitness: the fact that HICs tend to rely on reimbursement catalogues as a substitute for benefit catalogues does not necessarily imply that benefits are defined implicitly only. The EU HealthBasket project revealed that the degree of explicitness varies substantially both between European countries and sectors of care (Schreyögg et al., Reference Schreyögg2005). While inpatient services tend to be defined rather implicitly, outpatient services are often defined with a high degree of explicitness through procedure-based reimbursement schemes. But even implicitly defined reimbursement schemes may undergo a certain evolution, as presented above in the case of inpatient care in Germany. When deciding on the degree of explicitness, decision-makers, especially in HICs, are faced with a trade-off between the advantages of an explicit definition of benefits; for example, through encouraging equitable access and the threats of explicitness; for example, through overprovision of services in FFS reimbursement schemes.
10. Integrate benefit decisions into benefit catalogues: benefit catalogues/reimbursement schemes often have a long tradition and the ways in which taxonomies and groupings are defined influence whether innovations may be more or less easily integrated into existing schemes. Therefore, countries frequently decide to add lists of explicit inclusions/exclusions of new technologies.
11. Manage benefit catalogues: once a benefit catalogue is established, the government or other decision-making units have to continuously maintain it and monitor provision or reimbursement of benefits. Among other issues, this includes communication with stakeholder groups on included and excluded services, resolving disputes, and informing price negotiations with manufacturers (Glassman et al., Reference Glassman2016).
12. Define updating procedures and review mechanisms: an often-neglected issue is the process of updating procedures. Even HICs struggle with defining terms and conditions or technologies to enter benefit catalogues. Manufacturers and providers typically demand innovation-friendly processes with low entry barriers, while governments and payers have to keep the balance between rapid access to new technologies and costs. Another important point to consider is the frequency of updates. While some countries continuously update their catalogues, others define fixed periods; for example, every year. Finally, whether the development of benefit catalogues is aligned with the overall principles and available resources of a given health care system should be regularly reviewed. This relates back to the first step of determining the overall principles. Changing those principles may require changes in both processes.
Conclusions
HBPs differ in their level of detail and explicitness. There are both advantages and disadvantages of setting an explicit package, and this is an important policy choice. For those considering setting an explicit HBP, we have outlined the key steps, illustrated by examples from high-, middle- and low-income countries with different types of health care systems. Our particular focus has been on the use of HTA and economic evaluation, as this is one of the main practical issues that must be resolved in setting an explicit HBP.Footnote 2
Key messages
Chapter 2.3 reports on low-value care and how to reduce waste. Decommissioning or disinvesting from low-value care means taking money away from health care services that give poor value for money. Key learning includes that:
Ending investment in health technologies or treatments that are ineffective releases resources for more effective high-value care, increases efficiency and quality and contributes to sustainability.
Disinvesting from or decommissioning low-value care often faces institutional barriers.
Health technology assessment (HTA) and the continuous monitoring of peer-reviewed evidence and administrative health care data are key in identifying low-value care and prioritizing what should be decommissioned.
Combining financial and nonfinancial mechanisms can help influence both the supply of and demand for low-value care and stop its provision.
Broad stakeholder consultation and engagement is a key part of ending the use of low-value care because patients, clinicians, health-related organizations and health system norms and structures can all create barriers to change.
Decision-makers need to address how resources released by disinvestment can best be reinvested to strengthen efficiency, quality and access.
Introduction
There has been significant attention afforded to the challenges associated with assessing the value and introduction of novel health technologies, but much less attention afforded to how to disinvest from or decommission pre-existing health technologies or treatments which may be considered as low value. This is an important consideration for the sustainability of health care financing, particularly as this disinvestment or decommissioning has the potential to release resources which can be invested elsewhere, thereby improving the overall efficiency of the health care system.
The potential rewards are significant. For example, it has been estimated that approximately 30% of the USA’s health expenditure is on treatments and services considered as low value (Shrank, Rogstad & Parekh, 2019). However, defining what is meant by “low value” is challenging and context dependent. A common definition used in the literature is the “use of an intervention where evidence suggests it confers no or very little benefit on patients, or risk of harm exceeds likely benefit, or, more broadly, the added costs of the intervention do not provide proportional added benefits” (Scott & Duckett, 2015). While this may seem relatively straightforward, it is important to understand that whether a health technology or treatment is considered low value or not is usually determined by the specific indication, patient characteristics and preferences (Verkerk et al., 2018). With some understanding of the challenges in defining instances of low-value care, one will begin to understand the difficulties in developing strategies to disinvest from low-value care and monitoring implementation. In the simplest scenario, there may be broad consensus among the clinical and patient community that a health technology is not effective or has been superseded by a novel health technology that is more effective or cheaper. In this case, commissioners and policy-makers often chose to reduce coverage of the low-value health technology and remove it completely from relevant benefits packages. However, this scenario rarely exists and instead in most cases the classification of health technologies as low value is more nuanced and dependent upon specific circumstances. In these cases, a broader set of financial and nonfinancial approaches is needed to encourage disinvestment.
This chapter discusses these challenges in detail, and presents a conceptual framework for disinvestment from low-value care.
Fig. 2.3.1 details the conceptual framework. We begin by outlining approaches to identify potential instances of low-value care which may be candidates for disinvestment. We then discuss strategies to disinvest from low-value care and classify them as demand-side, supply-side, financial or nonfinancial interventions. We also consider what barriers to implementation exist from the patient, clinician, organizational and health system perspectives. Finally, we present a case study of a programme which has attempted to overcome these barriers and draw upon learnings from different approaches to disinvestment from low-value care over the last two decades: the NHS England Evidence-Based Interventions (EBI) programme.
Conceptual framework for disinvestment from low-value care

Figure 2.3.1 Long description
The Effective disinvestment in low-value care has 3 parts: Identification (Evidence, Health technology reassessment, Geographical variation, and Priority setting), Implementation (Demand and supply-side, each with financial and non-financial considerations), and Barriers to consider (Patient, Clinician, Organisational, and Health system). This is followed by monitoring and evaluation.
Identifying candidates for disinvestment
The first stage of disinvestment from low-value care is the identification and classification of certain health technologies as low-value. Various approaches have been tried. The most prominent methods discussed in the literature include appraising published evidence, health technology (re)assessment and exploring variation (Elshaug, McWilliams & Landon, 2013; Malik et al., 2018; Public Health England, 2016). While these are sometimes discussed as distinct approaches, in reality the principles which underlie these three approaches overlap and they are conducted in parallel. Once instances of low-value care have been identified, a process of prioritization to identify targets for disinvestment is then undertaken at either the national or local level.
Appraising published evidence
The initial step to identifying potential candidates for disinvestment is typically systematic searches of the published evidence to find instances of low-value care (Brook, 2010; NHS England, 2018; NICE, 2014). Ideally, the development of the search criteria should be transparent and involve multiple stakeholders including patients, commissioners and health care professionals. Searches must also include strict inclusion and exclusion criteria, and to narrow the scope searches are often conducted on a specialty or indication basis with the involvement of professional societies. The Cochrane Library is a particularly useful resource for such searches, as it incorporates a repository of systematic reviews of the comparative clinical and cost–effectiveness of health technologies. It has been shown to include many recommendations for disinvestment suitable for translation into practice (Garner et al., 2013).
One practical demonstration of this approach took place in Australia, where a team of academics was commissioned by the Australian Government to draw up recommendations for disinvestment, and subsequently identified over 150 low-value care interventions in the Australian Medicare Benefits Schedule based on a review of the literature, the Cochrane Library, and nominations from both clinical and non-clinical stakeholders (Elshaug et al., 2012). The BMJ Rapid Recommendations series is another useful resource, combining systematic literature reviews with economic evaluations to develop recommendations on disinvestment from low-value care (Siemieniuk et al., 2017).
Health technology (re)assessments
While appraising already published evidence is an essential component of identifying potential candidates for disinvestment, comparative HTA processes are sometimes required to establish whether a pre-existing or established health technology is no longer cost-effective compared to other health technologies or against a relative cost–effectiveness threshold. This requires the calculation of costs per quality-adjusted life-year. However, there is considerable variation in the role of HTA agencies internationally with regards to disinvestment. These agencies are typically focused on evaluating novel health technologies rather than providing disinvestment recommendations for pre-existing health technologies. A review of 62 HTA agencies conducted in 2015 found evidence of methodological frameworks for disinvestment from only four countries, specifically Austria, Italy, Spain and the United Kingdom (Calabrò et al., 2018). The same review also commented how most HTA activities in disinvestment were in the field of research and not widely applied in practical clinical settings.
England’s National Institute for Health and Care Excellence (NICE) has the most experience of encouraging disinvestment from low-value care. In 2005, the government requested that NICE pilot an “ineffective treatment programme”, and following consultation, this led to the belief that the best approach to disinvestment was through the publication of clinical guidance and associated “do not do” lists. NICE subsequently reviewed all pre-existing HTA recommendations and guidance, and identified over 2000 clinical interventions as candidates for disinvestment (Garner & Littlejohns, 2011). However, this programme has subsequently been replaced by national initiatives, such as the EBI programme (see the Evidence in practice: the NHS England Evidence-Based Interventions (EBI) programme section), that are more focused on co-development and ownership with clinicians with hopes of increased engagement. Other HTA agencies have come to similar conclusions: that their efforts may be enhanced with improved collaboration with specialty organizations. For example, the Canadian Agency for Drugs and Technologies in Health has recently published recommendations of low-value care in conjunction with Choosing Wisely Canada, a grass roots movement encouraging clinicians to abstain from unnecessary interventions (Basharat & Born, 2021).
Variations in level of use
A key component of identifying potential candidates for disinvestment is to analyse administrative health care data to explore to what extent there is current variation in utilization. Low volumes of an ineffective health technology suggest that disinvestment is feasible, best practice is being achieved and learning can be shared with areas that are not achieving low volumes. In contrast, high volumes suggest an area of high resource use and potentially unwarranted clinical variation. However, it must be remembered that substantial variation may either demonstrate inequity of care (underuse of high-value health technology) or inappropriate use of resources (overuse of low-value health technology). Therefore, while broad geographical variation implies inappropriate care, whether it constitutes overuse or underuse requires further assessment (Appleby et al., 2011; Public Health England, 2016; Wennberg & Gittelsohn, 1973).
Making that assessment requires some level of understanding of what an appropriate or expected level of utilization should be for relevant health technologies for specific populations based upon characteristics such as age, gender and comorbidities. However, challenges with data availability and suitability are common and identifying a suitable threshold for when variation may warrant further investigation is not straightforward. Many countries, including Australia, Canada, Germany, the Netherlands, New Zealand, Spain, the United Kingdom and the USA, have focused on establishing Atlases of Variation, which use data on geographical variation to benchmark health care providers and guide efforts to reduce unwarranted clinical variation (DaSilva & Gray, 2016; Harrison et al., 2020; Health Quality & Safety Commission New Zealand, 2021; World Bank, 2015). A review of the effectiveness of these programmes found that providing feedback on variation was associated with reductions in overuse of tests and treatments, and improvements in adherence to guidelines and protocols (Harrison et al., 2020). However, more evidence is needed on the relative effectiveness of particular feedback approaches.
Prioritizing candidates for disinvestment
Once candidates for investment are identified, a major challenge is prioritizing which low-value health technologies should be targeted for disinvestment. This is a complex process which needs to consider the relative trade-offs between alternative candidates for disinvestment, including potential savings, certainty of evidence on lack of clinical and cost–effectiveness and the potential unintended consequences, such as substitution by other types of care or inequity in access. If there is significant heterogeneity in clinical practice and patient needs between regions, these trade-offs may be very different at national and local levels.
In England, local efforts to prioritize candidates for disinvestment are common, for example through listing Procedures of Limited Clinical Effectiveness or Procedures of Limited Clinical Value (Coronini-Cronberg et al., 2015). These typically involve an evidence review and a local resource impact assessment, but have been criticized for a lack of transparency and accountability, and for resulting in a so-called “postcode lottery” whereby patients are confronted with sometimes unexplained variations in eligibility criteria to access different treatments based upon where they live (Russell et al., 2013). Other countries such as Wales (Charles et al., 2016) and Canada (Smith et al., 2016) have focused on utilizing resource management frameworks such as programme budgeting and marginal analysis to establish systematic approaches to disinvestment at the local level that improve transparency, accountability and public participation in decision-making. This typically involves mapping candidates for investment or disinvestment, and evaluation of the relative benefits and drawbacks of alternative candidates based upon stakeholder perspectives, and the economic concepts of opportunity cost and marginal gain (Donaldson et al., 2010). However, there is significant variation in engagement and approach to public involvement, and these frameworks are often only utilized sporadically or for research purposes rather than routinely in practice (Tsourapas & Frew, 2011).
Evidence on approaches to disinvestment from low-value care
Financial and nonfinancial mechanisms exist, both on the demand and supply side. Once low-value interventions are identified, several approaches to disinvestment can be utilized; there is now growing evidence on the effectiveness of these alternative approaches. Colla et al. (2017) classified these according to demand-side (i.e. patients and consumers) and supply-side (i.e. health care providers) interventions. We offer a similar approach encompassing more recent studies, and further categorize these interventions according to which are financial or nonfinancial mechanisms (Table 2.3.1).

Table 2.3.1 Long description
The first part of the table is Demand-side interventions. It has 2 columns: Nonfinancial and Financial. It reads as follows. Nonfinancial: Educational interventions (public awareness campaigns and patient information leaflets) - strong evidence. Shared decision-making between patients and clinicians - mixed evidence. Public reporting of variation in provisions of low-value care between health care providers - weak evidence. Financial: Cost-sharing for low-value health technologies and treatments (co-payments, deductibles, and co-insurance) - strong evidence. Removal of low-value health technologies and treatments from a benefits package (that is, delisting or negative lists) - strong evidence. Reference pricing to improve generic prescribing - strong evidence.
The second part of the table is Supply-side interventions. It has 2 columns: Nonfinancial and Financial. It reads as follows. Nonfinancial: Clinical decision support tools (embedded in health information technology systems, patient pathways and policies) - strong evidence. Educational interventions (awareness campaigns, continuing professional development) - mixed evidence. Feedback to providers (cycles of audit and feedback, individual feedback to prescribers) - mixed evidence. Financial: Pay for performance (financial incentives to reduce provision of low-value health technologies and treatments) - strong evidence. Penalties or fines for overprescribing or providing unnecessary care - weak evidence. Payer restrictions (through gatekeeping, or prior approval mechanisms) - strong evidence. Risk sharing (through capitation or global budgets) - mixed evidence.
Evidence on demand-side financial disinvestment interventions
Evidence of financial disinvestment mechanisms on the demand side shows promising impacts; however, it also exposes potential unintended consequences.
Demand-side interventions aim to curb the provision of low-value care through influencing patient or consumer behaviour. The predominant financial mechanism utilized for this purpose is cost-sharing, whereby costs of unnecessary procedures are shared between patients and payers through different co-payments, deductibles and co-insurance in an attempt to communicate value to patients. The introduction of targeted co-payments (ranging from US$ 100–500 in the fiscal year 2011/2012) for several low-value diagnostics (sleep studies, computed tomography scans, magnetic resonance imaging scans, positron emission tomography scans and upper gastrointestinal endoscopies) and surgical procedures (spine surgeries for pain, shoulder and knee arthroscopies, and hip and knee replacements) by a large insurer in the USA found significantly reduced use of targeted services, with a price elasticity of −0.22 (Gruber et al., 2020). Crucially, the same study found no impact of substitution between targeted and non-targeted services. However, when non-targeted, there is a risk that patients will forgo both high-value and low-value care, with several studies concluding that patients may not necessarily be able to distinguish between the two (Lohr et al., 1986; Wharam et al., 2011). Moreover, there is a risk that cost-sharing will have differential impacts between socioeconomic groups, with cost-sharing disproportionately impacting people of lower socioeconomic groups (Wharam et al., 2011). Reference pricing is an example of cost-sharing commonly utilized in Europe to discourage the use of brand-name medicines – which can be understood to be an example of low-value care when equivalent generic versions exist – in favour of generic medicines. Evidence suggests that reference pricing can generate higher generic medicine use, but also unintended consequences such as the complete discontinuation of cost-effective treatments for chronic diseases (Gibson, McLaughlin & Smith, 2010).
Cost-sharing is different to the complete removal of low-value health technologies or treatments from a defined benefits package, as when this strategy is adopted costs are not shared between the patient and payer and the patient is exposed to 100% of the costs. This type of financial intervention, sometimes called “delisting” or creating “negative lists”, is most easily applied to pharmaceuticals which have clear indications. This strategy has been applied to hundreds of pharmaceuticals in France and has reduced relevant prescriptions by up to 50% (Pichetti & Sermet, 2011), but has been controversial for some pharmaceuticals such as the use of acetylcholinesterase inhibitors for patients with dementia (Walsh, King & Brayne, 2019). Delisting or removal from the benefits package has also been used effectively in many other European countries including Czechia (Chytilová & Šebesta, 2015), Denmark (Hesse et al., 2013), Italy (Rocchi et al., 2004) and the Netherlands (Kroneman & de Jong, 2015).
Evidence on demand-side nonfinancial disinvestment interventions
There are several nonfinancial demand-side mechanisms that have been used to influence patient or consumer demand for low-value care including improved education, shared decision-making and public reporting. Excess antibiotic use is a key example of low-value care, and there are many pre-post studies which demonstrate that large-scale multimodal public awareness campaigns can change knowledge, behaviours and usage of antibiotics (Price et al., 2018). There is also evidence for other pharmaceuticals: for example, a patient information leaflet on the indication, harms and drug interactions of benzodiazepines, as well as visual tapering recommendations, has been shown to increase discussions around cessation, and numbers of patients achieving full cessation (Tannenbaum et al., 2014). Shared decision-making involves patients and clinicians having a focused and detailed discussion regarding the low-value treatment in question, thereby enabling the patient to make a fully informed choice regarding their care (Elwyn et al., 2012). A review of the public’s role in reducing low-value care found that decision-making tools that supported shared decision-making between clinicians and patients, such as the educational materials produced by the international Choosing Wisely initiative, were effective (Reyes et al., 2020), although rarely utilized in practice (Sypes et al., 2020). Increasingly, public reporting is used to show variation in provision of low-value care between health care providers (Maratt et al., 2019; Reyes et al., 2017). In theory, this has the potential to alter the behaviour of health care providers if patients make choices based upon this information. However, this is dependent upon patients being able to easily view and understand this information, as well as being able to change which health care providers they access. In reality, largely because these conditions are often not met, evidence suggests that public reporting generally may have negligible or limited impact on health care quality (Joynt et al., 2012; Ryan, Nallamothu & Dimick, 2012). However, more research is needed to understand the impact on the provision of low-value care specifically (Maratt et al., 2019).
Evidence on supply-side financial disinvestment mechanisms
Supply-side interventions aim to change the behaviour of health care providers at either the organizational or individual level. The four financial mechanisms commonly utilized to incentivize health care providers to reduce provision of low-value care are: pay for performance (P4P); penalties; payer restrictions; and risk sharing. P4P programmes provide financial incentives to health care providers to reduce the provision of inappropriate care – for example, excess antibiotic prescriptions or unnecessary laboratory tests. Evidence from the United Kingdom has indicated that a nationwide P4P programme, the Quality Premium, has been effective at reducing inappropriate antibiotic prescribing (Bou-Antoun et al., 2018). Evidence from the USA has also shown that a financial incentive scheme for residents reduced unnecessary blood tests and adherence to clinical guidance (Han et al., 2014). In contrast to P4P programmes which reward health care providers, penalties have been used to fine clinicians who overprescribe unnecessary or potentially harmful treatments. These were used in France between 1994 and 1996, when approximately 13 000 doctors were surveyed over two years and ultimately 75 were fined for inappropriate prescribing (Busse et al., 2015). However, in 1999 the sanctions were declared illegal and the policy was abandoned. A systematic review of measures in six high-income countries for curbing overprescribing also found that penalties are rarely used (Rashidian et al., 2015).
Payer restriction involves only providing reimbursement for certain indications and contexts, and is often implemented and monitored through some form of prior approval or gatekeeping mechanism to access the relevant low-value health technology or treatment. One study demonstrated that introducing a gatekeeping policy based upon patient symptoms for an autoimmune blood test reduced inappropriate testing (Sinclair, Saas & Stevens, 2004). Similarly, another study demonstrated that introducing an infectious disease consultation requirement for parenteral antibiotic therapy in the outpatient setting reduced inappropriate prescribing (Conant, Erdman & Osterholzer, 2014). Risk sharing involves utilizing reimbursement mechanisms that expose health care providers to the financial cost of services provided. These typically involve some form of global budget or capitation payment, and in theory, could encourage the provider to disinvest from low-value care, thereby maximizing the value for patients from restricted funds. In the USA, Blue Cross Blue Shield introduced an Alternative Quality Contract in 2009 for health care providers, which incorporated global payments and found that cardiovascular services reduced by 7.4% and imaging services reduced by 6.1%, but colonoscopies increased by 5.2% (Song et al., 2013). However, another study from the USA found no association between capitation payments and low-value imaging for low back pain and headache in the primary care setting (Liao et al., 2020). Moreover, other studies have commented that reimbursement mechanisms such as capitation or global budgets are unlikely to incentivize disinvestment from low-value care in isolation, and they must be utilized as part of multicomponent strategies (Lee et al., 2016; Mafi et al., 2019).
Evidence on supply-side nonfinancial disinvestment mechanisms
There are three nonfinancial supply-side mechanisms utilized to encourage health care providers to reduce provision of low-value care; clinical decision support tools; education; and feedback to providers. Clinical decision support tools aim to reduce unnecessary tests and unsafe prescribing while promoting compliance with guidelines on evidence-based care, and can be embedded into health information technology systems, patient pathways or policies. Prompts integrated into health information technology systems that alert clinicians they are potentially non-compliant with guidance or ordering unnecessary tests have been shown to be effective in reducing the provision of unnecessary blood transfusions (Baer et al., 2011), inappropriate use of imaging (Aston, 2010; Solberg et al., 2010) and duplicate blood tests (Levick et al., 2013; Niès et al., 2010). Moreover, other studies have demonstrated that adapting prescription order displays to show only generic medicines (Patel et al., 2014), or incorporating infection disease specialist reviews into a computerized antibiotic authorization system can reduce low-value prescribing (Potasman, Naftal & Grupper, 2012). However, it is important to consider the risk of alert fatigue in clinicians who can then choose to ignore or override notifications. The evidence regarding education for clinicians, who may be reluctant to engage with such efforts, is mixed. Evidence on trends in the provision of 32 low-value services for Medicare recipients between 2014 and 2018 (Mafi et al., 2021) concluded there were only marginal reductions in provision of low-value care despite a national education campaign to limit the provision of these services in collaboration with specialty societies. It appears that educational programmes may be more effective if more targeted and multimodal. For example, a continuing medical education programme involving tutorials and an interactive seminar on shared decision-making has been shown to result in lower levels of inappropriate antibiotic use, with 52% of patients in the control group and 27% of those in the intervention group deciding to use antibiotics’ after consultation (Légaré et al., 2012). Similarly, lectures and the introduction of a medicines reconciliation form have been shown to reduce inappropriate acid suppression therapy during hospital admission from 51% to 22% (Gupta et al., 2013). Feedback to providers on the extent of the provision of low-value care can also reduce its provision. Cycles of audit and feedback at the local level have been associated with significant reductions in low-value care, with a systematic review on this topic highlighting reductions achieved in inappropriate polypharmacy, antibiotic use and imaging (Ivers et al., 2012). Results at the national level are more mixed. A study from the United Kingdom which evaluated the use of feedback to individual practices that were in the top 20% of antibiotic prescribers was shown to reduce antibiotic prescriptions by 3.7% (Ratajczak et al., 2019). However, two other studies from Switzerland and Denmark respectively, which evaluated the use of individual provider feedback alongside a nationwide antibiotic stewardship programme, found no associated change in antibiotic use (Hemkens et al., 2017; Søndergaard et al., 2003).
Evidence on multicomponent disinvestment interventions
Evidence on multicomponent interventions shows that by combining different approaches, sustainable reductions in the provision of low-value care are possible.
Colla and colleagues concluded that multicomponent interventions are more likely to achieve sustainable reductions in the provision of low-value care (Colla et al., 2017). These multicomponent interventions typically involve a combination of nonfinancial supply-side mechanisms, incorporating clinical decision support tools, education and feedback to providers. For example, a study found that an educational programme involving a lecture, information card and twice weekly feedback on individual ordering behaviour reduced inappropriate echocardiography use (Bhatia et al., 2013). Similarly, another study focusing on the impact of audit and feedback, lectures and participation of pharmacists in ward rounds, found significant reductions in inappropriate acid suppression therapy (Khudair et al., 2011). Other examples involving the combining of educational campaigns, clinical decision support systems and cycles of audit and feedback have been shown to reduce prevalence of inappropriate use of blood transfusions (Arnold et al., 2011; Rothschild et al., 2007).
Barriers to the implementation of disinvestment strategies
There is a growing literature base on the barriers to implementation to consider when developing strategies to disinvest from low-value care.
Despite growing efforts to reduce the provision of low-value care, the evidence on many supply- and demand-side mechanisms is mixed. Below we discuss these barriers from a patient, clinician, organization and health system perspective.
Barriers to disinvestment at patient level
At the patient level, information asymmetry, lack of trust and limited patient involvement can get in the way of disinvestment efforts.
From a patient perspective, patients often lack the capability to differentiate between high- and low-value care (Lohr et al., 1986). Patients may therefore be reluctant to forgo unnecessary screening or testing due to fear of delayed diagnosis. Moreover, it has been emphasized that patients may mistrust the medical establishment, and feel that care is being withdrawn or restricted unfairly (Norton & Chambers, 2020). This can be particularly damaging to the patient-clinician relationship, and clinicians may therefore be unwilling to restrict access to low-value care. These tensions are intensified when disinvestment initiatives are developed with limited public involvement (Sypes et al., 2020), or lack of engagement from either patients or clinicians in shared decision-making (Allen et al., 2019). While disinvestment initiatives such as Choosing Wisely have focused on developing patient decision aids to promote awareness and shared decision-making, a review of these materials found few provided balanced information on the benefits and harms of alternative interventions and therefore may be misleading or confusing for patients (Légaré et al., 2016).
Barriers to disinvestment at clinician level
From the clinician perspective, disinvestment from low-value care is often perceived as a cost-cutting exercise rather than for quality improvement (Embrett & Randall, 2018), and many clinicians fear lost revenue (Zadro et al., 2019). Other barriers discussed in qualitative interviews are time constraints, which prevent clinicians from engaging in shared decision-making with patients (Kool et al., 2020; Zikmund-Fisher et al., 2017), and fear of patient dissatisfaction or litigation that may result from withdrawing or restricting access to care (Lin et al., 2017; Osorio et al., 2020; Pausch et al., 2020; Zikmund-Fisher et al., 2017). Clinicians also discussed difficulties in overcoming patients’ preferences (Smith et al., 2020), and emphasized there is a lack of tools available to support shared decision-making. Most surveys indicated there was a high awareness among clinicians of low-value care initiatives and the need to manage limited resources efficiently (Buist et al., 2016; Kool et al., 2020), but most clinicians nonetheless reported they would still order unnecessary tests or procedures if a patient insisted.
Barriers to disinvestment at the organization level
From the organizational perspective, lack of resources to implement disinvestment initiatives, for example to create additional clinic time to facilitate shared decision-making, is discussed frequently in the literature (Dulmen et al., 2020; Ellen et al., 2018; Norton & Chambers, 2020). Concern about resources is exacerbated by the perception that engagement with disinvestment initiatives could further reduce available resources if they lead to lost revenues and increased litigation. Organizations may also resist collaborating with other organizations if they are perceived as having competing interests or priorities (Ellen et al., 2018). Other barriers discussed within the literature include the risk of change fatigue if organizations are exposed to repeated quality improvement efforts (McMillan & Perron, 2020), and inadequate infrastructure – in particular, health information technology systems – to implement, monitor and evaluate disinvestment initiatives (Dulmen et al., 2020).
Barriers to disinvestment at the health system level
From a health system perspective, reimbursement mechanisms that reward volume of care, such as fee-for-service payments, rather than those which incentivize the reduction of unnecessary care, such as capitation or global payments, were repeatedly emphasized as a barrier to disinvesting from low-value care (Dulmen et al., 2020). Other barriers discussed in the literature include poor awareness or commitment on the part of policy-makers and leadership regarding the need to address low-value care (Ellen et al., 2018); difficulties in coordination and building consensus between stakeholders at different levels of the health care system (Ellen et al., 2018); and a lack of resources to undertake the academic work required to identify low-value care (Garner et al., 2013). A review of involvement by HTA agencies in disinvestment initiatives in Europe also identified a lack of guidelines for the identification of obsolete technologies (Calabrò et al., 2018), and discussed how disinvestment remains a relatively new concept within these agencies. Moreover, a lack of data or suitable measures for monitoring and evaluation has been highlighted (Chalmers et al., 2018).
Evidence in practice: the NHS England Evidence-Based Interventions (EBI) programme
Most recently, the National Health Service (NHS) in England has accelerated efforts to disinvest from low-value care by developing the EBI programme, which aims to reduce avoidable harm to patients, maximize value and avoid waste by reducing unnecessary interventions. Statutory guidance for the EBI programme was published in November 2018 (NHS England, 2018), and the programme was officially launched in April 2019.
Identification of candidates for disinvestment
To identify potential candidates for disinvestment, the programme first undertook a thorough review of published evidence and HTA recommendations and explored variation between local commissioning bodies. The team developing the programme was conscious of how previous initiatives to disinvest from low-value care – in particular, the NICE “do not do” lists and locally developed procedures – had failed to engage with relevant stakeholders. Therefore, the EBI team launched a consultation aimed at the public, commissioners and health care professionals (the latter through their specialty organizations). As a result, the first phase of the EBI programme identified 17 low-value procedures within two categories (Table 2.3.2).
Category 1: not clinically or cost-effective
Surgical intervention for snoring (not obstructive sleep apnoea)
Dilatation & curettage for heavy menstrual bleeding
Knee arthroscopy with osteoarthritis
Injection for nonspecific low back pain without sciatica
Category 2: clinically and cost-effective only in certain circumstances
Breast reduction
Removal of benign skin lesions
Grommets
Tonsillectomy
Haemorrhoid surgery
Hysterectomy for heavy bleeding
Chalazia removal
Shoulder decompression
Carpal tunnel syndrome release
Dupuytren’s contracture release
Ganglion excision
Trigger finger release
Varicose vein surgery
Category 1 interventions have been shown not to be clinically or cost-effective and there is consensus among health care professionals that the procedures should no longer routinely be offered to patients. Category 2 interventions are only clinically or cost-effective for certain types of indication and/or patients.
Implementing the disinvestment
The EBI programme draws upon learning from many previous initiatives undertaken to disinvest from low-value care, and uses a multicomponent approach to encourage disinvestment from these low-value procedures. The programme has set targets for each local commissioning body to reduce the number of category 1 interventions to “near zero” and category 2 interventions to 25% of current levels nationally. The latter target involved calculating an expected rate for each local commissioning body based on population characteristics. They delisted category 1 interventions, introducing a zero tariff, with health care providers no longer reimbursed by the NHS for these interventions. Local commissioning bodies were asked to implement a prior approval process for category 2 interventions, with clinicians now expected to seek approval from local commissioning bodies for appropriate indications and/or patients. Progress in meeting agreed targets continues to be monitored and shared with hospitals and clinical commissioning groups by means of a publicly available dashboard to allow benchmarking (NHS Business Services Authority, n.d.). The identification of low-value procedures is based upon combinations of operation and diagnostic codes that are continually refined based upon feedback from commissioners, hospitals and health care providers. Crucially, this allows the identification of low-value procedures according to specific indications, and relevant exclusion criteria for other indications when the procedure is considered as high-value. To support improved awareness, education and shared decision-making between patients and clinicians, a series of patient information leaflets and videos was also developed (AMRC, 2022). The EBI programme has since expanded to a second phase, with a further 31 low-value procedures, diagnostics and treatments, and the statutory guidance was published in November 2020 (AMRC, 2020).
Evaluation of the EBI programme
Conclusive evaluation of the EBI programme is not yet complete, as this has been hampered by the emergence of the COVID-19 pandemic.
A preliminary analysis of the first 11 months following implementation, against a control group of other yet to be identified low-value procedures, concluded that the EBI programme encouraged a general culture of disinvestment from low-value care but did not accelerate disinvestment for the low-value procedures under its remit (Anderson et al., 2022). Nevertheless, the EBI programme remains the most robust and comprehensive approach to disinvestment from low-value care in England to date. The EBI programme draws upon learning from many previous initiatives to disinvest from low-value care, and uses several financial and nonfinancial supply and demand-side approaches to encourage disinvestment. The EBI programme also attempts to overcome many barriers to implementation through a broad consultation process, transparent monitoring and evaluation mechanisms, feedback to individual hospitals and commissioners, and public reporting. Despite this, Anderson and colleagues (2022) conclude that the EBI programme may have taken an approach to implementation that it is too top-down, and that the success of the programme is also heavily dependent upon successful collaborations between local commissioning bodies, hospitals and clinicians at the local level.
Policy relevance and conclusions
While there is broad consensus that disinvestment from low-value care is crucial to the financial sustainability of health care systems, there continues to be disagreement among relevant stakeholders about how best to identify potential candidates for disinvestment and what approaches should be taken to encourage disinvestment. The complexity of these challenges is further compounded by uncertainties in defining in what circumstances specific health technologies or interventions may be considered low-value, and technical difficulties in the monitoring and evaluation of initiatives. The resulting lack of clarity has often led to differing levels of success and fractured relationships between policy-makers, clinicians and patients. One thing is clear: no perfect mechanism for disinvestment has been identified to date – highlighting how great the challenge of disinvestment from low-value care is.
As we look to the future, lessons can be drawn from the experience acquired over the past two decades. Disinvestment must be sensitive to the opinions of all stakeholders, in particular those who drive the persistent use of low-value care; it must be rigorous and transparent in the identification and prioritization of potential candidates for disinvestment; and its implementation must draw upon multiple approaches that consider both demand- and supply-side perspectives. The implementation of disinvestment needs to be understood as a dynamic process that involves continual monitoring and evaluation, with concomitant feedback to individual clinicians and health care providers. Finally, released resources need to be reinvested into other areas of high-value care so patients, clinicians and policy-makers can see the benefits of engaging with these initiatives, and to ensure that disinvestment from low-value care is not perceived as a cost-cutting exercise.Footnote 1
Key messages
Chapter 2.4 gives an overview of user charges. User charges are out-of-pocket (OOP) payments made at the point of use for health services. Nearly all countries have some user charges, most commonly for medicines. They are intended to raise revenue and also to reduce the use of unnecessary health services and products. Key learning includes that:
User charges can generate revenues but have many unintended negative consequences – creating barriers to access, contributing to inequities and increasing the risk of financial hardship for households.
Health systems can reduce unnecessary or wasteful use of care without user charges by:
○ strengthening prescribing and referral systems to make sure care is appropriate;
○ offering information to steer patients and providers towards more cost-effective care.
Supply-side mechanisms that guide providers’ behaviour are more equitable and effective than demand-side mechanisms, such as user charges, and have fewer negative impacts on patients – especially those with chronic or severe conditions or the economically disadvantaged.
User charges are a suboptimal policy but – if they are to be used – health systems can mitigate the harm they cause and protect health care users through mechanisms such as exemptions, reduced co-payments, income-related co-payment caps and, to a lesser extent, price control and regulation.
Introduction
All health systems face the combined challenge of constrained financial resources and steady growth in health expenditures due to increasing demands for health care and expensive technological advances. In response, most health policy-makers have chosen – among a range of options, many of which are discussed in this volume – to put the onus for rationalizing health care use on patients themselves, by introducing user charges. In this chapter, we consider user charges (also referred to as user fees, cost-sharing or co-payments) as OOP payments at the point of use for covered services. They are intended to cover some portion of the cost of services, but not the full cost; for our purposes, this means that user charges do not include direct payments for non-covered services, nor informal payments. Likewise, some people may choose to obtain care privately, paying the full cost OOP due to perceptions about public sector quality or waiting times. Our focus in the chapter, however, remains firmly on OOP payments formally required for health services provided within the public system.
Ensuring that patients have “skin in the game” is thought by some to cause patients to carefully consider their care needs and only pursue expensive care which is necessary and high-value in terms of their health, thus reducing unnecessary utilization, enhancing efficiency and slowing expenditure growth. At the same time, user charges may be seen as required to generate additional revenue for the health system, further reducing budgetary pressures.
While these arguments capture the broad rationale for implementing user charges, the key question for policy-makers is whether the available evidence demonstrates that user charges work this way in practice. And, if that is the case, is there an “optimal” way to set the charges which improves a health system’s financial position without jeopardizing health outcomes and other health system objectives? What are the consequences if user charges are imposed on the wrong people, wrong services, at the wrong level or just generally in the wrong way?
The chapter falls into three main sections. The first looks at what user charges are and the forms that they take in different systems. The second section examines the policy’s effects both on households and health systems; we outline the rationale for introducing user charges in order to examine whether they achieve the objectives desired, as well as reviewing the evidence on the charges’ unintended consequences. The third section suggests ways forward for health systems implementing user charges: mechanisms to protect people from the adverse consequences, examples of successes and failures in practice, and policy lessons that can be drawn.
How are user charges used?
Fixed co-payments and percentage-based co-payments
There are two main ways that user charges are implemented: fixed co-payments and percentage-based co-payments. In a fixed co-payment system, some fixed amount of payment is required for a health care good or service, irrespective of the underlying cost of that item. This has an advantage in that it gives financial certainty to patients since they know how much they will pay in advance; it also may be more equitable since people will not face different prices just because they require different treatments (Thomson, Cylus & Evetovits, 2019). For example, in England, anyone required to pay for prescriptions paid a fixed fee of £9.35 per item in 2020/21 regardless of what the item was, although the price paid by the National Health Service for the 10 most commonly dispensed items actually ranged in cost from £1.12 for bisoprolol fumarate to £5.20 for metformin hydrochloride, with a mean cost per item of £2.09Footnote 1 (Wilson, Reference Wilson2021). Nevertheless, many less commonly prescribed items greatly exceed the fixed co-payment.
Alternatively, percentage-based co-payments mean that the amount paid OOP varies depending on the underlying price of an item. For example, a payer may require a 10% co-payment for a service, meaning that 10% of the cost is to be paid at the point of use by the patient; this may create some financial uncertainty for patients. While for very low-cost goods and services a health care user will end up paying a fairly small amount OOP using percentage-based co-payments, for big ticket items, the patient will have much greater financial exposure to cost. Ultimately, people with different conditions or those requiring different treatments may pay very different prices, exacerbating inequities. Sometimes, third-party payers decide to remove co-payments or apply lower percentage rates to items where they want to encourage uptake, and higher percentage rates to items that they perceive to have lower value, in an effort to dissuade use; this is referred to as value-based co-payments, value-based cost-sharing or value-based insurance (Chernew et al., Reference Chernew2008).
Reference pricing
Percentage-based co-payments can also be implied, rather than explicit. For example, the cheapest active substance may be covered in full by a third-party payer, or a third-party payer may set some maximum price that they are willing to reimburse through an alternative mechanism, with the patient paying the remainder if they choose a more expensive medicine or if a more expensive medicine is all that is available (Thomson, Schang & Chernew, Reference Thomson, Schang and Chernew2013). In practice, this functions similarly to an explicit percentage-based co-payment. This is the case in Lithuania where, often in addition to percentage-based co-payments, people pay the difference between the actual retail price and the reference price OOP; this system is known as internal reference pricing (Murauskienė & Thomson, Reference Murauskienė and Thomson2018). Internal reference pricing is often used to control costs but can have adverse effects on financial protection (WHO Regional Office for Europe, 2025a).
Mixing co-payments
Sometimes both fixed and percentage-based co-payments are used in tandem. One example is where percentage-based co-payments are used, but there is a fixed dispensing fee in addition. Such was the case in Greece, where a fixed co-payment was charged for outpatient services (€5) or admission to a state hospital (€25). In addition, percentage-based co-payments were in place for inpatient stays, medical devices and diagnostic or laboratory tests (Economou et al., Reference Economou2017). These percentage-based charges currently remain in place without the fixed co-payments, which were removed in 2015, but Greece has maintained this combination of fixed and percentage-based co-payments for prescription drugs. Users pay €1 per prescription along with a percentage-based co-payment, which is reduced for specific populations (Vogler et al., Reference Vogler2018).
User charges for prescriptions
Any health service can have user charges, although they are most widely used for medicines and least commonly used for inpatient care. The outcome of this tendency can be seen in Fig. 2.4.1, where OOP spending disproportionately finances pharmacies as compared to hospitals. One possible explanation is that prescription drugs do not have the same natural supply constraints as other health services, which are typically labour-intensive and limited by the number of providers, facilities or technology available. Medicines, on the other hand, may be thought to require some other constraint to prevent inexorable increases in use and ultimately in expenditures.
However, evidence suggests that user charges do not temper demand for prescription drugs very much. For example, some research indicates that the demand for prescription drugs is largely price inelastic (less than proportionate); a 10% increase in price results in between a 0.2–5.6% decrease in use. Thus, implementing user fees shifts the burden of paying for medicines to patients rather than substantially decreasing total demand for prescriptions (Gemmill, Thomson & Mossialos, Reference Gemmill, Thomson and Mossialos2008). Other studies find that patients decrease adherence to treatment when faced with even a small co-payment, skipping doses or cutting pills in half (Gemmill, Thomson & Mossialos, Reference Gemmill, Thomson and Mossialos2008; Poirier et al., Reference Poirier1997; Hernández-Izquierdo et al., Reference Hernández-Izquierdo2019). These behaviours occur even among patients who are at a high risk of an adverse health event, such as a heart attack or stroke (Chandra, Flack & Obermeyer, Reference Chandra, Flack and Obermeyer2021). As a result, user charges may contribute to poorer health outcomes.
The unintended consequences outlined here are specific to prescription charges. In the section that follows we look at the consequences relating to user charges overall.
OOP spending disproportionately finances pharmacies as compared to hospitals

Figure 2.4.1 Long description
The y-axis notes the Share of providers from 0 to 60, while the x-axis lists the countries. Each country has two associated bars: Hospitals and Pharmacies. The approximate values are as follows. Austria: 3; 33. Canada: 2; 32. Czechia: 4; 51. Estonia: 4; 48. Finland: 6; 40. France: 2; 13. Germany: 3; 20. Ireland: 3; 20. Korea: 25; 37. Spain: 2; 30. Switzerland: 10; 32.
Intended and unintended effects
As mentioned at the outset of this chapter, there are two primary reasons why health systems apply user charges: to reduce unnecessary health care use and to raise revenues for the health system. Here, we first discuss the evidence on the extent to which these intended effects occur in practice. We then turn to two key unintended consequences of user charges: financial hardship and unmet need for health care.
Intended effect 1: to reduce the use of unnecessary health care
One of the main arguments used to justify user charges is that they are required to reduce unnecessary demand for health care, which they do by steering patient behaviour; this argument is underpinned by a concept called moral hazard. In technical terms, moral hazard refers to the idea that an individual will increase their exposure to risk if they do not bear the full cost of risk. In the context of health care, the concept implies that an individual will use more health care than needed if they do not have to pay for it themselves. There is a huge amount of literature on moral hazard in health care dating all the way back to Kenneth Arrow in 1963 (Einav & Finkelstein, Reference Einav and Finkelstein2018; Gagnon, Reference Gagnon2017; Arrow, Reference Arrow1963). Some also consider that moral hazard means people will not invest fully in their health (i.e. they will engage in poor health behaviours) if they do not face the costs of health care, which may in turn contribute to additional health spending, although this form of moral hazard has received less academic attention.
The seminal work from the RAND health insurance experiment of the 1970s in the USA is often touted as presenting some of the strongest evidence of the effects of user charges. Households were randomly assigned to different health plans that varied according to their degree of cost-sharing: one plan had zero cost-sharing, and all had an OOP cap above which full insurance kicked in (Aron-Dine, Einav & Finkelstein, Reference Aron-Dine, Einav and Finkelstein2013). The results from the RAND experiment were initially interpreted as showing that health spending does change with user charges, since patients with higher cost-sharing had significantly less overall health spending. Researchers have revisited the data, however, and argue that this difference is small, especially for inpatient care, but also for demand for prescription medicines (Aron-Dine, Einav & Finkelstein, Reference Aron-Dine, Einav and Finkelstein2013). Moreover, the experiment did not include people aged over 62 years old or people too disabled to work, limiting its relevance among groups most likely to use health services. Indeed, the RAND experiment’s results may not provide as strong a basis to claim that implementing user charges will create lower health care expenditure as some have previously argued.
Another criticism of the argument that user charges reduce unnecessary care is that patients are not consistently able to distinguish between efficient and inefficient uses of health care (Gemmill, Thomson & Mossialos, Reference Gemmill, Thomson and Mossialos2008). In the RAND experiment, participants reduced their use of both effective and ineffective care to nearly the same degree (Lohr et al., Reference Lohr1986). User charges can discourage patients from seeking preventive care or cause them to dismiss health concerns because of the cost associated with a medical consultation (Greenfield et al., Reference Greenfield2019; Swartz, Reference Swartz2010). While this may decrease health expenditures for a short period, it can cause a “squeezed balloon effect” and result in the increased use of other services which are free to use but costly to provide, such as inpatient hospital care or emergency care (Chandra, Gruber & McKnight, Reference Chandra, Gruber and McKnight2010; Thomson, Foubister & Mossialos, Reference Thomson, Foubister and Mossialos2010). Studies focused on patients with chronic conditions find a correlation between higher user charges for prescription drugs and a greater use of inpatient and emergency services due to reduced adherence (Tamblyn et al., Reference Tamblyn2001; Goldman, Joyce & Zheng, Reference Goldman, Joyce and Zheng2007; Swartz, Reference Swartz2010). Thus, broad user charges may not actually encourage patients to be selective about care but, rather, discourage them from seeking care altogether.
Intended effect 2: to raise revenues
The second key reason cited for policy-makers opting to use user charges is to raise revenues. However, compared to prepayment mechanisms, user charges are an inefficient and inequitable means to raise revenues since they are based on people’s health care needs as opposed to their ability to pay. Administrative costs associated with collecting user charges can also outweigh the revenue gains, especially when exemptions are introduced, which require additional oversight (Dupas, Reference Dupas and Culyer2014).
Despite their limited potential, user charges are perceived as an important source of funding in some countries, particularly at the facility level. For example, public hospitals in Kenya rely heavily on user charges due to low public funding (Kairu et al., Reference Kairu2021). Although user charges may only comprise a small amount of total revenues for a facility, they may be a more flexible source of revenues than other sources of funding if public financial management systems are quite rigid. User charges may be the only funds that facilities have complete control over, causing facilities to depend heavily on user charges to cover variable costs. In these settings it is possible to reduce or remove user charges, but this should be done in tandem with more flexible financial management and with additional funding to offset any losses.
One example of a country which has tried to remove user charges as a revenue-raising method is China. Prior to 2009, China allowed public hospitals to raise revenues from prescription medicines by imposing a 15% profit margin, but has since spent considerable effort attempting to do away with this (Li & Yu, Reference Li and Yu2021). The government created several policies to remove prescription drug mark-ups, including a pilot programme in 2015 and a full elimination of mark-ups from urban hospitals by September 2017. To compensate hospitals for this change, revenue structures were altered to receive larger government subsidies and increase the prices of medical services, although data are inconclusive on whether these measures have been sufficient to compensate facilities for the lost revenue (Cheng et al., Reference Cheng2021).
While the above highlighted the intended effects of a user charging policy, below we turn to two key unintended effects.
Unintended effect 1: financial hardship
Unfortunately, there are a number of unintended adverse consequences commonly associated with user charges. One of the most commonly discussed consequences is financial hardship for those who utilize health services. For some households, OOP spending can either be so large in relation to a household’s ability to pay that it is considered to be catastrophic and, for others, OOP spending can push a household into poverty (Cylus, Thomson & Evetovits, Reference Cylus, Thomson and Evetovits2018). As shown in Fig. 2.4.2, in European countries, households in the poorest quintile have the highest level of catastrophic spending due to OOP payments, which includes user charges (WHO Regional Office for Europe (2023a); WHO Regional Office for Europe (2023b).
Households in the poorest quintile have the highest level of catastrophic spending due to OOP payments
ALB: Albania; ARM: Armenia; AST: Austria; AUT: Austria; BEL: Belgium; BIH: Bosnia and Herzegovina; BUL: Bulgaria; CRO: Croatia; CYP: Cyprus; CZH: Czechia; DEU: Germany; DEN: Denmark; FIN: Finland; FRA: France; GEO: Georgia; GRE: Greece; HUN: Hungary; IRE: Ireland; ISR: Israel; ITA: Italy; LTU: Lithuania; LUX: Luxembourg; LVA: Latvia; MAT: Malta; MDA: Moldova; MKD: North Macedonia; MNE: Montenegro; NDL: Netherlands; OECD: Organisation for Economic Co-operation and Development; OOP: out-of-pocket; POL: Poland; POR: Portugal; ROM: Romania; SRB: Serbia; SPA: Spain; SVK: Slovakia; SVN: Slovenia; SWE: Sweden; SWI: Switzerland; TUR: Türkiye; UKR: Ukraine; UNK: United Kingdom.
Note: Consumption quintiles are based on per person consumption using OECD equivalence scales. The Netherlands cannot be compared to other countries because the data used do not include the annual deductible amount households pay OOP for covered health care; our simulations suggest that catastrophic health spending is underestimated by up to 1.8 percentage points in the Netherlands in 2015. The lines represent a spectrum from lower to higher levels of financial hardship set at 5% (green line), 10% (yellow line) and 15% (red line). Source: WHO Regional Office for Europe (2023b).

Figure 2.4.2 Long description
The y-axis represents the households (percent) from 0 to 22, while the x-axis represents the L H S. Each bar is divided into 5 stacks representing the poverty quintiles. Three horizontal lines have been drawn a y equals 5, 10, and 15, respectively. Below 5 percent: Netherlands 2015, Slovenia 2018, Ireland 2016, U K 2019, Spain 2019, Sweden 2015, France 2017, Luxembourg 2017, Germany 2018, Denmark 2015, Switzerland 2017, Austria 2015, Croatia 2019, Finland 2016, Belgium 2018, Czechia 2019, Türkiye 2018, Cyprus 2015, and Slovakia 2015. Between 5 and 10 percent: Israel 2019, North Macedonia 2018, Malta 2015, Estonia 2019, Poland 2019, Bosnia and Herzegovina 2015, Greece 2019, Montenegro 2017, and Italy 2019. Between 10 and 15 percent: Portugal 2015, Hungary 2015, Moldova 2019, Serbia 2019, Albania 2015, Romania 2015, Latvia 2016, and Lithuania 2016. Above 15 percent: Georgia 2018, Ukraine 2019, Bulgaria 2018, and Armenia 2019.
Impoverishing spending is another measure used to track financial protection. It captures the percentage of households (or the population) who, after making OOP payments, are pushed below a poverty line. Different methods use different poverty lines; the World Health Organization Regional Office for Europe defines the poverty line as the cost of meeting basic food and housing needs. Some analysts also consider households already below the poverty line who still spend OOP on health care as a part of this metric (sometimes referred to as the further impoverished). Fig. 2.4.3 shows recent data on the percentage of households in European countries with impoverishing spending (WHO Regional Office for Europe 2023a; WHO Regional Office for Europe 2023b).
OOP spending can push households below or further below the poverty line
ALB: Albania; ARM: Armenia; AUT: Austria; BEL: Belgium; BIH: Bosnia and Herzegovina; BUL: Bulgaria; CRO: Croatia; CYP: Cyprus; CZH: Czechia; DEU: Germany; DEN: Denmark; EST: Estonia; FIN: Finland; FRA: France; GEO: Georgia; GRE: Greece; HUN: Hungary; IRE: Ireland; ISR: Israel; ITA: Italy; LTU: Lithuania; LUB: Luxembourg; LUX: Luxembourg; LVA: Latvia; MAT: Malta; MDA: Moldova; MKD: North Macedonia; MNE: Montenegro; NDL: Netherlands; OOP: out-of-pocket; POL: Poland; POR: Portugal; ROM: Romania; SRB: Serbia; SPA: Spain; SVK: Slovakia; SVN: Slovenia; SWE: Sweden; SWI: Switzerland; TUR: Türkiye; UKR: Ukraine; UNK: United Kingdom.
Note: A household is impoverished if its total spending (consumption) is below the basic needs line after OOP payments (i.e. it can no longer afford to meet its basic needs) and further impoverished if its total spending is below the basic needs line (i.e. it is already unable to meet its basic needs) and it incurs OOP payments. The Netherlands cannot be compared to other countries because the data used do not include the annual deductible amount households pay OOP for covered health care; our simulations suggest that catastrophic health spending is underestimated by up to 1.8 percentage points in the Netherlands in 2015. Source: WHO Regional Office for Europe (2023b).

Figure 2.4.3 Long description
The y-axis represents the households (percent) from 0 to 14, while the x-axis represents the L H S. Each bar has two stacks: Impoverished and Further impoverished. From lowest to highest impoverished spending, the countries are: N D L 2015 (nearly 0), S V E 2018, S P A 2019, U N K 2019, I R E 2016, B E L 2018, A U T 2015, S W E 2015, D E U 2018, F I N 2016, L U X 2017, S W I 2017, F R A 2017, D E N 2015, C Y P 2015, C R O 2019, M A T 2015, C Z H 2019, E S T 2019, G R E 2019, I S R 2019, T U R 2018, P O L 2019, S V R 2015, P O R 2015, M K D 2018, I T A 2019, L V A 2015, B I H 2015, M D A 2019, M N E 2017, L T U 2016, R O M 2015, H U N 2015, G E O 2018, S R B 2019, B U L 2018, A L B 2015, A R M 2019, and U K R 2019 (nearly 12).
It should be noted that in most countries, financial protection metrics cannot distinguish between user charges for statutory benefits versus other OOP expenditures (i.e. direct payments), though there are some exceptions, for example, Japan (Hashimoto & Tokunaga, Reference Hashimoto and Tokunaga2021).
Unintended effect 2: unmet need for health care
While some households experience financial hardship due to user charges, some simply are unable to use services altogether or use fewer services than needed because they cannot afford to pay user charges. These households are considered to have experienced unmet health care needs due to the cost of care. It should be noted there are other nonfinancial causes of unmet need, including a lack of available services and waiting times, among others (Fiorillo, Reference Fiorillo2020). However, financial reasons are often cited when people do not use health services. Fig. 2.4.4 shows unmet need due to cost, distance or waiting time for a selection of European countries. Low-income individuals are particularly vulnerable to experiencing unmet needs, especially when compared to the wealthiest residents of the same country.
Low-income individuals are particularly vulnerable to experiencing unmet needs for health care due to cost
ALB: Albania; AUT: Austria; BEL: Belgium; BIH: Bosnia and Herzegovina; CRO: Croatia; CYP: Cyprus; CZH: Czechia; DEU: Germany; DEN: Denmark; FIN: Finland; EST: Estonia; FRA: France; GRE: Greece; HUN: Hungary; IRE: Ireland; ISR: Israel; ITA: Italy; LUX: Luxembourg; MAT: Malta; MDA: Moldova; MKD: North Macedonia; MNE: Montenegro; NDL: Netherlands; OOP: out-of-pocket; POL: Poland; POR: Portugal; ROM: Romania; SRB: Serbia; SPA: Spain; SVK: Slovakia; SVN: Slovenia; SWE: Sweden; SWI: Switzerland; TUR: Türkiye; UNK: United Kingdom.
Notes: Countries are ranked from low to high by the incidence of catastrophic health spending. For catastrophic health spending, the Netherlands cannot be compared to other countries because the data used do not include the annual deductible amount households pay OOP for covered health care; our simulations suggest that catastrophic health spending is underestimated by up to 1.8 percentage points in the Netherlands in 2015. Health care refers to “medical examination or treatment”. Data on unmet need are for the same year as data on catastrophic health spending, except for Albania (2017) and the United Kingdom (2018). Unmet need quintiles are based on income.

Figure 2.4.4 Long description
The y-axis represents the population (percent) from 0 to 30, while the x-axis represents the L H S. Each country has three dots: Poorest quintile, Average, and Richest quintile. The richest quintile consistently stays at or below 5 percent for all countries (except Estonia 2019), while the poorest quintile is consistently placed higher than the other two (except Estonia 2019). Some countries like Greece, Serbia, Albania, and Romania, show particularly large gaps, with the poorest reporting percentages well above 10 percent.
Unmet needs naturally have consequences for health outcomes, though it can be challenging to draw direct links between the use of health services and health outcomes (Lagarde & Palmer, Reference Lagarde and Palmer2008). Self-assessed unmet need is correlated with worse future health outcomes (Gibson et al., Reference Gibson2019). Low-income populations are at a greater risk of poor health outcomes due to cost, showing the greatest reductions in health service utilization from implemented user charges (Swartz, Reference Swartz2010). A study of patients with chronic conditions found that, among those whose medication co-payments were raised, patients living in high-income areas were more likely to continue taking their medications than those living in low-income areas, exposing nonadherent patients to the risk and associated expenses of future medical complications (Swartz, Reference Swartz2010).
Policy relevance and conclusions
Protective mechanisms
There are a variety of approaches that can be used to protect people from the adverse consequences of user charges outlined above. Many of these can be considered under the broad umbrella of coverage policies. We identify and discuss four of these briefly below: exemptions and reduced co-payments; co-payment caps; price control and regulation; and voluntary health insurance (VHI).
Exemptions and reduced co-payments
The most straightforward approach to limit the risk of financial hardship caused by user charges is to create exemptions. Exemptions can be applied in a variety of ways. In some countries, people at a particularly high risk of financial hardship or frequent users of health care services are exempt from all user charges. In others, people are eligible for exemptions based on their age or occupation. Still, people may be exempt only for particular goods or services. For example, it is very common that someone with a particular disease may be exempt solely from user charges for all services related to treating that condition.
There are also instances where people are eligible to pay reduced co-payments, though they still must pay some nominal amount. In Ireland, low-income people and other groups based on age and health status are eligible to pay a low fixed co-payment for prescription medicines, rather than a percentage-based co-payment which may be more expensive (Thomson, Cylus & Evetovits, Reference Thomson, Cylus and Evetovits2019).
One challenge is that it can be difficult to identify people who are most at risk of experiencing financial hardship due to data issues. To identify who experiences financial hardship and who would benefit from exemptions, one needs up-to-date information on things like a household’s income or employment status, which, if available at all, may only be so with a delay. For example, someone’s employment status may not be available at a health facility level. Making such data available for these purposes can be costly. Additionally, in many cases, there are administrative hurdles to becoming recognized as exempt. This may result in people who are eligible for exemptions not receiving them, leaving them vulnerable to the burden of OOP payments.
Co-payment caps
Another commonly used mechanism is a co-payment cap or, alternatively, a co-payment maximum. In this case, individuals must pay user charges up until reaching a certain amount of spending, after which user charges are no longer required. This maximum can be an absolute amount (e.g. no more than €χ per individual spent) or a relative amount (e.g. no more than a certain percentage of gross annual income spent OOP). For example, in Austria, there is an income-related cap set at no more than 2% of the net annual income of the person in the household who pays for contributions to the social insurance system (WHO Regional Office for Europe 2023a, 2025b).
In Belgium, there is an OOP maximum, referred to as maximum billing, but the level varies across households. The maximum billing system places a ceiling on the amount spent in co-payments by a household per year. All households are eligible for the maximum billing system, with the ceiling dependent upon household income. Low-income households, children and those with a chronic illness are eligible for lower maximum billing ceilings as a form of financial protection (Bouckaert, Maertens de Noordhout & Van de Voorde, Reference Bouckaert, Maertens de Noordhout and Van de Voorde2023).
A cap might be applied to all spending on public health services, but there are often examples where the cap is applied to some services and not others. For instance, Cyprus has previously had an income-related cap which is determined by household income and number of children. However, this cap only applies to services provided in public facilities and excludes outpatient prescription medicines (Thomson, Cylus & Evetovits, Reference Thomson, Cylus and Evetovits2019; Kontemeniotis & Theodorou, Reference Kontemeniotis and Theodorou2021).
Some might consider deductibles to be a form of OOP caps. Deductibles are user fees where patients are responsible for paying for covered care up to a certain fixed amount, after which their insurance will kick in. Insurance may provide full coverage (covering 100% of costs, in which case it is the same as an OOP cap) or partial coverage after reaching the deductible. In Switzerland, there is a compulsory annual deductible, after which users still pay a 10% co-payment on any future health care charges (de Pietro et al., Reference de Pietro2015). With some health insurance providers, users can also opt to have a higher deductible and pay lower premiums. Total user charges (deductibles and subsequent co-payments) are eventually capped at a certain level depending on the size of the deductible. Given that most of the time deductibles do not offer a hard cap, they may be better thought of as simply a type of user charge (i.e. paying the full price up to some amount) rather than a protective mechanism.
Price control and regulation
In settings where health care users pay percentage-based co-payments, the price of a service has an effect on the risk of financial hardship. For example, 10% co-payments for a €5 medicine versus a €500 medicine will invariably mean very different levels of spending for an individual. There are mechanisms to control price growth, such as the use of health technology assessment (HTA) which are one tool that can enable purchasers to put some downwards pressure on medicines and medical technology prices, which go beyond the scope of this chapter (but see Chapter 2.2). Nevertheless, consumer prices need not reflect purchaser prices. It is important to highlight that variations in consumer list prices mean that individuals can face different risks of financial hardship depending on whether their condition is priced high or not.
VHI
Though it is not widely used, complementary VHI can be used to reimburse households for the cost of user charges (see Chapter 1.3). The risk of relying on VHI to protect households from the consequences of user charges is that, in many settings, only people who can afford to take up complementary VHI do so unless governments subsidize (or otherwise cover) VHI premiums. Slovenia has historically been an exception. In Slovenia up until 2024, the vast majority of residents voluntarily enrolled in a complementary VHI scheme to pay their co-payments. This meant that in practice, there was virtually no exposure to otherwise high co-payments (Albreht et al., 2021). While this system was advantageous from the perspective of ensuring financial protection, it raised questions about the purpose of having user charges in the first place. As of January 2024, Slovenia abolished co-payments and replaced them with a pre-paid levy to raise additional public funds. By doing this, Slovenia managed to eliminate VHI without substantial increases in out-of-pocket spending or catastrophic spending levels (Šarec E, Jošar D, 2025).
Evidence in practice: successes and failures in user charges implementation
Countries have implemented a number of user charge policies in recent years with varying success.
For example, Latvia introduced user charge exemptions in 2009 for its poorest households and further extended them in 2010 to include poor households. During this period, the country experienced a drop in catastrophic health care spending among the poorest quintile (Taube, Vaskis & Nesterenko, Reference Taube, Vaskis and Nesterenko2018). This change was successful in protecting poor users from experiencing additional financial hardship due to health care costs. However, in 2012, Latvia rolled back on these exemptions due to budgetary constraints, leading to a rise in catastrophic health care spending among the same quintile in 2013.
Several countries have tried to add small, fixed user charges to discourage unnecessary care and slow the rate of expenditure growth, but this strategy can also have unintended consequences. In 2004, Germany implemented a €10 user charge for a patient’s first outpatient visit of every fiscal quarter. At the same time, Germany replaced exemptions for low-income users with annual spending caps based on income. The total rise in OOP spending coming from these changes led to an increase in catastrophic spending on health care in the nation (Siegel & Busse, Reference Siegel and Busse2018). Additionally, there was an increase in the number of patients who avoided or delayed seeing a doctor because of the charge, especially among young adults and low-income patients (Rückert, Böcken & Mielck, Reference Rückert, Böcken and Mielck2008). The user charge was abolished in 2012, and catastrophic spending subsequently fell, but still remained elevated due to the concomitant abolition of exemptions.
User charges are used in nearly all countries but they are particularly common in LMICs that struggle to generate sufficient funding for health from domestic government resources. However, evidence has shown in these contexts that reducing user charges in LMICs is associated with better health outcomes, lower mortality, and improved chronic disease management (Qin et al., Reference Qin2019). Several studies attribute these improved outcomes to increased access to care due to lower user charges (McKinnon et al., Reference McKinnon2015; Sood et al., Reference Sood2014; Lamichhane, Sharma & Mahal, Reference Lamichhane, Sharma and Mahal2017). Although making progress towards universal health coverage may be more difficult in LMICs due to a lack of fiscal space, prioritizing it can prove beneficial for population health.
Policy lessons
User charges are a common, though as we have discussed in this chapter, also undesirable feature of health financing systems. While user charges are intended to steer health care consumption and raise revenue, alternative mechanisms may prove more effective at achieving these goals with fewer drawbacks. Implementing user charges can contribute to inequities in health care access, creating a financial barrier to care and contributing to unmet health care needs and financial hardship. Individuals with chronic health conditions or other severe conditions can be disproportionately impacted by user charges, both in terms of their health and finances (Swartz, Reference Swartz2010). It is important to consider the objectives of user charges, and whether user charges actually achieve these goals, in conjunction with their possible unintended effects, especially among vulnerable populations.
Alternative mechanisms can prove better at accomplishing the same goals as user charges without the detrimental effects. For example, referral systems (also referred to as gatekeeping) can be an effective way to steer patients to high-value care and minimize waste while also ensuring that patients are seeking appropriate care for their health concerns (McIntyre & Meheus, Reference McIntyre and Meheus2013). Another strategy is to target providers, rather than patients, with information and incentives to steer patients towards more cost-effective care (Chernew et al., Reference Chernew2021).
If user charges are deemed necessary for a health system, perhaps for political reasons, there are ways to implement them while still being mindful of equity and financial protection. Indeed, even looking across Europe, one can see countries with comparable reliance overall on OOP spending to finance the health system but vastly different rates of catastrophic spending. For example, in both Spain and Romania just over 20% of health spending is paid for OOP, but catastrophic spending in Spain is under 2% and in Romania it is over 12%. These differences can largely be explained by these countries’ different approaches to co-payment policy (WHO Regional Office for Europe, 2023a).
Exempting users who are most likely to experience financial hardship can prevent those who are on low income or have chronic conditions from facing high amounts of user charges. Additionally, when applied to all services, caps can be an effective method of limiting OOP costs. To prevent high spending on costlier services or medicines, fixed co-payments are a better alternative to percentage-based co-payments.
User charges can act as barriers to care, preventing vulnerable groups from seeking health care due to costs. While it is one of the most common strategies to attempt to steer health care and keep expenditures low, the wide use of user charges does not necessarily mean that it is the best or most effective policy to achieve these goals. Equitable reform or alternative policies may prove better at decreasing unmet health care needs and improving health outcomes.Footnote 2
Key messages
Chapter 2.5 sets out how long-term care (LTC) is provided and how it is paid for. LTC refers to a broad package of personal, social and medical services provided over extended periods of time which may be delivered by care professionals or by informal care givers. Key learning includes that:
Population ageing, particularly in advanced economies, creates growing demands for LTC.
There are inequities in the need for and access to LTC. Older people, women, those with lower incomes and lower levels of education are all more likely to need care, but less likely to have access to it.
Funding arrangements for LTC are problematic in many countries:
○ voluntary insurance and out-of-pocket (OOP) payments commonly fill public coverage gaps but create inequities;
○ asset-tests for eligibility for publicly funded care are essentially regressive wealth taxes due to the unequal distribution of LTC needs;
○ encouraging for-profit provision theoretically fosters competition, availability and responsiveness but the pressures to generate profits can jeopardize quality and safety.
Countries face urgent pressures on LTC and could usefully consider:
○ increasing public expenditure and broadening the funding mix for LTC;
○ better, fairer pooling of resources across generations;
○ revenue sources independent of payroll contributions since labour markets as a revenue base will shrink at the same time that demand for ageing-related LTC increases;
○ better data and indicators to assess access, quality and value for money;
Introduction
In virtually all countries around the globe, and especially in advanced economies, populations are ageing rapidly due to declining fertility and increasing longevity. In 2018, for the first time ever, the worldwide population aged 65 years and older surpassed children under 5 years old (United Nations, 2019). Longer overall life expectancies are a remarkable achievement. Yet, globally, between 2000 and 2019, life expectancy increased faster than healthy life expectancy (a measure of whether years of life are spent in good health) for both men and women (WHO, 2020). According to Eurostat, on average across the 27 Member States of the EU, people aged 65 years old can expect to live another 20 years, but only 10 of those years will be spent in good health. Older people living with disability and in ill health may eventually struggle with everyday activities, from getting dressed, to shopping or going for a walk, and may at some point require a range of personal care and assistance services that is commonly referred to as LTC.
At the same time that population ageing is likely to lead to greater demands for health and LTC, ageing will also introduce stress on the financing and availability of care. The old-age dependency ratio – the number of people aged 65 years old or older as a percentage of the number of people aged 20 to 64 years old – is projected to jump from 30% in 2015 to more than 50% in 2050 on average across Organisation for Economic Co-operation and Development (OECD) countries (OECD and KIPF, Reference Kim and Dougherty2020). This will create unprecedented pressures on economies, societies and governments. In order to maintain current public debt-to-gross domestic product (GDP) ratios, tax revenue would need to increase by between 4.5 and 11.5 percentage points of GDP by 2060 in G20 countries just to counteract the impact of ageing (Rouzet et al., Reference Rouzet2019).
Economies and societies are also changing in other ways, potentially further hindering the financing and provision of LTC. Social structures are changing, with childless couples, single-parent families, divorce and single-adult households all on the rise. These trends could lead to fewer people being able, or willing, to care for their older relatives. On the other hand, networks of loosely connected family members from different marriages, partnerships and generations may emerge, with fresh approaches to cohesion and solidarity. The nature of work is also evolving, with non-standard forms of employment on the increase, from self-employment to temporary contracts (OECD, Reference Kim and Dougherty2020a). Along with small but rising numbers of people in new forms of employment such as platform and casual work, these workers have less access to social protection and make fewer contributions over their careers. It is possible that medical progress and technological innovation, such as in remote monitoring and assisted living, will help alleviate the strains on families caring for older relatives and friends (OECD, Reference Kim and Dougherty2020c), but that remains to be seen.
Against this challenging backdrop, we provide an overview of how LTC is defined, how it is provided, who pays for it and how, and, finally, how we might assess its performance, in terms of quality, access and value for money. Throughout the chapter, we provide examples of international approaches to designing and delivering LTC in old age, illustrating broad heterogeneity across countries and even regions. We conclude with priorities for research and policy. Although people of any age can become dependent on others through illness or disability, this chapter focuses on people who are aged 65 years or older.
In this chapter, we focus on what is commonly referred to as social LTC, as other parts of this book deal in greater detail with health care. It is the fact that LTC has a social component that makes it quite distinct from other types of health care. For example, as discussed in more detail below and in Chapter 3.6, in many countries LTC is not solely the responsibility of the Ministry of Health (often responsibilities are shared with the Ministry of Social Affairs), and many LTC services are not provided by licensed medical staff but by personal carers and families. Moreover, unlike with medical care, where most OECD countries have near-universal coverage, eligibility for LTC is contingent on onerous needs assessments (including multiple administrative procedures), and OOP costs are often tied to care recipients’, and sometimes their relatives’, income and wealth.
What is LTC?
LTC includes personal care, assistance service and social activities as an individual ages and becomes more dependent on others. As individuals grow older, their health deteriorates and they are more likely to need help from other people to carry out the activities that make up their daily lives, and which most of us take for granted. These activities include bathing and getting dressed as well as housekeeping tasks, like cleaning and shopping. As older people become more dependent, they may also find it difficult to maintain social relationships and participate in their community; for example, attending a community club or going out to meet friends. Finally, people who are dependent on others often need ongoing medical care to manage, commonly multiple, chronic conditions and ensure that they remain as healthy as they can be.
In this chapter, our definition of LTC encompasses personal care, assistance services and social activities, for periods of over six months or until end of life. Personal care services seek to provide support for activities of daily living (ADLs) including eating, bathing, washing, dressing, getting in and out of bed, and getting to and from the toilet and managing incontinence. Assistance services look to help individuals with instrumental activities of daily living (IADLs), such as shopping, laundry, vacuuming, cooking and performing housework, managing finances and using the telephone, among others. To prevent social isolation and further deterioration of physical and mental health, social care services may promote community activities whose primary purpose is social and leisure. This definition is slightly different from the definition of LTC in the System of Health Accounts (SHA) (and the definition used in Chapter 3.6), as it excludes nursing/medical care and furthermore restricts the target population to those aged 65 years old or older (OECD, Eurostat & WHO, Reference Eurostat2017). Rehabilitation services are typically considered medical/nursing care and are thus not discussed here.
How is LTC provided?
LTC is provided in a variety of ways across countries and subnational areas. Differences in how LTC is organized and delivered stem in large part from social norms regarding whose responsibility it is to care for older populations who become dependent on others. In some countries and regions, the responsibility falls first on spouses and children, with states acting as a safety net only for the most vulnerable groups, while in others LTC is considered a collective responsibility, with governments typically taking a leading role (Colombo, et al., Reference Colombo2011). Very generally, LTC can be provided: by formal and informal carers; in different settings, including the care recipient’s home and outside it; by public and private providers; and in kind (i.e. services) and in cash.
Who provides LTC?
Formal carers
Formal LTC workers are paid staff – typically nurses and personal carers – who provide care and/or assistance to people limited in their daily activities at home or in institutions, excluding hospitals (OECD, Reference Kim and Dougherty2020c). In 2016, on average there were five LTC workers per 100 people aged 65 years and over in 28 OECD countries, ranging from 13 workers in Norway to less than one per 100 older people in Greece, Poland, and Portugal (see Fig. 2.5.1). On average, across OECD countries, over 70% of formal LTC workers are personal care workers. Personal care workers include formal workers providing LTC services at home or in institutions (other than hospitals) who are not qualified or certified as nurses. Personal care workers provide routine personal care, such as bathing, to older, convalescent or disabled persons. Most workers have obtained a high school diploma or attended vocational schools, but 16% have lower education. LTC workers generally have lower qualifications than health workers do.
On average, OECD countries have five formal LTC workers per 100 people aged 65 years and over
OECD: Organisation for Economic Co-operation and Development.
Note: For New Zealand, latest data refer to 2018.

Figure 2.5.1 Long description
The y-axis notes the number of L T C workers per 100 people aged 65 and over, while the x-axis lists the countries. The values are as follows. Norway: 12.0. Sweden: 11.7. Israel: 11.2. Switzerland: 8.3. Netherlands: 8.3. Luxembourg: 7.5. Denmark: 7.4. Australia: 7.3. Japan: 6.8. New Zealand: 6.8. O E C D 24: 5.7. Germany: 5.5. Estonia: 5.2. Spain: 4.9. Korea: 4.8. United States: 4.5. Finland: 4.3. Austria: 4.1. Canada: 3.8. Ireland: 3.8. Czechia: 2.4. Hungary: 1.8. Slovenia: 1.7. Slovakia: 1.3. Portugal: 0.8. Croatia: 0.2.
Working conditions in this sector tend to be poor, which disproportionately affects women since, on average across the OECD, women hold about 90% of the jobs in the LTC sector. Almost half of LTC workers in the OECD (over half in northern and central European countries) work part time and over a fifth of declared formal carers, on average across the OECD, are foreign-born (OECD, Reference Kim and Dougherty2020c). In addition, half of LTC workers experience shiftwork and almost one quarter are on temporary contracts. While the work tends to be demanding, both physically and mentally, pay is often low (Rapp, Ronchetti & Sicsic, Reference Rapp and Ronchetti2021).
Informal carers
The definition of an informal carer is not straightforward. The two cornerstones of the definition are usually that: (i) an informal carer is a family member, close relative, friend or neighbour; and (ii) carers are non-professionals who did not receive qualifying training to provide care (even though they may undertake special training). Definitions tend to exclude paid non-professional carers providing care in private households, such as undeclared carers working in the “grey economy”. The extensive use of live-in, and to some extent live-out, migrant care workers, whose status lies between the two distinct categories of formal and informal carers, can make the line blurry between formal and informal caregiving.
Many older people who struggle with everyday activities may either prefer, or have no choice but, to find informal support in their partners, children, friends and neighbours. Informal carers are people providing any help to older family members, friends and people in their social network, living inside or outside their household, who require help with everyday tasks. These informal carers are generally the first line of support for older people, and in some countries, informal care is the most prevalent form of support (Colombo, et al., Reference Colombo2011). An average of 14% of individuals aged 50 years old and older in 18 OECD countries report providing informal care at least weekly (OECD, Reference Kim and Dougherty2020c) (Fig. 2.5.2). As with informal LTC, women make up the majority of informal caregivers (Fig. 2.5.3).
Across 18 OECD countries, more than 1 in 10 people aged 50 years and older report providing informal care at least weekly
ELSA: English Longitudinal Study of Ageing; HRS Health and Retirement Study; OECD: Organisation for Economic Co-operation and Development; SDAC: Survey of Disability, Ageing and Carers; SHARE: Survey of Health, Ageing and Retirement in Europe.
Note: The definition of informal carers differs between surveys. Data are for 2019 (or nearest year).

Figure 2.5.2 Long description
The y-axis lists the percentage among the population aged 50 years and over reporting carers from 0 to 25, and the x-axis lists the countries. Each bar has 2 stacks, for the number of daily carers and weekly carers, respectively. The values are as follows. Belgium: 9; 14. Austria: 13; 10. England (U K): 19 (total). Czechia Republic: 10; 9. Australia: 19 (total). Germany: 9; 9. Netherlands: 7; 9. Switzerland: 6; 9. France: 8; 7. Slovenia: 10; 4. Denmark: 5; 9. Sweden: 4; 10. O E C D 25: 7; 6. Croatia: 8; 5. Finland: 4; 8. Spain: 8; 4. Luxembourg: 5; 7. Italy: 8; 3. Bulgaria: 8; 3. Hungary: 8; 2. Poland: 6; 4. Estonia: 6; 4. Israel: 7; 3. Greece: 7; 2. Lithuania: 5; 3. United States: 7 (total). Romania: 5; 2. Slovakia Republic: 3; 3. Latvia: 3; 2.
Women are most likely to take on the role of informal carer
ELSA: English Longitudinal Study of Ageing; HRS Health and Retirement Study; OECD: Organisation for Economic Co-operation and Development; SDAC: Survey of Disability, Ageing and Carers; SHARE: Survey of Health, Ageing and Retirement in Europe.
Note: The definition of informal carers differs between surveys. Data are for 2019 (or nearest year).

Figure 2.5.3 Long description
The y-axis lists the percentage of women from 0 to 90, and the x-axis lists the countries. The values are as follows. Hungary: 80. Spain: 76. Greece: 73. Romania: 71. United States: 69. Bulgaria: 68. Latvia: 67. Poland: 65. Italy: 65. Australia: 65. Germany: 64. Czechia Republic: 64. Slovenia: 64. Denmark: 62. O E C D 25:60. England (U K): 60. Israel: 58. Croatia:57. Finland: 57. France: 56. Luxembourg: 56. Belgium: 55. Netherlands: 55. Estonia: 54. Lithuania: 54. Sweden: 54. Austria: 53. Slovakia Republic: 44. Switzerland: 37.
Formal versus informal care
Formal and informal care can either substitute for or complement each other, depending on the country and availability of various forms of formal care. Findings from the USA suggest that increased paid home care primarily went to people who were already receiving a greater amount of informal care from their adult children (Liu, Manton & Aragon, Reference Liu, Manton and Aragon2000; Langa et al., Reference Langa2001). In Europe, informal care tends to be a substitute for formal home care and paid domestic help, and informal care is more prevalent in countries where formal care is not as well developed or comprehensive (Van Houtven & Norton, Reference Van Houtven and Norton2004; Bonsang, Reference Bonsang2009; Bolin, Lindgren & Lundborg, Reference Bolin, Lindgren and Lundborg2008). While typically unrecognized and uncompensated, informal care is not without costs. Families and friends that provide support to dependent older individuals may suffer physical and mental stress, and are more likely to drop out of the labour market or reduce working hours. Income levels of working-age family carers are also likely to decline as a result of providing care.
Where is LTC provided?
The provision of LTC occurs in diverse settings and at different levels of intensity. Broadly, LTC can be home-based, facility-based or community-based. Settings include the older person’s own home, the home of relatives, friends or other individuals (e.g. a foster home), assisted living facilities, institutions and nursing homes, as well as community and day care centres. Services vary from alarm systems to constant personal care 24 hours per day seven days per week, depending on the older person’s specific needs and limitations. Different locations are considered better suited for different needs, limitations and preferences, with intensity and composition of care playing a key role in determining which location is better suited (OECD, Eurostat & WHO, Reference Eurostat2017).
In most countries, LTC for older people with less severe limitations will first be provided in their own home. If and when independent living in the home environment is no longer possible, older people may move into assisted living facilities where LTC workers are available onsite or on-call. If the older person becomes more dependent, they may be moved to an institution with permanent LTC staff providing predominantly nursing care or help with ADLs. Institutions that provide round-the-clock care may also have day care wards, where older people who are not staying in the institution can spend the day, thus providing respite for informal carers or formal home care workers.
In recent years, in response to both limited budgets and population preferences, many countries have started supporting the idea of a “deinstitutionalization” of LTC: promoting home- and community-based care rather than institutional care. Besides enhancing home-based services, these countries have promoted the use of community-based facilities such as hospices for terminally ill people, day-care centres and homes for the disabled. More than half of OECD countries have started to move LTC out of residential facilities, and towards the community (OECD, Reference Kim and Dougherty2020c). Between 2007 and 2017, the percentage of LTC recipients who received care at home increased 4 percentage points, from 64% to 68% (OECD, 2019) (Fig. 2.5.4).
A majority of OECD countries are moving LTC from residential facilities into the community
OECD: Organisation for Economic Co-operation and Development.

Figure 2.5.4 Long description
The y-axis lists the percentage, while the x-axis lists the countries. The 2019 values are as follows. Portugal: 35. Estonia: 52. Luxembourg: 58. Australia: 58. France: 59. Slovenia: 60. Netherlands: 65. New Zealand: 67. Finland: 68. Lithuania: 68. O E C D 20: 68. Korea: 72. Norway: 73. Sweden: 74. Hungary: 75. Denmark: 76. Switzerland: 76. Germany: 77. Czechia: 78. Spain: 81. Israel: 93. All countries except Estonia, France, Netherlands, New Zealand, Denmark, and Czechia show an increase from 2009.
Public versus private provision
LTC can be provided by public (be it national or subnational governments), not-for-profit (volunteers and organizations managed or owned by religious or civil society groups) or for-profit (privately owned) providers (Colombo, et al., Reference Colombo2011). Virtually all European countries allow voluntary and private provision of LTC (see the comparative tables from the Mutual Information System on Social Protection, www.missoc.org/missoc-database/comparative-tables/), but they differ widely in how they do so. Most commonly, a form of purchaser-provider split is used, so that governments continue to fund LTC services but provision is devolved to voluntary or private providers in some form of managed market or quasi-market (Fine & Davidson, Reference Fine and Davidson2018). The private sector may also be involved in financing LTC, through insurance (see the How is LTC financed section).
The data on public, not-for-profit and for-profit provision of LTC are sparse and outdated, but estimates for Europe and North America suggest there is significant heterogeneity across countries and settings (Table 2.5.1). For-profit provision is highest in England and the USA, followed by Brussels and Germany. Non-profit provision is highest in the Netherlands and for home care in Austria.
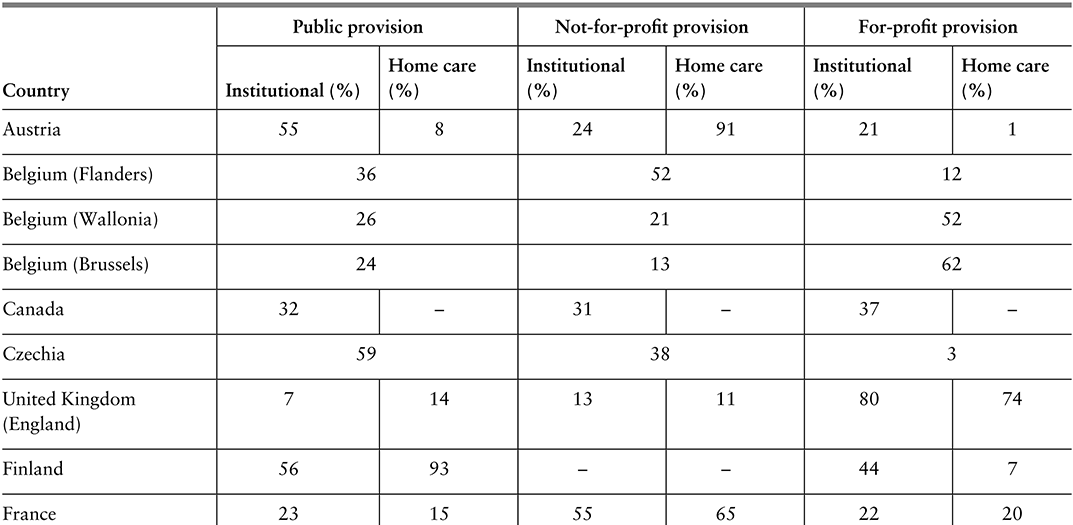
Table 2.5.1a Long description
The table has 4 main columns (and multiple subcolumns): Country, Public provision, Not-for-profit provision, and For-profit provision (the last three are further divided into Institutional (percentage) and Homecare(percentage)). It reads as follows. Austria: Public provision: 55; 8. Not-for-profit provision: 24; 91. For-profit provision: 21; 1. Belgium (Flanders): Public provision: 36. Not-for-profit provision: 52. For-profit provision: 12. Belgium (Wallonia): Public provision: 26. Not-for-profit provision: 21. For-profit provision: 52. Belgium (Brussels): Public provision: 24. Not-for-profit provision: 13. For-profit provision: 62. Canada: Public provision: 32; blank. Not-for-profit provision: 31; blank. For-profit provision: 37; blank. Czechia: Public provision: 59. Not-for-profit provision: 38. For-profit provision: 3. United Kingdom (England): Public provision: 7; 14. Not-for-profit provision: 13; 11. For-profit provision: 80; 74.

Table 2.5.1b Long description
The table has 4 main columns (and multiple subcolumns): Country, Public provision, Not-for-profit provision, and For-profit provision (the last three are further divided into Institutional (percentage) and Homecare(percentage)). It reads as follows. Finland: Public provision: 56; 93. Not-for-profit provision: blank; blank. For-profit provision: 44; 7. France: Public provision: 23; 15. Not-for-profit provision: 55; 65. For-profit provision: 22; 20. Germany: Public provision: 5; 2. Not-for-profit provision: 55; 37. For-profit provision: 40; 62. Italy: Public provision: 30. Not-for-profit provision: 50. For-profit provision: 20. Netherlands: Public provision: 0. Not-for-profit provision: 80. For-profit provision: 20. Slovakia: Public provision:75. Not-for-profit provision: 23. For-profit provision: 2. Spain: Public provision: 23. Not-for-profit provision: 24. For-profit provision: 53. Sweden: Public provision: 75; blank. Not-for-profit provision: 10; blank. For-profit provision: 15; 16. Switzerland: Public provision: 30; 30; 40. For-profit provision: U S A: 6; blank. Not-for-profit provision: 24; blank. For-profit provision: 70; blank.
Note: For certain countries only aggregate data are available and it is not possible to separate institutional and home care; in Spain, no clear distinction can be made for not-for-profit and for-profit providers.
The main rationale for private provision is competition, which in turn is thought to lead to more cost-efficient care that is also better aligned with the preferences of care recipients and their advocates (family and friends). On the other hand, there is concern that for-profit providers may put competitive advantage and profit margins ahead of quality and safety, and that regulating and auditing private actors is both costly and challenging (Fine & Davidson, Reference Fine and Davidson2018; Harrington et al., Reference Harrington2017; Chon, Reference Chon2019; Maarse, Jeurissen & Ruwaard, 2015). Whether or not to promote not-for-profit and for-profit provision, i.e. to facilitate the marketization of LTC, is not a trivial decision and the way it is operationalized and governed, for example, through contracts, is also not straightforward (Rodrigues, Leichsenring & Winkelmann, Reference Rodrigues, Leichsenring and Winkelmann2014). There are many forms of non-public provision, including contracting out the provision of specific LTC services (e.g. personal care) to single providers, providing vouchers to care recipients to spend how they see fit, and establishing lists of certified providers from which older people and their advocates can choose from (Fine & Davidson, Reference Fine and Davidson2018).
Help to access LTC provision: in-kind support versus cash
LTC can be provided in kind (as goods, commodities or services) or in cash (as money transfers to the care recipient, the household or the informal carer). In-kind support includes care provided by formal carers (regardless of setting) as well as special aids and equipment. In cash support can be used to purchase or obtain care services from formal public, voluntary and private providers, as well as to compensate informal carers, depending on the specific regulations governing cash benefits. In some countries, as in France and Belgium (Flanders), cash transfers (often in the form of vouchers) can only be used to pay for LTC services from accredited and certified providers, while in others, as in Austria and Czechia, transfers are provided directly in cash and there is little control over how the cash is used (i.e. can be used to pay for non-LTC goods and services). Most countries have multiple forms of LTC benefits and schemes, some of which are provided in kind and some in cash, although some countries rely exclusively on cash benefits or purely on in-kind services (Cravo Oliveira Hashiguchi & Llena-Nozal, Reference Cravo Oliveira Hashiguchi and Llena-Nozal2020). In certain countries, such as Japan and Korea, LTC is typically provided in kind, but care can be provided in cash in remote areas where public LTC provision is more restricted (Colombo, et al., Reference Colombo2011; Cravo Oliveira Hashiguchi & Llena-Nozal, Reference Cravo Oliveira Hashiguchi and Llena-Nozal2020). Both in-kind and cash schemes may require care recipients to share a part of the costs (Colombo, et al., Reference Colombo2011), as discussed further below.
Cash transfers are touted as a way to promote user choice and allow older people and their advocates to select the providers that best align with their preferences and needs. The Netherlands introduced a system of personal budgets in the late 1990s (Box 2.5.1) that in some circumstances also allow in-kind support. Cash transfers, depending on the exact rules and regulations, can be easier to set up and have lower operational costs than services provided in kind (Creti & Jaspers, Reference Creti and Jaspers2006). Limiting cash transfers may also be an easy response to tightening of budgets, but this may lead to higher out-of-pocket (OOP) spending for care recipients and their families, with potentially negative consequences for access and affordability. Indeed, in-kind services may be a better way to target scarce public support and to make sure public resources are used in the consumption of LTC goods and services and not, as may be the case with cash transfers, for purposes other than care.
Personal budgets (persoonsgebonden budget, in Dutch) were introduced in the Netherlands in 1996 as a way to encourage the marketization of LTC and competition among new for-profit providers, as well as to promote user choice in line with individual needs and preferences (Rodrigues, Leichsenring & Winkelmann, Reference Rodrigues, Leichsenring and Winkelmann2014). Depending on the type of care needs older people have, they can apply for a personal budget from their regional care administration office (under the Chronic Care Act), their health insurance company (under the Health Care Insurance Act) or their municipality (under the Social Support Act) (Government of the Netherlands, 2021).
Older people with more severe LTC needs may use a personal budget to contract home care but only if the costs of home care do not exceed the costs of institutional care. If requesting their budget from their regional care administration office, applicants must create a budget plan describing which services they intend to purchase and from whom, and must sign contracts with each care provider; they can combine the budget with care in kind. Older people requesting their budget from their health insurance company or municipality must explain why they want a personal budget, and the company or municipality will then assess the quality of the services and equipment that is purchased. For budgets agreed by the regional office or municipality, payments are made directly by the Social Insurance Bank (or SVB, which is the organization that implements national insurance schemes) to providers from the care recipient’s personal budget (Government of the Netherlands, 2021).
Under budgets agreed by the municipality, funds can be used to compensate informal carers such as relatives and friends – provided the particular municipality allows this within its own rules and as long as a contract is established between the parties stipulating what care will be provided and for what payment (Eurocarers, 2023). Furthermore, payments to informal carers from personal budgets are considered taxable income, but they do not cover social or pension contributions (Eurocarers, 2023).
Between 2005 and 2008 the number of personal budget holders in the Netherlands grew by an average of 28% every year (Maarse & Jeurissen, Reference Maarse and Jeurissen2016). In 2014, around 120 000 people had personal budgets, but this number went down substantially to 38 500 in 2016 for a number of reasons (Kelders & de Vaan, Reference Kelders and de Vaan2018). The scheme is believed to be more susceptible to fraud, and the quality of care provided is difficult to control (Kelders & de Vaan, Reference Kelders and de Vaan2018). There have also been concerns that the budgets did not, despite expectations, entice new entrants into the LTC market, nor bring down total costs of care through competition. Rather, it would seem that personal budgets were used to compensate relatives and friends who were already providing care, that the budgets only partially substituted for in-kind care, and that people who would not otherwise have applied for care had applied for and been granted a personal budget (Rodrigues, Leichsenring & Winkelmann, Reference Rodrigues, Leichsenring and Winkelmann2014). A recent analysis also found that recipients of the budgets did not have more independence, social participation nor a higher quality of life than those receiving help in kind (Marangos et al., Reference Marangos2020). Thus, despite its good intentions, the personal budget system has not been as successful in the long-term as hoped, in terms of marketizing LTC, increasing competition among new for-profit providers, and promoting user choice in line with individual needs and preferences.
How is LTC financed?
In many high-income settings, public sources cover at least some portion of LTC financing, but voluntary insurance and private payments often also play a significant role. In most OECD and EU countries (OECD, Reference Kim and Dougherty2020b), the costs of LTC are covered to some extent either by a government scheme, at national or subnational level, or through compulsory insurance (mainly social insurance). Public schemes typically only partially cover the total costs of LTC, and so voluntary insurance and private payments (OOP) represent a nontrivial share of total LTC spending. Government schemes are used in Scandinavian countries, Australia, New Zealand and in Austria. Nordic countries typically have universal coverage under one single programme. Countries which have a dedicated social insurance scheme include Germany, Japan, Korea, the Netherlands and Luxembourg, whereas parts of Belgium arrange coverage mostly within the health system.
How much is spent on LTC, in total?
Spending on LTC varies, but tends to be higher in countries where government spending on health is higher in general. On average across the OECD, 1.5% of GDP was spent on all LTC services (health and social) in 2018, equating to around US$ 760 per capita (adjusted for differences in price levels across countries; see Fig. 2.5.5) (OECD, Reference Kim and Dougherty2020b). Spending data from the OECD generally cover both the health and social components of LTC. The health component includes help with ADLs (along with nursing care, like treating pressure ulcers), while the social component covers primarily help with IADLs (OECD, 2019). For some countries, the social part of LTC spending is not reported (but in some cases it is implicitly included under the health component). In some countries, various elements of private spending are also not reported.
Out of OECD countries, total spending on LTC as a share of GDP is highest in the Netherlands and Scandinavian countries, reflecting more developed formal LTC benefits, services and schemes. There is then a second group of countries (which include France, Germany, Japan and the United Kingdom) where total LTC spending accounts for 2% to 2.5% of GDP. A third group, composed mostly of south-eastern European and Latin American countries, spends significantly less on LTC, relying on unpaid or unaccounted informal caring. In countries that report on both health and social components of LTC spending, the health component accounts for around 70% of total spending, on average (OECD, Reference Kim and Dougherty2020b). Total LTC spending has increased gradually in the last decades, both as a share of GDP and as a share of total health spending (OECD, Reference Kim and Dougherty2020b).
Total spending on LTC as a share of GDP varies across OECD countries
Notes: 1. Country not reporting spending for LTC (social). In many countries this component is therefore missing from total LTC, but in some countries it is partly included under LTC (health). 2. Country not reporting spending for LTC (health). Data are for 2021 (or nearest year).

Figure 2.5.5 Long description
The y-axis notes the percentage of G D P from 0 to 5, while the x-axis lists the countries. The Netherlands spends the highest, while Greece spends the lowest. Between 2 and 5 percent: Netherlands, Norway, Sweden, Denmark, Belgium, United Kingdom, Switzerland, France, Germany 1, Canada 1, Japan 1, Iceland, Czechia Republic. Between 0.5 and 2: Finland 1, O E C D 31, Austria 1, Slovenia, Ireland, Australia, Luxembourg, United States, Lithuania, Korea 1, Spain, Portugal, Italy 1, Israel 2, Estonia, Hungary, Latvia, and Poland 1. Below 0.5 percent: Romania, Bulgaria 1, Croatia 1, and Greece 1.
As stated, governments and compulsory social insurance cover the bulk of the costs of LTC provision. Countries where total LTC spending is high also tend to have high shares of government spending (between 92% and 94%). Conversely, in Estonia and Portugal, public spending accounts for only 60% or less of total LTC spending (OECD, Reference Kim and Dougherty2020b). The largest share of total LTC spending is devoted to nursing homes (mostly institutional care, although some nursing homes provide home care and help with IADLs), accounting for 80% of total spending in the Netherlands (see Fig. 2.5.6). By contrast, nursing homes account for only 20% of total spending in Korea and Portugal, two countries where total spending as a share of GDP is also lower. The heterogeneity in spending devoted to different types of providers is significant, with different providers playing more important roles in different countries (e.g. hospitals in Japan, social providers in Portugal, home care in Norway, etc.). Some countries provide cash benefits and allowances for family carers, a spending category (“households”) that can account for a significant share of total spending, as in Austria.
The largest share of total LTC spending in OECD countries is on nursing homes
IADL: instrumental activities of daily living; LTC: long-term care.
Note: Countries not reporting social LTC. The category “Social providers” refers to providers where the primary focus in on help with IADL or other social care. Data are for 2021 (or nearest year).

How much do individuals spend on LTC?
Costs and use of LTC varies, but the price for intensive and sustained support adds up quickly and can become catastrophic for individuals.
Data on aggregate spending on LTC provide limited insights into the OOP costs of LTC services for older individuals, and whether older people with LTC needs might be impoverished due to high OOP costs. LTC needs are difficult to predict, even at older ages and while many older people will never require formal LTC, some will need intensive and sustained support, the costs of which may add up over time (Muir, Reference Muir2017). Moreover, and as previously discussed, LTC needs and use of services are not equally distributed among older populations. Importantly, in the context of OOP spending, survey data suggest the prevalence of LTC needs is higher among older people on lower incomes. It is thus appropriate to explore individual spending on LTC services, and to understand how aggregate spending is associated with individual affordability and protection from poverty, especially among those older people who most need care.
On average across 25 OECD and EU countries for which data are available, the total costs of LTC that older people could face if they did not have access to public social protection represent up to five times the median disposable income of individuals of retirement age or older (Fig. 2.5.7). Without public social protection, the majority of older individuals would not be able to afford LTC from their incomes alone, especially those on lower incomes. To protect older people with LTC needs from these potentially catastrophic expenses, most OECD and EU countries provide some level of public risk pooling, whether predominantly tax-funded (e.g. Finland), based on compulsory social insurance (e.g. Germany), or a mix of these two (e.g. France). The scope, breadth and depth of these public social protection systems for LTC vary widely across countries, with some providing universal comprehensive coverage (e.g. Luxembourg) and others providing targeted means-tested safety nets (e.g. USA) (Cravo Oliveira Hashiguchi & Llena-Nozal, Reference Cravo Oliveira Hashiguchi and Llena-Nozal2020).
Without public social protection, the majority of older individuals would not be able to afford LTC from their incomes alone
Note: Bars show averages for 25 countries in the OECD and EU. Low income refers to the upper boundary of the 20th percentile, and high income to the upper boundary of the 80th percentile. Low, moderate and severe needs correspond to 6.5, 22.5 and 41.25 hours of care per week, respectively. The costs of institutional care include the provision of food and accommodation, so are overestimated relative to home care.

Figure 2.5.7 Long description
The y-axis notes the Total costs of long-term care as a share of disposable income, from 0 to 400 percent, while the x-axis lists the degrees of need. Each section has 3 bars: low income, median income, and high income, respectively. The approximate values are as follows. Home care for low needs: 52 percent; 45 percent; 30 percent. Home care for moderate needs: 198 percent; 142 percent; 90 percent. Home care for severe needs: 360 percent; 250 percent; 165 percent. Institutional care: 270 percent; 195 percent; 125 percent.
Older people with similar LTC needs often face significantly different OOP costs depending on their means, and where they live and seek formal care. Most countries will cover part of the total costs of LTC, but in most cases users will still need to contribute. Research based on a set of typical cases of LTC needs that has been used to achieve comparability across countries indicates that in most OECD countries, public social protection schemes would cover at least 60% of the total costs of care for moderate needs (Cravo Oliveira Hashiguchi & Llena-Nozal, Reference Cravo Oliveira Hashiguchi and Llena-Nozal2020). The remaining share of costs – the OOP costs – are typically determined based on, often intricate, rules and calculations that can differ depending on the exact benefit and scheme that applies or the type of help provided (e.g. coverage for help with IADLs is often more limited). Many countries provide greater cost coverage to older individuals with more severe LTC needs and lower means but in a few countries, due to ceilings on public support, the opposite is true. The large majority of LTC benefits and schemes, across countries, have means-tested coverage of costs (Table 2.5.2). The exact form of means-testing varies widely across countries, with some countries providing very comprehensive cost coverage and others providing no support whatsoever to older people with higher incomes and assets.

Table 2.5.2 Long description
The table has 2 columns: Assets-tested and Not assets-tested. It reads as follows. Row 1: Income-tested. Assets-tested: Flanders (Belgium), Croatia, England, Tallinn (Estonia), France, Germany, Hungary, Ireland, South Tyrol (Italy), Japan, Lithuania, Netherlands, Slovenia, Spain, California (U S A), Illinois (U S A). Not assets-tested: Vienna (Austria), Flanders (Belgium), Ontario (Canada), Tallinn (Estonia), Finland, France, Hungary, Reykjavik (Iceland), Korea, Latvia, Lithuania, Luxembourg, Slovakia, Sweden. Row 2: Not income-tested. Assets-tested: Croatia. Not assets-tested: Vienna (Austria), Flanders (Belgium), Ontario (Canada), Czechia, England, Finland, Germany, Reykjavik (Iceland), Ireland, South Tyrol (Italy), Latvia, Lithuania, Luxembourg, Slovakia, Slovenia, Spain.
Note: Countries and subnational areas can belong to more than one category if they have multiple benefits and schemes.
Due to differences in cost coverage across countries, needs and means, older people with similar LTC needs could face significantly different OOP costs depending on where they live and seek formal care. In a number of EU countries (e.g. Croatia and Latvia), older people with severe needs and median incomes would face OOP costs for home care that are higher than their income (Cravo Oliveira Hashiguchi & Llena-Nozal, Reference Cravo Oliveira Hashiguchi and Llena-Nozal2020). In other places (e.g. Estonia, Slovenia and parts of the USA), OOP costs of home care for moderate needs would represent over half of median incomes among older individuals, leaving the other half to pay for basic costs of living, such as electricity and food. OOP costs of institutional care for severe needs are almost universally lower than OOP costs of home care for severe needs. While most countries have safety nets to protect the most economically vulnerable older people, many countries set eligibility thresholds far below international relative income poverty lines (e.g. 50% and 60% of median equivalized disposable income after social transfers in the OECD and EU respectively). High OOP costs are likely to lead older people to deplete their assets to pay for care, seek alternatives (like informal care) or forgo care altogether.
Some countries use asset-tests to determine eligibility and support levels granted to individuals who need LTC. Across OECD countries, older people are more likely to have lower incomes (compared to their younger peers). However, they are also more likely to have accumulated assets over their lifetimes and thus have comparatively higher net wealth (Balestra & Tonkin, Reference Balestra and Tonkin2018). For this reason, and in response to budgetary constraints, some governments have adopted assets-tests to determine eligibility for and level of support from public social protection systems. Assets-tests are implemented in a myriad of ways across the OECD. Some systems protect assets below a certain threshold by excluding them from assets-tests and some exclude certain types of assets like an older person’s primary residence (especially if the older person is receiving home care). More recently, some countries (e.g. France, USA) have sought to implement deferred payment agreements or reverse mortgages, whereby governments will pay for care but older individuals agree to use their assets (including their primary residence) to partly or fully repay the state at a later date (e.g. when they move to institutional care or when they pass away). Assets-tests need to be well-designed to avoid distorting saving behaviour. Furthermore, considering the unequal distribution of LTC needs, assets-tests can be considered a regressive wealth tax on those who need LTC.
Public coverage of the total costs of LTC is crucial. Without it, the majority of older people in the OECD and EU would not be able to afford the OOP costs of care without falling below relative income poverty lines. Social protection is especially vital in protecting older people from the very high costs of care for severe needs. However, public support does not completely eliminate the risks of income poverty associated with LTC in old age. Even with social protection, poverty risks are often still higher among older people with LTC needs than among the general older population (Cravo Oliveira Hashiguchi & Llena-Nozal, Reference Cravo Oliveira Hashiguchi and Llena-Nozal2020).
LTC support: who needs it, and who receives it?
Due to data scarcity, it is difficult to determine who applies for, qualifies for and takes up public LTC support, who receives informal LTC and who has unmet LTC needs.
When an older person becomes dependent on others, they and perhaps their family and friends face the choice of seeking support from the state or finding other alternatives, such as informal care or support from carers in the grey economy (Fig. 2.5.8). Ultimately, if an older person cannot find care, this may lead to unmet needs. Decisions to apply for public support may be driven by several factors, including awareness of public benefits and schemes, knowledge of where and how to apply, and availability of regional care administration offices, for example. If the older person does apply, a process of formal needs assessment begins. This may not be immediate and there may be waiting times between requesting an assessment and receiving one. Once the older person’s needs have been assessed, they may or may not qualify for public support. If they do qualify, the level of support they receive will likely depend on their needs but, potentially, also their means (income and net wealth). Once the level of support is determined, the older person and their advocates may choose to take it up or not. They may find it does not meet their expectations and seek alternatives.
Comprehensive and comparable data on the decision points in Fig. 2.5.8, and the reasons behind the decisions taken, are scarce, making it difficult to quantify, in any given year, the numbers of older people who: apply for public LTC support (which could be used as a proxy for self-assessed LTC needs); qualify for public support; take up public support; receive and/or prefer informal care; and have unmet LTC needs.
Assessments of LTC needs vary widely across countries
While a definition of LTC has been agreed to in the SHA, in practice there is a wide range of definitions implicit in needs assessments applied by countries, and in some cases, subnational areas. Assessments of LTC needs vary widely across countries, in terms of who undertakes the assessment, which types of needs are considered, the scoring systems used to rate the severity of needs, whether social structures and external factors are taken into account, how scores are aggregated and, finally, how scores relate to service and benefit levels (Cravo Oliveira Hashiguchi & Llena-Nozal, Reference Cravo Oliveira Hashiguchi and Llena-Nozal2020). The determination of whether an older person is dependent on others and needs LTC is as much a result of their limitations with everyday activities as it is driven by needs assessments (Brugiavini et al., Reference Brugiavini2017).
Assessments of LTC needs are used by countries, and some subnational areas, to determine whether an older person has limitations that qualify them for public LTC benefits, services and schemes and may also be used to determine the level of support that older people qualify for. Several concepts have been used to describe the conditions that lead an older person to require LTC, including terms like vulnerability, frailty, comorbidity, disability and dependency (Brugiavini et al., Reference Brugiavini2017; Rodríguez-Mañas et al., Reference Rodríguez-Mañas2013; Fried et al., Reference Fried2004; De Vries et al., 2010; Pel-Littel et al., Reference Pel-Littel2009). Definitions for these concepts vary, and it is difficult to establish how they differ, how they relate to one another, and how they might be measured. One study found 20 instruments to measure frailty alone (De Vries et al., 2010). The most commonly used instruments are the Lawton Instrumental Activities of Daily Living Scale for measuring difficulties with IADLs, which gives a score between zero (totally dependent) and eight (totally independent), and the Barthel Index of Activities of Daily Living for measuring limitations with ADLs, which gives a score between zero (totally dependent) and 20 (totally independent).
There is no standardized, internationally recognized, instrument to determine whether an older person has LTC needs and how intense they are. Instruments and procedures used to assess LTC needs vary widely (Cravo Oliveira Hashiguchi & Llena-Nozal, Reference Cravo Oliveira Hashiguchi and Llena-Nozal2020). Across OECD and EU countries, needs assessments use different combinations of ADLs, IADLs and even, in some cases, factors such as loneliness and self-assessed ability to cope with difficulties. For example, being aware of dangers and being able to have a social life are included in needs assessments in Belgium. In Croatia, Italy, Ireland and the Netherlands, social networks and external factors, such as the availability of an informal carer, are taken into account in needs assessments. In recent years, countries have revised their needs assessments to gauge not just physical limitations but also mental and cognitive impairments. For example, Austria included dementia explicitly in needs assessments in 2009 while Germany added cognitive and psychological impairments in 2017. These developments are significant, given that an estimated 19 million people in the OECD are living with dementia (OECD, 2018), and that instruments that measure only ability to perform ADLs and IADLs may miss important limitations that are driven by cognitive impairments (Bucks et al., Reference Bucks1996).
Instruments and procedures used to assess LTC needs vary widely
LTC: long-term care.
Note: Clouds represent boundaries of the diagram (entries and exits into system); exit does not mean person cannot re-enter the system at a later point in time. Diamonds represent decision points.

The way different limitations are combined to produce an overall level of LTC needs also varies across countries, and naturally implies distinct hierarchies of limitations. Different weights are used for different types of limitations and factors. For example, in Germany, the highest weights are placed on “self-sufficiency”, a category that comprises 13 indicators, and within which items such as eating, drinking and using the toilet have higher weights than others. Mobility (comprised of five indicators) has the lowest set of weights. In Lithuania, each factor contributes a specified amount to the overall composite score of needs, but factors are scored differently so that some implicitly count more towards the final score. The final composite score of needs is used to categorize an older person in terms of the severity of their needs. The number of categories varies across countries. For many countries, the number of categories and levels is between three and five categories. Luxembourg is an exception, with 15 categories based on minutes of care needed per week (Cravo Oliveira Hashiguchi & Llena-Nozal, Reference Cravo Oliveira Hashiguchi and Llena-Nozal2020). Some of the categories may not be eligible for any public support.
Countries also differ in terms of who is responsible for conducting the needs assessment. In Belgium and Finland, assessments are performed by multidisciplinary teams. In Latvia, assessments are conducted by general practitioners and social workers, while in Germany specialized doctors and nurses are involved. In Austria and England, assessments are based on a physician’s evaluation. In Japan, a computer-aided initial assessment (based on an 85-item questionnaire) is used to assign each applicant to one of seven levels of LTC needs. The Japanese Care Needs Certification Board, a committee of medical and other professionals, then reviews the results and makes a final decision.
Assessments of LTC needs also vary within countries
Needs assessments are not always standardized within countries, which introduces variation at the subnational level. Austria, Germany and Luxembourg, for example, have nationwide instruments while in Italy, instruments are regional. France uses a standardized assessment tool nationwide but there seems to be variation across regions in the interpretation, generating differences in the number of beneficiaries. In Estonia, different agencies have different assessment scales and procedures. In Belgium, Canada and the USA there are both federal and regional benefits and schemes, with their own specific rules and regulations, including needs assessment instruments. In Portugal, there is one needs assessment scale for cash benefits and another for in-kind care. In Denmark, Finland, Iceland, Norway and Sweden, municipalities are responsible for conducting needs assessments and setting eligibility criteria, based on a set of guiding principles (e.g. universal care in Denmark).
Because there is no single internationally accepted and standardized approach to identify and measure LTC needs, cross-country comparisons of administrative data on the number of recipients reflect differences in eligibility, scope and depth of public support. Administrative data on applications for, and results of, needs assessments would be very useful but these data are not available for the majority of countries. Existing cross-country estimates of the prevalence of LTC needs in older populations are thus based on survey data. The exact questions used vary across surveys, with some estimates relying on a single question to establish self-assessed needs, and other studies using some aggregation of self-reported limitations in ADLs, IADLs and physical functioning.
The World Health Organization estimates that, globally, at least 142 million people, equivalent to around 15% of those aged 60 years old or older in the world, lack the ability to meet basic needs (WHO, 2020). This estimate is based on three elements (ability to get dressed, to take medication and to manage money) in national surveys from 37 countries (together these countries account for 49% of the world’s population aged 60 years old and older). The 2021 Ageing Report of the European Commission estimates that 34% of individuals aged 65 years and older in the 27 EU Member States plus Norway are dependent and may require LTC (Directorate-General for Economic and Financial Affairs, 2021). The estimate is based on “self-perceived longstanding limitation in activities because of health problems [for at least the last 6 months]”, as reported in the EU Statistics on Income and Living Conditions (EU-SILC). A different estimate, also by the European Commission, indicates that 31% of people aged 65 years and older in 22 EU Member States were in need of LTC in 2019 (European Commission, 2021). This estimate uses data from the European Health Interview Survey or EHIS.
Responses to the Survey of Health, Ageing and Retirement in Europe (SHARE) indicate that, on average across 26 EU Member States, 16% of the population aged 65 years and older report at least one limitation in ADLs, 24% report one or more limitations in IADLs and closer to 30% report at least one limitation in either ADLs or IADLs (Fig. 2.5.9). There is wide variation across countries. For example, the percentage of older individuals reporting limitations in IADLs in the Netherlands and in Sweden are around 14%, while in Hungary and Romania, over 30% of older people report limitations in IADLs. Data from SHARE indicate that older people reporting limitations in ADLs and/or IADLs are more likely to be women, aged 80 years old or older, have lower levels of education, earn lower incomes and live in single households.
Nearly a third of people 65 years and older in the EU report at least one ADL/IADL limitation
ADL: activities of daily living; IADL: instrumental activities of daily living; SHARE: Survey of Health, Ageing and Retirement in Europe.
Note: EU26 is the unweighted average of population-weighted national shares; data refer to 2015 for the Netherlands and 2017 for the rest of countries. Older people are those aged 65 years old and older.

Figure 2.5.9 Long description
The y-axis notes percentages from 0 to 45, while the x-axis notes the countries. In increase order of percentages, the countries are as follows. 25 percent or below: Netherlands, Sweden, Finland, Malta, Portugal, Denmark, Luxembourg, and Cyprus. Between 25 percent and 35 percent: Slovenia, Greece, Germany, Czechia Republic, E U 26, France, Italy, Spain, Austria, Slovak Republic, Latvia, Estonia, Croatia, Lithuania, Poland, Belgium, Bulgaria, and Hungary. Above 35 percent: Romania.
Women, older people, those with less education and those who earn less are more likely to have greater LTC needs, but in some cases have less access to it.
On average across 26 EU Member States, 18% of older women report at least one limitation with ADLs compared to 14% of older men, and 28% of older women report at least one limitation with IADLs compared to 18% of older men. Individuals aged 80 years old or older are almost three times more likely to report limitations in ADLs and IADLs than individuals aged 65–79 years (31% and 48% of people aged 80 years old and older report limitations in ADLs and IADLs respectively, compared to 11% and 15% of people aged 65–79 years). The shares of older people reporting at least one limitation in ADLs and/or IADLs are higher among those with lower levels of education compared to those with medium and high educational attainment (International Standard Classification of Education (ISCED) 1997 codes used to define the levels of education; codes 0–2 for lower level, codes 3–4 of medium level and codes 5–6 for higher level). On average across 26 EU Member States, the prevalence of self-reported limitations in ADLs among older people with a low level of education is more than double that among older people with a high level of education (22% compared to 10%). With respect to IADLs, 13% of older individuals with a high level of education report limitations, compared to 33% of older people with a low level of education.
On average across 26 EU Member States, the prevalence of self-reported limitations in ADLs among older people earning in the bottom income quintile is around 22% compared to a prevalence of 9% among older people with earning in the top income quintile (income refers to households equivalized income using the square root of household size as an equivalence scale). Moreover, older people with self-reported limitations in ADLs and IADLs are more likely to live in single households, limiting their ability to access informal care.
On average across OECD countries, just over one in 10 people aged 65 and older received formal LTC benefits and services in 2017, according to administrative data from national authorities (OECD, 2019). The range across countries is broad, from 22% in Switzerland to 1% in Poland. Data on recipients of LTC provided by voluntary and private providers are more difficult to collect, especially when the state is not paying the costs of care. For this reason, countries where privately funded care is more prevalent may report lower numbers of recipients. The majority of LTC recipients are aged 80 years old and older and women, in line with the distribution of LTC needs shown previously. On average across the OECD, 65% of older people receiving LTC are aged 80 years or older (OECD, 2019). In all OECD countries for which data are available, women make up the majority of LTC recipients aged 65 years or older, both in institutions and at home (Fig. 2.5.10). Further breakdowns of administrative data on recipients, for example for education and income, are not possible due to data gaps.
The majority of LTC users are women and those aged 80 years and above
LTC: long-term care.
Note: Data for the USA are from 2016, and for Slovenia and the Netherlands for 2017. All other data are for 2018.

Figure 2.5.10 Long description
The y-axis notes percentages from 0 to 90, while the x-axis notes the countries. Each country (with some exceptions) has two bars: L T C recipients in institutions (other than hospitals), and L T C recipients at home. Denmark has no bar for L T C recipients in institutions. There are also no bars for L T C recipients at home for Latvia, Poland, Ireland, Canada, Netherlands, Slovenia, and Switzerland. All the other countries - Portugal, Australia, New Zealand, Sweden, Norway, Finland, Israel, United States, Estonia, Lithuania, Germany, Spain, Hungary, Luxembourg, Czechia Republic, and Korea - have both bars. A horizontal line has been drawn at y equals 50 percent. All bars consistently stay above this line. The highest value for L T C recipients in institutions is for Korea (79 percent), while that for L T C recipients at home is for Estonia, Spain, and Hungary (72 percent).
Regardless of which estimate of prevalence of LTC needs is considered, the number of recipients falls short of the number of older people who might need LTC. There are a number of reasons why older people who need LTC may not be counted as recipients of LTC benefits and services in administrative data. First, as discussed (see Fig. 2.5.8), not all older people who have LTC needs or limitations apply for benefits and services. They may seek support from their families first, a decision that is likely affected by cultural norms around the degree to which families look after older people. Second, older people who have LTC needs may not qualify to receive LTC. Third, older people may also pay for care in the voluntary or private market, or seek care from providers in the grey economy.
Across 17 EU Member States, an average 54% of older people who report having limitations with ADLs or IADLs also report they receive help with activities they have problems with, including help from their spouses and other people in their household (Fig. 2.5.11). This compares to 9% of older people who report no limitations in ADLs or IADLs but do report receiving help (these older people may still have limitations in physical functioning). As with recipients of formal LTC, women and those aged 80 years old or older are more likely to report receiving help.
Just over half of older people reporting a need for help also report receiving help for it
ADL: activities of daily living; EU: European Union; IADL: instrumental activities of daily living; SHARE: Survey of Health, Ageing and Retirement in Europe; TILDA: The Irish Longitudinal Study on Ageing.
Note: Help from partner or other people in household is included; the EU17 average is the unweighted average of the population-weighted national shares in each country.

Figure 2.5.11 Long description
The y-axis represents percentages from 0 to 80, while the x-axis represents the countries. Each country has two bars: No limitations with A D Ls and I A D Ls, and At least one limitation with A D Ls and I A D Ls. The bars for No limitations consistently stay below 10 percent except for Czechia (15 percent), Germany (12 percent), and the Netherlands (11 percent). For At least one limitation, the countries from lower to higher percentages are as follows. Between 30 percent and 50 percent: Croatia, Estonia, Poland, Luxembourg, Slovenia, and Austria. Between 50 percent and 60 percent: Czechia Republic, Germany, France, Sweden, E U 17, Spain, Belgium, and Italy. Above 60 percent: Portugal, Greece, Denmark, and Netherlands.
Policy relevance and conclusions
Our conclusions and policy suggestions fall into two areas: the financing of LTC, and how best to assess its quality.
How else to finance LTC?
As populations age and demand for LTC rises, countries face challenges finding the financing to expand LTC coverage for high-quality, accessible, affordable and equitable services.
Many countries are trying to find sustainable solutions for financing LTC in the face of increasing demand due to population ageing. As previously discussed, countries use a variety of cost-sharing mechanisms or strict eligibility criteria to have a form of targeted universalism (OECD, 2011).
Options for governments to finance growing needs include better pooling of financing across generations, broadening of financing sources beyond payroll contributions, and introducing elements of pre-funding. Funding through a rise in social security and payroll taxes would be a major challenge as in some countries taxpayers already feel overburdened. Other forms of taxation outside of income taxes could be considered; for example, earmarking a fixed percentage of the value-added tax to finance reserve funds or a percentage of the tax revenue of other taxes, such as local property taxes (as is the case in France) would in practice increase the tax base of LTC financing. Certain countries have considered the (re)introduction of a wealth tax or increasing the tax levied on the highest incomes as alternative options to finance LTC but these options are likely to be controversial.
Debates about raising taxes have enhanced the attractiveness of introducing a public LTC insurance. The advantages of a dedicated insurance scheme include more transparency in managing funds and a possibility to prefund care instead of creating debts for the future. Disadvantages of such a scheme include its reliance on employee contributions, which can have negative impacts on employment and growth, as well as raise issues with respect to equity and intergenerational fairness. Unless the scheme was extended to the unemployed and the self-employed, it would have a limited tax base, which raises issues regarding equity. For those who are not working, the LTC insurance contribution would still need to be paid from taxes.
In addition, countries could facilitate the development of financial instruments to pay for the board and lodging costs of LTC provided in institutions. Options include bonds or equity release schemes (as in Australia and Ireland), public measures to defer payments (as in the United Kingdom and the USA), and private sector products, such as reverse-mortgage schemes and combinations of life and LTC insurance policies. So far, the development of such products remains limited due to minimal interest from providers and citizens, as well as complex regulatory challenges.
How do we assess LTC performance and quality?
There is limited evidence and understanding around what works in LTC, and thus it is difficult to design and implement effective policy reforms. How to assess the performance of LTC systems remains a challenging yet crucial question. The quality of LTC is important for at least three reasons. First, users of care services increasingly demand more voice and control over their lives. Second, LTC services are under pressure to improve their accountability. Third, governments have a responsibility to protect vulnerable older people from potential abuse. Besides being high-quality, LTC systems that perform well are also accessible to older populations and provide good value for money. There is limited understanding of what works well in LTC, in what contexts and at what costs. This in turn makes it difficult to design and implement effective policy reforms.
Indicators of LTC quality are useful for government regulatory oversight, help providers identify problems and point to adverse events in the provision of care, and can help users make informed choices. Yet, few countries systematically measure whether LTC is safe, effective (or what constitutes effective LTC), and centred around the needs of care recipients. Most available indicators focus on inputs and processes, rather than outcomes and quality. Three groups of dimensions are generally accepted as critical to achieving high quality in care effectiveness and safety; patient-centredness and responsiveness; and care coordination (OECD, 2017).
The COVID-19 pandemic has laid bare deficiencies in LTC safety. Across OECD countries, around four in every 10 deaths due to COVID-19 were among LTC residents (Rocard, Sillitti & Llena-Nozal, Reference Rocard, Sillitti and Llena-Nozal2021). A lack of resources is likely behind these dire statistics. LTC settings are often inappropriately staffed, they lack supplies and struggle to access clinical treatments, all of which can lead to poor safety. Both an absence of quality standards, and limited monitoring and enforcement of quality standards, make matters worse. A lack of data makes it difficult to quantify safety failures, and truly understand the magnitude of the challenge.
In general, countries with higher spending on LTC tend to report better access to, higher quality of and more satisfaction with public LTC services. Across 21 countries, close to a third of respondents to the 2018 OECD Risks That Matter survey identified accessing LTC as one of the three greatest risks to themselves or their immediate family, and 40% of respondents report that ensuring the LTC of family members is among the three greatest risks to themselves and their families. While simple correlations are necessarily imperfect, they indicate that satisfaction with access to high-quality and affordable LTC services is associated with the generosity of public systems. Countries that spend more on public LTC, like Denmark, Norway and the Netherlands, have smaller numbers reporting unhappiness with access to public LTC services for older people, and those countries that spend less have higher shares of respondents expressing dissatisfaction. This would suggest that LTC in some countries is not patient-centred nor responsive to population needs and wants.
The pandemic has also laid bare failings in care coordination across the health and LTC sectors (Rocard, Sillitti & Llena-Nozal, Reference Rocard, Sillitti and Llena-Nozal2021). Poor coordination of care (as discussed in Chapter 3.5) further reduces effectiveness and safety of care. Coordination with primary health care is especially important, as older people tend to have multiple chronic conditions and are at higher risk of hospitalization if not properly monitored. Collaboration across teams of professionals in the health and LTC sectors is key to ensure high quality of care and reduce unsafe and wasteful practices. In Japan, for example, community-based integrated care centres have been opened in every district, with care managers coordinating different services for older people.
Besides the quality of care, it remains unclear whether older people are able to access the LTC services that they need. As mentioned in previous sections, not all older people who are estimated to have LTC needs report using formal care. Moreover, when self-reported receipt of formal and/or informal care is considered, there remain large shares of older people with estimated needs that do not report receiving any help. Across 22 EU Member States, almost half of older people reporting severe difficulties in personal care or household activities stated they had unmet needs for help with those activities (Directorate-General for Economic and Financial Affairs, 2021). Older women and those on lower incomes were more likely to report unmet needs than older men and those on higher incomes (Directorate-General for Economic and Financial Affairs, 2021). Self-reported data are naturally influenced by cultural differences across countries and by factors other than LTC costs and quality, yet these high rates of unmet need suggest there are important perceived challenges in access to care. Among barriers to access are financial limitations (compounded by insufficient social protection), geographical disparities and shortages of care workers, complex administrative procedures that are difficult to navigate, and limited support for informal carers who often have to choose between employment and caring for relatives.
With respect to financing, it remains very difficult to establish whether current total and government spending on LTC constitutes good value for money. Indications are that the sector would benefit from both more funding but also better understanding of how to allocate current and future investments. Fiscal space is already limited today, and will only become more constrained as populations age and old-age dependency ratios increase. Thus, public and private funding for LTC must not be wasted, and should promote high-quality care that is accessible to all who need it, especially those who are most economically vulnerable and least likely to be able to afford it (see Chapter 3.6). As with quality, indications are that not all countries have social protection that sufficiently cover the costs of LTC for older people with more severe needs and fewer means.
As with safety and effectiveness of provision, there is limited analysis of performance indicators in LTC financing. Comparability of data on LTC spending is limited, with elements being excluded or underreported even at the level of total public spending (OECD, Reference Kim and Dougherty2020b). Performance indicators, such as share of households with catastrophic spending, national-subnational financing splits and percentage of expenditure on administrative processes are not available.
Governments, societies and economies face major challenges in planning, financing and providing high-quality care that is accessible and constitutes good value for money. While governments have some visibility of LTC needs via needs assessments and information on recipients, it is unlikely that all older people who have LTC needs apply for public benefits and schemes. It is sensible to assume that there are gaps in the measurement of LTC needs at population level, and that these gaps make it difficult to determine whether current provision is appropriate and how well systems will meet future demand for care. Moreover, without good data on needs and provision, it is also virtually impossible to determine the true societal and economic costs and consequences of informal care provision. With limited understanding and data on quality, specifically on effectiveness and safety, patient-centredness and responsiveness and care coordination, it is very challenging for policy-makers to make evidence-based decisions in this sector.
Going forward, it is thus crucial that governments invest more funds and efforts in data collection, international comparisons and analysis so that best practices can be identified and good solutions can be disseminated and shared widely. The clock is ticking, and unexpected and hugely consequential events like COVID-19 will only increase the urgency for action. The sector is far too complex for short-term thinking, and tackling these significant challenges requires long-term vision and policy action.Footnote 1
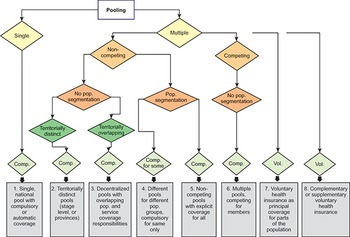
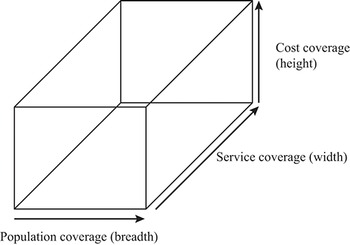

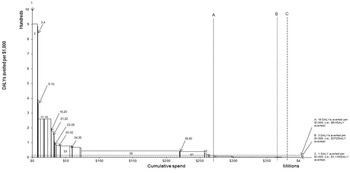
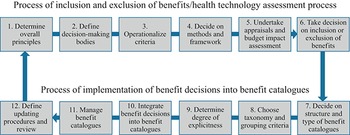
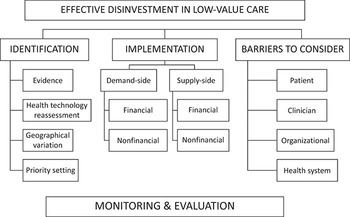
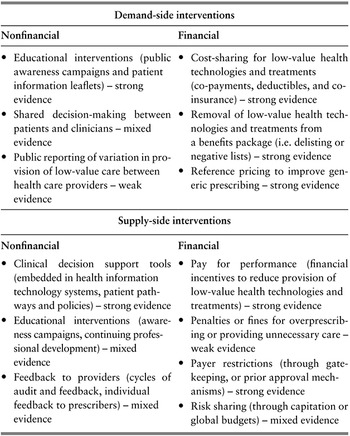
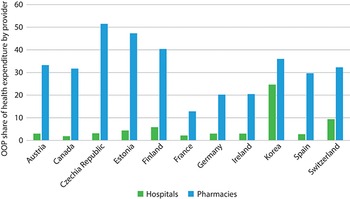
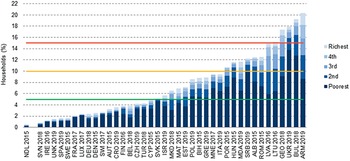
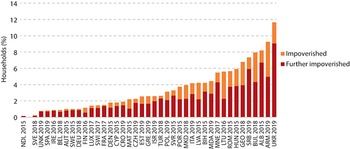
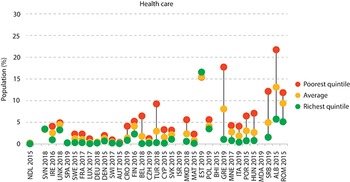
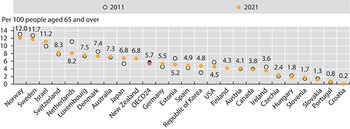
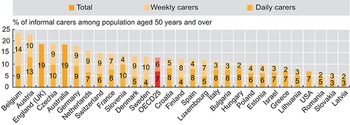
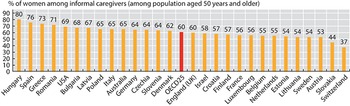
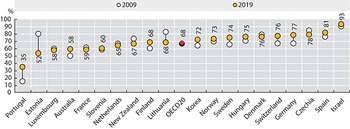

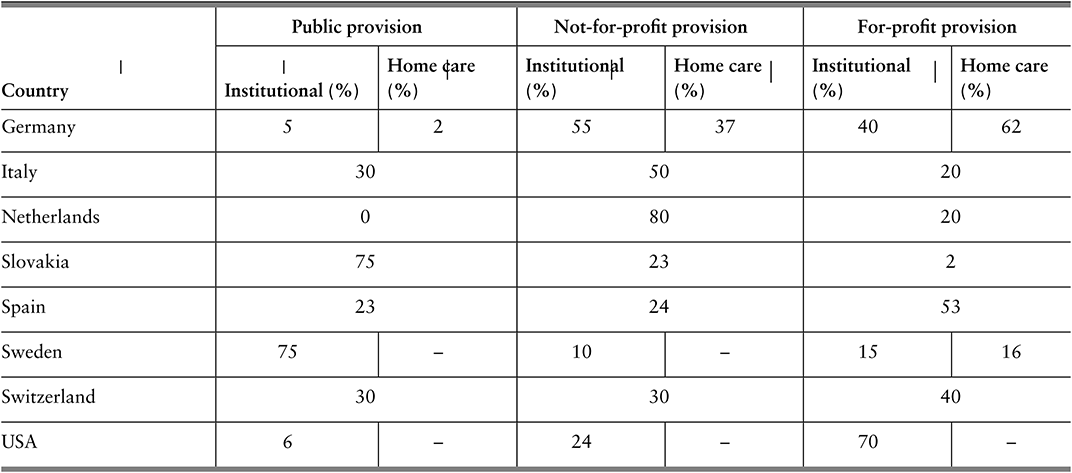
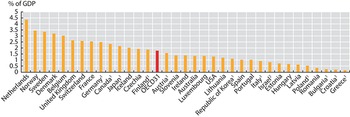
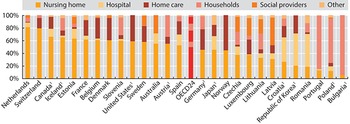
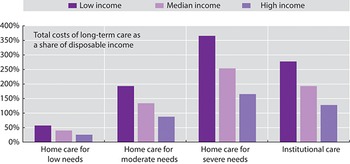
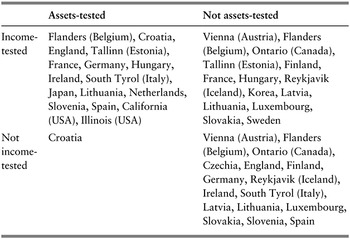
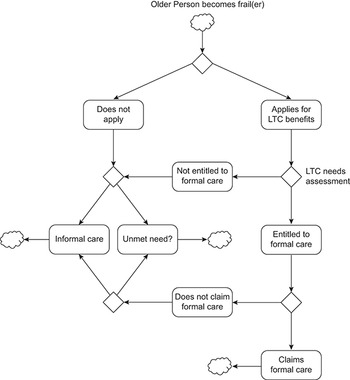
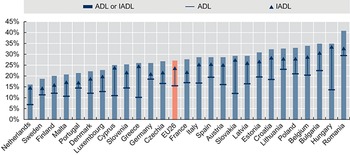
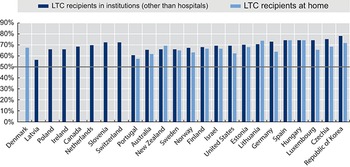
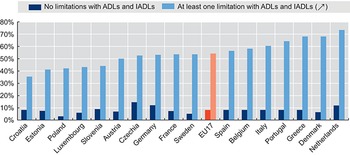

 Open access