


1. Introduction
Debris-covered glaciers are found in most glacierised regions (Reid and others, Reference Reid, Carenzo, Pellicciotti and Brock2012; Kirkbride and Deline, Reference Kirkbride and Deline2013; Anderson and Anderson, Reference Anderson and Anderson2018; Scherler and others, Reference Scherler, Wulf and Gorelick2018). In particular, mountainous regions that experience high rates of rock uplift (e.g. the Himalaya, Southern Alps of New Zealand) and erosion (e.g. European Alps) host glaciers with extensive supraglacial debris cover (e.g. Deline, Reference Deline2009; Scherler and others, Reference Scherler, Bookhagen and Strecker2011; Gibson and others, Reference Gibson2017; Anderson and Anderson, Reference Anderson and Anderson2018). The prevalence of such glaciers is attributed to the frequent deposition of debris on the glacier surface from erosion of glacier headwalls (Deline, Reference Deline2009; Gibson and others, Reference Gibson2017), combined with melt-out of englacial debris in their ablation areas (Kirkbride and Warren, Reference Kirkbride and Warren1999; Salerno and others, Reference Salerno, Buraschi, Bruccoleri, Tartari and Smiraglia2008; Shukla and others, Reference Shukla, Gupta and Arora2009; Kirkbride and Deline, Reference Kirkbride and Deline2013; Anderson and Anderson, Reference Anderson and Anderson2018).
Supraglacial debris thickness has a direct impact on mass balance (Østrem, Reference Østrem1959; Nicholson and Benn, Reference Nicholson and Benn2006). Debris layers range from a non-continuous layer, millimetres in thickness, to a blanket-like continuous cover that can reach several metres in thickness. As debris thickness increases from zero on a clean-ice surface, the sub-debris melt rate will increase until the critical thickness is reached, representing the maximum ablation rate. The maximum ablation rate is typically higher than for a climatologically equivalent clean-ice surface (Østrem, Reference Østrem1959; Mattson and others, (Reference Mattson, Gardner and Young1993); Evatt and others, Reference Evatt2015). As a debris layer thickens, its ability to efficiently transfer thermal energy to the ice surface beneath decreases, and sub-debris melt decreases as debris insulates the ice surface (Østrem, Reference Østrem1959; Mattson and others, Reference Mattson, Gardner and Young1993). As the areal extent of debris-covered ice increases globally (e.g. Kirkbride and Deline, Reference Kirkbride and Deline2013; Scherler and others, Reference Scherler, Wulf and Gorelick2018; Tielidze and others, Reference Tielidze2020), it is imperative to improve our understanding of, and ability to model the effects of surface debris on key processes affecting debris-covered glaciers, most notably ablation.
Generally, debris thickness increases towards a glacier terminus and over time (e.g. Anderson, Reference Anderson2000; Gibson and others, Reference Gibson2017), transitioning from convex to concave in profile due to a decline in surface velocity and the conveyor belt-like nature of debris-covered glaciers (Anderson and Anderson, Reference Anderson and Anderson2018). In addition to this spatial variability, debris thickness increases over time, though little is known about the relative contributions or rates of the physical processes which cause this increase (Gibson and others, Reference Gibson2017). Debris is contributed to the glacier surface from the surrounding hillslopes where it is either deposited in the accumulation area, where it will be entrained into the englacial environment and transported along englacial flow paths, or deposited in the ablation area by rockfalls or rock avalanches. In addition to this, debris is contributed to the supraglacial environment by subglacial bedrock erosion (Boulton, Reference Boulton1978; Iverson, Reference Iverson and Menzies1995; Kirkbride, Reference Kirkbride and Menzies1995), where it is transported along englacial flow paths and either remains within the englacial environment or emerges supraglacially via englacial melt-out of dispersed debris bands, or discrete septa (Kirkbride and Deline, Reference Kirkbride and Deline2013; Westoby and others, Reference Westoby, Rounce, Shaw, Fyffe, Moore, Stewart and Brock2020).
Knowledge of the thickness of supraglacial debris remains unknown for most glaciers on Earth (Scherler and others, Reference Scherler, Wulf and Gorelick2018; Herreid and Pellicciotti, Reference Herreid and Pellicciotti2020) and changes in thickness even more so. Field measurements of debris thickness are scarce and challenging to collect: manual excavations (e.g. Mihalcea and others, Reference Mihalcea2008a, Reference Mihalcea2008b; Reid and others, Reference Reid, Carenzo, Pellicciotti and Brock2012; Rounce and McKinney, Reference Rounce and McKinney2014), extrapolations from ice-cliff surveying (Nicholson and Benn, Reference Nicholson and Benn2013; Nicholson and Mertes, Reference Nicholson and Mertes2017) and ground-penetrating radar measurements (McCarthy and others, Reference McCarthy, Pritchard, Willis and King2017; Nicholson and Mertes, Reference Nicholson and Mertes2017) are the most commonly used methods for measuring or estimating debris thicknesses. However, time and labour constraints limit the spatial distribution of measurements and these methods rely on the assumption that the area sampled is representative of the entire debris-covered area (Rounce and McKinney, Reference Rounce and McKinney2014). The thickness of a surface debris layer influences its surface temperature, such that thicker debris layers generally have higher surface temperatures than thin debris layers under the same meteorological forcing, because of longer distances for conduction that slowdown transport of the heat absorbed at the surface into the underlying ice (Nicholson and Benn, Reference Nicholson and Benn2013).
To obtain spatially resolved estimates of debris thicknesses, recent work has built on the relationship between surface temperature and debris thickness and proposed to derive debris thickness from satellite thermal images using either (i) empirical relationships, which build on the correlation between debris thickness and surface temperature (Mihalcea and others, Reference Mihalcea2008a, Reference Mihalcea2008b) but are not spatially or temporally transferable; or (ii) surface energy-balance modelling (Zhang and others, Reference Zhang, Fujita, Liu, Liu and Nuimura2011; Foster and others, Reference Foster, Brock, Cutler and Diotri2012; Rounce and McKinney, Reference Rounce and McKinney2014; Schauwecker and others, Reference Schauwecker2015; Rounce and others, Reference Rounce, King, McCarthy, Shean and Salerno2018) which solves for all energy fluxes at the time of image acquisition to derive debris thickness as the only unknown in the coupled system of the energy balance at the surface and the heat conduction within the debris. Such methods provide debris thickness values corresponding to a given time in a physically-based manner, i.e. assuming that the input meteorological forcing and debris surface properties are well-constrained, they will provide an accurate estimate of debris thickness and by their own nature can be applied to estimate debris thickness at any point in time if the necessary input data are available.
The first attempt to reconstruct debris thickness from satellite images was by Mihalcea and others (Reference Mihalcea2008a), who derived an elevation-dependent empirical relationship between debris surface temperature and debris thickness for Miage Glacier, Italy. This relationship predicted debris thicknesses to within ±0.05 m for thicknesses up to 0.4 m. The primary limitation of this empirical method is the considerable amount of field data that are required to derive the debris thickness–surface temperature relationship, and crucially, the fact that these empirical relationships are valid only for the time and place for which they have been derived, resulting in a lack of transferability both in time and space (Foster and others, Reference Foster, Brock, Cutler and Diotri2012). As a result, this approach cannot be applied for the detection of changes in debris thickness over time.
To increase the transferability of debris-thickness estimation methods, more recent studies have used an energy-balance inversion approach to solve for debris thickness using knowledge of the meteorological forcing of the energy balance, and the corresponding surface temperature, where the latter is determined from satellite thermal imagery (Zhang and others, Reference Zhang, Fujita, Liu, Liu and Nuimura2011; Foster and others, Reference Foster, Brock, Cutler and Diotri2012; Rounce and McKinney, Reference Rounce and McKinney2014; Schauwecker and others, Reference Schauwecker2015). In this way, debris thickness is solved for as the only unknown in the coupled system of the energy balance at the surface and the heat conduction within the debris. A progression of models has been suggested, each advancing over the previous one in some aspects. Foster and others (Reference Foster, Brock, Cutler and Diotri2012) derived distributed debris thickness from Advanced Spaceborne Thermal Emission and Reflection (ASTER) thermal imagery (90 m spatial resolution) for Miage Glacier using a relatively simple energy-balance model at a specific time step, i.e. assuming no heat storage in the debris. Foster and others (Reference Foster, Brock, Cutler and Diotri2012) used Automatic Weather Station (AWS) and NCEP/NCAR reanalysis of meteorological data to force their model and demonstrate temporal transferability. The main limitation of their approach is the assumption of a linear debris temperature–thickness profile within the debris layer at the time of thermal imagery acquisition, which can lead to underestimations of debris thickness (Rounce and McKinney, Reference Rounce and McKinney2014; Schauwecker and others, Reference Schauwecker2015) and additionally they exclude the effects of topography on estimating debris thickness. Schauwecker and others (Reference Schauwecker2015) incorporated a non-linear debris temperature–thickness profile in the Foster and others (Reference Foster, Brock, Cutler and Diotri2012) model, similar to Rounce and McKinney (Reference Rounce and McKinney2014). This development reduces the model uncertainty, but fails to account for differences in incoming shortwave radiation due to both slope and aspect. Rounce and McKinney (Reference Rounce and McKinney2014) introduced a factor, G ratio, to their surface energy-balance model to account for the non-linear temperature gradient within the debris layer, and used this approach to estimate distributed debris thickness for glaciers in the Khumbu Region, Nepal. Rounce and McKinney (Reference Rounce and McKinney2014) incorporated the effect of topography in the calculation of the meteorological forcing to the model by using a digital elevation model (DEM), and slope and aspect to account for the incidence of solar radiation. The Rounce and McKinney (Reference Rounce and McKinney2014) model was forced with meteorological data from an off-glacier AWS, while values for debris albedo, surface roughness and thermal conductivity were estimated from the literature (Takeuchi and others, Reference Takeuchi, Kayastha and Nakawo2000; Rounce and McKinney, Reference Rounce and McKinney2014).
The aims of this proof of concept study are to: (i) determine whether reanalysis data can be used to estimate spatially distributed supraglacial debris thickness in a remote-sensing-driven energy-balance modelling framework, and (ii) determine whether these estimates of debris thickness can enable a multi-temporal analysis of debris thickness change. Given its advances over previous approaches, for this work, we use the Rounce and McKinney (Reference Rounce and McKinney2014) debris thickness estimation model, and use reanalysis data to force the model and reconstruct historical debris thickness and debris thickness change for three mountain glaciers. In pursuit of (i), we compare the relative performance of distinct reanalysis products to identify which are best suited for this type of approach, and test: surface-level and pressure-level reanalysis data using both NCEP/NCAR Reanalysis I (Kalnay and others, Reference Kalnay1996) and ERA-5 (Copernicus Climate Change Service (C3S), 2017) meteorological datasets. In support of aim (ii), we apply the model to 44 time series images to obtain spatially distributed estimates of debris thickness for Miage Glacier, Italy; Khumbu Glacier, Nepal; and Haut Glacier d'Arolla, Switzerland, on an approximately annual basis between 2001 and 2019 and use debris thickness differencing in combination with Monte Carlo-derived uncertainty bounds to quantify debris thickness change. We subsequently discuss these debris thickness changes in the context of the physical processes that are most likely responsible for them, including the supraglacial redistribution of debris.
2. Study areas
Our three study glaciers were chosen due to the availability of field-based debris thickness measurements for model evaluation and on- or near-glacier AWS that measure all meteorological variables required by the model. We use AWS data from Miage Glacier, Italy, and Khumbu Glacier, Nepal, to create a benchmark debris thickness map from which we evaluate the performance of the model application when forced with the regional reanalysis data. We then use regional reanalysis data to estimate debris thickness over a ~20-year period for Miage Glacier, Khumbu Glacier and Haut Glacier d'Arolla.
2.1 Miage Glacier, Italy
Miage Glacier, Italy (45°47′N, 6°51′E; Fig. 1a), is a 10 km-long debris-covered glacier in the European Alps. It is located on the flanks of Mont Blanc (4810 m above sea level (a.s.l)) and spans an altitudinal range of 3900–1730 m a.s.l (Pfeffer and others, Reference Pfeffer2014). Approximately 42% of its surface area is covered by supraglacial debris (Fyffe and others, Reference Fyffe2014). At least 75% of the surface debris on Miage Glacier originates from small rock avalanches and rockfall debris originating in the ablation zone and transported supraglacially, with the remainder originating from melt-out of englacially transported debris in the form of medial moraines (Deline and others, Reference Deline, Gardent, Magnin and Ravanel2012). Mean glacier surface velocities are ~10 m a−1 but vary from 2 m a−1 close to the terminus, to 40 m a−1 ~5 km up-glacier. Debris thickness ranges from less than a few centimetres at the up-glacier limit of the debris-covered area at 2400 m a.s.l, to >1 m close to the terminus (Mihalcea and others, Reference Mihalcea2008a; Brock and others, Reference Brock2010).
Location maps of the three study glaciers: (a) Miage Glacier, Italy, the purple star represents the location of the Automatic Weather Station (AWS) used in the control model runs; (b) Khumbu Glacier, Nepal, where the purple star represents the location of the Pyramid weather station, Nepal. (c) Haut Glacier d'Arolla, Switzerland, with two glacier outlines – the larger outline is taken from RGIv6.0 (RGI Consortium, 2017) and the shorter extent of the terminus region is a manually updated version of this. Black boxes signify the flux boxes used in this study, and green dots show the location of in situ measurements. The background images are taken from PlanetLabs RapidEye satellite imagery (Planet Team, 2017).

2.2 Khumbu Glacier, Nepal
Khumbu Glacier, Nepal (27°56′N, 86°56′E; Fig. 1b), is a 17 km-long debris-covered glacier in the Everest region (Pfeffer and others, Reference Pfeffer2014; Watson and others, Reference Watson, Quincey, Carrivick and Smith2017). The glacier spans an altitudinal range of 8230–4850 m a.s.l. and drains the western flanks of Mount Everest (Gibson and others, Reference Gibson2018). The lower 6.5 km are thought to be slow-flowing or stagnant ice (Quincey and others, Reference Quincey, Luckman and Benn2009; Thompson and others, Reference Thompson, Benn, Mertes and Luckman2016; Rounce and others, Reference Rounce, King, McCarthy, Shean and Salerno2018) and the glacier surface hosts a number of supraglacial ponds within the debris (Watson and others, Reference Watson, Quincey, Carrivick and Smith2016). Debris thicknesses range from ~0.02 m in the upper ablation area, to >1 m over the stagnant tongue (Rowan and others, Reference Rowan2020).
2.3 Haut Glacier d'Arolla, Switzerland
Haut Glacier d'Arolla, Switzerland (45°58′N, 7°31′E; Fig. 1c), is a 4 km-long, north-westerly flowing glacier located at the head of Val d'Hérens, Valais (Kulessa and others, Reference Kulessa, Hubbard, Williamson and Brown2005), and has a total glacierised area of 3.5 km2. It spans an altitudinal range of 3500–2560 m a.s.l. (Pellicciotti and others, Reference Pellicciotti2005). The supraglacial debris cover has developed over the last 60 years and is the result of the emergence of three medial moraines covering ~10% of the glacier area (Reid and others, Reference Reid, Carenzo, Pellicciotti and Brock2012). Reid and others (Reference Reid, Carenzo, Pellicciotti and Brock2012) attribute the increase in debris cover extent to the recession of the glacier terminus and the subsequent emergence of englacial debris bands. Debris thickness ranges from <0.01 to ~0.50 m (Reid and others, Reference Reid, Carenzo, Pellicciotti and Brock2012).
3. Data acquisition
We use freely available remotely sensed data of debris surface temperature, DEMs, reanalysis data and in situ measurements of meteorological variables and debris thickness. These data are summarised in Tables 1–4 and our handling of these is described in Section 4.
Summary of meteorological data and debris thickness data used in this study

3.1 Field data
Data from an AWS located at 2066 m a.s.l, in the ablation area of Miage Glacier (45°46′N, 6°52′E, 2066 m a.s.l; Fig. 1a), were acquired for the period 2016–2018, including two full ablation seasons (2016 and 2018). These data include incoming shortwave radiation (S in), incoming longwave radiation (L in), air temperature at 2 m above-ground height (T air), relative and specific humidity (RH and SH, respectively) and wind speed (u) (Table 1). Data were recorded at an hourly time step for the summer ablation season (June–September; Fyffe and others, Reference Fyffe2014). Further information regarding specific instrumentation can be found in Brock and others (Reference Brock2010). The Pyramid Observatory (27°57′N, 86°48′E, 5035 m a.s.l; Fig. 1b) is located 1 km from the true right lateral moraine of Khumbu Glacier and meteorological data were acquired for the period 2002–2009 for the same variables listed above (Bonasoni and others, Reference Bonasoni2010) (Table 1). To assess the accuracy of our AWS- and reanalysis-derived debris thickness maps, we compared these data with 21 debris thickness measurements for Miage Glacier obtained in June–July 2005 (Mihalcea and others, Reference Mihalcea2008a), 143 measurements from Khumbu Glacier obtained in May 2014 (Gibson and others, Reference Gibson2018; Rowan and others, Reference Rowan2020) and 346 measurements from Haut Glacier d'Arolla in the summer of 2010 (Reid and others, Reference Reid, Carenzo, Pellicciotti and Brock2012) (Fig. 1).
3.2 Remotely sensed data
We retrieved Landsat 7 Enhanced Thematic Mapper (ETM+) thermal imagery for all glaciers (Table S1). Due to a fault with its scan line corrector, Landsat 7 images suffer from a ‘striping effect’ causing a loss of ~22% of data from each image (Scaramuzza and Barsi, Reference Scaramuzza and Barsi2005). Images where <50% of the study glacier was visible due to the striping effect were discarded from the analysis along with images that were visually determined to have extensive cloud and/or snow cover. Fourteen images were selected for Miage Glacier, 16 images for Khumbu Glacier and 16 images for Haut Glacier d'Arolla (Table S1). Landsat 7 band 6 (thermal band) images were used to derive surface temperature, by converting spectral radiance to surface temperature (Rounce and McKinney, Reference Rounce and McKinney2014; NASA, 2020), resulting in a final surface temperature product with an uncertainty of ±1.0 K (Barsi and others, Reference Barsi2003; Coll and others, Reference Coll, Galve, Sánchez and Caselles2010; Rounce and McKinney, Reference Rounce and McKinney2014). The Landsat 7 band 6 product has a 60 × 60 m grid spacing and was automatically resampled to 30 × 30 m.
The ASTER Global Digital Elevation Model (G-DEM 2), with a 30 × 30 m grid spacing, was used as the DEM input for the model simulations. ASTER G-DEM has been found to have an uncertainty of up to 10 m and a horizontal geolocation accuracy better than 50 m (Fujisada and others, Reference Fujisada, Bailey, Kelly, Hara and Abrams2005; Nuth and Kaab, Reference Nuth and Kääb2011; Rounce and McKinney, Reference Rounce and McKinney2014). Therefore, the final debris thickness maps have a spatial resolution of 30 m.
3.3 Reanalysis data
3.3.1 NCEP/NCAR reanalysis data
The NCEP/NCAR Reanalysis I data are available in a netCDF4 format at 45 pressure/sigma levels, with global coverage at 2.5° × 2.5° (~280 km × 280 km) horizontal resolution at the equator (Kalnay and others, Reference Kalnay1996). Sigma levels are defined as the ratio of the pressure at a point in the atmosphere to the pressure of the surface at that point. Data are produced in 6 h time steps and variables are retrieved from the time step closest to the satellite thermal imagery acquisition (Table S1). Data acquired from the 0.995 sigma level, which is analogous to ‘surface level’, are hereafter referred to as ‘surface-level’ reanalysis data, and data acquired from the pressure level analogous to the mean elevation of the study glacier are referred to as ‘pressure-level’ reanalysis data (Table 2).
Reanalysis datasets used in this study and the corresponding surface and pressure levels for each glacier

3.3.2 ERA-5 reanalysis data
ERA-5 reanalysis data span 137 pressure levels and have a horizontal resolution of ~0.5° × 0.5° (~55 km × 55 km) at the equator (Reference Hersbach2018a). Reanalysis-based estimations of meteorological data were acquired within 1 h of a Landsat 7 overpass for ERA-5. ERA-5 hourly data at the single-level (or ‘surface-level’) are hereafter referred to as ‘surface-level’ reanalysis data (Hersbach and others, Reference Hersbach2018a), and ERA-5 hourly data on pressure levels are referred to as ‘pressure-level’ reanalysis data (Hersbach and others, Reference Hersbach2018b; Table 2).
4. Methods
The basic idea behind the approach we use, as well as the studies by Foster and others (Reference Foster, Brock, Cutler and Diotri2012), Schauwecker and others (Reference Schauwecker2015) and Rounce and McKinney (Reference Rounce and McKinney2014), is that an energy-balance model, which solves both the equation of the energy balance at the debris surface and the heat conduction into the debris, can be used to solve for debris thickness if surface temperature is known. This requires the knowledge of the meteorological data used as input to the energy balance (e.g. T air, RH, SH, u, S in and L in) and of the debris surface properties (e.g. heat conduction, surface roughness, thermal conductivity and albedo).
Here we first describe the model, highlighting its improvements over previous models, and then present the data that are needed for its application. Finally, we summarise the overall workflow needed for the model application with satellite data and reanalysis data.
4.1 Energy-balance model
The energy-balance model version we use was developed by Rounce and McKinney (Reference Rounce and McKinney2014). The key advantage of the model over previous approaches is that it incorporates an empirical factor to account for the non-linearity of the debris temperature profile. A brief summary of the model is outlined below. The energy balance at the debris surface is:

where M is the energy available for melt, R n is the net radiation flux of incoming and outgoing shortwave and longwave radiation, LE is the turbulent latent heat flux, H is the turbulent sensible heat flux and Qc is the conductive heat flux below the surface. Positive fluxes are directed towards the debris surface.
Assuming an M of zero and an LE of zero within the energy balance (for a discussion of these assumptions, see Rounce and McKinney, Reference Rounce and McKinney2014), we can also calculate the net radiation flux (Eqn (2)) and the sensible heat flux (Eqn (3)).

where α is the albedo (0.30), ɛ is the emissivity (0.95; Nicholson and Benn, Reference Nicholson and Benn2006), σ is the Stefan–Boltzmann constant (5.67 × 10⁻⁸ W m−2 K−4) and T s is the surface temperature (K).

where ρ air is the density of air at sea level and ~10 °C (1.29 kg m−3), P is the atmospheric pressure, P 0 is the atmospheric pressure at sea level, c is the specific heat capacity of air, A is the dimensionless transfer coefficient.
Using Eqns (2) and (3), we can simplify Eqn (1) to calculate the conductive heat flux:

Subsequently, the thermal resistance of debris can be calculated using Eqn (5):

where G ratio is a non-linear approximation factor that accounts for the fact that the temperature gradient within the debris is non-linear.
Finally, assuming an effective thermal conductivity (k eff) of 0.96 W m−1 K−1, we solve for debris thickness:

Due to a lack of data on the variability of the debris thermal regime, we used a value of 2.7 for G ratio, taken from Rounce and McKinney (Reference Rounce and McKinney2014), who derived G ratio from field experiments at Imja-Lhotse Shar Glacier. This is one of the limitations of our work, as its value is likely to be different for other glaciers. However, the model was least sensitive to G ratio in an analysis conducted by Rounce and McKinney (Reference Rounce and McKinney2014), and moderately sensitive to this parameter in the Monte Carlo sensitivity analysis presented in Section 4.2. We therefore retained the Imja-Lhotse Shar Glacier-derived value 2.7 in this study.
The meteorological input needed by the model for each pixel of the glacier domain was distributed from the input values as follows: We corrected distributed incoming shortwave radiation for the effects of topography using the G-DEM data, similar to the methods of Hock and Noetzli (Reference Hock and Noetzli1997). Air temperature was modified based on G-DEM elevation using a lapse rate of 6.5 K km−1 (Fig. 2). Values for the remaining meteorological variables (incoming longwave, relative humidity and wind speed) and the non-meteorological parameters (albedo, surface roughness, thermal conductivity and G ratio) were assumed constant across the glacier (Table 3).
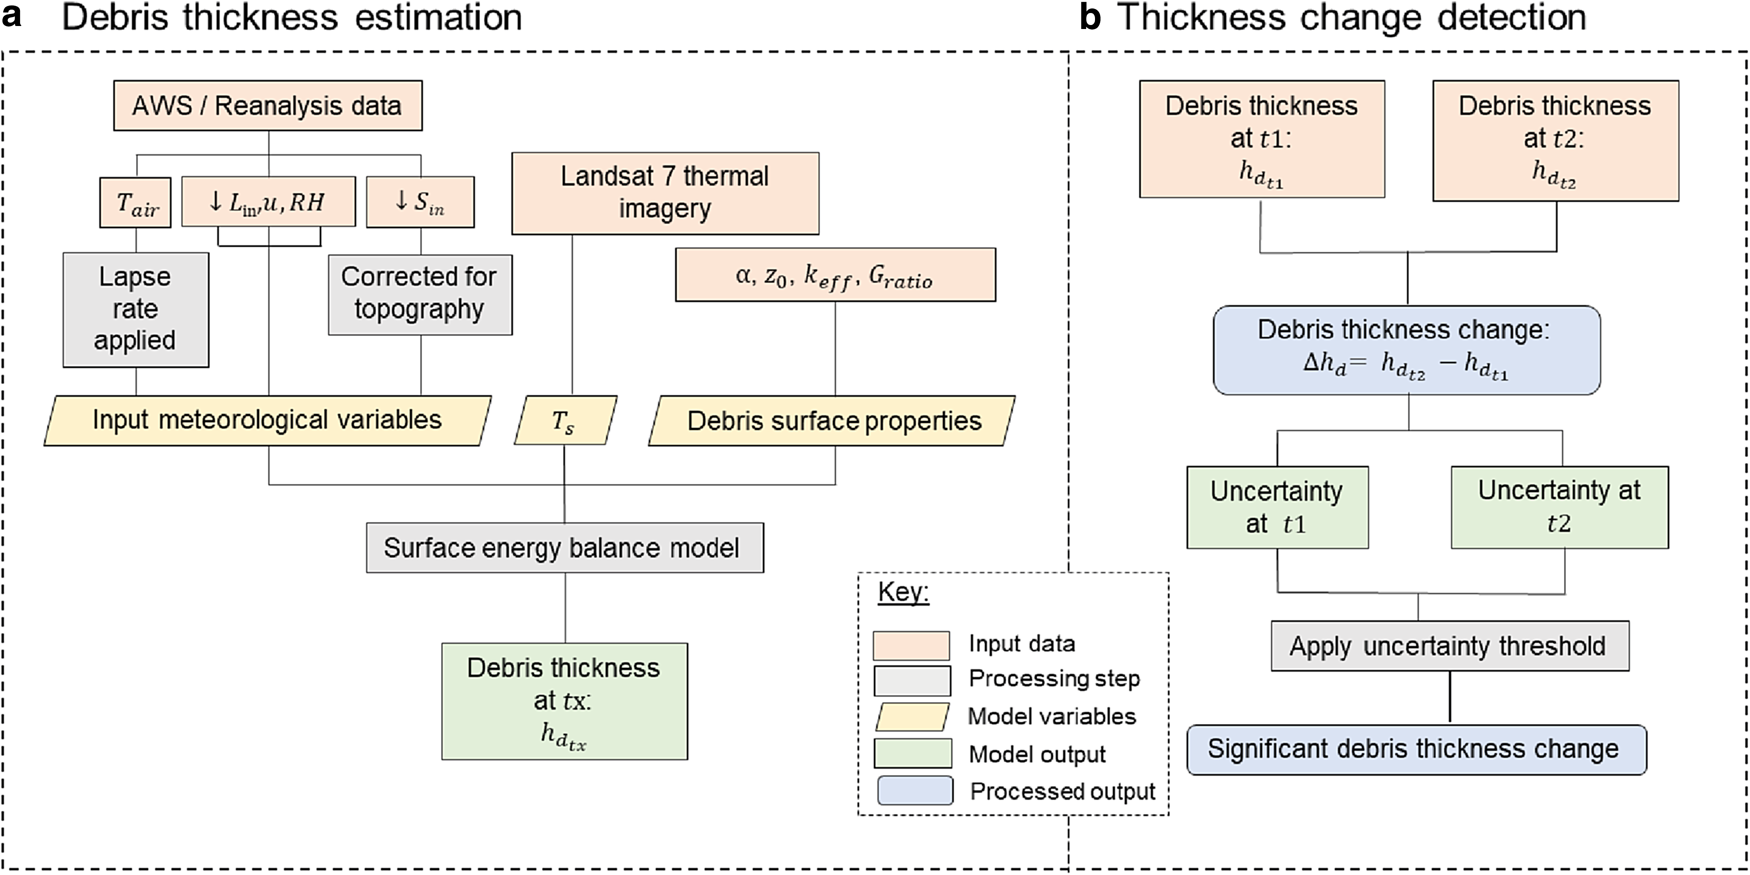
Workflow for deriving: (a) distributed debris thickness maps using a surface energy-balance model, (b) distributed significant debris thickness change maps.
Ranges and values of input parameters and variables for the main debris thickness estimation models using satellite thermal imagery

All distributed thickness maps presented in this study have been produced in line with the approach presented above. This approach is similar to the methodology detailed in Schauwecker and others (Reference Schauwecker2015). However, we advance this methodology in several ways: First, we account for the effects of topography when calculating distributed incoming shortwave radiation, which is important to improve the estimate of this radiation flux in high relief topography, whereas Schauwecker and others (Reference Schauwecker2015) did not make any topographic adjustments. Secondly, Schauwecker and others (Reference Schauwecker2015) apply the model proposed by Foster and others (Reference Foster, Brock, Cutler and Diotri2012) and incorporate a dependent stored heat factor to address the non-linear temperature gradient. Importantly, we present a comparison of multiple reanalysis datasets to determine the most suitable input data (Section 5.2). We also use the values of incoming shortwave and longwave radiation, and air temperature from the reanalysis datasets to retain simplicity in the workflow (Table 3). In this regard, our method contrasts with previous approaches for constraining these specific meteorological variables (Schauwecker and others, Reference Schauwecker2015) as air temperature has been shown to be variable over a single debris-covered glacier (Steiner and Pellicciotti, Reference Steiner and Pellicciotti2016).
4.2 Model input parameters and workflow
The workflow for running the energy-balance model at each time step (t x) is summarised in Figure 2, and comprises: (1) image acquisition (Landsat 7, ASTER G-DEM), (2) GIS pre-processing of slope, aspect and hillshade products, and (3) the execution of the model. We followed the method of Rounce and others (Reference Rounce, King, McCarthy, Shean and Salerno2018) and defined a series of ~500 m-long contiguous boxes using the glacier centreline which we refer to as flux boxes (Fig. 1). The 500–600 m-long flux boxes used by Rounce and others (Reference Rounce, King, McCarthy, Shean and Salerno2018) for Khumbu Glacier were downloaded from a public data repository (https://doi.org/10.5281/zenodo.1206201). We only considered pixels where the model estimated h d > 0.00 m in this analysis.
Meteorological variables were acquired from both NCEP/NCAR reanalysis I and ERA-5 reanalysis products at t x, except for wind speed. Due to the documented inaccuracy of reanalysis data for estimating local-scale surface wind speeds (Schauwecker and others, Reference Schauwecker2015; Betts and others, Reference Betts, Chan and Desjardins2019; Gossart and others, Reference Gossart2019; Fig. 3), and the increased sensitivity of the model to this variable, we followed the methods of Schauwecker and others (Reference Schauwecker2015) by taking the mean AWS wind speed at the time of satellite overpass for all three glaciers throughout the ablation season where available. The mean wind speed at the time of satellite overpass between 2006 and 2018 at Miage Glacier was 2.19 m s−1. The mean wind speed during the ablation season at the time of satellite overpass between 2005 and 2011 at Pyramid Observatory was 1.41 m s−1. For Haut Glacier d'Arolla, a value of 2.80 m s−1 was used, calculated using wind speed measured in 2010 (Reid and others, Reference Reid, Carenzo, Pellicciotti and Brock2012). These values were used as the wind speed forcing in the reanalysis-driven simulations. As the model is sensitive to changes in wind speed, until a reanalysis product emerges which is able to reliably predict surface level wind speed, we suggest that a fixed value should be derived using the methodology presented above, or in the absence of available AWS data, a fixed value of 2.19 m s−1 should be used for alpine settings such as Miage Glacier and Haut Glacier d'Arolla, and a value of 1.41 m s−1 should be used for Himalayan settings.
(a) Miage Glacier 2016 AWS wind speed compared with NCEP/NCAR reanalysis I surface-level data (R 2 = 0.018), and ERA-5 surface-level data (R 2 = 0.046). (b) Khumbu Glacier AWS wind speed compared with NCEP/NCAR reanalysis I surface-level data (R 2 = 0.0008), and ERA-5 (R 2 = 0.1303) surface-level data. Grey line signifies the 1:1 line.

4.3 Model sensitivity and uncertainty
We conducted an initial model sensitivity analysis using a Monte Carlo framework to identify key parameters affecting debris thickness estimation (Table 4). Each parameter was varied randomly over 1000 model runs, within a sensible range (Rounce and McKinney, Reference Rounce and McKinney2014; Rounce and others, Reference Rounce, King, McCarthy, Shean and Salerno2018; Table 4), while all other parameters remained constant. The model showed high sensitivity to surface roughness, incoming longwave radiation and wind speed. In contrast, it showed a minimal sensitivity to albedo, incoming shortwave radiation and finally surface temperature. As the model is relatively insensitive to changes in albedo, following the method of Rounce and McKinney (Reference Rounce and McKinney2014), we used an albedo value of 0.3 (Nicholson and Benn, Reference Nicholson and Benn2013). The model was moderately sensitive to variations in the non-linear temperature gradient factor – G ratio (for a ±14% change in G ratio, the debris thickness varies by +0.08 m; Table 3).
A Monte Carlo (MC) sensitivity test showing mean change from a baseline mean debris thickness of 0.13 m, where h d is debris thickness

To incorporate the uncertainties in debris properties and meteorological variables into our estimates of debris thickness, we use the same Monte Carlo framework to produce a distributed uncertainty estimate. We include in the uncertainty analysis both debris properties and meteorological variables because of the assumptions we make about them in the model: (i) debris properties are assumed constant in time and uniform in space, but are known to be highly heterogeneous (e.g. Nicholson and Benn, Reference Nicholson and Benn2013; Miles and others, Reference Miles, Steiner and Brun2017); (ii) meteorological variables are also either assumed uniform in space or extrapolated to the glacier scale with relatively simple assumptions (Fig. 2), but their variability across the glacier can be high (e.g. Steiner and Pellicciotti, Reference Steiner and Pellicciotti2016). For each debris thickness map, we calculate the debris thickness uncertainty for every pixel by conducting 1000 Monte Carlo simulations varying each variable uniformly within a range of sensible values (MC range; Table 5). We then calculate the uncertainty as the mean std dev. of the simulated debris thickness for each pixel (Section 4.4). These uncertainties provide a level of confidence in our debris thickness maps and were used to threshold the debris thickness change data and identify significant changes (Section 4.4).
Values of debris properties and meteorological variables used in the model and for the Monte Carlo analysis

In the column ‘MC range’, we show the range of values used to generate a random, uniform distribution of values for the Monte Carlo simulations. Dash indicates variables, that vary for every image (provided by either satellite thermal image (T s) or AWS (meteorological variables)).
Further, in situ measurements were compared with modelled debris thickness estimates using a two-pronged approach. We compared ERA-5-derived debris thickness with in situ point measurements rather than AWS-derived estimates due to lack of AWS data availability when in situ measurements were taken at Miage Glacier (Section 5.1). In addition to this, we compared mean in situ debris thickness within static Fluxbox areas with modelled debris thickness estimates (Section 5.3).
4.4 Significant debris thickness changes
To estimate distributed debris thickness change for all glaciers, we derived a debris thickness map for each of the 44 images (Table S1), and then differenced these debris thickness maps to obtain distributed estimates of debris thickness change (Fig. 2). We subsequently threshold these data using spatially distributed uncertainty estimates to arrive at significant debris thickness change, i.e. changes that are higher than the uncertainty in the calculated changes (Fig. 2). To calculate this uncertainty, we used the uncertainty estimates of the debris thickness for each pixel and combined these values in quadrature for two successive time steps to derive a compound uncertainty for our debris thickness change estimates (σ Δh):

where σ t1 and σ t2 are the debris thickness uncertainties associated with individual debris thickness maps. Values of σ Δh ranged from 0.1 × 10⁻² to 0.19 m for Miage Glacier, 0.2 × 10⁻² to 0.17 m for Khumbu Glacier and 0.1 × 10⁻² to 0.15 m for Haut Glacier d'Arolla, and we used these pixel-specific values to exclude the estimates of debris thickness change that fall outside this uncertainty threshold from further analysis: hereafter we define ‘significant debris thickness change’ as change which exceeds σ Δh.
5. Results
In this section, we first present an evaluation of the ERA-5-derived debris thickness estimates with in situ point measurements. We cannot compare in situ observations with our benchmark (AWS-driven) debris thickness estimates as the AWS data are not available during the time period where in situ data were collected, and we thus provide an evaluation of the best-performing re-analysis-driven product. We then compare debris thickness estimates derived from (i) pressure-level and surface-level reanalysis, and (ii) NCEP/NCAR reanalysis and ERA-5 reanalysis data. Using ERA-5 reanalysis data as the meteorological forcing, we then present a ~20-year time series of debris thickness estimates at each study glacier, and finally an assessment of debris thickness changes that have occurred during the study period.
5.1 Evaluation of debris thickness estimates
To evaluate our debris thickness estimates, we compared in situ point measurements with the ERA-surface-level-derived debris thickness for the pixel that contains these measurements for the years 2005 and 2016 at Miage Glacier, 2001 and 2009 at Khumbu Glacier, and 2005 and 2016 at Haut Glacier d'Arolla. We excluded in situ debris thicknesses >0.5 m (one measurement at both Miage Glacier and Haut Glacier d'Arolla, and 80% of measurements at Khumbu Glacier, Fig. 4) because debris thickness estimation methods which use thermal imagery are generally unable to accurately reconstruct debris thicknesses higher than this value (e.g. Foster and others, Reference Foster, Brock, Cutler and Diotri2012). We find no statistically significant correlation between the estimated and measured debris thicknesses. However, such a comparison is problematic for several reasons: (i) measurements of debris thickness have an inherent sampling bias, such that measurements tend to be clustered in small areas of a glacier due to the time- and labour-intensive nature of collecting these measurements, and therefore may not be spatially representative; (ii) our model-estimated debris thicknesses have a resolution of 30 × 30 m but debris thickness is highly heterogeneous over these scales making a comparison with a single point measurement rather tenuous (e.g. Mihalcea and others, Reference Mihalcea2008b; Zhang and others, Reference Zhang, Fujita, Liu, Liu and Nuimura2011; McCarthy and others, Reference McCarthy, Pritchard, Willis and King2017; Nicholson and Mertes, Reference Nicholson and Mertes2017); (iii) we do not correct for glacier flow; this is important because the on-glacier location at which debris thickness is measured at a given point in time will have since been displaced longitudinally, and perhaps laterally.
Scatterplots of in situ debris thickness measurements below 0.5 m against ERA surface-level estimated debris thickness for, (a) Miage Glacier, where 2005 R 2 = 0.10 and 2016 R 2 = 0.10, (b) Khumbu Glacier, where 2000 R 2 = 0.02 and 2009 R 2 = 0.01, and (c) Haut Glacier d'Arolla, where 2005 R 2 = 0.17 and 2016 R 2 = 0.09.

With the above considerations in mind, we use our AWS-derived distributed debris thickness estimations as a relative benchmark. Our use of the phrases ‘under-estimation’ or ‘over-estimation’ of estimated debris thickness is relative to our AWS-derived benchmark (Fig. 5; Fig. 6). To lend confidence to the accuracy of our final ERA-derived debris thickness estimations, we compare debris thickness estimations for Miage Glacier and Haut Glacier d'Arolla in Section 5.3.
Distributed debris thickness maps for Miage Glacier on 08 August 2016. Figures (a–c) show distributed thickness values derived using surface-level data, and (d–f) show distributed thickness values derived using pressure-level data from both ERA and NCEP/NCAR. Figures (g–h) and (i–j) show debris thickness changes relative to the AWS-derived debris thickness control maps.

Distributed debris thickness maps for Khumbu Glacier on 17 June 2009. Figures (a–c) show distributed thickness values derived using surface-level reanalysis data, and (d–f) show distributed thickness values derived using pressure-level data for both ERA and NCEP/NCAR. Figures (g–h) and (i–j) show debris thickness changes relative to the AWS-derived debris thickness control maps.

5.2 Comparison of reanalysis-driven estimates of debris thickness
5.2.1 Single- and pressure-level data
Distributed debris thickness maps were produced using NCEP/NCAR Reanalysis I and ERA-5 reanalysis data at both the surface-level and respective pressure-levels of 800 and 500 mb for Miage Glacier and Khumbu Glacier, and compared with AWS-derived distributed debris thickness maps (Figs 5, 6; Table 6). For Miage Glacier, we estimate debris thicknesses >0.25 m at the terminus and find that debris thickness decreases up-glacier. The emerging medial moraine is visible at the upper limit of the continuous debris extent before the debris thickness decreases to <0.05 m (Fig. 5). Debris thickness maps derived from the surface-level NCEP/NCAR data overestimate debris thickness by up to 0.3 m over the entire ablation area (Fig. 5g), with an overestimation in mean debris thickness (±1σ) of 0.02 ± 0.07 m (Fig 5g) compared to AWS-derived estimates (Figs 5b, e; Table 6). ERA-5 surface-level data have a mean debris thickness overestimation of 0.01 ± 0.05 m (Fig. 5h; Table 6). A ~0.06 km2 area of the northern lobe shows an underestimation of debris thickness of between 0 and 0.02 m when using ERA-5 meteorological forcing compared with AWS forcing (Fig. 5h). Conversely, the pressure-level-derived thickness maps show large overestimations using both NCEP/NCAR and ERA-5 reanalysis data; mean debris thickness values are 0.08 ± 0.09 and 0.09 ± 0.12 m (Figs 5d, f; Table 6), producing respective mean debris thickness overestimations of 0.09 ± 0.14 and 0.04 ± 0.07 m (Figs 5i, j; Table 6).
Mean (average of the glacier area) debris thickness estimates obtained using different meteorological input to force the model

Where pressure levels are referred to, Miage Glacier is taken at the 800/850 mb level and Khumbu Glacier is taken at the 500 mb level.
For Khumbu Glacier, the ERA-5 surface-level-derived debris thickness maps show a closer agreement to the AWS-derived debris thickness maps than the NCEP/NCAR surface-level-derived debris thickness estimates: simulated mean debris thicknesses are 0.09 ± 0.06 and 0.09 ± 0.06 m for NCEP/NCAR and ERA-5-derived maps (Figs 6a,c; Table 6), and exhibit debris thickness overestimations of 0.02 ± 0.02 and 0.01 ± 0.02 m, respectively. In contrast, at the 500 mb pressure-level, the NCEP/NCAR and ERA-5 reanalysis data produce debris thickness maps (Figs 6d,f; Table 6) with mean debris thickness differences of 0.02 ± 0.02 and 0.06 ± 0.06 m (Figs 6i,j; Table 6). Approximately 10% of the increase in debris thickness is observed in localised areas (~0.8 km2) as an overestimation of thicker debris (>0.25 m) on the western margin of the debris-covered area of Khumbu Glacier (Fig. 6). A qualitative comparison of the debris thickness estimations produced by the different reanalysis datasets provides a clearer insight into the distributed differences of the respective reanalysis products with respect to the AWS-derived benchmark. The glacier-wide mean debris thickness values and mean debris thickness changes presented above should be interpreted with caution as they do not reflect the spatial distribution of debris thickness change shown in Figures 5 and 6.
5.2.2 NCEP/NCAR and ERA-5 products
Linear regression of the AWS and reanalysis data variables is shown in Table 7. Differences in debris thickness estimation shown in Figures 5 and 6 are due to differences in the value of the meteorological inputs and it follows that it would be worthwhile to assess the relationship between these input data and the AWS input data. The data show a positive relationship between individual meteorological variables; for T air at Miage Glacier, R 2 = 0.73 for the AWS versus ERA-5 and 0.48 for the AWS versus NCEP/NCAR data, and R 2 = 0.83 and 0.80 for T air at Khumbu Glacier (Table 7). For Miage Glacier, T air, SH and RH exhibit higher R 2 values for AWS versus ERA-5 surface-level data comparison. For Khumbu Glacier, T air, S in, L in and RH show a higher R 2 (Table 7; Fig. 7). ERA-5 shows a stronger relationship (shown by higher R 2 values) to AWS meteorological data than NCEP/NCAR reanalysis data for three of the five meteorological variables (Table 7), and four out of the five meteorological variables for Khumbu Glacier (Table 7). This is in line with multiple studies, where ERA-5 is shown to be a superior reanalysis dataset (e.g. Balsamo and others, Reference Balsamo2018; Mahto and Mishra, Reference Mahto and Mishra2019).
Linear regression plots of AWS data against reanalysis data (all available 2016 AWS data at Miage Glacier, and all available 2009 AWS data at Khumbu Glacier). Green indicates ERA-5 surface-level reanalysis data and black indicates NCEP/NCAR Reanalysis I surface-level data. Grey dashed line indicates the 1:1 line.

Linear regression analysis of meteorological variables from both ERA-5 and NCEP against Automatic Weather Station data for the period of AWS data availability: Miage Glacier 2005–15, Khumbu Glacier 2000–09

a Indicates highest R 2 value.
Although the R 2 value is a good estimate of the strength of the relationship between the AWS and reanalysis input data, a more representative assessment of the variability that the interplay of multiple meteorological variables cause in the final debris thickness calculation would be through an analysis of how well reanalysis-forced estimates represent a 1:1 relationship when compared with the AWS benchmark estimates (Fig. 8). Both reanalysis datasets show a similar R 2 value and line gradients for Miage Glacier, with an R 2 of 0.65 and a gradient of 1.12 for NCEP/NCAR surface-level reanalysis, and an R 2 of 0.55 and a gradient of 0.80 for ERA-5 surface-level reanalysis. However, at Khumbu Glacier, there is an R 2 of 0.26 and a gradient of 0.62 using NCEP/NCAR surface-level reanalysis, and an R 2 of 0.89 and a gradient of 1.01 using ERA-5 surface-level reanalysis. Additionally, when the variability – or spread – of the datasets is considered, ERA-5 surface-level reanalysis shows a lower scatter than NCEP/NCAR surface-level reanalysis with std dev. of 0.10 and 0.07 for NCEP/NCAR and ERA-5, respectively, for Miage Glacier, and 0.05 and 0.04 for NCEP/NCAR and ERA-5, respectively, for Khumbu Glacier.
A scatterplot showing AWS-derived debris thickness estimations, and reanalysis-derived debris thickness estimations, for; (a) Miage Glacier, where NCEP/NCAR surface-level reanalysis R 2 = 0.65, and ERA-5 surface-level reanalysis R 2 = 0.55, and (b) Khumbu Glacier, where NCEP/NCAR surface-level reanalysis R 2 = 0.26, and ERA-5 surface-level reanalysis R 2 = 0.89.

For Miage Glacier, the use of pressure-level reanalysis data in the debris thickness model results in a mean overestimation of debris thickness (compared to AWS) of 0.09 ± 0.14 and 0.04 ± 0.07 m for the NCEP/NCAR and ERA-5 reanalysis inputs, respectively (Table 6). For Khumbu Glacier, the use of pressure-level reanalysis produces a mean overestimation of debris thickness of 0.02 ± 0.02 and 0.06 ± 0.06 m for NCEP/NCAR and ERA-5 data, respectively. For both glaciers, the mean overestimation of debris thickness decreases in magnitude when surface-level, rather than pressure-level reanalysis data are used as a model input. For Miage Glacier, the mean overestimation decreases by 0.07 to 0.02 ± 0.07 m for the NCEP/NCAR data, and by 0.03 to 0.01 ± 0.05 m for the ERA-5 data. For Khumbu Glacier, mean debris thickness overestimation decreases by 0.05 to 0.01 ± 0.02 m for the ERA-5 data. While we see no improvement in the NCEP/NCAR data when surface-level, as opposed to pressure-level reanalysis data are used; the mean debris thickness overestimation remains as 0.02 ± 0.02 (Table 6). These relative differences in performance are also displayed in Figure 5. Based on these results, the ERA-5 surface-level data outperform the NCEP/NCAR data when benchmarked against AWS-derived debris thickness.
To further corroborate this finding, we conducted a linear regression analysis of the individual meteorological variables (Table 7; Fig. 7), and found that the use of ERA-5 surface-level analysis data produces a higher R 2 value for 70% of the variables that are used to force the energy-balance model at both glaciers, though collinearity may have some influence on this result (i.e. T air and RH are expected to have the strongest linear correlation with the same reanalysis data type). We also compared values of reanalysis-driven debris thickness with AWS-driven debris thickness at the level of individual pixels and found that the use of ERA-5 data results in less variability overall as shown by the std dev. of the datasets (0.10 and 0.07 for NCEP/NCAR and ERA-5, respectively, for Miage Glacier, and 0.05 and 0.04 for NCEP/NCAR and ERA-5, respectively, for Khumbu Glacier; Fig. 8). There is a previously published precedent for the use of pressure-level, as opposed to surface-level reanalysis data (Schauwecker and others, Reference Schauwecker2015), for distributed debris thickness mapping. However, for Khumbu Glacier, pressure-level data underestimated the magnitude of several variables relative to the corresponding AWS data, including a relative underestimation of 2 m-air temperature by ~5 K. This underestimation and the results presented in the previous sub-section combine to produce a convincing argument for the use of surface-level ERA-5 reanalysis data in subsequent calculations.
5.3 Annual debris thickness estimates
Debris thickness was calculated between 2001 and 2019 for Miage Glacier (12 years with 14 images), between 2001 and 2016 for Khumbu Glacier, and between 2002 and 2019 for Haut Glacier d'Arolla (Fig. 9), using ERA-5 surface-level reanalysis data to force the model (Section 5.2.2).
Along-glacier estimated debris thickness using ERA surface-level reanalysis data for Miage Glacier (a, b), Khumbu Glacier (c, d) and Haut Glacier d'Arolla (e, f) with the left-hand column representing the full glacier length and the right-hand column the upper ablation area of both Miage and Khumbu glaciers. Black dots represent the mean debris thickness of in situ measurements per Fluxbox for individual years: 2005 for Miage Glacier; 2010 for Haut Glacier d'Arolla. In situ debris thickness measurements on Khumbu Glacier exceed the vertical scale (see Section 5.3).

For Miage Glacier, we obtain fluctuating estimates of debris thickness between 2001 and 2018 of between 0.0 and 6.0 km from the terminus. However, 2019 and 2016 show a variation from the trend, with predicted thicknesses at the terminus up to 0.15 m thinner than the remaining years. At distances of >6.0 km from the terminus, we observe a linear thickening of the debris layer between 2001 and 2019 (Fig. 9a). Our annual time series allows a direct comparison of the reanalysis-derived debris thickness estimates with the in situ measurements taken on the glacier in the 2005 ablation season (Mihalcea and others, Reference Mihalcea2008a). For each flux box, the mean measured debris thicknesses were plotted against the annual mean simulated debris thickness over the study period (Figs 9a, c), with 60% of measurements at Miage Glacier and 80% of measurements at Haut Glacier d'Arolla falling within the range of estimated debris thickness values. Debris thicknesses of up to 1 m have been reported for the southern terminal lobe of Miage Glacier (Mihalcea and others, Reference Mihalcea2008a), so it is likely that the model results underestimate debris thickness in this area. Further, all in situ debris thickness measurements for Miage Glacier are located where a significant change cannot be detected (Figs 9a, 10a; 0–6.0 km up-glacier). However, two-thirds of the in situ measurements fall within the range of debris thicknesses estimated by the model lending confidence to the accuracy of the absolute debris thickness estimates for Miage Glacier.
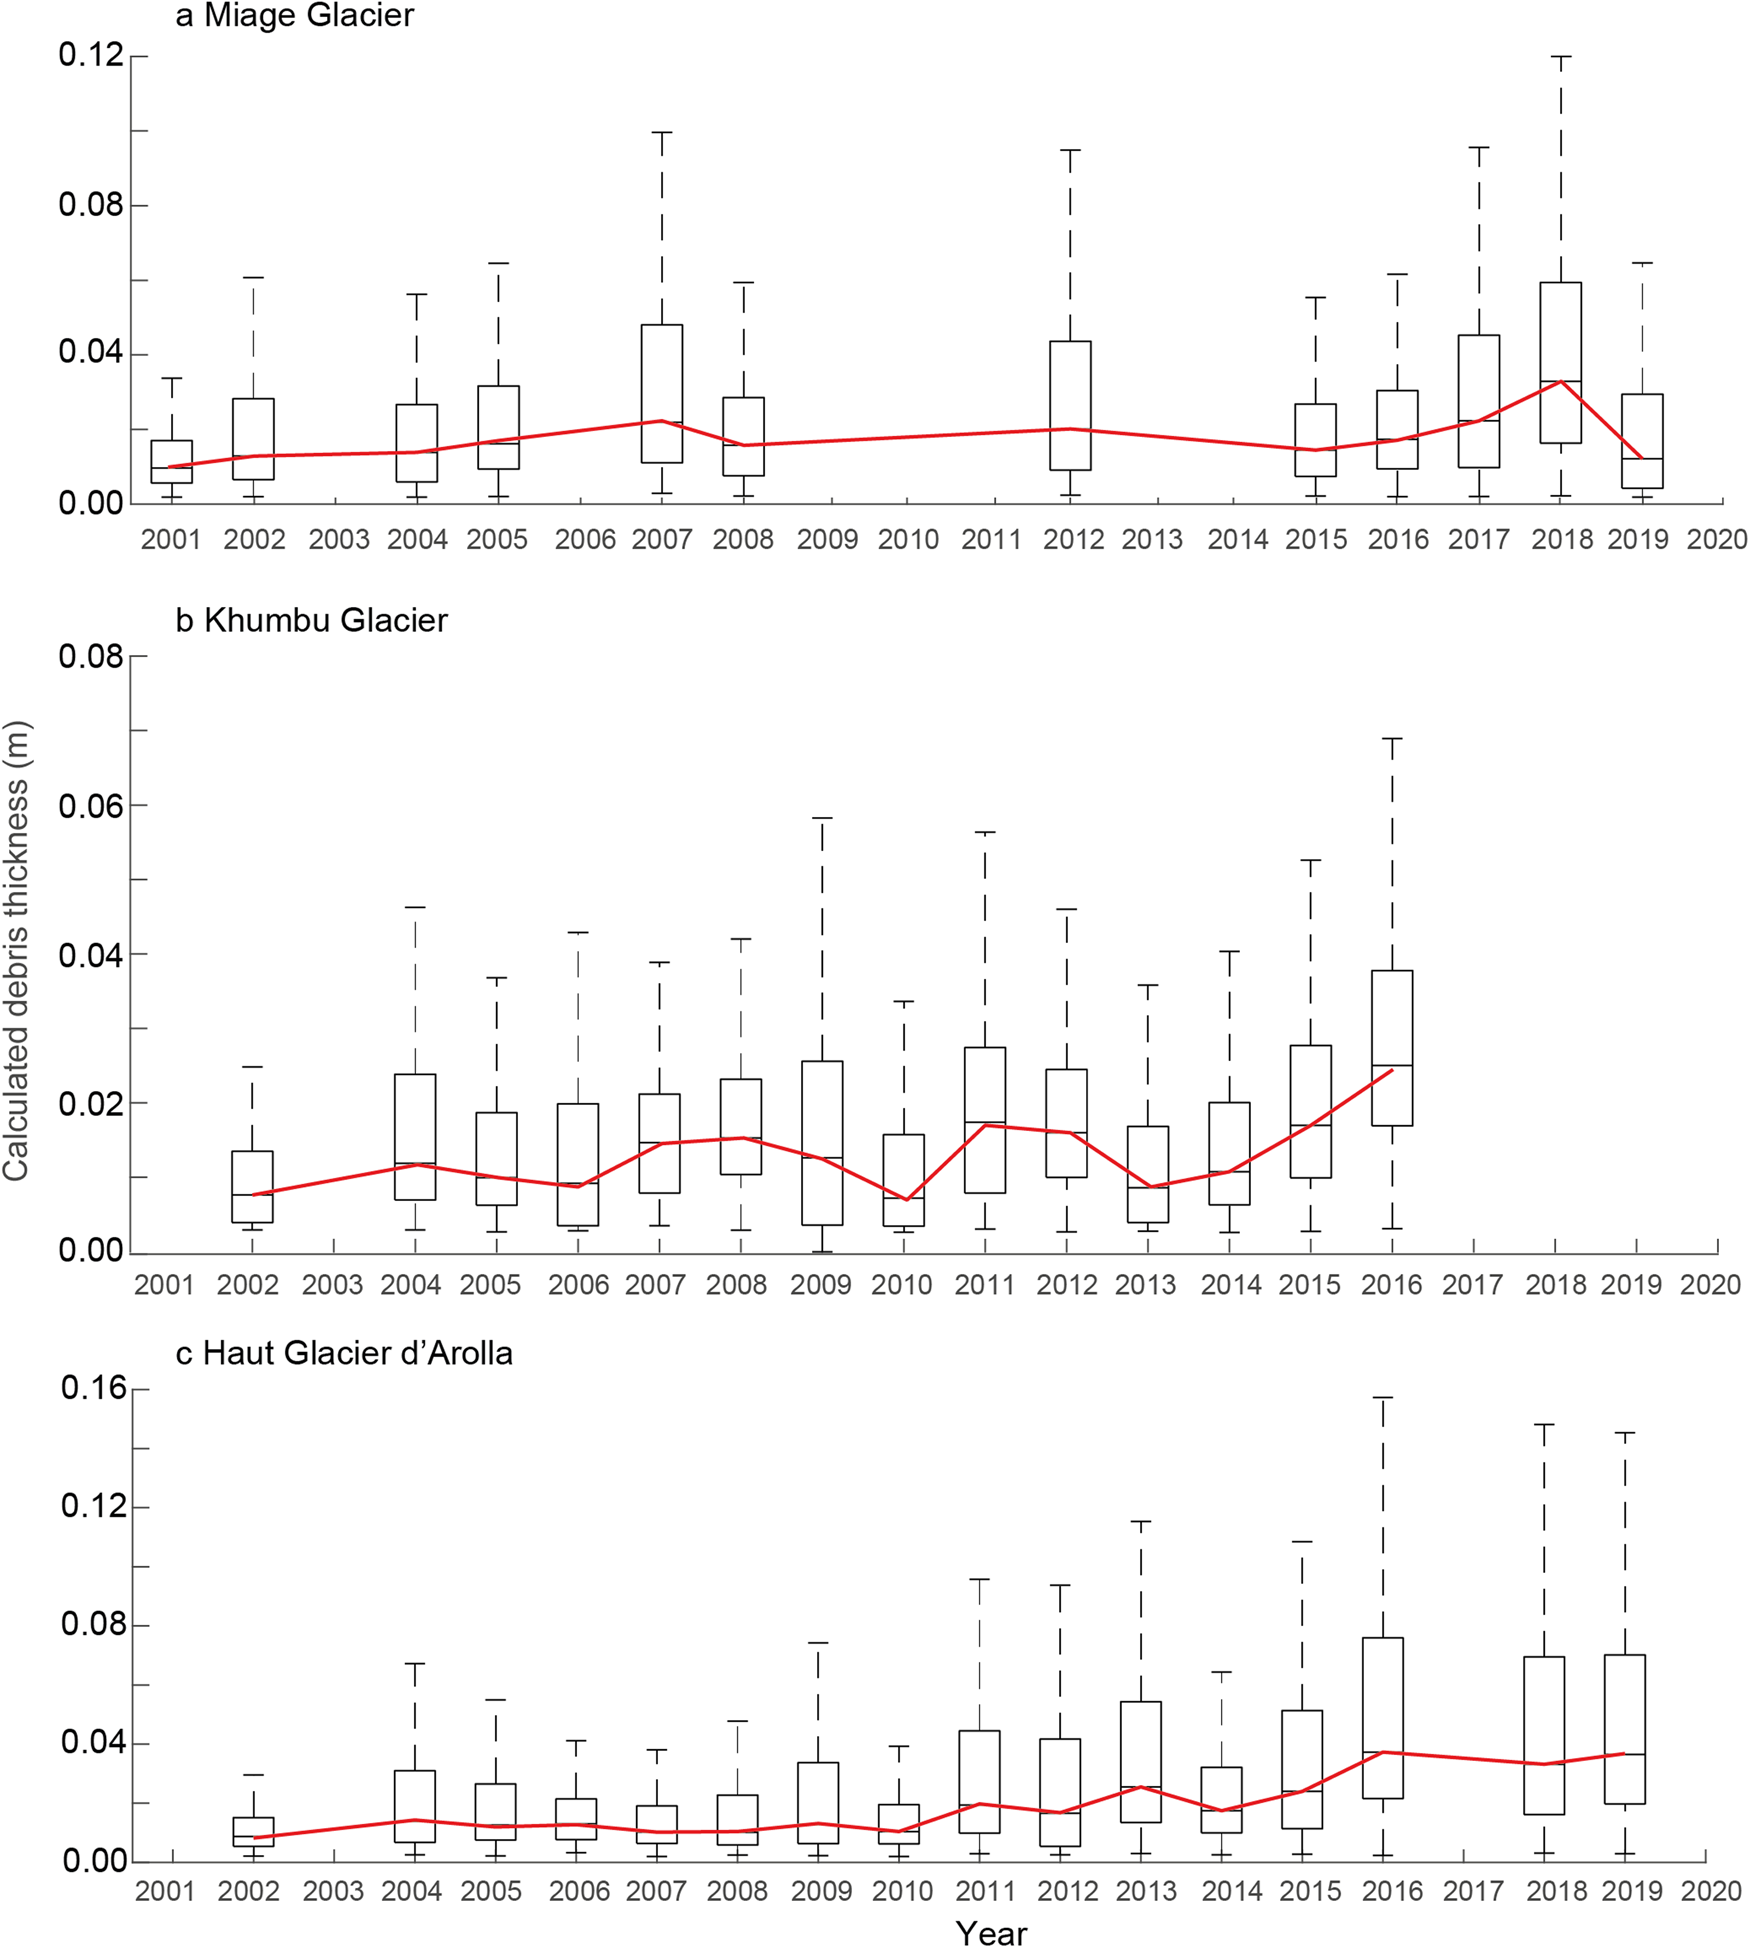
Annual box-and-whisker plots of debris thickness for areas of significant debris thickness changes estimated using ERA surface-level reanalysis data for (a) Miage Glacier, (b) Khumbu Glacier and (c) Haut Glacier d'Arolla. Red line shows the change in estimated median debris thickness over time. Years with no data are due to available satellite imagery being unsuitable for debris thickness estimation.
Similarly, for Khumbu Glacier, there is a large fluctuation in the debris thickness estimates over the period 2001–16, between 0.0 and 7.5 km from the terminus for Khumbu Glacier (Fig. 9b). However, when the upper ablation area is isolated (Fig. 10ii), there is a general trend of thickening over the study period. Debris thickness was measured at 143 locations via pit excavation, and 80% of the locations were found to have debris thickness >1 m (Gibson and others, Reference Gibson2018; Rowan and others, Reference Rowan2020). Our reanalysis-derived output underestimates debris thickness at the terminus of the glacier (0–2.5 km up-glacier) relative to these measurements: the local mean debris thickness from in situ measurements is 0.85 ± 0.24 m, whereas estimated debris thicknesses produce a local mean of 0.15 ± 0.07 m. These large discrepancies between estimated and measured debris thickness are not entirely unexpected, for two reasons: (i) debris cover exhibits large heterogeneity in thickness over short distances (e.g. Mihalcea and others, Reference Mihalcea2008b; Zhang and others, Reference Zhang, Fujita, Liu, Liu and Nuimura2011; McCarthy and others, Reference McCarthy, Pritchard, Willis and King2017; Nicholson and Mertes, Reference Nicholson and Mertes2017), and (ii) thermal imagery-based models are known to have poor performance at estimating debris thicknesses >0.5 m (e.g. Schauwecker and others, Reference Schauwecker2015), because of the need to account for heat storage in the debris, and this caveat likely applies to our approach. These explanations likely account for the large scatter in estimated debris thickness for Khumbu Glacier between 0.0 and 7.5 km from the terminus (Fig. 9b); as debris cover thins with increasing distance from the terminus, this scatter reduces and we observe a more systematic progression of increasing debris thickness through time.
On Haut Glacier d'Arolla, supraglacial debris thickness was calculated for every year between 2002 and 2019 (Fig. 9c), and shows a general trend of thickening for the entire glacier, with peaks in thickness observed at 1.5 and 2.0 km from the terminus. In situ debris thickness measurements from the year 2010 generally agreed well with estimated results, with mean measured debris thicknesses falling within the range of simulated debris thicknesses for each flux box within 0–1.5 km from the terminus (Fig. 9c). However, at a distance of 2 km from the terminus, measured debris thickness is up to 0.05 m thicker than our simulated debris thickness. This discrepancy is likely due to the fact that the measured debris thickness measurements were taken on or near the upper eastern moraine in only ~10% of the flux box area, whereas the flux box spans the full width of the glacier and incorporates areas where debris cover is much thinner (based on visual inspection of satellite imagery and field observations).
Annual median debris thickness over the period of analysis is plotted for each glacier (Fig. 11). Trendline analysis of the annual debris thickness shows that for Miage Glacier, the median debris thickness increases by 0.01 m over a 20-year period (a gradient of 0.0007), and over the same period, it increases by 0.01 m for Khumbu Glacier (a gradient of 0.0006) and by 0.04 m for Haut Glacier d'Arolla (a gradient of 0.0016); however, this linear trend is not statistically significant.
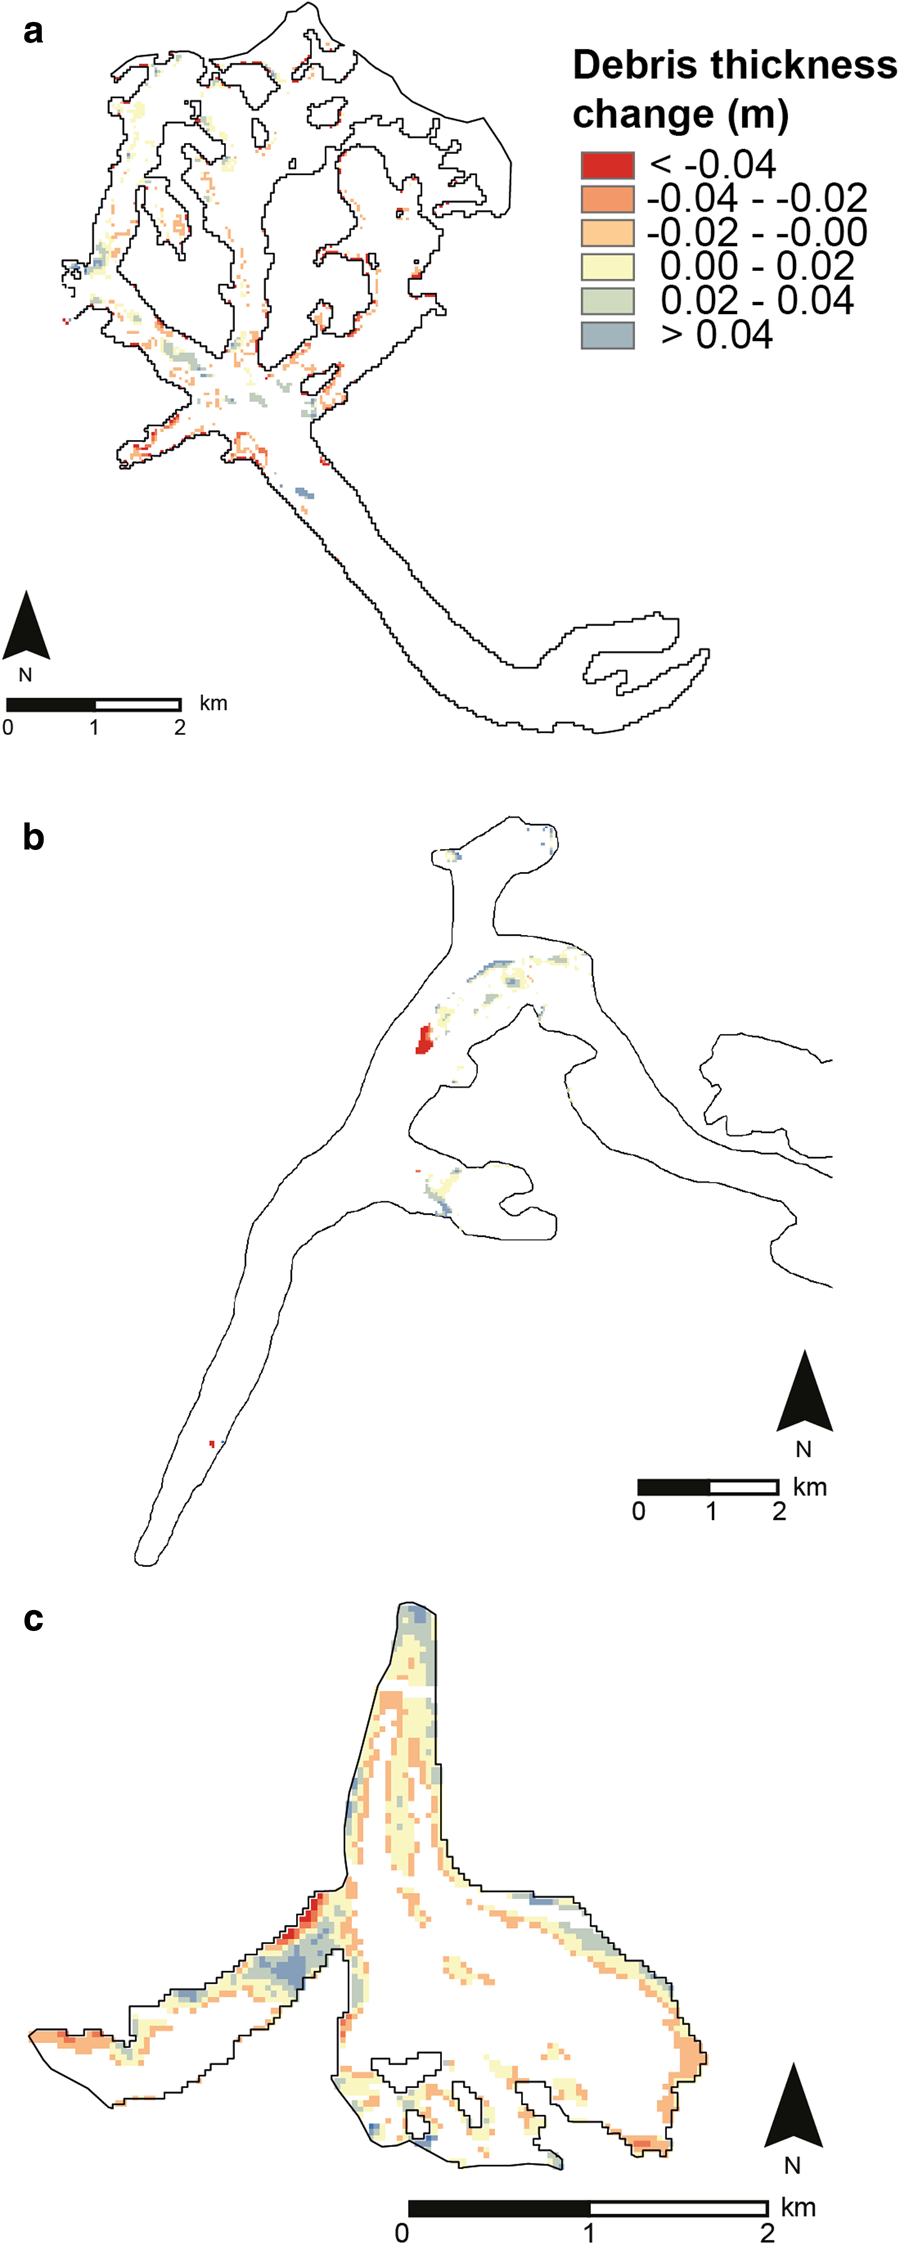
Significant debris thickness change in meters between (a) 2001–19 (Miage Glacier), (b) 2002–16 (Khumbu Glacier) and (c) 2002–19 (Haut Glacier d'Arolla) derived from ERA surface-level reanalysis data. Distributed maps are derived by differencing the first and last debris thickness estimates at the dates listed above. Where the debris thickness change is below the pixel-specific uncertainty or there is a lack of thermal satellite data, the pixels are coloured white and have been excluded from any further analysis. Glacier outlines are taken from RGIv.6.0 (RGI Consortium, 2017), except for the outline for Haut Glacier d'Arolla which has been updated to reflect the significant retreat of the glacier outline by 2019.
5.4 Estimated debris thickness change
Figure 12 shows debris thickness changes for the three glaciers over areas where those changes are significant. The uncertainty maps were used to remove insignificant debris change pixels from further analysis, as explained in Section 4.4. This thresholding removed 87% of the debris-covered pixels for Miage Glacier, 95% for Khumbu Glacier and 84% for Haut Glacier d'Arolla (Fig. 11). The uncertainty estimation and subsequent thresholding addresses variation in debris thickness that may be due to inaccuracy of the input meteorological variables. The complex interplay of meteorological variables and the surface temperature of the debris is resolved within the energy-balance model to provide robust estimations of significant debris thickness change. This ensures that changes observed as significant can be confidently attributed to a change in debris surface temperature due to changing proximity to the underlying ice, and therefore a corresponding change in debris thickness – a relationship shown by the Østrem curve. Higher uncertainties are found for pixels with thicker debris cover. Haut Glacier d'Arolla has the thinnest debris cover of the three glaciers, thus more pixels are retained as significant and thickness change results were retained along the full length of Haut Glacier d'Arolla (Fig. 11c). By comparison, Khumbu Glacier has the thickest debris cover and a higher overall degree of uncertainty, and so a high proportion of pixels fell below our change detection threshold. For Miage and Khumbu glaciers, our thresholding resulted in only retaining significant debris thickness change in the upper ablation area (Figs 11a, b).
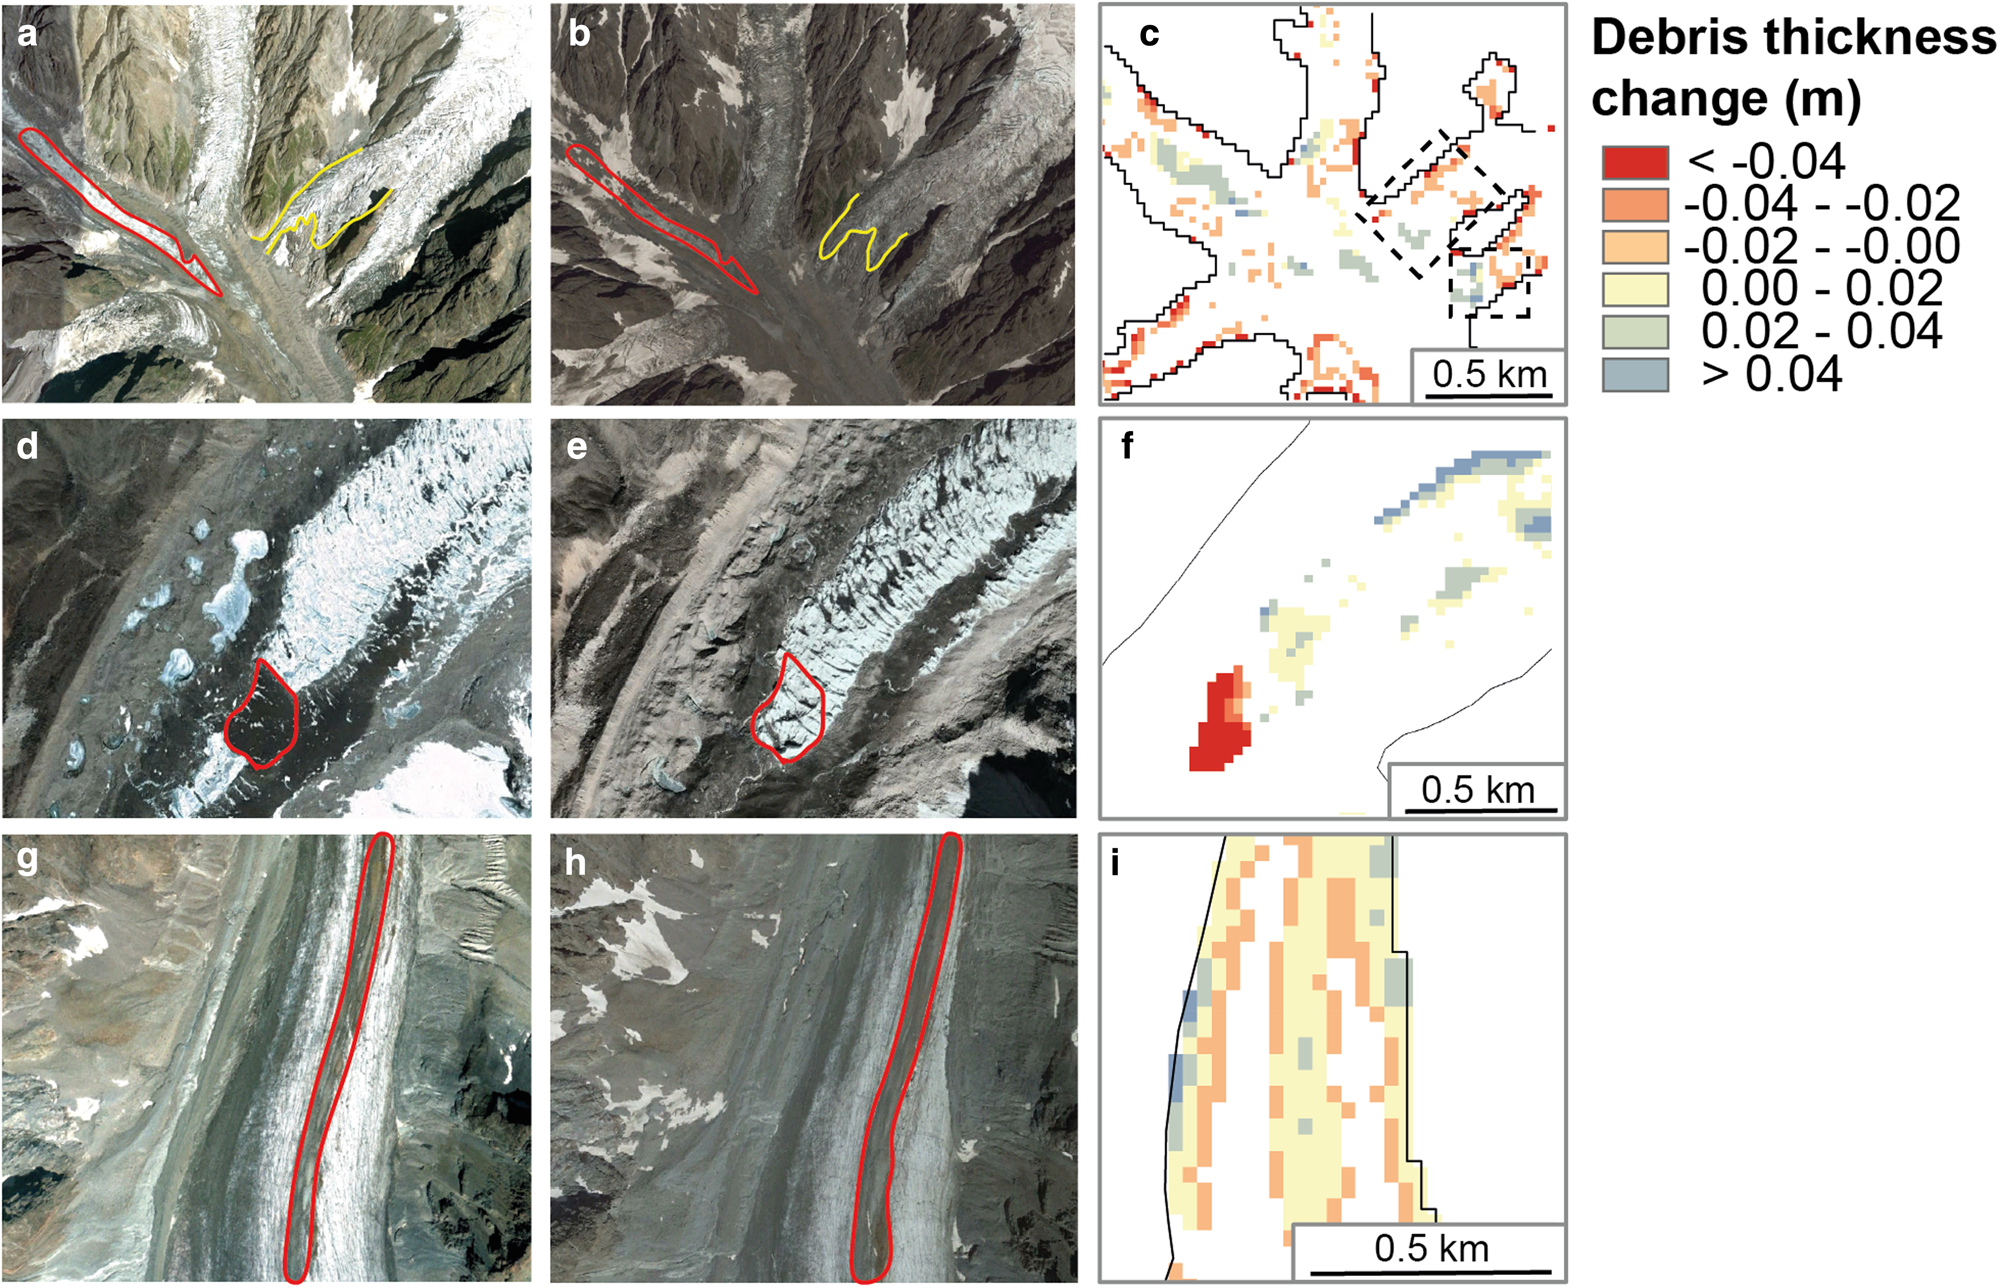
Evidence of debris thickness change at the three study glaciers. Miage Glacier: (a) location of debris thickness increase along the medial moraine (red) in 2011, and (b) both thickening of this moraine and detachment of Mt Blanc Glacier from the main trunk of Miage Glacier (yellow) by 2015, (c) significant debris thickness change over the study period, black boxes show the location of debris thinning–thickening at the glacier margins; Khumbu Glacier: (d) location of a substantial debris deposit at the base of the Khumbu icefall in 2003, (e) disappearance of the debris deposit by 2019, and (f) significant debris thickness change over the study period; and Haut Glacier d'Arolla: (g) outline of an emerging medial moraine in 2009, (h) thickening and widening of the moraine by 2017, and (i) significant debris thickness change over the study period. All images were retrieved from Google Earth, © 2020 Maxar Technologies.
Between 2002 and 2019, we observe an overall debris thickness decrease (Δh d = −0.02 ± 0.20 m; Table 8) for Miage Glacier (Fig. 11a). Of the significant change (13% of the total glacier area), 54% shows a decrease in debris thickness, and 45% shows an increase in debris thickness. We observe significant thickening (local median Δh d = + 0.02 ± 0.01 m) of debris located in the upper ablation area of Miage Glacier, along the medial moraine (Figs 12a, b). The majority of the significant debris thinning (local median Δh d = −0.12 ± 0.26 m) is located towards the glacier boundary and in the lower parts of its tributary glaciers (Figs 12a, b).
Summary statistics of ERA-5 surface-level debris thickness estimates for pixels where statistically significant change is detected, comprising of 13, 5 and 16% of the total debris-covered area of Miage Glacier, Khumbu Glacier and Haut Glacier d'Arolla, respectively

For Khumbu Glacier, the median debris thickness increases by 0.02 ± 0.07 m between 2002 and 2016 (Table 8). Of the significant change (5% of the total glacier area), 85% shows thickening over the study period, while only 15% showed thinning (Fig. 11b). Significant thinning of the debris is observed in a small patch at the lower end of the dirty ice that forms the base of the Khumbu icefall (Figs 12d–f). Debris accumulation is observed on the patches of formerly clean ice between crevasses (Figs 12d–f).
Haut Glacier d'Arolla shows a median significant debris thickness change of +0.01 ± 0.02 m over the study period (Table 8). Of the significant change (16% of the total glacier area), 67% shows thickening, and 33% shows thinning between 2002 and 2019. Significant thickening is evident at the terminus of the glacier and on the medial moraine and the upper eastern moraine (Figs 12g–i). Thinning is estimated at the edges of the medial moraine, and at the glacier margin, specifically towards the accumulation area in the lower south-east and at the confluence with the tributary glacier (Fig. 11).
6. Discussion
6.1 The use of climate reanalysis data in the debris thickness modelling workflow
When compared to the AWS benchmark, pressure-level reanalysis data overestimated debris thicknesses. Although pressure levels were selected at representative altitudes of 800 and 500 mb for Miage Glacier and Khumbu Glacier, respectively, surface-level reanalysis considers the influence of surface topography, offering a significant advantage over pressure-level reanalysis data. Moreover, when compared with the AWS benchmark, ERA-5 outperforms NCEP/NCAR when predicting debris thickness for Miage and Khumbu Glaciers. ERA-5 benefits from a substantial improvement in model physics and data assimilation relative to its ERA-40 counterpart (Wang and Dickinson, Reference Wang and Dickinson2013). A lack of assimilation data for air temperature and humidity data leads to deficiencies in the atmospheric water vapour values and thus the longwave radiation calculation of NCEP/NCAR reanalysis (Trenberth and others, Reference Trenberth, Fasullo and Smith2005; Wang and Dickinson, Reference Wang and Dickinson2013). In addition, the spatial resolution of NCEP/NCAR is coarser (2.5° × 2.5°) than that of ERA-5 (0.5° × 0.5°). We attribute these factors to the ability of ERA-5 input data to produce more accurate estimations of debris thickness.
Simulated debris thickness values for Khumbu Glacier are underestimated compared to in situ measurements (e.g. Nakawo and others, Reference Nakawo, Iwata, Watanabe and Yoshida1986; Gibson and others, Reference Gibson2018; Rowan and others, Reference Rowan2020), and it is likely that they are also underestimated for Miage Glacier where debris thicknesses >1 were observed in the field (Mihalcea and others, Reference Mihalcea2008a). This underestimation is due to several factors. Firstly, to develop a method for deriving distributed debris thickness maps using a non-proprietary workflow, we retrieved topographic information from the ASTER GDEM. Where possible, Rounce and McKinney (Reference Rounce and McKinney2014) advise using a high-resolution (<10 m grid spacing) DEM, because detailed topographic corrections of the incoming shortwave radiation are important for accurately deriving debris thickness predictions. Our use of relatively coarse-resolution topographic data and thermal imagery decreases our ability to resolve local variations in debris thickness. Comparing averaged flux-box or debris thickness map pixel (30 × 30 m) data with point-based field measurements is problematic; supraglacial debris is inherently heterogeneous over short spatial scales and can vary considerably over a 30 × 30 m Landsat 7 thermal imagery pixel (Gibson and others, Reference Gibson2018; Nicholson and others, Reference Nicholson, McCarthy, Pritchard and Willis2018). Such local-scale heterogeneity is not captured by our coarse-resolution debris thickness maps, but could be overcome by using higher-resolution topographic data inputs, such as the High Mountain Asia 8 m DEM (Shean, Reference Shean2017), and by leveraging future improvements in the spatial (and temporal) resolution of satellite thermal sensors and reanalysis datasets. Finally, a key limitation to thermal-image-based debris thickness estimation methods is the use of instantaneous energy-balance models for thick debris, in which storage of energy is likely and which would require calculations of the heat accumulation within the debris (Schauwecker and others, Reference Schauwecker2015). This will be discussed in the following section.
6.2 Debris thickness distribution and its spatio-temporal evolution
In situ debris thickness measurements at both Miage Glacier and Haut Glacier d'Arolla are within the range of estimated debris thickness values. This lends confidence to the absolute values of debris thickness predicted. In contrast, where non-linear changes in debris thickness are calculated for areas of Khumbu Glacier, these changes correspond to areas where the model severely underestimates in situ measurements of debris thickness (Fig. 9b). We attribute this underestimation to the documented inability of thermal-based models for accurately predicting field debris thicknesses >0.4 m. Field observations suggest that debris on the tongue of Khumbu Glacier exceeds 1 m (Rowan and others, Reference Rowan2020), therefore it is not unexpected that our estimated debris thickness values show no relationship to in situ debris thicknesses. When areas of significant debris change are isolated (Figs 9a, b), we see a more linear and systematic increase in debris thickness over time and this is because the debris is thin enough (<0.4 m) for the model to resolve debris thickness and thus provide maps that can be used to calculate debris thickness changes with confidence.
For Miage Glacier, linear regression-derived trends in median debris thickness indicate an increase in debris thickness of 0.01 m over the 20-year study period (Fig. 10a). However, if we calculate the change in debris thickness as the difference between the debris thickness maps in 2001 and 2019, we obtain a median debris thickness decrease of −0.02 ± 0.20 m (Table 8; Fig. 11a). Such comparison highlights an important methodological result and how debris thickness studies should be wary of describing debris thickness and debris thickness change using single images that might both have high errors and be affected by localised, time-specific thickness changes. In line with recent, novel research on DEM differencing that increasingly uses trends obtained from multiple, numerous datasets (Brun and others, Reference Brun, Berthier, Wagnon, Kääb and Treichler2017; Dussaillant and others, Reference Dussaillant2019), we suggest that for the detection of debris thickness changes, trends from multiple estimates should be used. Caution should also be used when calculating changes from isolated glacier-wide values, as the general trend in debris thickness and time-step-specific thickness change may vary significantly.
All three glaciers exhibit thinner debris layers in their upper reaches than in the lower sections at any given time considered in this analysis, which is typical of most debris-covered glaciers worldwide (e.g. Kirkbride and Warren, Reference Kirkbride and Warren1999; Gibson and others, Reference Gibson2017; Anderson and Anderson, Reference Anderson and Anderson2018). This pattern is a product of glacier flow, ablation and debris transport dynamics; under a negative mass-balance regime, the capacity for a glacier to evacuate its sediment load via its margins is reduced, and a debris cover may develop from the combination of englacial melt-out of debris in the form of medial moraine or discrete, discontinuous debris septa, and the addition and retention of supraglacial debris in the ablation zone via rockfall and rock avalanching (Kirkbride and Deline, Reference Kirkbride and Deline2013; Anderson and Anderson, Reference Anderson and Anderson2018). Debris can also be delivered to the glacier surface via the collapse of lateral moraines, and we may observe this mechanism for Haut Glacier d'Arolla (Fig. 10c), where our debris thickness differencing results suggest the addition of debris to the glacier surface from lateral moraines in the upper ablation area. It is most logical that significant debris thickness increases for Miage Glacier are driven primarily by englacial melt-out of debris (e.g. Kirkbride and Deline, Reference Kirkbride and Deline2013) and medial moraine expansion (Fig. 12; Anderson, Reference Anderson2000). These areas exhibit very thin debris cover, or ‘dirty ice’ (Fyffe and others, Reference Fyffe2020), and effectively represent a marginal area between more-or-less continuous debris cover, and ‘clean’ ice, into which the debris cover is encroaching as a negative mass balance persists and the equilibrium line increases in altitude. Little is known about the rates of debris emergence and thickening within these areas, and so our study presents the first multi-temporal analysis of the dynamics of debris thickness change at the margins of an expanding debris cover. Research within the debris-covered glacier community has primarily focused on ‘advanced stage’ glaciers such as Khumbu and Miage Glacier (Herreid and Pellicciotti, Reference Herreid and Pellicciotti2020: Figure 4), but there is an argument that more research should focus on those glaciers, or regions of glaciers, at earlier stages of debris development, where an expanding debris cover is more influential on glacier mass balance and can also enhance ablation when very thin (i.e. in the so-called dirty ice zones; Herreid and Pellicciotti, Reference Herreid and Pellicciotti2020). Because our model performs particularly well at resolving debris thickness change in these areas, our method seems a valuable contribution to this research direction.
Where we observe a decrease in debris thickness through time (Fig. 11), this decrease could be attributed to thinning of the glacier, accompanied by exposure of bedrock as glacier ice retreats. This process is evident in Figures 12a–c where, over the ~20-year study period, the tributary Mont Blanc Glacier detaches from the main trunk of Miage Glacier. Debris is deposited at the base of the bedrock cliff that occupies the space between the retreating tributary glacier and the debris-covered surface of Miage Glacier (Fig. 12c). For Khumbu Glacier, we model a large area of debris thickness decrease at a distance of 7.2 km from the glacier terminus (Fig. 12f). This decrease is attributed to the supraglacial advection of debris in a conveyor belt-like fashion due to glacier flow (Anderson and Anderson, Reference Anderson and Anderson2016). Over time, this area of the glacier is replaced by a highly crevassed portion of clean-ice originating from the base of the Khumbu icefall. We model a thickening of the moraines that surround the base of this icefall and an increase in debris accumulated from englacial melt-out on the patches of clean ice that bridge between the crevasses (Figs 12d–f). At Haut Glacier d'Arolla, we also see thickening and widening of the medial moraine (Figs 12g–i). Areas of debris thickness decrease correspond to down-glacier transport of debris and thinning of the glacier. This increase in debris can also be attributed to englacial melt-out and medial moraine expansion as already described above, demonstrating consistency in process representation between the results for our three study glaciers.
This research has shown that reanalysis data are a suitable substitute for in situ meteorological data within a distributed debris thickness modelling framework. Reanalysis data can be used to derive meteorological inputs (except wind speed) for a debris thickness estimation approach based on energy-balance modelling and satellite thermal images, which can subsequently be used to estimate and compare spatially distributed patterns of debris thickness across, and between, glaciers with varying debris maturities, and over multiple decades. We find that estimated debris thickness most closely mirrors those derived from in situ AWS data products when forced with ERA-5 reanalysis data, rather than NCEP/NCAR data.
To demonstrate the potential of the approach for the detection of changes in debris thickness, we generated distributed debris thickness maps for multiple images over ~20 years for each study glacier. We then use this abundance of estimates to derive trends in debris thicknesses and calculate changes from these trends. We show that such estimates are much more robust than single calculations of changes from differencing two debris thickness maps, which can result in changes in sign. Despite being more computationally demanding, we suggest that this approach should be used for the detection of changes in debris thickness.
Our distributed thickness and thickness change maps show spatio-temporal trends in debris thickness which are consistent with trends observed in the literature (e.g. Nakawo and others, Reference Nakawo, Iwata, Watanabe and Yoshida1986; Kirkbride and Warren, Reference Kirkbride and Warren1999; Kirkbride and Deline, Reference Kirkbride and Deline2013; Anderson and Anderson, Reference Anderson and Anderson2018). All glaciers show a decrease in debris thickness up-glacier, and a positive trend in debris thickness through time. We observed spatio-temporal variations in debris thickness due to supraglacial advection, and englacial melt-out and medial moraine expansion, the latter of which are key drivers of debris cover expansion. However, our estimates are less accurate for debris thicker than 0.5 m, at which point a more sophisticated approach for the calculation of the storage of energy within the debris should be used. Future work should focus on further improvements of the energy-balance approach (e.g. by replacing instantaneous calculation with transient modelling that accounts for the history of heat changes within the debris) and reducing uncertainty for key input variables and parameters, namely wind speed and properties of the debris cover such as conductivity and surface aerodynamic roughness. Deriving G ratio at multiple locations, to determine if this parameter varies significantly for different debris thicknesses, will increase the robustness and transferability of the model, and collection of in situ debris thickness measurements across thin debris/dirty ice will allow additional validation of model outputs.
7. Conclusions
Quantifying supraglacial debris thickness is essential for accurately calculating ablation from debris-covered glaciers. A primary input for existing debris thickness calculations is meteorological data, which are commonly retrieved from in situ AWS observations, thus limiting the applicability of such models to the majority of glaciers for which local meteorological measurements are not available. We have shown that ERA-5 surface-level reanalysis data are superior to NCEP/NCAR reanalysis data in spatial debris thickness modelling. We substituted AWS data with the former, with the exception of wind speed, to drive a debris thickness-estimation approach that uses energy-balance modelling together with thermal satellite imagery-derived surface temperature. Importantly, we applied the method to 44 thermal images over a 20-year period to reconstruct a time series of debris thickness between 2001 and 2019 for Miage Glacier, 2002 and 2016 for Khumbu Glacier, and 2002 and 2019 for Haut Glacier d'Arolla. We generated the estimates of distributed debris thickness for the three mountain glaciers and these thickness estimates were within 0.02 m of AWS-derived estimates. They resolved glacier-scale trends in debris thickness distribution, including a down-glacier increase in debris thickness. By differencing those successive debris thickness maps, we present an analysis of distributed debris thickness change and resolved spatio-temporal, statistically significant changes in debris thickness over a ~20-year period, which we attribute to well-documented physical processes such as englacial melt-out, including medial moraine development, and down-glacier advection of supraglacial debris. Importantly, we are able to resolve significant changes in debris thickness in areas of these glaciers that are not at an advanced stage of debris cover development, and where the role of debris cover is likely important for driving enhanced ablation.
Our work has also shown that advances are needed both in energy-balance modelling, meteorological forcing and debris properties. Energy-balance models should be improved by including transient simulations that are not limited to the instantaneous energy fluxes calculations at the time of the images, as these cannot capture changes in debris heat content and thus reproduce the correct temperature gradients within the debris. Furthermore, assumptions of a surface energy balance and a latent heat flux of zero at the top of the debris layer (Rounce and McKinney, Reference Rounce and McKinney2014) need to be tested further and constrained with field observations. Future research should also seek to improve the downscaling of reanalysis data, and wind speed data in particular, to glacier surfaces. It should also seek to estimate and measure debris properties and their variability in time, as well as measure debris temperature profiles at multiple locations (e.g. Rowan and others, Reference Rowan2020) to enhance our understanding of heat transfer within the debris and test the robustness of the G ratio parameter, in turn reducing model uncertainty.
Supplementary material
The supplementary material for this article can be found at https://doi.org/10.1017/jog.2020.111
Acknowledgements
We thank NASA's LP DAAC for ASTER G-DEM-2 imagery, and USGS for Landsat 7 surface brightness products. The meteorological dataset for Khumbu Glacier used in this study was collected within the framework of the Ev-K2-CNR Project in collaboration with the Nepal Academy of Science and Technology as foreseen by the Memorandum of Understanding between Nepal and Italy, and thanks to the contributions from the Italian National Research Council, the Italian Ministry of Education, University and Research and the Italian Ministry of Foreign Affairs. FP acknowledges funding from the European Research Council (ERC) under the European Union's Horizon 2020 research and innovation programme grant agreement No 772751. F.P. and M.W. additionally acknowledge funding from the Natural Environment Research Council (NERC) via Research Grant NE/S013296/1. Finally, we thank Associate Chief Editor Hester Jiskoot, Scientific Editor Nicolas Cullen and two anonymous reviewers whose insightful comments and suggestions vastly improved the manuscript.
Data Acknowledgment
Data are available upon reasonable request to the corresponding author.


 Open access