


1. Introduction
From 1961 to 2016, total mass loss from glaciers and ice caps surpassed that from both the Greenland and Antarctic ice sheets, contributing 27 ± 22 mm to global sea level rise (Zemp and others, Reference Zemp2019). Glacier mass loss has accelerated in recent decades, with losses during 2012–23 (−314 ± 23 Gt a−1) 36 ± 10% higher than 2000–11 (Zemp and others, Reference Zemp2025). The Canadian Arctic was the largest contributor to sea level rise outside the ice sheets during 1961–2016 and remained the second largest from 2000 to 2023 (Zemp and others, Reference Zemp2019, Reference Zemp2025). Understanding dynamic change of marine-terminating outlet glaciers in this region is therefore crucial, as variations in ice discharge can amplify glacier response to climate change. External forcings associated with enhanced meltwater access to the glacier bed have been proposed to influence flow instabilities in some marine-terminating glaciers by modifying basal hydrological, thermal, and stress conditions, with meltwater sometimes modulating or amplifying instabilities preconditioned by thinning-induced changes within the lower glacier in geometry and basal conditions (Dunse and others, Reference Dunse, Schellenberger, Hagen, Kääb, Schuler and Reijmer2015; Sevestre and others, Reference Sevestre2018; Willis and others, Reference Willis2018; Nuth and others, Reference Nuth2019; Zheng and others, Reference Zheng, Pritchard, Willis and Stearns2019; Haga and others, Reference Haga, McNabb, Nuth, Altena, Schellenberger and Kääb2020; Benn and others, Reference Benn, Hewitt and Luckman2023; Nanni and others, Reference Nanni2025).
Glacier dynamic instabilities correspond to switches between slow and fast flow in response to sudden changes in basal or frontal conditions (Nuth and others, Reference Nuth2019). These events can temporarily lead to marked increases in glacier mass loss and amplified ice discharge to the ocean, significantly exceeding what is typical under dynamically stable, steady-state conditions (Dunse and others, Reference Dunse, Schellenberger, Hagen, Kääb, Schuler and Reijmer2015; Willis and others, Reference Willis2018; Nuth and others, Reference Nuth2019). The most commonly reported instabilities are glacier surges, characterised by cyclical variations in ice flow, whereby a glacier oscillates between long periods of slow flow, called the quiescent phase, followed by shorter periods of significantly faster flow, called the active or surge phase (Meier and Post, Reference Meier and Post1969). During the active phase, glacier flow typically undergoes an abrupt increase by an order of magnitude or more above background levels, lasting from about a year on temperate glaciers (Kamb and others, Reference Kamb1985) up to several decades on polythermal glaciers (Frappé and Clarke, Reference Frappé and Clarke2007; Van Wychen and others, Reference Van Wychen, Hallé, Copland and Gray2022, Reference Van Wychen, Jiskoot, Shannon and Gorwill2025; Lovell and others, Reference Lovell2026). The ensuing quiescent phase is marked by a sharp decrease of glacier velocities back to a slow flow that is often close to stagnation. Quiescent periods can range from 3 years (Nolan and others, Reference Nolan, Kochtitzky, Enderlin, McNabb and Kreutz2021) to hundreds of years (Dowdeswell and others, Reference Dowdeswell, Hamilton and Hagen1991).
While only ∼0.5% of Canadian Arctic glaciers are estimated to undergo flow instabilities based on morphological evidence (74 glaciers; Copland and others, Reference Copland, Sharp and Dowdeswell2003; Sevestre and Benn, Reference Sevestre and Benn2015; Van Wychen and others, Reference Van Wychen, Burgess, Kochtitzky, Nikolic, Copland and Gray2021; Lovell and others, Reference Lovell2026), their typically large average size of ∼630 km2 (Sevestre and Benn, Reference Sevestre and Benn2015) means they occupy a disproportionately large area of the region and therefore account for nearly a third of the total glacier area (Lovell and others, Reference Lovell2026). In fact, the Canadian Arctic hosts some of the largest surge-type glaciers worldwide, most of which are marine-terminating, with lengths an order of magnitude greater than the average of other surge-type glaciers in the ‘Arctic Ring’, including Svalbard (Sevestre and Benn, Reference Sevestre and Benn2015; Ou, Reference Ou2022). Despite this, detailed studies of glacier dynamic instabilities in the Canadian Arctic remain limited in comparison to other surge clusters, and the mechanisms that govern this behaviour warrant additional investigation (Copland and others, Reference Copland, Sharp and Dowdeswell2003; Van Wychen and others, Reference Van Wychen2016; Medrzycka and others, Reference Medrzycka, Copland, Van Wychen and Burgess2019; Van Wychen and others, Reference Van Wychen, Hallé, Copland and Gray2022; Lauzon and others, Reference Lauzon, Copland, Van Wychen, Kochtitzky, McNabb and Dahl-Jensen2023a, Reference Lauzon, Copland, Van Wychen, Kochtitzky and McNabb2023b; Copland and others, Reference Copland, Hallé, Van Wychen, Lauzon, Dowdeswell and Davis2024; Van Wychen and others, Reference Van Wychen, Jiskoot, Shannon and Gorwill2025). Full active phase characterisations and analyses have only been undertaken for Iceberg Glacier, Umingmat Nunaat (Axel Heiberg Island; Lauzon and others, Reference Lauzon, Copland, Van Wychen, Kochtitzky, McNabb and Dahl-Jensen2023a), and Mittie Glacier, southeastern Umingmak Nuna (Ellesmere Island; Copland and others, Reference Copland, Hallé, Van Wychen, Lauzon, Dowdeswell and Davis2024). Research to date illustrates the variety of ways in which these dynamic instabilities manifest, from long, low-magnitude instabilities spanning several decades (Medrzycka and others, Reference Medrzycka, Copland, Van Wychen and Burgess2019; Van Wychen and others, Reference Van Wychen, Hallé, Copland and Gray2022; Lauzon and others, Reference Lauzon, Copland, Van Wychen, Kochtitzky and McNabb2023b; Van Wychen and others, Reference Van Wychen, Jiskoot, Shannon and Gorwill2025) to significantly shorter and more dramatic accelerations lasting a decade or two (Lauzon and others, Reference Lauzon, Copland, Van Wychen, Kochtitzky, McNabb and Dahl-Jensen2023a; Copland and others, Reference Copland, Hallé, Van Wychen, Lauzon, Dowdeswell and Davis2024).
To provide further insights into the characteristics and drivers of glacier surges in the Canadian Arctic, this study documents the surge cycle of Southeast-1 and Southeast-2 glaciers on Devon Ice Cap using remote sensing data from 1959 to 2024. Our findings provide the first estimate of the quiescent-phase length for a surge-type glacier in the Canadian Arctic and broaden the known range of active-phase durations and the mechanisms driving them.
2. Study area
The Southeast basin (RGI7.0–03.05172) of Devon Ice Cap, Tallurutit (Devon Island; Fig. 1a), is the second largest in the Canadian Arctic, with an area exceeding 2600 km2 (RGI Consortium, 2023). Southeast-1 Glacier (74.945°N, 80.650°W) and Southeast-2 Glacier (74.995°N, 80.650°W), henceforth referred to collectively as Southeast glaciers, are the two major marine-terminating outlet glaciers of this basin, flowing eastward into Hyde Inlet (Fig. 1c). They share a ∼11.5 km-wide tidewater terminus grounded ∼200 m below sea level (Fig. 1b). Based on NASA Operation IceBridge measurements from 4 May 2012 (Paden and others, Reference Paden, Li, Leuschen, Rodriguez-Morales and Hale2010, updated 2019), more than 95% of the lowermost ∼30 km of Southeast-2 Glacier is grounded below sea level, including the entire lowermost ∼23.5 km. Up-glacier of ∼7 km from the terminus, Southeast-1 Glacier is generally grounded at higher bed elevations than Southeast-2, with median bed elevations of ∼62 m below sea level for Southeast-1 between 10 and 20 km from the terminus, compared to ∼155 m below sea level for Southeast-2.
(a) Location of Southeast-1 and Southeast-2 glaciers on Devon Ice Cap, Devon Island (glacier outlines from the Randolph Glacier Inventory 7.0; RGI Consortium, 2023). (b) Glacier surface and bed topography of Southeast-2 Glacier from NASA Operation IceBridge airborne radar measurements on 4 May 2012 (green line in Figure 1c; https://nsidc.Org/icebridge/portal/map; Paden and others, Reference Paden, Li, Leuschen, Rodriguez-Morales and Hale2010, updated Reference Paden, Li, Leuschen, Rodriguez-Morales and Hale2019). (c) Centrelines of Southeast-1 and Southeast-2 glaciers delineated by blue and yellow lines, respectively, and the extent of each of their main terminus and upper main trunk regions used for analysis are outlined with dashed lines. Numbers refer to km distances from the terminus, and round markers at the glacier termini indicate the location of point velocities extracted from the ITS_LIVE dataset (Gardner and others, Reference Gardner, Fahnestock and Scambos2022). Base imagery is a mosaic of cloud-free Sentinel-2 images from 1 July 2024 to 31 August 2024.

The trunks of Southeast-1 and Southeast-2 glaciers extend approximately 20 km (∼350 m a.s.l.) and 17.5 km (∼375 m a.s.l.) from their shared 2024 terminus, converging just south of a nunatak. We define the main trunk as the combined portion of both glaciers between the terminus and the nunatak confluence point. Although the glaciers share a trunk and terminus, they exhibit distinct dynamics and will therefore be analysed separately in the text. These two glaciers have previously been identified as exhibiting features indicative of fast glacier flow, including flow stripes, looped moraines, and shear margins, and as showing surge-like dynamics between 1996 and 2015 (Copland and others, Reference Copland, Sharp and Dowdeswell2003; Burgess and others, Reference Burgess, Sharp, Mair, Dowdeswell and Benham2005; Burgess and Sharp, Reference Burgess and Sharp2008; Van Wychen and others, Reference Van Wychen, Copland, Gray, Burgess, Danielson and Sharp2012, Reference Van Wychen2017).
3. Methods
3.1. Terminus position changes
A range of imagery from 1959 to 2024 was used to track changes in terminus position as a preliminary indicator of surging activity over a 65-year period (Appendix, Table A1). The earliest image is a nadir aerial photograph acquired on 17 July 1959 from the National Air Photo Library, Ottawa (https://www.eodms-sgdot.nrcan-rncan.gc.ca/). The image was manually georeferenced in ArcGIS Pro against a Landsat 9 scene from 8 August 2022 to determine the 1959 terminus position of Southeast glaciers. Georeferencing was performed using a first-order polynomial (affine) transformation with nine tie points, yielding a total root mean square error of 12.1 m.
Terminus outlines from 1972 to 2024 were delineated from optical satellite imagery, mostly consisting of Landsat 1–9 Level-1TP scenes (i.e. precision and terrain corrected) downloaded from the USGS Earth Explorer data portal (http://earthexplorer.usgs.gov). Imagery from the Advanced Spaceborne Thermal Emission and Reflection Radiometer (ASTER), accessed via NASA’s Earthdata portal (https://search.earthdata.nasa.gov/search), and from the Satellite pour l’Observation de la Terre (SPOT), obtained through the SPOT World Heritage archive (https://regards.cnes.fr/user/swh/modules/60), was used for years where no suitable Landsat scenes were available between 2003 and 2013.
The terminus position of the glaciers was manually outlined yearly for 1959–2024 in ArcGIS Pro. Median and maximum terminus-wide changes in ice front position between each year were computed with the Glacier Termini Change Tracking (GTT) toolbox from Urbanski (Reference Urbanski2018). Uncertainties from manual delineation of terminus extents were conservatively estimated at two pixels (Kochtitzky and others, Reference Kochtitzky2019; Lauzon and others, Reference Lauzon, Copland, Van Wychen, Kochtitzky, McNabb and Dahl-Jensen2023a, Reference Lauzon, Copland, Van Wychen, Kochtitzky and McNabb2023b; Partington and others, Reference Partington2025) to account for variations in georeferencing and orthorectification accuracy across different imagery. Assuming no systematic biases in terminus delineation and that uncertainties stem from random, independent errors, uncertainties in mean annual terminus position change rates were calculated as follows, based on Hall and others (Reference Hall, Bayr, Schöner, Bindschadler and Chien2003):
 \begin{align}&Uncertainty \nonumber\\
&= \,\frac{{\sqrt {(pixel\,lengt{h^2}) + (pixel\,widt{h^2})} \, + \,georectification\,error}}{{number\,of\,years\,}} \cdot \end{align}
\begin{align}&Uncertainty \nonumber\\
&= \,\frac{{\sqrt {(pixel\,lengt{h^2}) + (pixel\,widt{h^2})} \, + \,georectification\,error}}{{number\,of\,years\,}} \cdot \end{align}The georectification error in Equation (1) accounts for inaccuracies introduced when aligning images to a common reference frame, whether historical air photos to satellite imagery or older satellite images to newer satellite datasets. This error is included for both the manually georeferenced 1959 air photo and the manually corrected Landsat 1–4 images. The pixel length and width were calculated as the average pixel size of the images used in the calculation.
3.2. Glacier surface velocities
3.2.1. Glacier image velocimetry
Glacier surface velocities from 1972 to 1984 were derived from Landsat 1–4 optical satellite imagery using the Glacier Image Velocimetry (GIV) app (Van Wyk de Vries and Wickert, Reference Van Wyk de Vries and Wickert2021; Van Wyk de Vries, Reference Van Wyk de Vries2021a, Reference Van Wyk de Vries2021b; Appendix, Table A2). Accurate georeferencing is critical to compute glacier velocities from older Landsat imagery, so scenes were manually georeferenced in ArcGIS Pro using 4–12 tie points, yielding root mean square (RMS) errors ranging from ∼4 to 36 m. Surface velocities were estimated from near-annually separated Landsat 1–4 images from the same path and row, which were subset to a smaller area encompassing only the Southeast basin and its immediate surroundings. A relatively low signal-to-noise ratio of 3 and a peak ratio of 1.2 were used in GIV for these low-resolution products, maximising matches between image pairs while maintaining a reasonable level of noise. Despite this, coverage in the resulting velocity outputs (GeoTIFF files, ∼240 m resolution) was partial and typically better in the upper trunk of both glaciers than near the terminus. Although both regions had distinct surface features suitable for tracking, visual inspection revealed higher image coherence in the upper trunk, which facilitated feature matching between images. As a result, velocities near the terminus were manually estimated for years when distinctive surface features could be visually tracked between image pairs, specifically in 1975, 1976, and 1977.
To remove blunders and ensure consistency with the dominant glacier flow direction, velocity vectors with flow directions outside the range of 15–145° were excluded. This threshold captures approximately ±45° of variability relative to the downstream orientation of the glacier centreline. An average of 33% of pixels across velocity maps were excluded after filtering for flow direction, with exclusion rates of 10–55%. Uncertainties for velocities estimated using GIV were assessed by calculating the median velocity over unglacierised terrain surrounding Southeast glaciers. These estimates range from 22.3 to 111.1 m (standard deviation (SD): 16.9–79.1 m) for GIV-derived velocities from 1972 to 1984, with a median uncertainty of 40.2 m across the full dataset (Appendix, Table A2).
3.2.2. ITS_LIVE dataset
Glacier surface velocities for 1984 to 2024 were acquired from the NASA MEaSUREs Inter-mission Time Series of Land Ice Velocity and Elevation (ITS_LIVE) dataset (Gardner and others, Reference Gardner, Fahnestock and Scambos2022). Version 2 of the dataset incorporates velocities derived from both optical and synthetic aperture radar imagery from Landsat 4–9 and Sentinel-1/2 and is available through the National Snow and Ice Data Center (https://nsidc.org/apps/itslive/; Gardner and others, Reference Gardner2018, Reference Gardner2025). The velocity products are available either as individual image-pair velocities, or as annual velocity mosaics compiled from all scene-pair velocities whose mid-point falls within a given year. The provided velocity errors reflect the residual sum of squared standard errors relative to a stable surface, though they may underestimate the true uncertainty (see https://its-live.jpl.nasa.gov/#documentation for more details).
Most annual velocity mosaics prior to 2013, derived from Landsat 4, 5, and 7 imagery in version 2 of the dataset, exhibited high noise levels and poorer coverage over the Southeast basin compared to version 1. Based on visual inspection, version 2 mosaics showed substantial artefacts and a greater number of outliers. Consequently, version 1 mosaics were used for years prior to 2013 despite their lower spatial resolution (240 m versus 120 m).
For 2023 and 2024, image pair velocities were used as annual mosaics were not yet available for those years. The velocity products were filtered using a minimum coverage of 80%, referring to the percentage of possible glacier pixels that have reported velocities, and a time separation of >90 days to <180 days for 2023 and >60 days to <180 days for 2024, yielding 49 and 35 results, respectively. A wider time separation was used for 2024 to account for the lower number of available image pair velocities compared to 2023. Four image pair velocity rasters had sufficient coverage and reasonably low noise for each year based on visual inspection, with images ranging from beginning of March to beginning of July, most of them being in either March or June, and an average time separation between image pairs of 88 days (∼3 months). These were combined into one velocity raster per year by computing the mean per cell value of all four rasters for each year. Subsequently, the velocities were smoothed by calculating the median value within a 3 × 3 kernel for each input cell, reducing remaining noise.
To quantify how our method used for 2023 and 2024 compares to the annual ITS_LIVE mosaics, seven suitable image pairs were selected for 2022 using the same search parameters and the resulting mean and smoothed velocity raster was compared to the ITS_LIVE mosaic for 2022. Our centreline velocities were lower by a median of ∼4 m a−1 (∼3%) compared to the ITS_LIVE mosaic. However, the difference was greatest at lower elevations, with a median value of ∼35 m a−1 (∼12%) in the first 10 km and ∼53 m a−1 (∼19%) within 1 km from the terminus. The image pair velocities in our mosaics were derived from imagery acquired between late winter and early summer and therefore do not capture peak summer velocities, potentially explaining the slight discrepancy between our results and the 2022 ITS_LIVE mosaic.
Over Southeast glaciers, error estimates are generally low, with median annual values ranging from <1 to ∼9 m a−1 for 1985–2022 (<1 m a−1 for 2013–22). However, standard deviations for certain years, particularly earlier ones, are relatively high, reaching ∼133 m a−1 in 1987. Additionally, mean annual values occasionally exceed twice the median, indicating the presence of large outliers in the velocity data. For the 2023 and 2024 mosaics, which were generated using four image-pair velocity rasters each, median error estimates were substantially higher (20 and 39.25 m a−1, respectively), although standard deviations remained low, at ∼1 m a−1. We compared these ITS_LIVE error estimates with median velocities measured over stable ground surrounding Southeast glaciers in the annual ITS_LIVE mosaics, which typically yielded uncertainties about 1.5 times higher. Nonetheless, uncertainty values remained low overall, ranging from 1.3 to 11.8 m a−1, with standard deviations of 1.2–19.1 m a−1.
The velocity analysis was focused on a recent acceleration of Southeast-2 Glacier, along a flow-parallel centreline. We extracted velocity values every 200 m along the centreline from the 2024 terminus position to 40 km upstream and also analysed general trends over the entire velocity record since 1972. To account for partial velocity coverage from early Landsat imagery derived with GIV and to analyse general trends in velocity variability throughout the available record, summary statistics of velocities were quantified for different sections of the main trunk of Southeast glaciers (Southeast-1 terminus region, Southeast-2 terminus region, Southeast-1 upper main trunk, and Southeast-2 upper main trunk; Fig. 1c).
To examine velocity variability at a high temporal resolution, such as to quantify seasonal changes, the ‘ITS-LIVE widget’ tool (https://itslive-dashboard.labs.nsidc.org/) was used to extract velocities from all available image pair velocity products at a point near the front of Southeast-2 Glacier (74.9910°N, 80.4192°W) and Southeast-1 Glacier (74.9692°N, 80.3513°W) (Fig. 1c). Image pair velocities with a time separation of 21–365 days were used for this analysis, as using a time separation of <21 days resulted in increasingly noisy and spurious results. Obvious outliers were manually filtered out.
3.3. Glacier geometry evolution
Glacier elevation change mapping was performed from the differencing of multiple digital elevation models (DEMs) to understand how the surface geometry of Southeast glaciers evolved since the early 2000s. From 2000 to 2019, these changes were analysed using open source pre-derived surface elevation change products from Hugonnet and others (Reference Hugonnet2021) with a spatial resolution of 100 m. We downloaded the elevation change data and associated uncertainty values from the Theia data portal (https://doi.org/10.6096/13) and mosaicked them in ArcGIS Pro for the periods 2000–04, 2000–09, 2005–09, 2010–14, 2010–19, and 2015–19.
A combination of ASTER stereo satellite images and ArcticDEM strips were utilised to quantify surface elevation changes for 2020–23. ASTER DEMs were generated using the MicMac ASTER (MMASTER) software package (Girod and others, Reference Girod, Nuth, Kääb, McNabb and Galland2017) from raw L1A ASTER products downloaded from NASA’s Earthdata Search portal (https://search.earthdata.nasa.gov). These DEMs have a horizontal resolution of 30 m or less and a vertical uncertainty of 10 m (Girod and others, Reference Girod, Nuth, Kääb, McNabb and Galland2017). ArcticDEM StripMap products, with a spatial resolution of 2 m and vertical uncertainties of ∼3 m, were resampled to 30 m to match the resolution of the ASTER DEMs. A DEM co-registration script from the pybob Python package (https://github.com/iamdonovan/pybob), based on the Nuth and Kääb (Reference Nuth and Kääb2011) algorithm, was used to iteratively co-register all DEMs to a high-quality 2013 ArcticDEM mosaic of the study area, correcting shifts and sensor-specific biases. We used the RGI 7.0 outlines as a glacier mask for this co-registration to exclude ice-covered pixels and focus only on stable terrain (RGI Consortium, 2023).
All DEMs were filtered by excluding pixels with an elevation difference of >75 m from the 2013 ArcticDEM reference dataset, chosen based on visual inspection of differences between the 2013 and 2023 DEMs, and selected to be large enough to account for substantial elevation changes in the terminus region. Difference maps between each co-registered DEM and the reference DEM were then individually assessed, applying thresholds that maximised artefact removal while preserving actual glacier elevation change. The threshold values were typically much lower in the accumulation area than the terminus region of Southeast glaciers due to most large elevation changes occurring within a few kilometres from the ice front. Due to the higher accuracy and generally significantly less noisy elevation products from the ArcticDEM strips, the ASTER DEMs were predominantly used to fill gaps in the coverage of the ArcticDEM strips. To avoid compounding uncertainties from overlapping DEMs acquired within short time intervals, overlaps between DEMs from the same year were minimised while maintaining maximum coverage of the Southeast basin.
Surface elevation change trends for 2020–23 were then computed with the make_stack.py Python script from the pygeotools Python package (https://github.com/dshean/pygeotools). The resulting trend raster was used to display yearly elevation changes over the 4-year period. Median elevation changes across both glaciers were calculated within 25 m elevation bands ranging from 0 to 975 m a.s.l., delineated using elevation contours derived from the 2013 ArcticDEM mosaic, providing sufficient spatial resolution to capture variability in elevation change and allowing for a greater number of measurements along the glacier profile than coarser intervals would. To estimate uncertainties in glacier elevation change, we analysed absolute elevation changes on non-glacierised terrain adjacent to the margins of the Southeast basin, yielding a median value of 0.54 m a−1 and a standard deviation of 0.78 m a−1 for 2020–23. In comparison, we computed median uncertainties of ∼0.1 m a−1 and standard deviations of ∼0.1–0.15 m a−1 for the Hugonnet and others (Reference Hugonnet2021) rasters.
ICESat-2 altimetry measurements obtained from OpenAltimetry (https://openaltimetry.earthdatacloud.nasa.gov/data/) were utilised to independently evaluate the 2020–23 elevation trends that we extracted from the ASTER DEMs and ArcticDEM strips. Specifically, we used nearly 25,000 data points from the ATL06 (ATLAS/ICESat-2 L3A Land Ice Height) data set, providing geolocated land-ice surface heights, for 2022 and 2023. The 2022–23 ICESat-2 data were differenced from a 2020 ArcticDEM mosaic, using the same DEMs used to compute elevation trends, and the elevation change estimates were standardised to annual values (m a−1). A median absolute difference of 0.56 m a−1 was computed between the 2022–23 ICESat-2 measurements and the 2020 ArcticDEM mosaic over stable ground near the terminus region of Southeast glaciers, based on approximately 600 observations.
3.4. Glacier surface characteristics and SAR backscatter analysis
To quantify the increase in crevassing and surface roughness typically associated with a surge (Leclercq and others, Reference Leclercq, Kääb and Altena2021; Kääb and others, Reference Kääb, Bazilova, Leclercq, Mannerfelt and Strozzi2023; Guillet and others, Reference Guillet, Benn, King, Shean, Mannerfelt and Hugonnet2025), we used the methods and Google Earth Engine script from Leclercq and others (Reference Leclercq, Kääb and Altena2021; https://doi.org/10.5281/zenodo.5285712) to analyse all available Sentinel-1 synthetic aperture radar (SAR) data acquired in Interferometric Wide (IW) swath mode from 2017 to 2024 over Southeast glaciers. Radar image stacks of maximum backscatter were generated for each winter season (January–March), and changes were assessed by comparing backscatter, in decibels (dB), between consecutive winters. Aggregated images were created to represent the maximum backscatter value at each pixel location across both winter periods being compared. Subsequently, the normalised difference index (NDI) between the two aggregated images, as well as the minimum and maximum NDI over both winter periods, were computed (Leclercq and others, Reference Leclercq, Kääb and Altena2021; Kääb and others, Reference Kääb, Bazilova, Leclercq, Mannerfelt and Strozzi2023). In each grey-scaled NDI image, increased crevassing appears bright, decreased crevassing dark, and moderate change appears grey.
In the Canadian Arctic some glaciers have been observed to surge slowly over periods of up to decades (e.g. Medrzycka and others, Reference Medrzycka, Copland, Van Wychen and Burgess2019; Van Wychen and others, Reference Van Wychen, Hallé, Copland and Gray2022; Lauzon and others, Reference Lauzon, Copland, Van Wychen, Kochtitzky and McNabb2023b), making the application of this method problematic when there are negligible variations in the backscatter signal between adjacent years. Therefore, to better discern any temporal changes in backscatter of Southeast glaciers, NDI was also computed between the 2017 and 2024 winter seasons. Additionally, median annual backscatter values (dB) were plotted per 50 m elevation band for 2017–24 for both Southeast-1 and Southeast-2 glaciers to assess subtle changes in backscatter over time, and to pinpoint which regions of the glaciers are experiencing the most change.
To complement the backscatter analysis, strain rates were calculated annually from 2013 to 2023 by forward differencing of surface velocities sampled at 1 km intervals along the centreline of Southeast-2 Glacier, following established methods (e.g. Murray and others, Reference Murray, Strozzi, Luckman, Jiskoot and Christakos2003; Alley and others, Reference Alley, Scambos, Andersonm, Rajaram, Pope and Haran2018; Van Wychen and others, Reference Van Wychen, Jiskoot, Shannon and Gorwill2025). The year 2024 was excluded from the analysis due to higher velocity uncertainties. This allows us to distinguish between regions of extension (negative values), where crevassing is expected, and regions of compression (positive values).
Optical satellite imagery from Landsat 1–9, SPOT 4 and 5, ASTER, and PlanetScope (Appendix, Table A1) was used to visually inspect the surface of Southeast glaciers for every year between 1972 and 2024. Changes in glacier surface characteristics were identified and analysed, focusing on surface crevassing and variations in supraglacial hydrology, particularly the presence of supraglacial streams. To identify regions where surface conditions changed most significantly, glacier surface texture from 2016 to 2024 was analysed using high-resolution (3 m) PlanetScope imagery acquired through Planet’s Education and Research Program (https://www.planet.com/industries/education-and-research/). The HaralickTextureExtraction tool from the Orfeo Toolbox in QGIS was utilised to generate annual entropy rasters, which quantify glacier surface complexity by measuring the randomness or disorder in the data (Haralick and others, Reference Haralick, Shanmugam and Dinstein1973). Higher entropy values correspond to rougher, more complex surfaces, such as where crevasses or supraglacial channels are present. Rasters from 2019 to 2024, capturing the majority of the ongoing acceleration of Southeast-2 Glacier, were aligned and masked to the same extent using RGI 7.0 (RGI Consortium, 2023). An Ordinary Least Squares (OLS) regression was performed at each pixel across the time series to calculate the rate of change in entropy, producing a slope raster. The slope values were normalised and divided into discrete classes to highlight spatial patterns of changing surface roughness, including the development of crevasses and changes in supraglacial channels.
To quantitatively assess the relationship between entropy and surface crevassing, crevasses were manually counted within ten 500 × 500 m boxes using high-resolution PlanetScope imagery for 2016 and 2023 in the lower region of Southeast-2 Glacier, chosen to capture regions of low, moderate, and high crevassing. Median entropy values were subsequently computed within each box for both years. A linear regression between crevasse count and entropy indicates that regions with more extensive crevassing typically also have higher entropy values (R 2 ≈ 0.6; Fig. 2a). The spatial distribution of the sampled boxes and the corresponding entropy values for 2016 and 2023 is shown in Fig. 2b–c. Some of the observed variability observed in entropy values might be linked to differences in image brightness and contrast between scenes, as well as the fact that entropy captures broader surface texture changes, such as supraglacial hydrology, in addition to crevassing.
(a) Relationship between manually counted crevasses and median surface entropy within ten 500 × 500 m boxes in the lower region of Southeast-2 Glacier for 2016 and 2023. The solid line shows a linear regression fitted to these data (R 2 ≈ 0.6), with the grey bands representing the 95% confidence interval. (b–c) Locations of the sampled boxes overlaid on PlanetScope imagery for 2016 and 2023, coloured according to median entropy. Higher entropy values generally correspond to regions with greater crevasse density.

4. Results
4.1. Changes in terminus position
The combined Southeast glaciers terminus has undergone two distinct periods of retreat and two distinct periods of advance between 1959 and 2024. From the 1959 air photo to the beginning of Landsat 1 imagery in 1972, Southeast glaciers terminus retreated by a median of ∼ 900 ± 52.5 m (Figs. 3a and 4). The next few years (1972–75) were marked by a relatively stable terminus position, with median changes within uncertainty estimates. However, the Southeast-2 side of the terminus started advancing during those years, increasing by >400 ± 96.2 m in some parts, while the Southeast-1 side of the terminus slightly retreated overall, by up to ∼140 ± 96.25 m. The terminus advance rate began increasing in 1975–76, but the entirety of the Southeast-1 glacier front did not start advancing until 1977 (Figs. 3a and 4). The southernmost ∼1 km remained stagnant until 1978, followed by a drastic acceleration of the Southeast-1 side of the terminus in 1978–79, reaching a maximum advance rate of 2936.1 ± 84.5 m a−1 in 1978–79 and a terminus-wide median advance rate of 1252 ± 84.5 m a−1 (Figs. 3b and 4). Approximately 3 km2 of ice broke off from the Southeast-1 side between 28 July and 3 September 1979, resulting in a significant short-term retreat. Nonetheless, the overall terminus advance continued until approximately 1982 for the Southeast-2 portion and 1984 for the Southeast-1 portion. However, parts of the Southeast-2 terminus re-advanced slightly between 1984 and 1986 by up to ∼100–200 m a−1, while the median position of the entire terminus remained slightly negative due to the retreat of the Southeast-1 side. From 1972 to 1984, the terminus advanced by a median of 2129 ± 87.6 m and a maximum of nearly 5000 m on the Southeast-1 side (Figs. 3b and 4), with most of this advance occurring between 1976 and 1984 at a median rate of 267 ± 88.8 m a−1.
Terminus positions of Southeast glaciers during (a) 1959–72, (b) 1973–85, and (c) 1986–2024. Colours range from dark blue for the earliest years in each period to orange for the latest; panel (c) also includes a pink-to-purple palette to highlight changes during the most recent years (2021–24). Base images: (a) RCAF historical air photo, 17 July 1959; (b) Landsat 5, 25 July 1985; (c) Landsat 8, 9 July 2024. The white line indicates the boundary between Southeast-1 and Southeast-2 glaciers.

Median annual and cumulative changes in terminus position and maximum terminus velocity of the combined Southeast glaciers from 1959 to 2024. Maximum terminus velocity is taken as either the highest velocity measured with feature tracking within the combined terminus region of Southeast glaciers (Figure 1c) or the maximum observed terminus advance. Green bars show median annual changes in terminus position (right-hand axis), computed using the Glacier Termini Change Tracking (GTT) toolbox (Urbanski, Reference Urbanski2018); the blue line represents cumulative median terminus change since 1972, and the yellow line shows maximum terminus velocity (left-hand axis). The timing of the 1970s–80s surge, the subsequent quiescent period, and the post-2020 advance is annotated in the plot.

After 1984, the terminus retreated over the following ∼35 years (Fig. 3c). However, the first few years of quiescence were marked by small oscillations in terminus position, with slight readvances of the Southeast-2 portion reaching ∼100–200 m a−1 in 1984–86 and 1988–89, interrupted by a median retreat of ∼170 ± 42 m a−1 and a maximum of ∼1000 ± 42 m a−1 on the Southeast-1 side in 1987–88. Annual retreat rates otherwise remained relatively stable, with a median of ∼50 ± 1.5 m a−1, resulting in a total terminus-wide retreat of ∼4.6 ± 0.053 km from 1984 to 2020 and up to ∼5.7 ± 0.053 km on the Southeast-1 side (Fig. 3, 4).
Starting in the 2020s another period of advance started, with the terminus advancing by up to ∼400 ± 21.2 m on the Southeast-2 side, although it retreated by up to ∼300 ± 21.2 m on the Southeast-1 side (Fig. 3c). This contrast between retreat of 31.3 ± 5.3 m a−1 for the southern (Southeast-1) part of the terminus and advance of 38.5 ± 5.3 m a−1 for the rest (Southeast-2) from 2020 to 2024 closely resembles the behaviour of these glaciers from 1972 to 1975.
4.2. Glacier surface velocities
Velocities within the terminus region of Southeast glaciers during the 1970s–80s reached the maximum observed during the study period, closely aligning with trends in median terminus advance rates (Fig. 4). Maximum terminus velocities across the combined terminus region of the Southeast glaciers (both terminus polygons in Fig. 1c) gradually increased between 1972 and 1974 (approximately 235 m a−1 to approximately 340 m a−1), reached approximately 750 m a-1 in 1975–76, and peaked during 1977–79, with an estimated >3000 m a−1 in 1978–79 (Fig. 4). This peak surge velocity is inferred from the maximum measured terminus advance rate of 2936.1 ± 84.5 m a−1 and should therefore be considered a lower-bound estimate, given uncertainties in the relationship between terminus position change and ice flow velocity at calving, marine-terminating glaciers (O’Neel and others, Reference O’Neel, Pfeffer, Krimmel and Meier2005). Spatial variability in these velocities could not be analysed in detail due to limited coverage and the relatively low quality of Landsat 1–5 MSS data, but terminus advance rates and manual tracking suggest that flow rates in the shared terminus region were generally higher than in the shared upper trunk region. Velocity progression in the upper trunk followed the same pattern as within the terminus region, reaching maximum values of approximately 630 m a−1 in 1978–79. Maximum terminus velocities subsequently dropped to approximately 340 m a−1 by 1983–84 (Fig. 4), matching flow rates prior to the acceleration from approximately 1975–76 to 1982–83.
In 1990, velocities dropped to less than 100 m a−1 across the main trunk (median of 72 m a−1 in the upper trunk) and below 50 m a−1 within the terminus region (median of approximately 26 m a−1; Fig. 5). At higher elevations, velocities remained relatively high (approximately 150 m a−1 at 20–30 km from the terminus in 1990) and continued decreasing until the 2000s (Fig. 5b). The three decades following the surge (∼1985–2013) were characterised by maximum terminus velocities of approximately 50–150 m a−1, while median velocities across the shared trunk generally remained below 30 m a−1, often below 10 m a−1. Southeast-2 Glacier maintained higher median velocities than Southeast-1 at both the terminus (∼10–20 m a−1 versus <10 m a−1) and in the upper trunk (∼30–45 m a−1 versus <20 m a−1) (Fig. 5a). Velocities in the upper portions of both glaciers (greater than 20 km from the terminus) remained higher than at the terminus, although maximum values declined by approximately half for Southeast-2 (215 m a−1 in 1985 to ∼115 m a−1 in 2013; Fig. 5b) and by over half for Southeast-1 (∼190 to ∼ 70 m a−1).
(a) Evolution of the median velocity in the terminus region (orange) and upper trunk (blue) of Southeast-1 Glacier (dashed lines) and Southeast-2 Glacier (solid lines) from 1985 to 2025, showing slowdown following the 1970s–80s surge and recent acceleration towards another surge. See Figure 1c for the region delineations used to compute median velocity. (b) Centreline velocity along Southeast-2 Glacier at 5-year intervals from 1985 to 2020, illustrating post-surge slowdown and pre-surge acceleration, and contextualising observations of decreasing velocities at higher elevations and increasing velocities at lower elevations from ∼1995–2015 (Burgess and others, Reference Burgess, Sharp, Mair, Dowdeswell and Benham2005; Van Wychen and others, Reference Van Wychen, Copland, Gray, Burgess, Danielson and Sharp2012, Reference Van Wychen2017).

This period of relative stability was perturbed by a multi-annual acceleration beginning in the mid-2000s, most notably since 2013, with median terminus velocities of Southeast-2 Glacier increasing from 22.9 m a−1 in 2013 to 268.8 m a−1 in 2024 (Figs. 6a and 7). In contrast, terminus velocities of Southeast-1 Glacier remained comparatively low, increasing from a median of 9.6 to 55.25 m a−1 over the same period (Fig. 6b). These contrasting dynamics correspond with the post-2020 advance of Southeast-2 and the continued retreat of Southeast-1 (Fig. 3c). In the upper trunk, Southeast-2 Glacier accelerated from a median of 37.2 m a−1 in 2013 to 154.3 m a−1 in 2024 (Fig. 6a), whereas Southeast-1 Glacier showed no acceleration until 2022 and maintained a relatively low median velocity of 50.8 m a−1 in 2024 (Fig. 6b). The 2023 and 2024 velocities, derived from March to early July image pairs, likely underestimate velocities for those years as they likely do not capture summer peak values (Figs. 6a and 7).
Centreline surface velocity profiles of (a) Southeast-2 Glacier and (b) Southeast-1 Glacier for 2013–24, with velocities sampled every 200 m along each glacier’s centreline (see Figure 1c). All velocities were extracted from version 2 of the ITS_LIVE dataset (Gardner and others, Reference Gardner, Fahnestock and Scambos2022): 2013–22 values are from the annual mosaic products, while 2023–24 velocities represent the per-cell median of four image-pair velocity products acquired between March and early July of each year, with an average time separation of ∼3 months.

Centreline ice velocities of Southeast-2 Glacier from 2013 to 2024 derived from the ITS_LIVE v2 dataset (as in Figure 6). Velocities are shown as a function of distance from the terminus, with colours transitioning from blue (low) to red (high). Black markers indicate the upstream limit of fast flow (≥120 m a−1) within the glacier trunk (lower ∼20 km), illustrating the up-glacier propagation of acceleration through time.

The acceleration of Southeast-2 Glacier provides strong evidence for an up-glacier propagating dynamic event, initiating at the terminus in the mid-2000s and starting to affect the upper trunk (∼6.6–17.4 km from the terminus) by 2018. The upstream limit of fast flow (≥120 m a−1) propagated up-glacier at an average rate of 2.43 km a−1 between 2016 and 2024 (Fig. 7). We chose 120 m a−1 as a threshold because it is roughly an order of magnitude above the median quiescent terminus velocity of Southeast-2 Glacier (∼12 m a−1) from 1992 to 2005. Between 2013 and 2024, speedup in the terminus region (<6.6 km from the 2024 terminus) was nearly three times greater than in the upper main trunk, with peak velocities approximately 1.5 times higher (Fig. 6a). By 2024, velocities exceeding 100 m a−1 extended up to 40 km from the terminus.
Large seasonal velocity variations at the terminus of Southeast-2 Glacier have occurred throughout the recent acceleration, marked by winter minima and pronounced summer peaks (Fig. 8a). Velocities typically decline through fall and winter, rise in early June, and peak in July or August before decreasing again (inset in Fig. 8a). The magnitude of summer peaks has grown substantially over time, most notably between 2022 and 2024, with a higher year-round baseline velocity in recent years. A linear trend line reveals a significant long-term increase in Southeast-2 terminus velocities, with a significant R 2 value of 0.63. Southeast-1 Glacier shows similar seasonal patterns, with marked summer peaks and winter troughs, but no discernible long-term increase over 2013–24 (Fig. 8b). While peak summer velocities have generally increased recently, no compounding acceleration is observed between years, resulting in a non-significant R 2 of 0.04 for the linear trend line fitted to the Southeast-1 velocity data.
Seasonal variability and long-term trends in surface velocities from 2013 to 2024 for (a) Southeast-2 Glacier (74.9910°N, 80.4192°W; Figure 1c) and (b) Southeast-1 Glacier (74.9692°N, 80.3513°W; Figure 1c), derived from ITS_LIVE v2 image-pair products (Gardner and others, Reference Gardner, Fahnestock and Scambos2022) with time separations of 21–365 days. Each data point represents the velocity at the midpoint between the two images used to derive the velocity. A linear dotted trend line (least squares regression with R 2 value) illustrates long-term changes, and a solid Orange LOESS curve (span = 0.02) captures short-term fluctuations, highlighting seasonal peaks and troughs. The inset in (a) provides a detailed view of 2023, highlighting seasonal changes in velocities for Southeast-2 Glacier at higher temporal resolution.

4.3. Elevation changes
Glacier surface elevation changes for 2000–19 from the Hugonnet and others (Reference Hugonnet2021) dataset are characterized by significant thinning within the terminus region alongside a mix of thinning and thickening in the upper main trunk, and predominant thickening at higher elevations of both Southeast-1 and Southeast-2 glaciers (Fig. 9a–c). A narrow zone of thickening from the junction of Southeast-1 and Southeast-2 up to ∼6 km from the 2024 terminus position indicates a shear margin between the glaciers, which is also visible in satellite imagery. Thinning has been most pronounced near the centre of the combined terminus region, especially near the margin of the two glaciers, reaching peak rates of ∼5–7 m a−1, while the remainder of the terminus region has thinned at typical rates of ∼0.5–3 m a−1. The upper main trunk, extending up to approximately 350–400 m a.s.l., saw elevation changes generally within the range of −1.5 to 1.5 m a−1 in 2000–19, with more thinning on the Southeast-1 side and more thickening on the Southeast-2 side. Above 400 m a.s.l., elevation changes rates for both glaciers over this period varied around −1 to 2 m a−1.
Trends in surface elevation over the Southeast basin for (a) 2005–09, (b) 2010–14, (c) 2015–19, and (d) 2020–23. Data for (a)–(c) are from Hugonnet and others (Reference Hugonnet2021), while trends for 2020–23 were derived from ASTER DEMs processed with MicMac ASTER (Girod and others, Reference Girod, Nuth, Kääb, McNabb and Galland2017) and ArcticDEM StripMap products. Inset map in (d) shows 2022–23 ICESat-2 altimetry measurements differenced from a 2020 ArcticDEM mosaic, with elevation change estimates standardized to annual values (m a−1), used to validate the elevation change patterns at Southeast-2 Glacier. The white line indicates the boundary between Southeast-1 and Southeast-2 glaciers.

Southeast-2 Glacier experienced considerable surface geometry change during 2020–23, whereas Southeast-1 Glacier maintained similar patterns of elevation change to those observed during 2000–19 (Fig. 9d). For Southeast-2, the lowermost ∼7.5 km (below ∼250 m a.s.l.) has generally thickened during 2020–23 in distinct patches across the terminus region, coinciding with where the glacier has experienced the greatest acceleration. Much of this thickening exceeds 2 m a−1 and reaches more than 5 m a−1 in some regions. Elevation differencing between 2022 and 23 ICESat-2 data and a 2020 ArcticDEM strip shows these same patterns (see inset map in Fig. 9d). Substantial thickening was also measured at the ice front of Southeast-2, capturing its advance during the 2020–23 period and contrasting with marked thinning of the Southeast-1 side of the terminus as it continues retreating.
To directly compare elevation changes between 2000–19 and 2020–23, we computed the median elevation change in 25 m elevation bands across Southeast-1 and Southeast-2 glaciers (Fig. 10). Elevation changes up to ∼150 m a.s.l. for Southeast-2 Glacier show opposite patterns between the two periods, with the 50–75 m a.s.l. elevation band experiencing the most pronounced decrease in elevation in 2000–19 (−2.7 m a−1) and the largest increase in elevation in 2020–23 (0.5 m a−1; Fig. 10a). The upper trunk area of Southeast-2 (<400 m a.s.l.) experienced significantly more surface lowering in the latter period, potentially driven by glacier dynamics, as the ongoing acceleration is beginning to transfer mass down-glacier and thus dynamically thin this region. Elevation changes become positive again around 400 m a.s.l. and then largely flatten out above 450 m a.s.l., while the 2000–19 period experienced ∼0.5 m a−1 of surface elevation gain at those elevations.
Median surface elevation changes (m a−1) within 25 m elevation bands up to 975 m a.s.l. for (a) Southeast-2 Glacier, and (b) Southeast-1 Glacier. The blue line represents changes from 2000 to 2019, derived from Hugonnet and others (Reference Hugonnet2021), while the red line represents 2020–23 changes, calculated from MicMac-processed ASTER DEMs and ArcticDEM StripMap products Error bars represent the median uncertainty estimated over bedrock: 0.08 m a−1 for 2000–19 and 0.54 m a−1 for 2020–23.

Surface elevation changes on Southeast-1 Glacier remained mostly unchanged between the two periods (Fig. 10b), with surface lowering greatest near the terminus (<75 m a.s.l) at a median value of approximately 2 m a−1 and gradually diminishing up-glacier along the main trunk. Surface elevation change transitioned to being positive at about 300 m a.sl. in 2000–19 and ∼350 m a.s.l. in 2020–23, implying a dynamic balance line at ∼15–20 km from the 2024 terminus position. Contrary to Southeast-2 Glacier, the reservoir zone of Southeast-1 continued accumulating mass in 2020–23 up to <950 m a.s.l. at median rates of ∼0.6 m a−1.
4.4. Glacier surface characteristics and backscatter changes
The 1959 aerial imagery shows a crevasse field concentrated within approximately 3 km of the terminus as well as several supraglacial streams in the terminus region, indicating stable flow conditions. Despite the coarse resolution of Landsat 1–4 images, some surface features are discernible: in 1972–76, Southeast-1 Glacier had a highly developed supraglacial stream network, while streams on Southeast-2 Glacier were not detected. This absence suggests that the streams visible near the terminus of Southeast-2 in the 1959 image were no longer present by the 1970s. Supraglacial streams were particularly prominent on Southeast-1 image from 30 August 1976 when the Southeast-2 side showed heavy crevassing (Fig. 11a), but by 1977 streams on the lower 7–9 km of Southeast-1 were no longer visible. Extensive surface water pooling across the Southeast basin, especially at higher elevations and for Southeast-2 Glacier, was found for many years before, during, and after the 1970s–80s speedup. Imagery from the 1970s and 1980s show a larger presence of icebergs in Hyde Inlet compared to the rest of the study period and the occasional presence of ice mélange near the terminus, which has not been observed since.
Evolution of glacier surface characteristics of the Southeast glaciers: (a) 30 August 1976 heavily crevassed surface in the terminus region of Southeast-2, while clearly distinguishable supraglacial streams remain across much of Southeast-1; (b) 25 July 1985 surface with extensive crevassing across the entire trunk of the Southeast glaciers and an absence of supraglacial streams; (c) 7 September 1994 well-developed stream network appears on Southeast-1 and in the upper trunk of Southeast-2; (d) 19 September 1999 supraglacial streams had spread into the terminus region of Southeast-2; (e) 16 August 2009 streams eventually reach the ice front; (f) 9 July 2024 surface undulations on Southeast-2, including several bumps also visible in earlier images (e.g. in [d]); (g) 21 July 2024 image reveals extensive crevassing in the terminus region of Southeast-2, caused by ongoing acceleration, while Southeast-1 maintains an extensive stream network; (h) surface entropy changes from 2019 to 2024, with lower entropy indicating surface smoothing and higher values indicating increased surface roughness. The black line delineates the boundary between Southeast-1 and Southeast-2 glaciers.

A Landsat 5 image from 25 July 1985 shows a heavily crevassed surface across the entire main trunk (Fig. 11b). From 1985 to 1991, a significant amount of crevassing disappeared from the Southeast-1 Glacier portion of the terminus, and a supraglacial stream network started to be rebuilt, while Southeast-2 Glacier largely remained crevassed. By 1993, an increasingly developed network of supraglacial streams on Southeast-2 was evident, which is particularly noticeable in a 9 July 1994 image (Fig. 11c). Streams continued to migrate down-glacier as crevasses closed-up over time, and a 19 September 1999 image shows several streams within the terminus region of Southeast-2 Glacier (Fig. 11d). Despite the lower ∼2.5 km of the terminus maintaining a crevassed surface, some streams eventually reached the ice front, visible on the Southeast-2 side in a 16 August 2009 ASTER image (Fig. 11e).
Throughout the recent acceleration of Southeast-2 Glacier from 2013 to 2024, notable changes in the surface of the glacier were observed, while the surface of Southeast-1 Glacier did not significantly change. Backscatter over the period 2017–24 did not show any significant difference on an annual timescale, but a general increase in backscatter for Southeast-2 is noticeable when comparing NDI between the earliest and latest year of coverage. When plotting median backscatter (dB) values per 50 m elevation band up to 600 m a.s.l. (∼22.5 km from the 2024 terminus position for Southeast-2 and ∼ 35 km for Southeast-1; Fig. 1c), a trend of increasing backscatter values over time is evident for Southeast-2 Glacier (Fig. 12a), while Southeast-1 Glacier backscatter values did not show any noticeable change from 2017 to 2024 (Fig. 12b). Changes in backscatter values were greatest for Southeast-2 Glacier between 150 and 400 m a.s.l., where the median value increased by >1.5 dB.
Variations in maximum January–March Sentinel-1 backscatter, shown as the median dB value per 50 m elevation band from 2017 (light blue) to 2024 (dark blue), for (a) Southeast-2 Glacier and (b) Southeast-1 Glacier. Error bars represent the standard deviation. (c) Median annual centreline strain rates per 50 m elevation band from 2013 to 2023 for Southeast-2 Glacier. Positive values indicate compressive strain and negative values indicate extensional strain.

Regions of Southeast-2 Glacier where backscatter increased the most over 2017–24 generally coincide with locations where the glacier experienced the greatest change in surface characteristics. Increases likely resulted from heightened crevassing, having migrated up-glacier from the terminus concurrently with the up-glacier propagation of velocities. The opening of crevasses altered the supraglacial hydrology network across the trunk of Southeast-2 Glacier, particularly in the terminus region, by cutting off surface streams and rerouting meltwater into crevasses. This process intensified after 2017, coinciding with increasing surface velocities. Southeast-1 Glacier also exhibited an up-glacier migration of crevasses, with their upper extent shifting from approximately 2.5 km to 7.5 km from the terminus between 2017 and 2024. However, crevassing on Southeast-1 Glacier remained relatively limited, with crevasses less concentrated and generally narrower than those on Southeast-2 Glacier, typically under 5 m wide, compared to some exceeding 15 m on Southeast-2 Glacier. Significant water pooling on the glacier surface was recorded again in 2021, 2023, and 2024 (Fig. 11f). Pooling develops mostly in early summer and generally drains by mid to late July, rarely persisting for the remainder of the year. This is seen on both glaciers, although it is usually more extensive on Southeast-2, particularly at higher elevations.
From 2013 to 2017, extensional strain was mainly confined to the lowermost ∼150 m a.s.l. (∼5 km from the terminus), where velocities were highest and crevasses remained within ∼3 km of the terminus, and above ∼500 m a.s.l. (∼25 km from the terminus) (Fig. 12c). For 2018–23, the region of extension expanded up-glacier to ∼350 m a.s.l. (∼15 km from the terminus), reflecting the progression of up-glacier acceleration (Fig. 7). A zone of compressional strain at ∼400–550 m a.s.l. marks where faster-flowing ice from the mid-glacier (∼20–30 km from the terminus) converges with slower-moving ice in the upper trunk (∼6.6–17.4 km from the terminus). The region of Southeast-2 Glacier that experienced the greatest increase in extension (∼150–400 m a.s.l.; Fig. 12c) corresponds with the area showing the largest increase in backscatter (Fig. 12a).
Figure 11h displays entropy trends from 2019 to 2024, grouped into five classes. Areas of highest entropy closely correspond to the development of crevasses during the 2020s within the terminus region of Southeast-2 Glacier, with the greatest changes occurring within ∼9 km of the terminus. Some areas with decreasing entropy coincide with the disappearance of supraglacial streams between 2019 and 2024 (Fig. 11h). The surface morphology of Southeast glaciers is characterised by several bumps, particularly on the Southeast-2 side (e.g. Fig. 11d, f). These distinct features are especially prominent in 2023 and 2024 imagery, and their locations within the terminus region of Southeast-2 Glacier correspond relatively well with patterns of thickening and thinning observed from 2020 to 2023 (Fig. 9d), as well as with crevasse development in the same region (Fig. 11g, h).
5. Discussion
Southeast glaciers have previously been identified as surge-type, with evidence for surging presented in earlier studies, although interpretations were limited by data availability and temporal coverage (Burgess and others, Reference Burgess, Sharp, Mair, Dowdeswell and Benham2005; Burgess and Sharp, Reference Burgess and Sharp2008; Van Wychen and others, Reference Van Wychen, Copland, Gray, Burgess, Danielson and Sharp2012, Reference Van Wychen2017). Our results provide a more detailed and continuous reconstruction of the dynamics of these two glaciers since 1972, identifying two distinct flow instability events in the 1970s–80s and over the past decade, with an intervening quiescent period. We contextualize these findings and draw comparisons with other dynamic instabilities observed in the Canadian Arctic and elsewhere, thereby expanding current knowledge on glacier surging in the region and identifying potential controls on the recent and ongoing dynamic changes affecting Southeast-2 Glacier.
5.1. Surge characteristics of southeast glaciers
5.1.1. Observed sequence of events throughout an entire surge cycle of Southeast glaciers
The terminus change patterns of Southeast glaciers since 1959 are indicative of unstable flow behaviour (Figs. 3 and 4), confirming their previous identification as possible surge-type glaciers (Burgess and others, Reference Burgess, Sharp, Mair, Dowdeswell and Benham2005; Burgess and Sharp, Reference Burgess and Sharp2008). In addition, velocity variability since 1972 exhibits typical behaviour of recurrent surging activity, with velocity acceleration likely starting prior to 1972 and culminating in the active phase of a surge by 1976–77, followed by a period of quiescence of a few decades, before a renewed period of acceleration starting in the mid-2000s and continuing into the 2020s for Southeast-2 Glacier. This recent acceleration coincides with terminus advance of Southeast-2, significant changes in surface characteristics, and thickening within the terminus region accompanied by thinning in the upper trunk during 2020–23, suggesting the probable onset of down-glacier redistribution of mass towards the terminus region. The aforementioned observations throughout an entire surge cycle, from surge build-up to quiescence to surge build-up, allow us to synthesise this cycle into four stages and make inferences regarding the future dynamics of these glaciers (Fig. 13).
Conceptual sequence of dynamic instability throughout the observed surge cycle of Southeast-1 (SE-1) and Southeast-2 (SE-2) glaciers on Devon Ice Cap from 1959 to 2024.

(1) Surge build-up and initiation in the 1970s. Prior to surge initiation, the velocities of Southeast glaciers had increased above quiescent values since at least 1972, most notably for Southeast-2 Glacier, evidenced by the advance of that portion of the terminus and slight retreat of the Southeast-1 side between 1972 and 1975. The increase in the advance rate of the terminus and maximum terminus velocities in 1975–76 of nearly 750 m a−1 suggests that surging began then, although the southernmost ∼1.5 km of the Southeast-1 side of the terminus appears to have started advancing, and thus surging, about a year later. Heavy crevassing within the terminus region of Southeast-2 Glacier in 1976 and the lack of a supraglacial stream network, in contrast to Southeast-1 Glacier, (Fig. 11a) indicates that the dynamic instability likely started there, propagating up-glacier and subsequently spreading to Southeast-1 Glacier.
(2) Active phase from 1975–76 to 1983–84. The surge peaked rapidly, with maximum flow rates exceeding 3000 m a−1 in 1978–79, and sustained velocities above 1000 m a−1 from approximately 1977 to 1980 (Fig. 4). The terminus underwent its most rapid advance between 1977 and 1979, exceeding 3.5 km on the Southeast-1 side and 2 km on the Southeast-2 side. Nonetheless, the Southeast-1 side of the terminus underwent a temporary, localised retreat of >1.5 km in late summer 1979 after a large calving event, losing ∼3 km2 of its area in less than 2 months. The increase in dynamic discharge during and after the surge resulted in a heightened concentration of icebergs in Hyde Inlet in comparison to the rest of the study period and the occasional development of ice mélange, which has not been observed since. After this peak, both terminus velocities and advance rates declined to pre-surge levels over several years, with terminus advance of both glaciers ceasing by the early to mid-1980s, indicating that the surge terminated around 1983–84. Throughout the surge, the glacier surface over the main trunk was heavily crevassed and lacked any evident supraglacial streams (Fig. 11b). The total terminus advance during the surge was greatest on the Southeast-1 side, reaching nearly 5 km. Near the start of the surge, the northern edge of Southeast-2 Glacier came into contact with the terminus of an adjacent unnamed marine-terminating outlet glacier within the Southeast basin (upper right corner of Fig. 11b), likely imposing additional resisting stresses that limited its northern portion relative to the southern side (Fig. 3b). Backstress at tidewater termini is known to influence glacier velocities and advance rates by altering longitudinal stress gradients and, in turn, upstream flow (e.g. Benn and others, Reference Benn, Warren and Mottram2007). Therefore, this contact with the adjacent outlet glacier may have contributed to the asymmetric advance, allowing Southeast-1 to move further under extensional flow, while the northern section experienced increased compressive stress. Other factors, such as differences in bathymetry and flotation along the terminus, may have also played a key role, and the relative contributions of these mechanisms remain uncertain.
(3) Quiescent period from 1983–84 to 2020. Following the surge, most of the slowdown occurred within a few years across the main trunk, with velocities stabilising to quiescent levels by ∼1990, although elevated flow persisted in the upper reaches until the early 2000s. The initial years of quiescence were marked by oscillations in terminus position, with minor readvances of the Southeast-2 portion interrupted by rapid retreat on the Southeast-1 side, reaching maximum rates of ∼1000 m a−1 in 1987–88. Crevasses on Southeast-1 Glacier closed rapidly and an extensive supraglacial stream network was quickly re-established, whereas this process occurred more gradually on Southeast-2 Glacier (Fig. 11c). By 1999, a supraglacial drainage network had expanded down-glacier on Southeast-2 Glacier (Fig. 11d), reaching the terminus by 2009 (Fig. 11e). Median quiescent velocities generally remained below 20 m a−1 across the main trunk (Fig. 5a), but upper glacier sections maintained higher flow rates, particularly on Southeast-2 Glacier, where velocities frequently exceeded 100 m a−1. Over this period, the shared terminus of Southeast glaciers retreated a total of ∼4.6 km, reaching up to ∼5.7 km on the Southeast-1 side (Fig. 3c). Elevation change mapping from 2000 to 2019 shows mass gains in the reservoir zone and substantial mass losses in the receiving zone (Fig. 9), indicating a progressive build-up towards another surge.
(4) Beginning of a new dynamic instability from the mid-2000s to 2024. The quiescent phase has been interrupted over the past decade by Southeast-2 Glacier accelerating year over year, particularly since 2013, with velocities near the terminus undergoing stepwise increases following successive summer peaks (Fig. 8a). This acceleration, from a median baseline quiescent velocity within the terminus region of ∼12 m a−1 from 1992 to 2005, to ∼120 m a−1 in 2020, meets the commonly accepted definition of a surge, marking the end of the ∼36–37-year quiescent phase. However, the glacier has not yet undergone the sudden increase in velocities typical at surge onset of a marine-terminating glacier, as observed during the initiation of its previous surge in the 1970s, so we infer that the glacier is still in the build-up phase of an imminent surge. This speedup has spread up-glacier from the terminus, with the greatest magnitude within the lowermost 10 km of Southeast-2 Glacier, accompanied by up-glacier extension of crevasses, disruption of the supraglacial stream network, and increasing backscatter (Figs. 11h, 11g, 12a). Conversely, Southeast-1 Glacier maintained median terminus velocities of ≤10 m a−1 from 2013 to 2022, followed by a speed-up in 2023–2024 (Fig. 8b). Due to greater uncertainties in velocity measurements for those two years, it remains unclear whether the speedup of Southeast-2 has influenced Southeast-1. The ongoing acceleration of Southeast-2 Glacier has resulted in a ∼400 m advance from 2020 to 2024 on that side of the terminus, while the Southeast-1 side retreated by ∼300 m over the same period. Elevation changes for 2020–2023 indicate some thickening in the terminus region of Southeast-2 and dynamic thinning in the upper trunk, likely marking the onset of down-glacier mass redistribution from the reservoir to the receiving zone (Figs. 9 and 10). Elevation changes above 450 m a.s.l. for Southeast-2 were generally neutral (near 0 m a−1), potentially indicating a disruption in mass build-up in the reservoir zone as the glacier accelerates and begins drawing mass down to lower elevations.
Although velocities of Southeast-2 Glacier have increased by an order of magnitude since 2013, they remain substantially lower than during the previous surge (>3000 m a−1 in 1978–79 versus ∼400 m a−1 in 2024). This suggests that Southeast-2 is not yet fully surging but is undergoing velocity changes similar to 1972–76 prior to the last active phase, characterised by terminus velocities of a few hundred meters per year, an advancing Southeast-2 terminus at ∼40 m a−1, and a retreating Southeast-1 terminus at ∼30 m a−1 for 2020–2024. Observations from the previous surge indicate that the speedup of Southeast-2 is likely to extend to Southeast-1 once terminus velocities exceed 500 m a−1. Thus, the surge build-up appears to originate primarily on Southeast-2, while the shared trunk and terminus facilitate the spread of flow instability to Southeast-1. The shared trunk provides a pathway through which the instability can spread, either via transfer of longitudinal and lateral stresses through the ice mass or by altering basal hydrological and thermal conditions. The current acceleration of Southeast-2 does not appear to significantly affect Southeast-1, and the two glaciers are separated by a shear margin, visible both during and before this acceleration. The large stresses exerted on Southeast-1 when Southeast-2 begins surging might be sufficient for the instability to propagate across the entire trunk, but this likely only occurs if the subglacial drainage system allows pressurised basal water to reach Southeast-1. Benn and others (Reference Benn, Kristensen and Gulley2009) demonstrated that subglacial drainage geometry plays a key role in limiting the lateral propagation of surges in two confluent glaciers in Svalbard. They argue that a subglacial conduit beneath the medial moraine constrains surge propagation by evacuating pressurised water from one branch, preventing it from reaching the adjacent branch. If no such conduit exists between Southeast-1 and Southeast-2, pressurised water could eventually reach Southeast-1, rapidly increasing basal enthalpy and initiating basal sliding (Benn and others, Reference Benn, Fowler, Hewitt and Sevestre2019a). This underlines a unique dynamic relationship between two adjacent glaciers that share a common trunk and terminus. While Van Wychen and others (Reference Van Wychen, Jiskoot, Shannon and Gorwill2025) recently examined tributary-trunk interactions in the northern Canadian Arctic, this interaction between two surge-type glaciers that share a common trunk and terminus is unique in this region and warrants further investigation.
5.1.2. Comparisons with previous observations
Our results highlighting a speedup starting at the terminus of Southeast glaciers and propagation upstream differs from observations made in previous studies. InSAR velocity maps from ERS-1/-2 data (1996–2000) by Burgess and others (Reference Burgess, Sharp, Mair, Dowdeswell and Benham2005), along with speckle tracking of repeat RADARSAT-2 imagery from March 2009 by Van Wychen and others (Reference Van Wychen, Copland, Gray, Burgess, Danielson and Sharp2012) and elevation changes of Southeast glaciers by Burgess and Sharp (Reference Burgess and Sharp2008), were interpreted as showing a down-glacier propagation of faster flow. Ice flow velocities in the lower 20 km of Southeast-2 Glacier were reported to have increased by an average of 50 m a−1 between 1996–2000 and 2009 (a 500–750% increase), with the largest increases occurring at the terminus, followed by a further doubling to >100 m a−1 between 2009 and 2015 in the lowermost 2–5 km of the Southeast glaciers (Van Wychen and others, Reference Van Wychen, Copland, Gray, Burgess, Danielson and Sharp2012, Reference Van Wychen2017). Concurrently, the upper sections of Southeast glaciers were observed to have continuously decelerated up to at least 2015 (Van Wychen and others, Reference Van Wychen2017). Burgess and Sharp (Reference Burgess and Sharp2008) also described thinning along the upper 15 km of Southeast-1 Glacier and thickening at lower elevations (∼20 km from the terminus). Thinning was observed again near the terminus of both Southeast-1 and Southeast-2 glaciers (Burgess and Sharp, Reference Burgess and Sharp2008). Based on these spatial patterns in velocities and surface elevation changes, both Burgess and Sharp (Reference Burgess and Sharp2008) and Van Wychen and others (Reference Van Wychen, Copland, Gray, Burgess, Danielson and Sharp2012, Reference Van Wychen2017) interpreted these dynamics as likely representing the down-glacier propagation of a surge front.
The longer velocity record presented in this study provides context for previous observations and explains why the dynamics of Southeast glaciers may have been interpreted as depicting a down-glacier propagating surge. Our results from the ITS_LIVE record generally concur with patterns of slowdown in the upper sections of Southeast-2 Glacier and acceleration over the trunk, particularly in the terminus region, during the periods discussed in earlier studies (Fig. 5b). However, we argue that rather than a down-glacier propagating surge beginning in the 1990s–2000s, these velocity variations likely reflect both the continuing slowdown of the upper sections of Southeast glaciers after the 1970s–80s surge and the onset of acceleration in the trunk of Southeast-2 Glacier, which begins at, and propagates from, the terminus region (Fig. 5). This pattern of multi-year acceleration near the terminus prior to surge initiation, combined with decades-long slowdown in the upper sections following a surge, has been observed for other marine-terminating surge-type glaciers in the Canadian Arctic (Lauzon and others, Reference Lauzon, Copland, Van Wychen, Kochtitzky, McNabb and Dahl-Jensen2023a; Copland and others, Reference Copland, Hallé, Van Wychen, Lauzon, Dowdeswell and Davis2024). Most of the current speedup of Southeast-2 Glacier has occurred in the terminus region since 2013, when velocities began increasing consistently year over year and acceleration intensified. However, some acceleration is evident over the lowermost ∼10 km, and especially at the terminus, between 2005 and 2010, both in our results (Fig. 5a) and as noted by Van Wychen and others (Reference Van Wychen, Copland, Gray, Burgess, Danielson and Sharp2012, Reference Van Wychen2017), particularly in Fig. 3b of Van Wychen and others (Reference Van Wychen, Copland, Gray, Burgess, Danielson and Sharp2012). Velocities in March and April 1996, derived from SAR scenes by Burgess and others. (Reference Burgess, Sharp, Mair, Dowdeswell and Benham2005), were lower than those in the ITS_LIVE record, derived primarily from summer optical imagery. This suggests seasonal differences in glacier flow rates, likely driven by hydrology and summer speedups, as illustrated in Fig. 8.
The elevation change data used in this study show thickening in the same region of Southeast glaciers as observed by Burgess and Sharp (Reference Burgess and Sharp2008). However, unlike their inference of dynamic thinning along the upper ∼15 km of Southeast-1 Glacier, our temporally resolved elevation change record does not show sustained thinning in this region, apart from slight thinning beginning at ∼900 m a.s.l. (Fig. 10). Instead, elevation change trends from 2000 to 2023 indicate thickening at higher elevations and thinning at lower elevations, most notably near the terminus. We also observe evidence of dynamic thinning on Southeast-2 Glacier at ∼100–350 m a.s.l. and dynamic thickening within the terminus region during 2020–23, driven by ongoing acceleration of the glacier’s lower section (Figs. 8 and 9). This discrepancy likely reflects differences in temporal representation and methodology, as the thickness change patterns reported by Burgess and Sharp (Reference Burgess and Sharp2008) were inferred from flux divergence using velocities derived from ERS imagery using InSAR from the early to mid-1990s, whereas our estimates represent direct dh/dt measurements derived from satellite-based DEMs. In addition, the glacier velocities used by Burgess and Sharp (Reference Burgess and Sharp2008) likely reflect higher ice flow during that period (1990s; Fig. 5), potentially explaining continued dynamic thinning at higher elevations. Overall, our continuous velocity record extending back to 1972 and elevation change record since 2000 indicate that the current acceleration of Southeast-2 Glacier is propagating up-glacier from the terminus rather than down-glacier from its upper reaches.
5.2 Comparisons with surges of other marine-terminating glaciers in the Canadian Arctic
Glacier surges have been observed for multiple decades in the Canadian Arctic (Hattersley-Smith, Reference Hattersley-Smith1964, Reference Hattersley-Smith1969; Müller, Reference Müller1969) and discussed in several analyses of glacier characteristics and dynamics across this region (Copland and others, Reference Copland, Sharp and Dowdeswell2003; Short and Gray, Reference Short and Gray2005; Van Wychen, Reference Van Wychen2014, Reference Van Wychen2016, Reference Van Wychen2017, Reference Van Wychen, Burgess, Kochtitzky, Nikolic, Copland and Gray2021). Nevertheless, in contrast to other major surge clusters, such as those in Svalbard, Alaska, or High Mountain Asia, dynamic instabilities in the Canadian Arctic have been comparatively understudied, with detailed investigations only emerging in recent years (e.g. Medrzycka and others, Reference Medrzycka, Copland, Van Wychen and Burgess2019; Dalton and others, Reference Dalton, Van Wychen, Copland, Gray and Burgess2022; Van Wychen and others, Reference Van Wychen, Hallé, Copland and Gray2022; Lauzon and others, Reference Lauzon, Copland, Van Wychen, Kochtitzky, McNabb and Dahl-Jensen2023a, Reference Lauzon, Copland, Van Wychen, Kochtitzky and McNabb2023b; Copland and others, Reference Copland, Hallé, Van Wychen, Lauzon, Dowdeswell and Davis2024; Van Wychen and others, Reference Van Wychen, Jiskoot, Shannon and Gorwill2025). This recent research highlights the diverse ways dynamic instabilities can manifest, including ‘classical’ surges, ‘slow’ surges, sustained accelerations, and multi-decadal advances potentially linked to a delayed response to the Little Ice Age. Analyses indicate that surging in the Canadian Arctic varies greatly in both duration and intensity, with surge durations ranging from 15 to over 70 years and peak velocities differing by more than an order of magnitude (Medrzycka and others, Reference Medrzycka, Copland, Van Wychen and Burgess2019; Lauzon and others, Reference Lauzon, Copland, Van Wychen, Kochtitzky, McNabb and Dahl-Jensen2023a, Reference Lauzon, Copland, Van Wychen, Kochtitzky and McNabb2023b; Copland and others, Reference Copland, Hallé, Van Wychen, Lauzon, Dowdeswell and Davis2024). Recent methods of global surge detection have efficiently detected some surges in this region, with 11 surges detected during 2000–24 by Guillet and others (Reference Guillet, Benn, King, Shean, Mannerfelt and Hugonnet2025). However, these methods have failed to identify other dynamic instabilities, such as the slow, long-lasting instabilities of Airdrop and Split Lake Glaciers (Lauzon and others, Reference Lauzon, Copland, Van Wychen, Kochtitzky and McNabb2023b; Van Wychen and others, Reference Van Wychen, Hallé, Copland and Gray2022), and the multiyear accelerations of Belcher, Sydkap, Trinity, Wykeham, and Southeast-2 glaciers (Van Wychen and others, Reference Van Wychen, Burgess, Kochtitzky, Nikolic, Copland and Gray2021; Dalton and others, Reference Dalton, Van Wychen, Copland, Gray and Burgess2022).
A destabilisation of the glacier terminus followed by up-glacier propagation of fast flow has been inferred to characterise the initiation of surges in two other large, marine-terminating surge-type glaciers, Iceberg Glacier (Lauzon and others, Reference Lauzon, Copland, Van Wychen, Kochtitzky, McNabb and Dahl-Jensen2023a) and Mittie Glacier (Copland and others, Reference Copland, Hallé, Van Wychen, Lauzon, Dowdeswell and Davis2024). Both experienced a multiannual increase in terminus velocities prior to surge onset, with peak velocities of ∼2300 m a−1 for Iceberg Glacier in 1991 and ∼4800 m a−1 for Mittie Glacier in 1996 (Lauzon and others, Reference Lauzon, Copland, Van Wychen, Kochtitzky, McNabb and Dahl-Jensen2023a; Copland and others, Reference Copland, Hallé, Van Wychen, Lauzon, Dowdeswell and Davis2024). Conversely, surges of land-terminating glaciers more commonly propagate down-glacier, reach lower peak velocities, and exhibit longer durations (Van Wychen and others, Reference Van Wychen, Hallé, Copland and Gray2022, Reference Van Wychen, Jiskoot, Shannon and Gorwill2025).
The surges of Iceberg and Mittie glaciers lasted ∼22 and ∼15 years, respectively, while the 1970s–80s surge of Southeast glaciers persisted for only 8–9 years. This makes it closer in duration to glacier pulses in the Canadian Arctic (∼2–5 years; Van Wychen and others, Reference Van Wychen2016, Reference Van Wychen, Burgess, Kochtitzky, Nikolic, Copland and Gray2021), although the magnitude of this instability is significantly greater than any observed pulse event. Our continuous record allows determination of a quiescent phase of ∼36–37 years, from the end of the surge in 1983–84 to 2020, when median terminus velocities first attained an order of magnitude above baseline quiescent velocities (1992–2005). This is shorter than previous estimates for surge-type glaciers, generally thought to be 50 years or more, and for Chapman Glacier, a land-terminating glacier on northern Ellesmere Island, estimated at 100–140 years (Van Wychen and others, Reference Van Wychen, Jiskoot, Shannon and Gorwill2025). Our results provide the first direct observation in the Canadian Arctic of a full surge, a distinct quiescent period, and the build-up towards a second surge, illustrating the cyclic nature of these events. The active phase duration of Southeast glaciers falls within the typical range for surge-type glaciers in Svalbard (3–10 years; Dowdeswell and others, Reference Dowdeswell, Hamilton and Hagen1991), and the two regions share a similar climate, suggesting potential parallels in surge behaviour between Devon Ice Cap and Svalbard glaciers.
5.3 Controls on surge initiation
Most of the main trunk of the Southeast glaciers is inferred to be cold-based, with higher elevations predominantly warm-based (Burgess and others, Reference Burgess, Sharp, Mair, Dowdeswell and Benham2005; Burgess and Sharp, Reference Burgess and Sharp2008). A transition in basal thermal regime may contribute to the multiannual acceleration of Southeast-2 Glacier, but not in the conventional way described by thermal surge models (Clarke, Reference Clarke1976; Fowler and others, Reference Fowler, Murray and Ng2001; Murray and others, Reference Murray, Strozzi, Luckman, Jiskoot and Christakos2003). While thermal cycling explains some surges in Svalbard, it plays little role in others, particularly large tidewater glaciers such as Tunabreen (Sevestre and Benn, Reference Sevestre and Benn2015). Instead, tidewater dynamics or external forcing, including surface meltwater reaching the bed, have been proposed as key drivers of surges in several marine-terminating glaciers (Dunse and others, Reference Dunse, Schellenberger, Hagen, Kääb, Schuler and Reijmer2015; Sevestre and others, Reference Sevestre2018; Nuth and others, Reference Nuth2019). The enthalpy balance theory, which links mass and energy budgets to basal thermal and hydrological conditions while incorporating surface melt, provides a framework to explain a wide range of surge behaviour (Benn and others, Reference Benn, Jones, Luckman, Fürst, Hewitt and Sommer2019b, Reference Benn, Hewitt and Luckman2023). We suggest a similar process may underlie the acceleration of Southeast-2 Glacier.
Multiannual acceleration prior to surge initiation is typical of Svalbard surge-type glaciers and can span several years (Murray and others, Reference Murray, Strozzi, Luckman, Jiskoot and Christakos2003; Dunse and others, Reference Dunse, Schellenberger, Hagen, Kääb, Schuler and Reijmer2015; Sevestre and others, Reference Sevestre2018). Dunse and others (Reference Dunse, Schellenberger, Hagen, Kääb, Schuler and Reijmer2015) showed that Basin-3, Austfonna, accelerated in discrete steps following successive summers, similar to Southeast-2 Glacier (Fig. 8a). Phase 1 involved spatially confined acceleration driven by long-term geometric changes affecting basal thermal regime and driving stress, followed by phase 2, a multi-year hydro-thermodynamic feedback in which cryo-hydrological warming and frictional heating transitioned basal ice from cold to temperate conditions, enabled crevasse formation and meltwater access to the bed, and triggered sediment deformation through thawed till and elevated pore-water pressure. Benn and others (Reference Benn, Jones, Luckman, Fürst, Hewitt and Sommer2019b) further highlight that crevassing and surface-to-bed drainage reinforce this feedback by increasing basal enthalpy and sliding. Comparable multiannual accelerations occurred for Aavatsmarkbreen and Wahlenbergbreen, Svalbard, where up-glacier propagation closely followed crevasse development (Sevestre and others, Reference Sevestre2018). Initial acceleration followed sustained terminus retreat and thinning, with ablation-driven steepening near the terminus increasing driving stress and triggering a stress–strain heating feedback producing basal water; retreat from a pinning point may also have contributed for Wahlenbergbreen. Nanni and others (Reference Nanni2025) similarly show that thinning at Kongsvegen caused localised acceleration and crevassing, with stronger surface melt enabling basal water to trigger a positive feedback between basal pressure, sliding, and continued crevassing, driving further acceleration and potential surge initiation. Other Svalbard tidewater glaciers show that sustained frontal thinning can create a cold-based or high-friction zone near the terminus, promoting up-glacier mass accumulation and surge initiation once the barrier weakens or collapses, potentially aided by crevassing and meltwater access (Nuth and others, Reference Nuth2019; Haga and others, Reference Haga, McNabb, Nuth, Altena, Schellenberger and Kääb2020).
In line with Sevestre and others (Reference Sevestre2018), we suggest that long-term thinning near the terminus of the Southeast glaciers, reaching rates of up to ∼7 m a−1, and terminus retreat, preconditioned the observed acceleration of Southeast-2 Glacier by steepening the glacier surface and increasing driving stress. To illustrate this, we quantified changes in surface slope and driving stress in the terminus regions of Southeast-1 and Southeast-2 using ArcticDEM data for two periods: 2011–19, when the entire terminus was thinning, and 2011–23, which captures recent thickening of Southeast-2. Between 2011 and 2019, median surface slopes increased by 0.20° at Southeast-2 and 0.04° at Southeast-1, corresponding to median driving stress increases of 9.0 kPa (11.6%) and 1.9 kPa (2.9%), assuming median centreline NASA Operation IceBridge ice thicknesses of ∼287 m and ∼297 m. For 2011–23, median slope increased by 0.42° at Southeast-2 but only 0.09° at Southeast-1, yielding median driving stress increases of 18.9 kPa (24.4%) and 4.2 kPa (6.4%), respectively. Localised slope increases within Southeast-2 reached 3–4° during both periods and up to 5–6° in 2011–23, representing more than a doubling of driving stress locally. These results indicate substantially stronger geometric forcing and enhanced driving and shear stresses, with increased strain rates and basal enthalpy production within the Southeast-2 terminus region, which may partly explain differences in recent dynamics between the glaciers. Because the terminus was also thinning prior to 2011, similar steepening and stress increases likely occurred earlier and contributed to the initial localised acceleration of Southeast-2 and associated crevasse development, equivalent to phase 1 in Dunse and others (Reference Dunse, Schellenberger, Hagen, Kääb, Schuler and Reijmer2015).
Increased surface meltwater availability might be amplifying this dynamic response. Modelled cumulative glacier runoff for the Canadian Arctic from 1958 to 2022, downscaled from RACMO2.3 (Noël and others, Reference Noël, van de Berg, Lhermitte, Wouters, Schaffer and van den Broeke2018), shows a long-term increase over Southeast glaciers, most pronounced in the 21st century. Within the terminus region of Southeast-2 Glacier, median runoff increased from 1463 mm w.e. a−1 in 2000–09 to 1690 mm w.e. a−1 in 2010–22, resulting in a median increase of 22.1 mm w.e. a−2 from 2000 to 2022. Summer runoff is highest in July (∼725–942 mm w.e. month−1), followed by August and June, and monthly median velocities generally show the same pattern, with fastest flow in July (∼103–370 m a−1). Intra-annual correlations between monthly median runoff and velocity from 2013 to 2022 are strong in most years (R 2 = 0.558–0.969), particularly in 2019–22 when peak velocities are more clearly defined and crevassing is more widespread (Fig. 8a), emphasising the role of meltwater in regulating flow. Weaker correlations in some years (R 2 < 0.2) may reflect uncertainties in the datasets, interannual variability in subglacial hydrology, or lower surface-to-bed drainage efficiency in earlier years. Although the RACMO2.3 runoff dataset has been evaluated and calibrated using available surface mass balance observations (Noël and others, Reference Noël, van de Berg, Lhermitte, Wouters, Schaffer and van den Broeke2018), in situ measurements are sparse and absent for Southeast-2 Glacier. Both seasonal velocity data (point measurements) and the modelled runoff data (1 km resolution) are spatially limited, and their combined uncertainties may affect the quantitative strength of the inferred relationship between meltwater availability and seasonal glacier velocities.
Runoff is greatest near the terminus, where increased crevassing during ongoing acceleration may enhance surface-to-bed drainage and promote a multiannual, upstream-propagating speedup. However, this general increase in runoff alone is likely insufficient to explain the current instability, as runoff during the 1970s, when the previous surge began, was slightly lower than in the preceding decade. This suggests that the concentration of meltwater pathways through crevassing is more important than total runoff in propagating and intensifying instability by controlling drainage efficiency. This interpretation is supported by observations from Devon Ice Cap, where relatively uncrevassed regions exhibit slower and less variable flow, while areas with a high density of sink points show faster and more variable velocities, consistent with a strong link between basal motion and meltwater delivery to the bed (Burgess and others, Reference Burgess, Sharp, Mair, Dowdeswell and Benham2005; Wyatt and Sharp, Reference Wyatt and Sharp2015). Variations in the efficiency and seasonal evolution of the subglacial drainage system can further modulate the velocity response to meltwater input (Kamb and others, Reference Kamb1985; Murray and others, Reference Murray, Strozzi, Luckman, Jiskoot and Christakos2003; Sevestre and others, Reference Sevestre, Benn, Hulton and Bælum2015; Benn and others, Reference Benn, Fowler, Hewitt and Sevestre2019a). High velocities later in the summer suggest that the subglacial system remains responsive to meltwater input, potentially indicating inefficient drainage that allows increased runoff to further amplify the dynamic response of Southeast-2 Glacier. Ongoing Arctic warming and the resulting increase in surface melt could therefore influence future glacier stability (Dunse and others, Reference Dunse, Schellenberger, Hagen, Kääb, Schuler and Reijmer2015; Nanni and others, Reference Nanni2025).
The relationship between meltwater input and flow acceleration is supported by longitudinal strain rates, which reveal the spatial pattern of glacier deformation associated with crevasse propagation. Between 2013 and 2023, extensional stresses propagated up-glacier from the terminus to ∼350 m a.s.l. (∼15 km inland; Fig. 12c), enabling upstream migration of extensional crevasses. These crevasses provide conduits for meltwater to reach the bed over an expanding area, promoting a hydro-thermodynamic feedback (Dunse and others, Reference Dunse, Schellenberger, Hagen, Kääb, Schuler and Reijmer2015) that progressively mobilises initially stagnant basal regions and enhances the initial, localised acceleration driven by geometric changes and associated stress response. This feedback likely increased basal enthalpy production (Benn and others, Reference Benn, Fowler, Hewitt and Sevestre2019a, Reference Benn, Jones, Luckman, Fürst, Hewitt and Sommer2019b), initially low during quiescence as reflected by the stagnant terminus, contributing to the observed compounding acceleration.
Although Southeast-2 Glacier resembles the phase 1 and phase 2 dynamics described by Dunse and others (Reference Dunse, Schellenberger, Hagen, Kääb, Schuler and Reijmer2015) and the geometric preconditioning near the terminus noted by Sevestre and others (Reference Sevestre2018), its acceleration occurs without terminus flotation, making it a novel example in the Canadian Arctic. By comparison, destabilisation of other marine-terminating glacier termini in the Canadian Arctic has been linked to flotation or near flotation of the ice after long-term thinning (Dalton and others, Reference Dalton, Van Wychen, Copland, Gray and Burgess2022; Lauzon and others, Reference Lauzon, Copland, Van Wychen, Kochtitzky, McNabb and Dahl-Jensen2023a; Copland and others, Reference Copland, Hallé, Van Wychen, Lauzon, Dowdeswell and Davis2024). This likely played a key role in initiating the surge of Mittie Glacier, where the lowermost ∼5 km was within 10 m of flotation in 2000, roughly halfway through its surge, with some areas within 2 m (Copland and others, Reference Copland, Hallé, Van Wychen, Lauzon, Dowdeswell and Davis2024). Similarly, estimates for Iceberg Glacier in 1977, shortly before its 1981 surge initiation, indicate flotation conditions extending over 5 km inland. In contrast, bed topography from a NASA Operation IceBridge flight on 4 May 2012 shows that in 2023 only the lowest ∼200 m of Southeast-2 Glacier and <100 m of Southeast-1 Glacier were within 10 m of flotation, making flotation an unlikely primary mechanism for the acceleration of Southeast-2. Nevertheless, reductions in buoyancy, effective pressure, and lateral drag from long-term thinning may still enhance acceleration by lowering basal and marginal resistance, even without full flotation.
While Southeast-2 Glacier accelerated by over an order of magnitude above quiescent velocities since 2020, it has not yet undergone the sudden, large-scale acceleration typical of marine-terminating glacier surges observed during its previous surge. We hypothesise that this reflects the absence of a major terminus destabilisation event, such as removal of a cold-ice barrier, widespread till weakening, or terminus flotation (Dunse and others, Reference Dunse, Schellenberger, Hagen, Kääb, Schuler and Reijmer2015; Nuth and others, Reference Nuth2019; Haga and others, Reference Haga, McNabb, Nuth, Altena, Schellenberger and Kääb2020; Lauzon and others, Reference Lauzon, Copland, Van Wychen, Kochtitzky, McNabb and Dahl-Jensen2023a; Copland and others, Reference Copland, Hallé, Van Wychen, Lauzon, Dowdeswell and Davis2024), suggesting that Southeast glaciers may still be in a transient state between quiescence and full surge onset. Should such a transition occur in the near future, it would provide a valuable opportunity to directly observe and constrain the processes governing surge initiation at the marine terminus.
6. Conclusions
This study analyses the dynamics of Southeast glaciers, Devon Ice Cap, from 1959 to 2024, identifying an 8–9-year surge from 1975–76 to 1983–84 affecting both glaciers, a subsequent quiescent phase of ∼36–37 years, and a multiannual acceleration of Southeast-2 Glacier from the mid-2000s to 2024, likely indicating the start of a second surge. Since 2020, Southeast-2 has reached flow rates an order of magnitude higher than quiescent velocities within the terminus region, has started advancing, and commenced down-glacier mass transfer, although it has not yet reached velocities observed at the onset of the previous surge. The 1970s surge peaked at >3000 m a−1 at the front of Southeast-1 Glacier about 3 years after initiation, advancing the Southeast-1 side by up to ∼5 km. In contrast, the most recent velocity of Southeast-2 Glacier peaked at ∼400 m a−1 in 2024, resulting in a minor advance of its portion of the terminus, while Southeast-1 Glacier continues to flow at quiescent rates and is retreating. Evidence from the previous surge suggests that destabilisation of the shared terminus may be imminent and could propagate to higher elevations. The apparent spread of flow instability from Southeast-2 to Southeast-1 Glacier, as observed during surge initiation in the 1970s, reveals a complex interplay between the dynamics of two neighbouring glaciers with a common tidewater terminus and trunk.
The up-glacier-propagating acceleration of Southeast-2 Glacier resembles the behaviour of other marine-terminating surge-type glaciers in the Canadian Arctic (Lauzon and others, Reference Lauzon, Copland, Van Wychen, Kochtitzky, McNabb and Dahl-Jensen2023a; Copland and others, Reference Copland, Hallé, Van Wychen, Lauzon, Dowdeswell and Davis2024), Greenland (Müller and others, Reference Müller2021), and Svalbard (Dunse and others, Reference Dunse, Schellenberger, Hagen, Kääb, Schuler and Reijmer2015; Sevestre and others, Reference Sevestre2018). While flotation has been proposed as a surge trigger elsewhere in the Canadian Arctic, there is no strong evidence that it occurred at the terminus of Southeast glaciers in recent years. Long-term thinning and retreat near the terminus may nevertheless have preconditioned Southeast-2 Glacier by steepening the surface, increasing driving and shear stresses, and reducing effective pressure and basal and marginal resistance, promoting localised acceleration and crevasse development. The stepwise summer speedup closely mirrors the dynamic instability of Austfonna Basin-3 in Svalbard (Dunse and others, Reference Dunse, Schellenberger, Hagen, Kääb, Schuler and Reijmer2015), pointing to a hydro-thermodynamic feedback as a likely mechanism driving the acceleration. Long-term increases in modelled surface runoff over Southeast glaciers, particularly since the early 21st century, suggest slightly enhanced meltwater availability during the period of acceleration. Intra-annual correlations with velocity support the amplifying role of runoff, but crevassing likely plays the primary role in propagating and intensifying the instability, as runoff during the prior and initiation of the 1970s surge was lower than in the preceding decade. Longitudinal strain rates further support this interpretation, revealing an up-glacier expansion of extensional stresses that parallels crevasse propagation and velocity increase, with crevasses likely facilitating surface-to-bed drainage and reinforcing the hydro-thermodynamic feedback.
The relatively short surge cycle of Southeast glaciers compared to other surge-type glaciers in the Canadian Arctic has, for the first time in this region, allowed measurement of the full length of a quiescent phase. This expands the known spectrum of glacier dynamic behaviour in the Canadian Arctic and aligns with typical surge cycle durations observed in Svalbard (Dowdeswell and others, Reference Dowdeswell, Hamilton and Hagen1991), drawing further parallels between the two regions. The diversity of flow instabilities in the Canadian Arctic, including mechanisms and recurrence intervals, remains underexplored, highlighting the need for long-term, high-resolution observations to improve understanding and prediction of glacier dynamics in a warming Arctic.
Acknowledgements
Support for this work has been provided by the University of Ottawa, University of Waterloo, Natural Sciences and Engineering Research Council of Canada (NSERC) Discovery Grant and Northern Supplement, NSERC Canada Graduate Scholarship—Doctoral, Ontario Graduate Scholarship, Northern Scientific Training Program, Polar Knowledge Canada, Fondation Baxter & Alma Ricard, Polar Continental Shelf Program, ArcticNet (funded by the Strategic Science Fund), Canada Foundation for Innovation, Environment and Climate Change Canada, Ontario Research Fund, and Amundsen Science. We thank the Nunavut Research Institute and communities of Resolute Bay and Grise Fiord for permission to undertake fieldwork in this region.
Appendix. Tables of optical satellite imagery used for terminus position changes and Landsat imagery used to derive surface velocities with GIV
Summary of optical satellite imagery used to delineate terminus positions of Southeast glaciers, Devon Ice Cap. RCAF = Royal Canadian Air Force.

Summary of Landsat imagery used to compute glacier surface velocities for 1972–84 with the Glacier Image Velocimetry (GIV) app (Van Wyk de Vries, Reference Van Wyk de Vries2021a, Reference Van Wyk de Vries2021b), with the associated uncertainty representing velocities over stable ground within the Southeast basin.

* Scenes that were manually georeferenced in ArcGIS Pro.
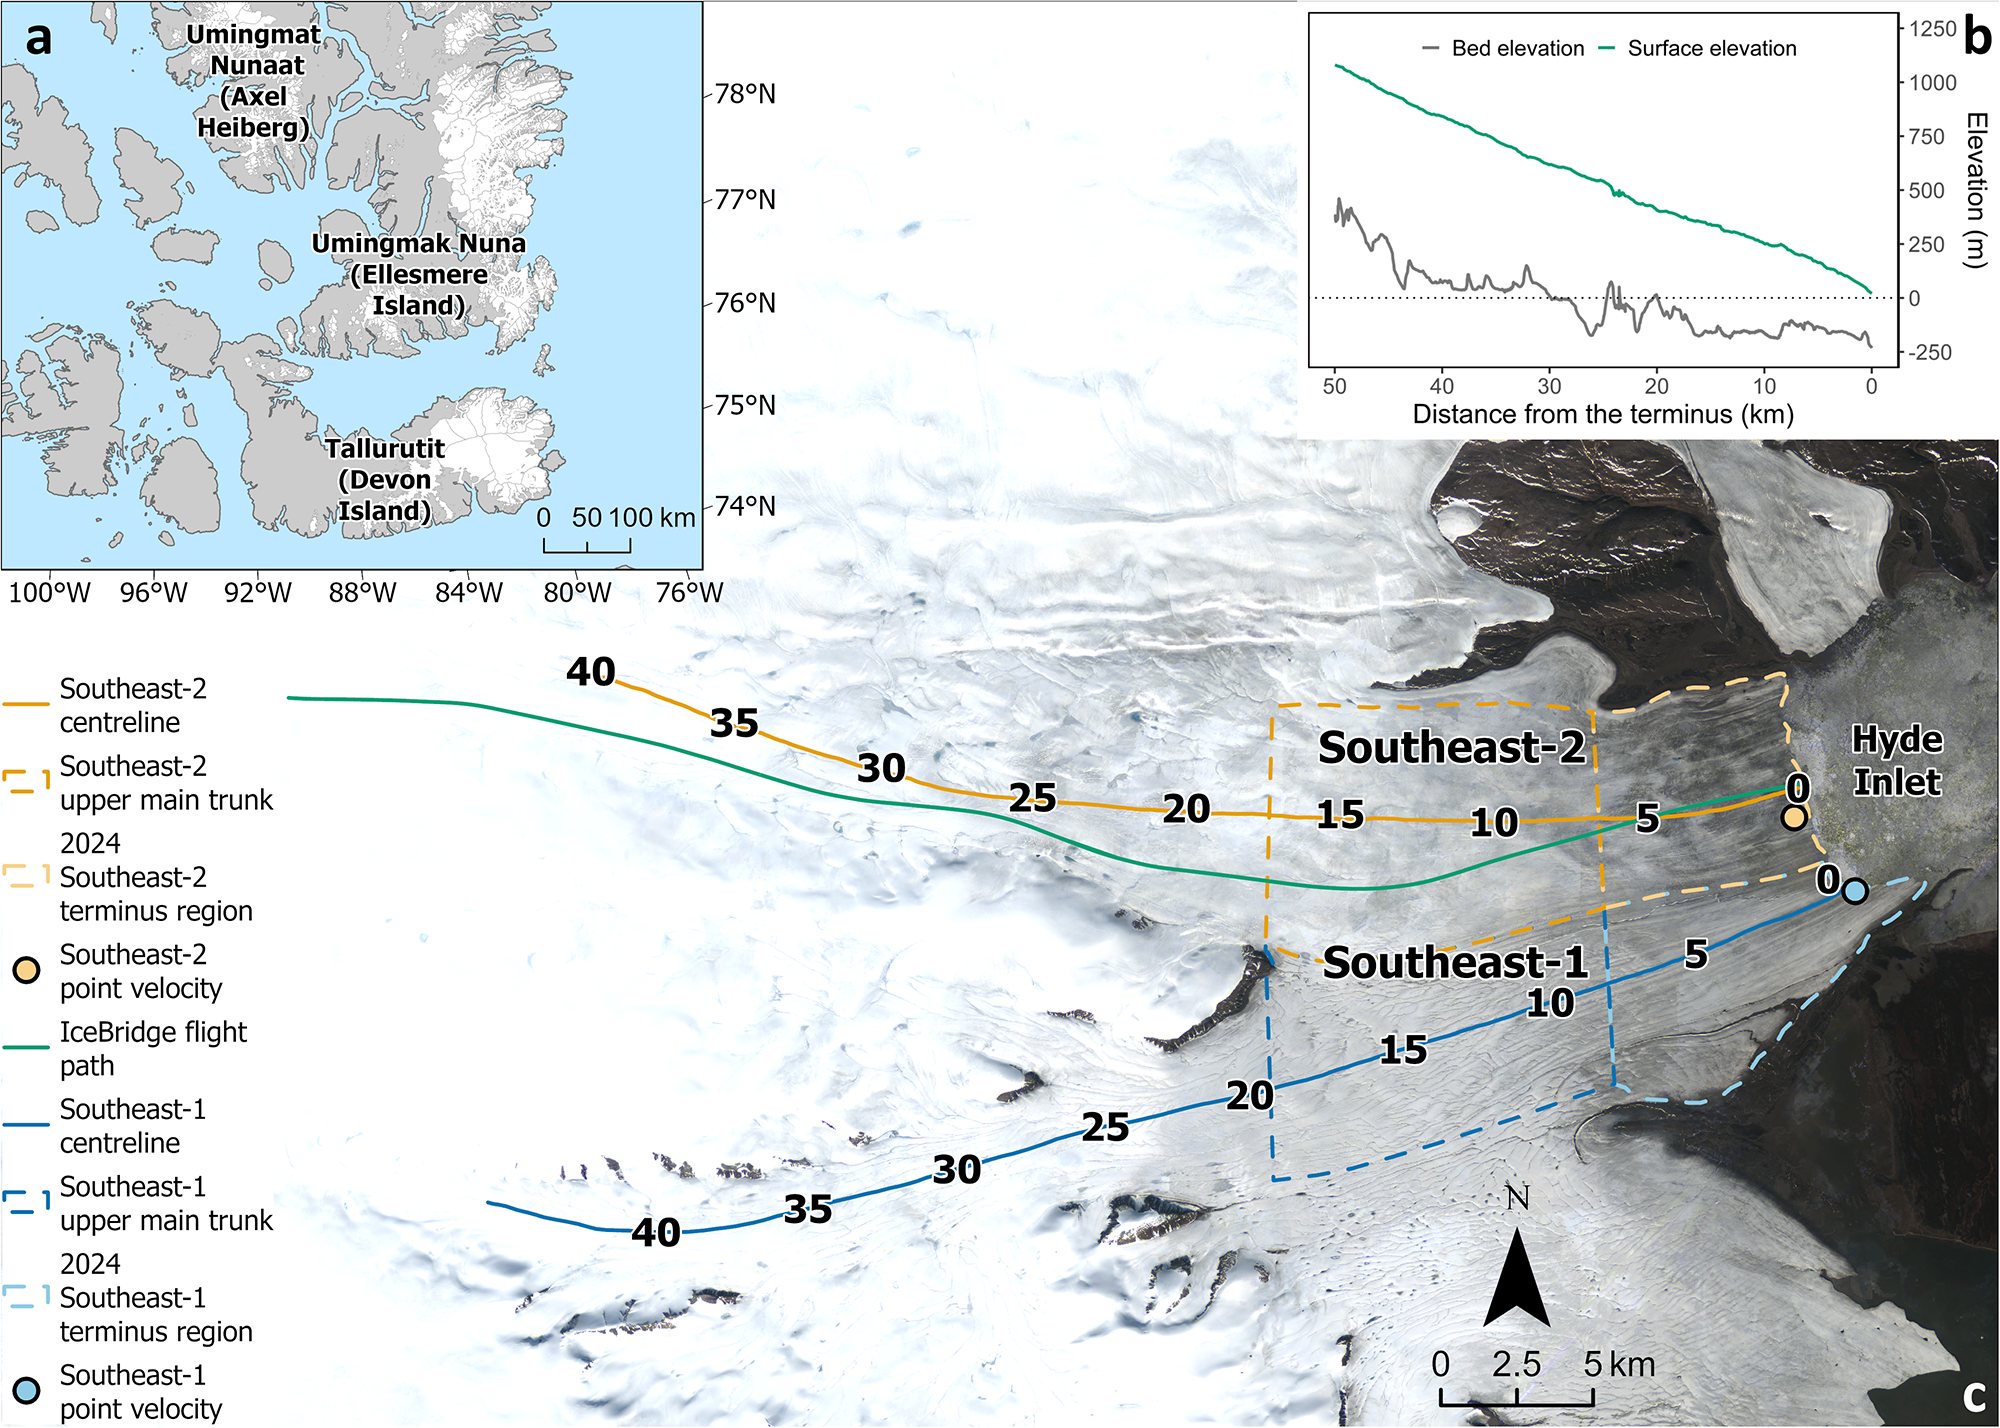
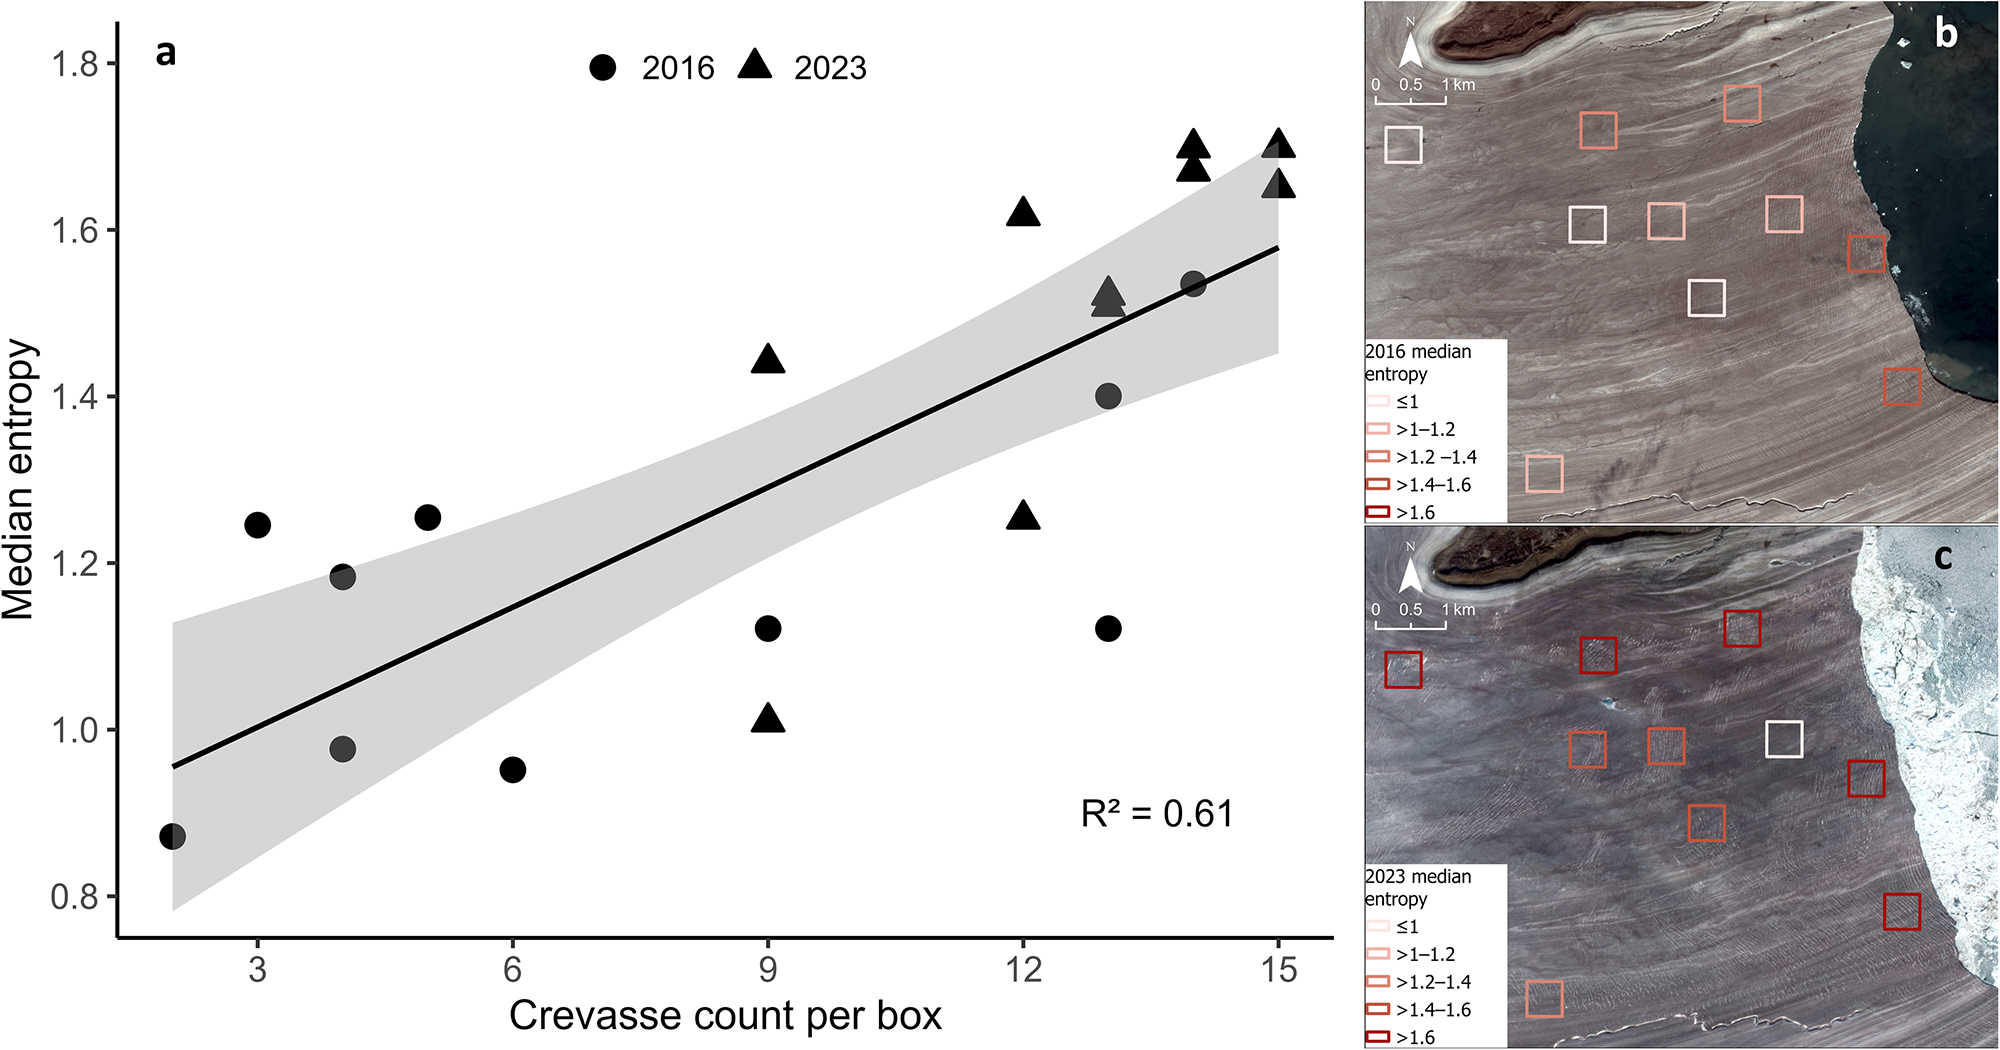
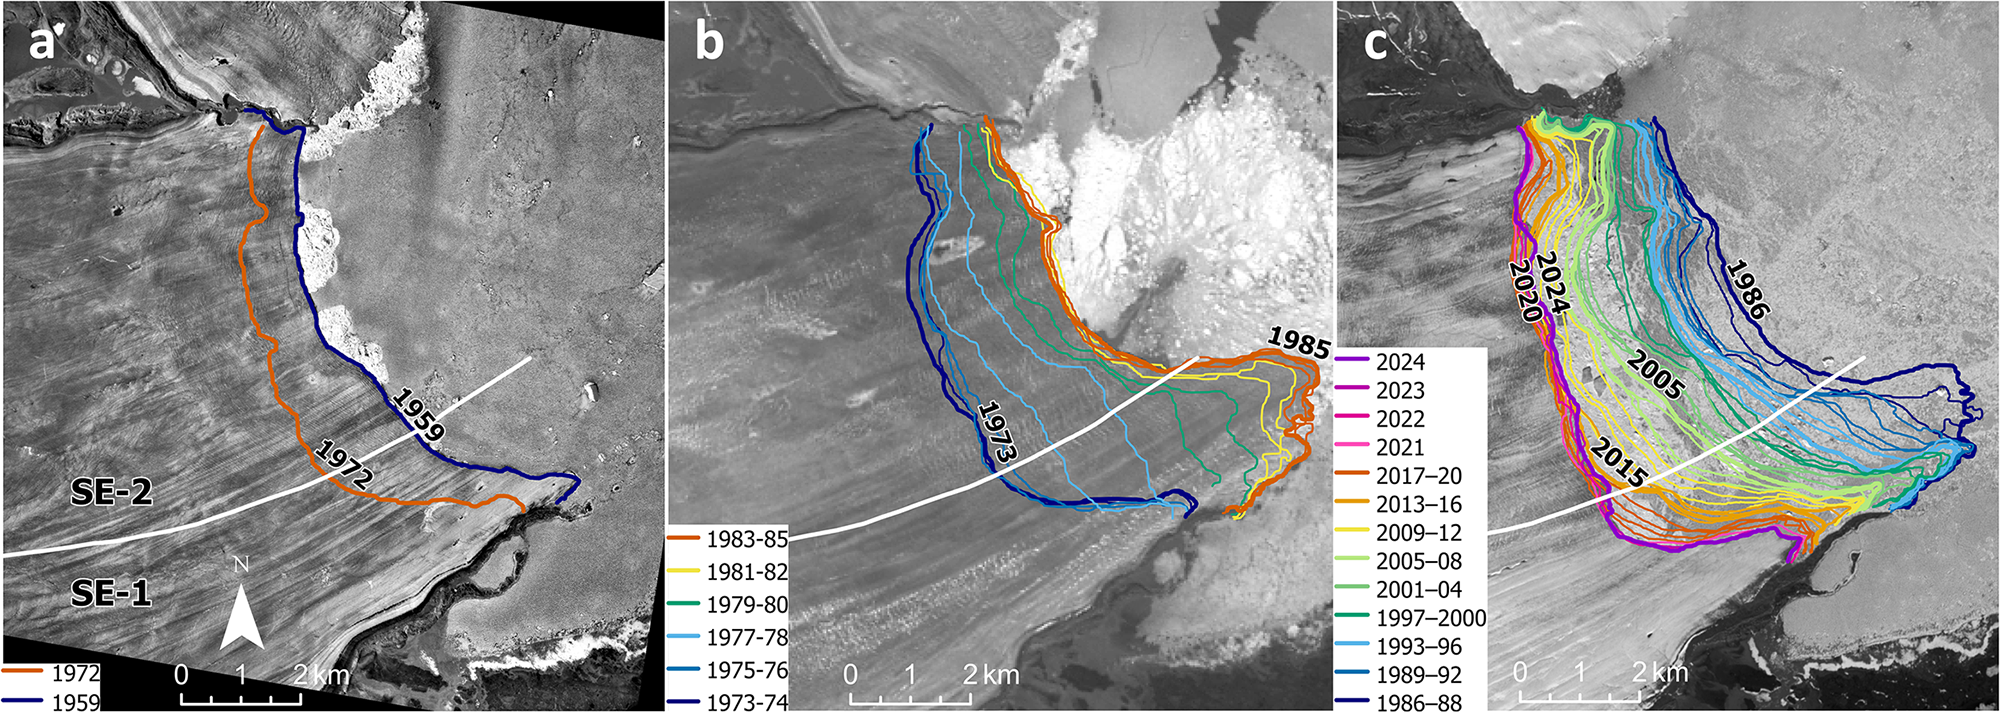
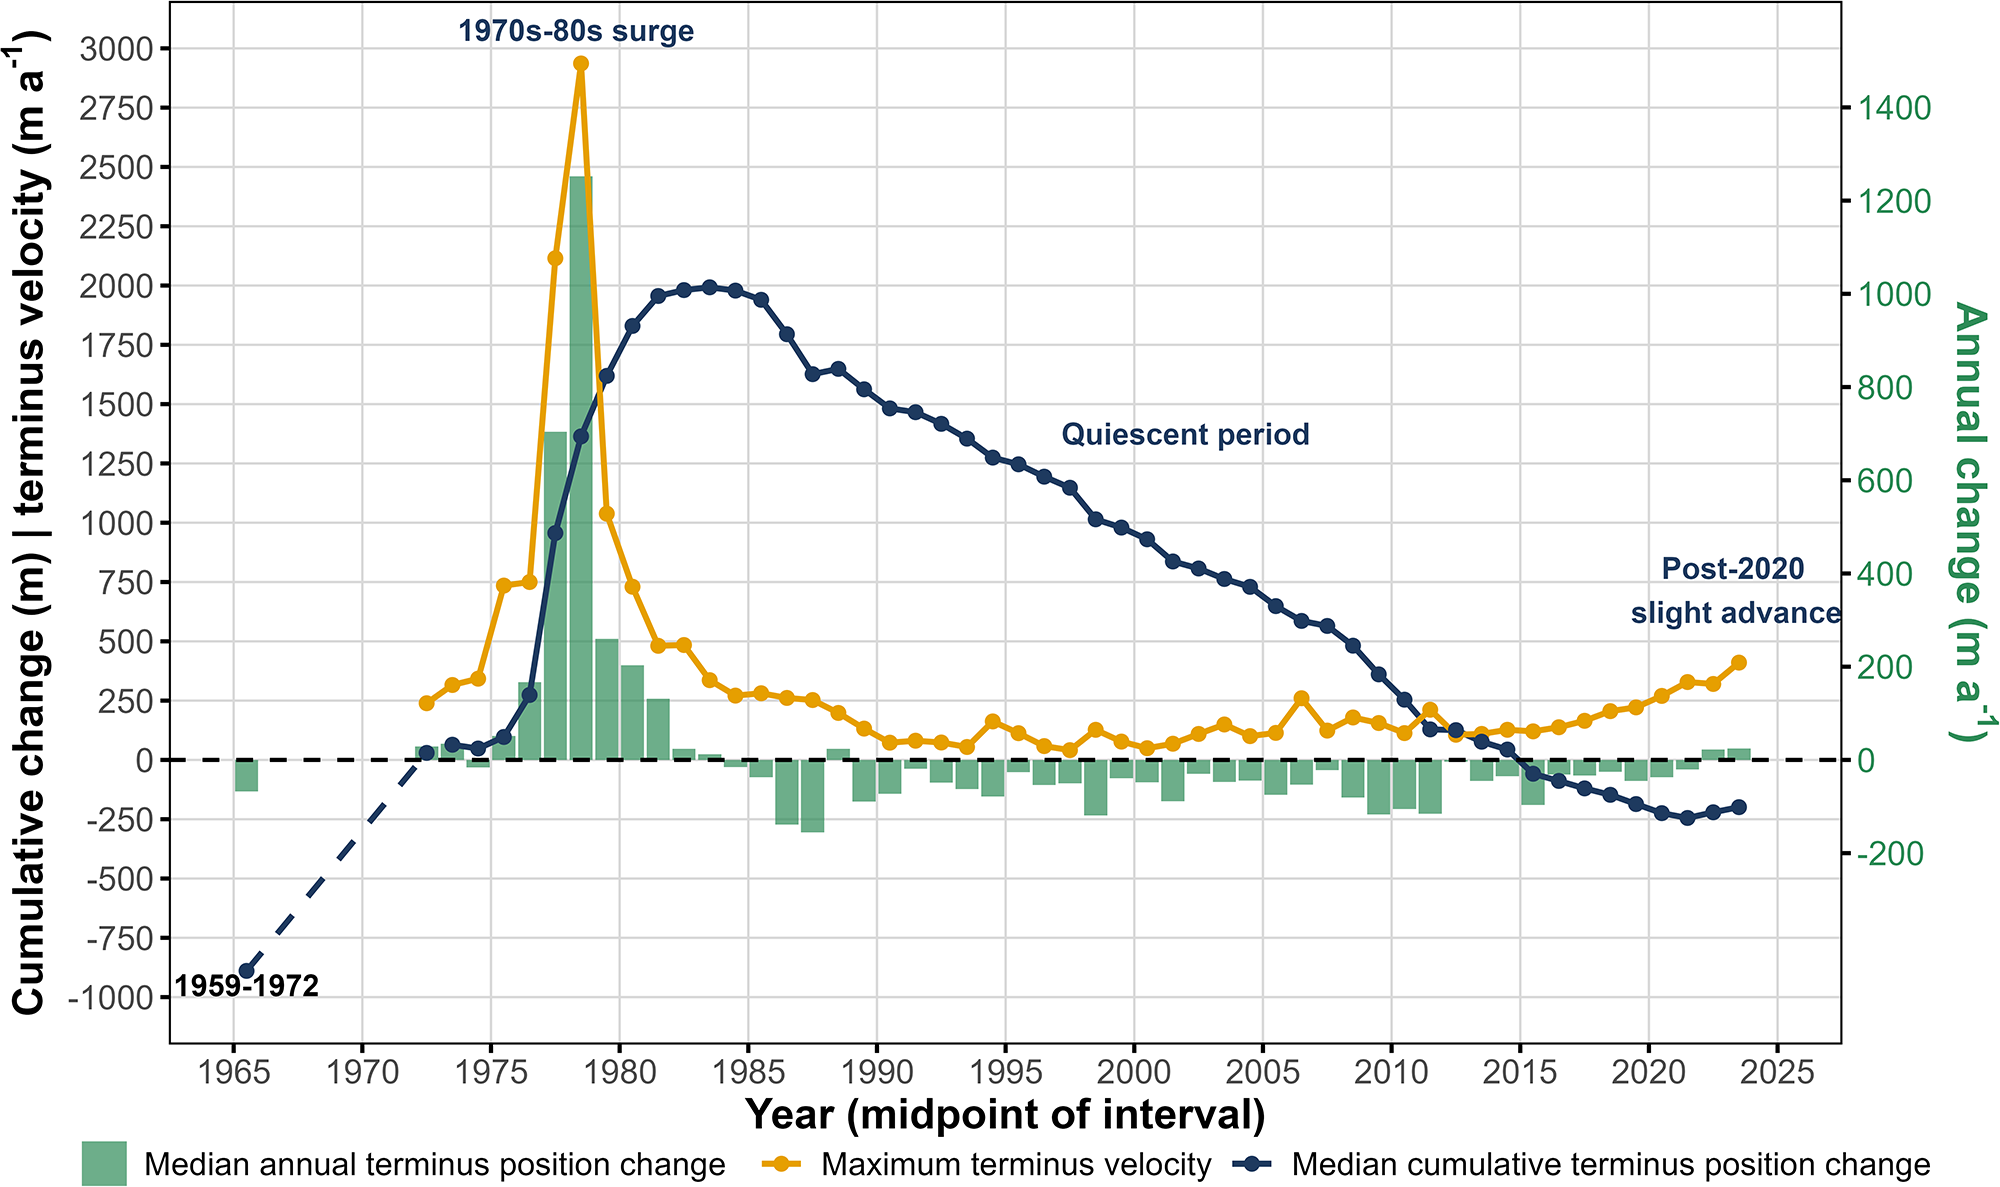
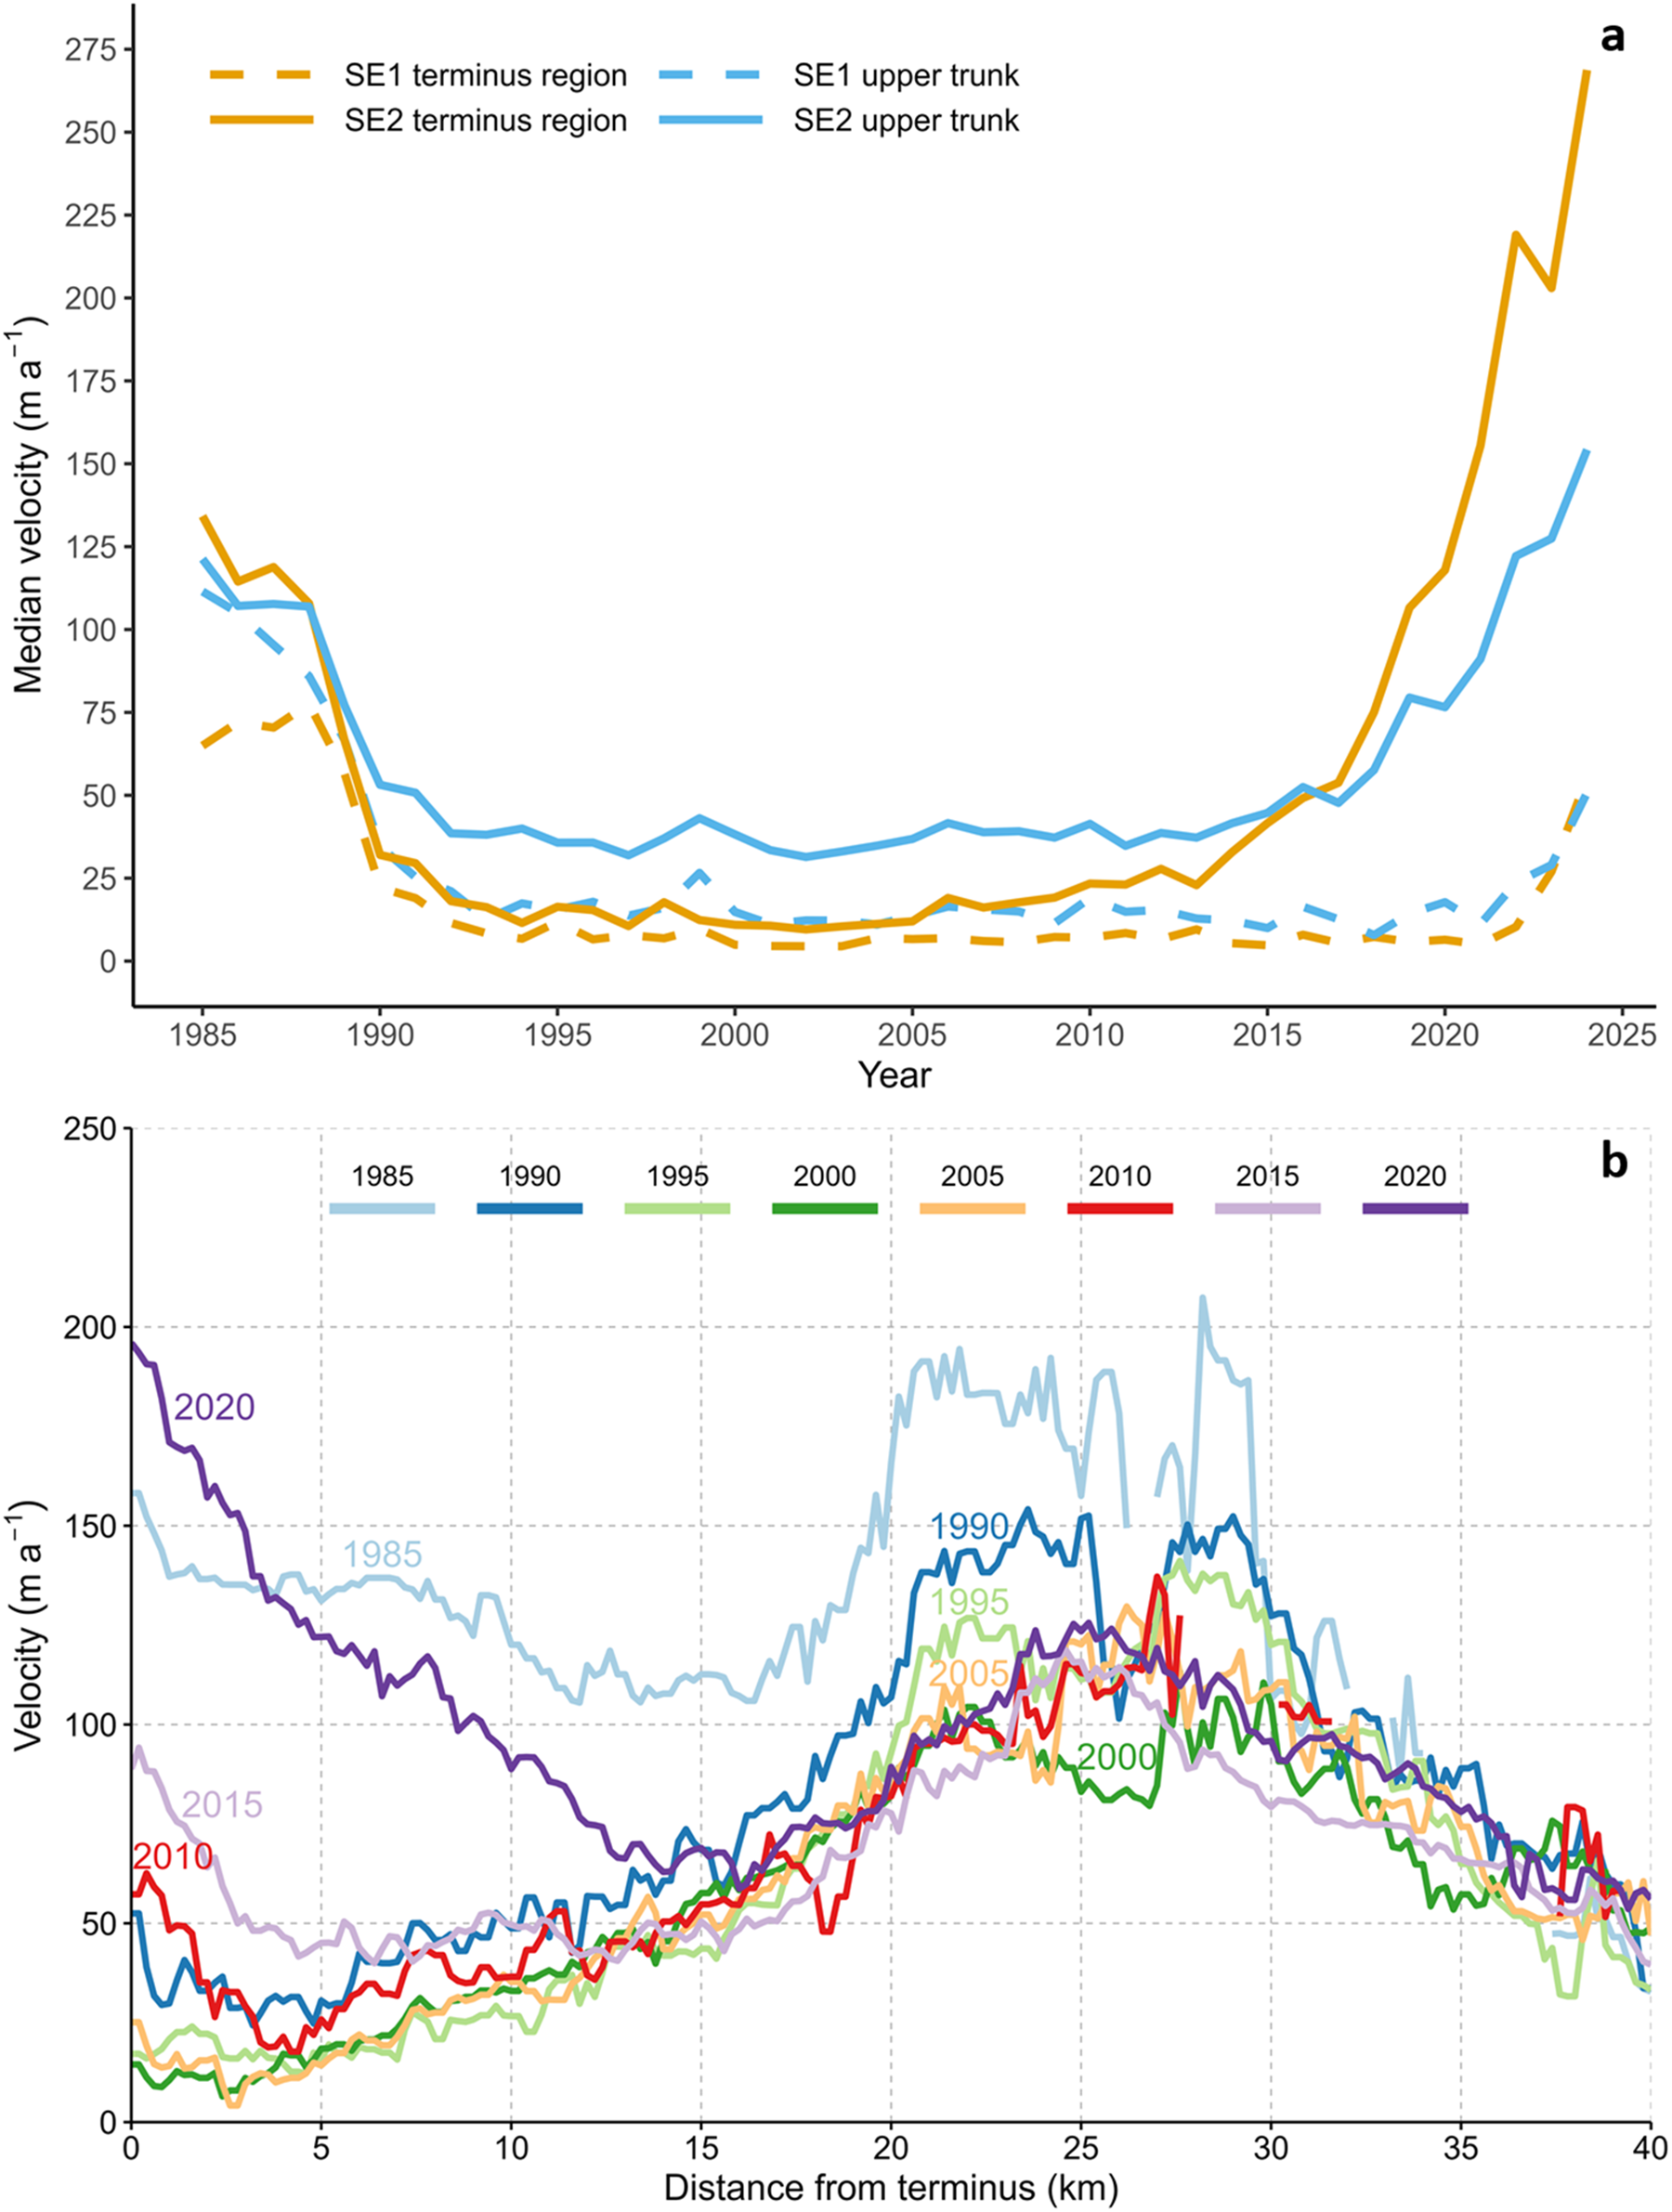
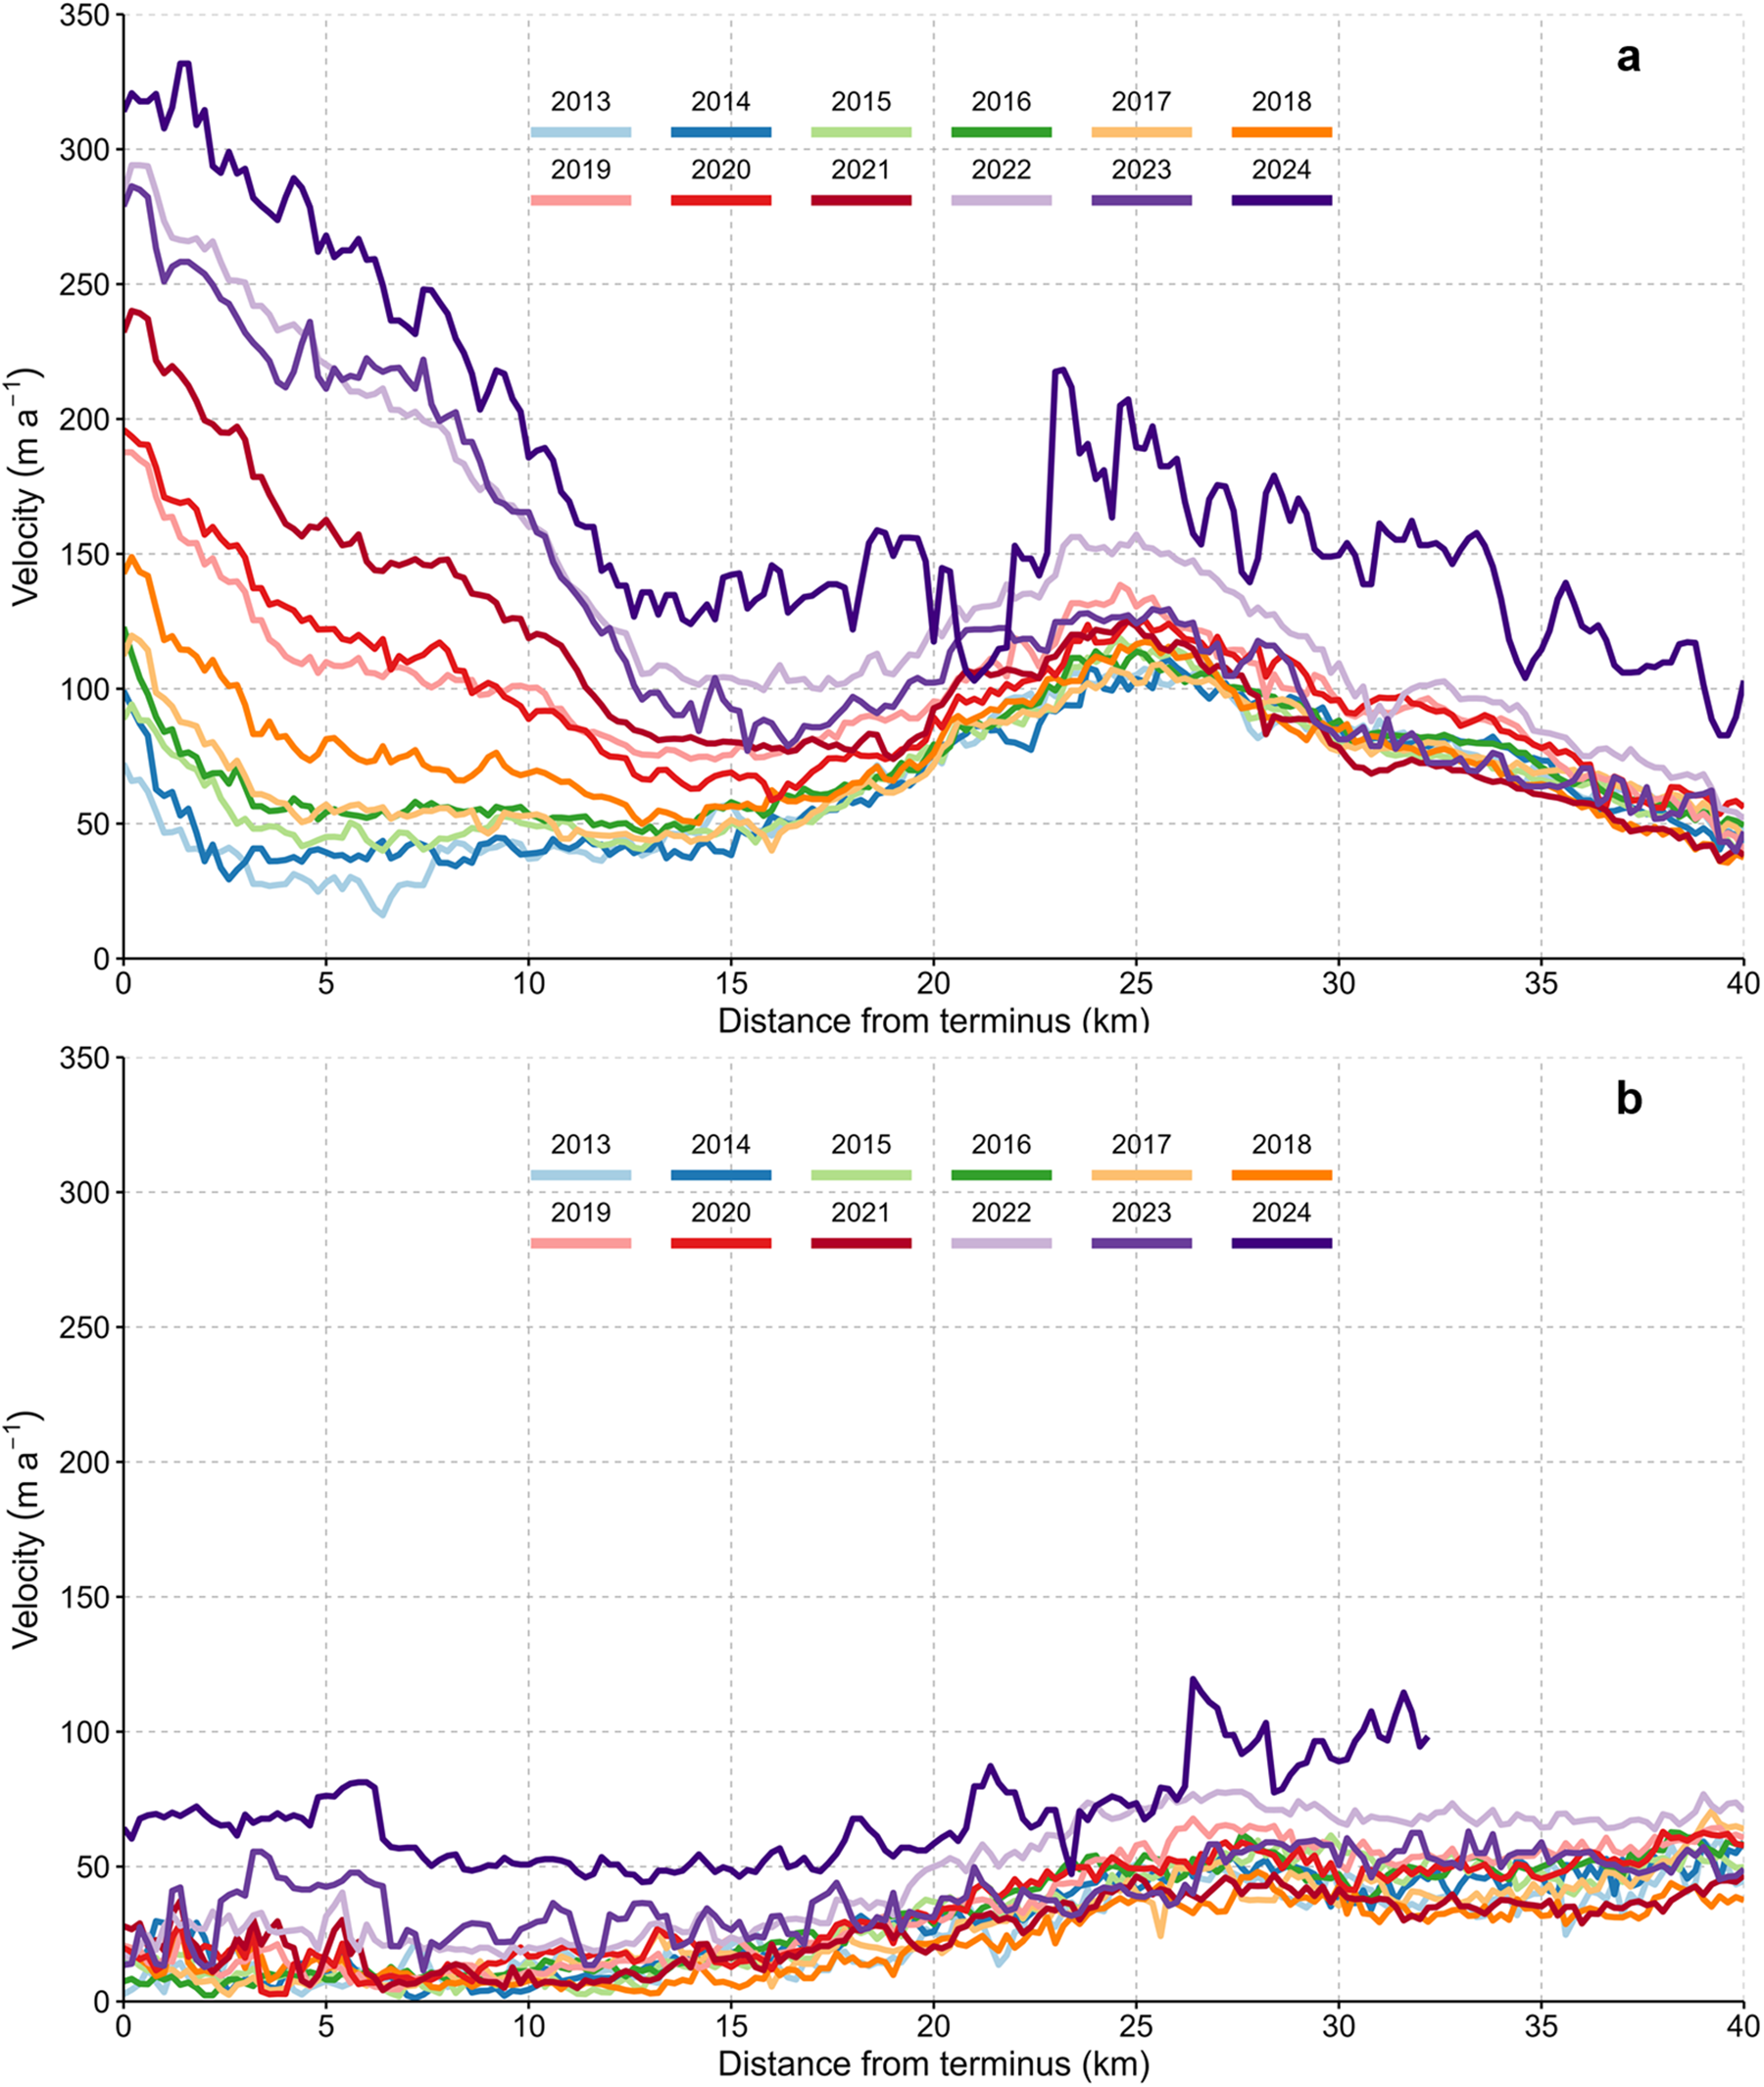
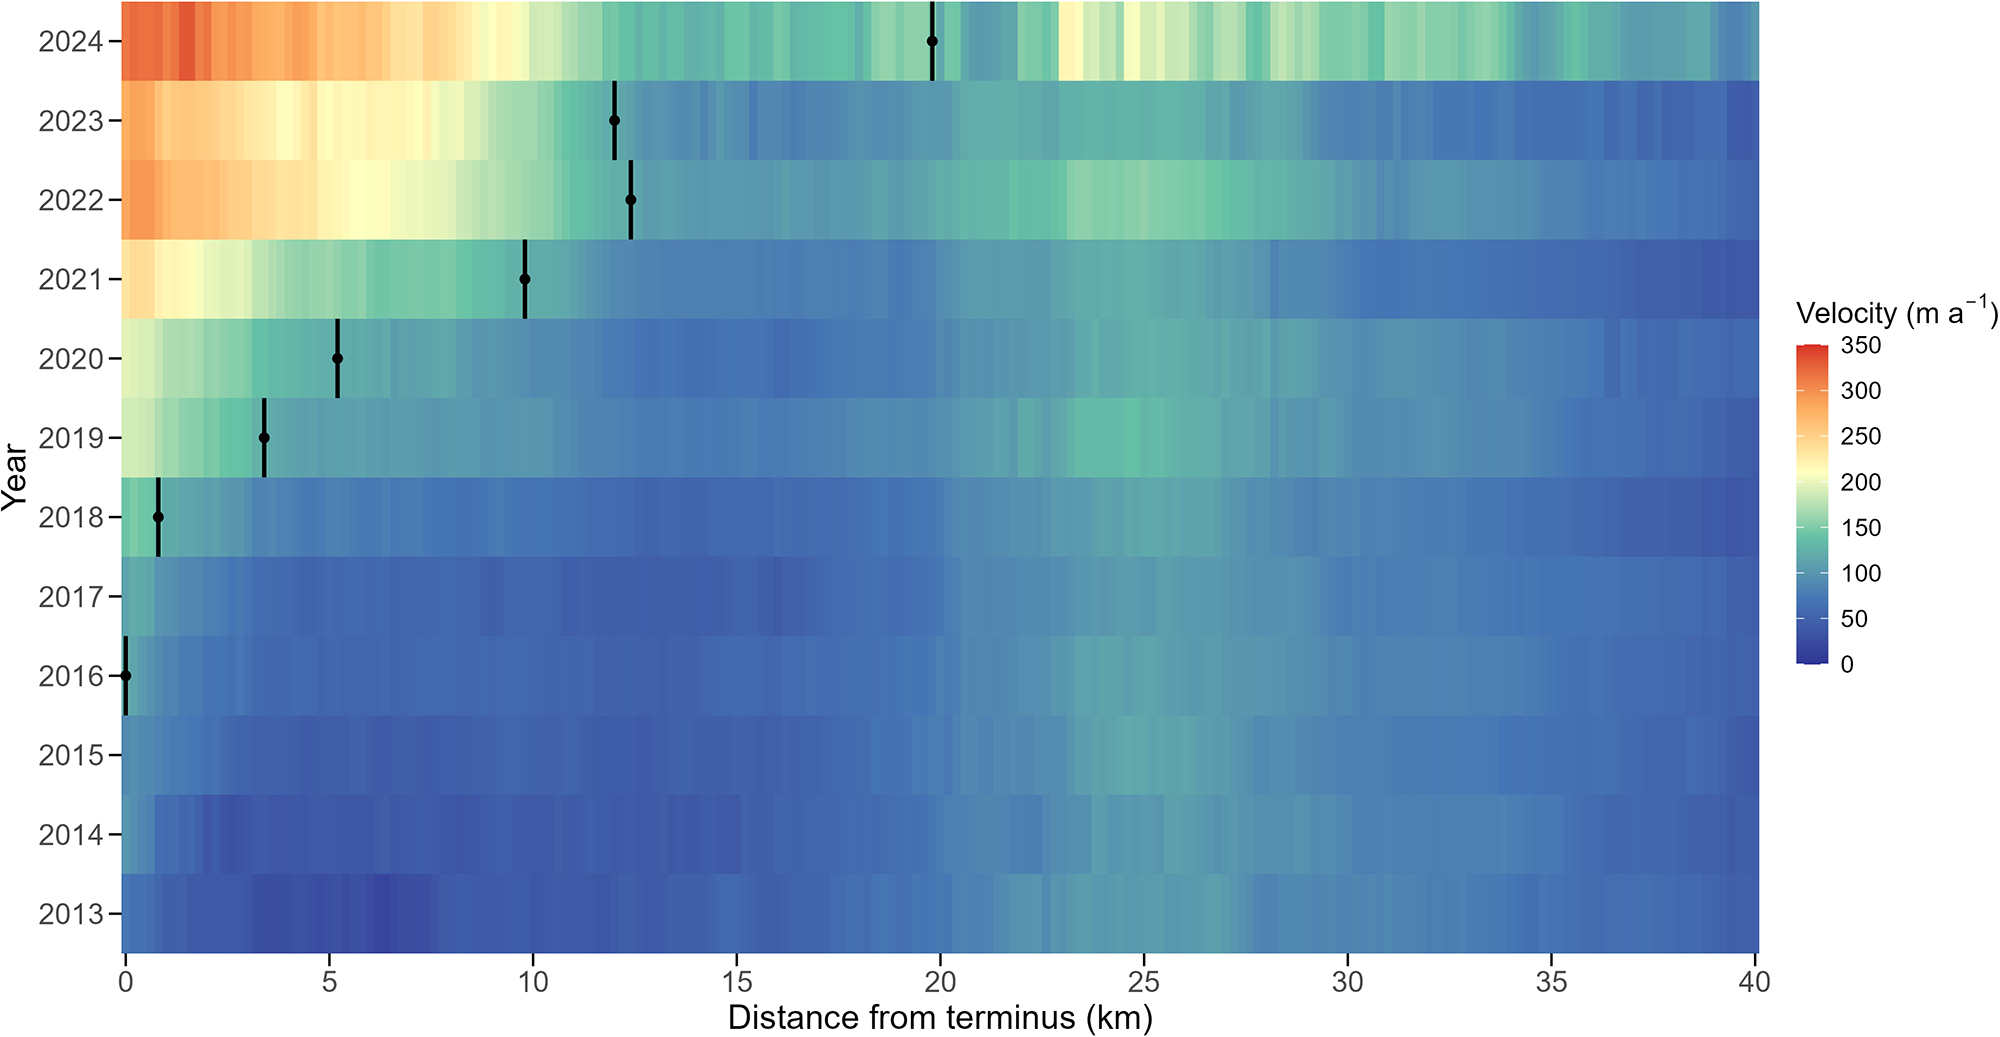

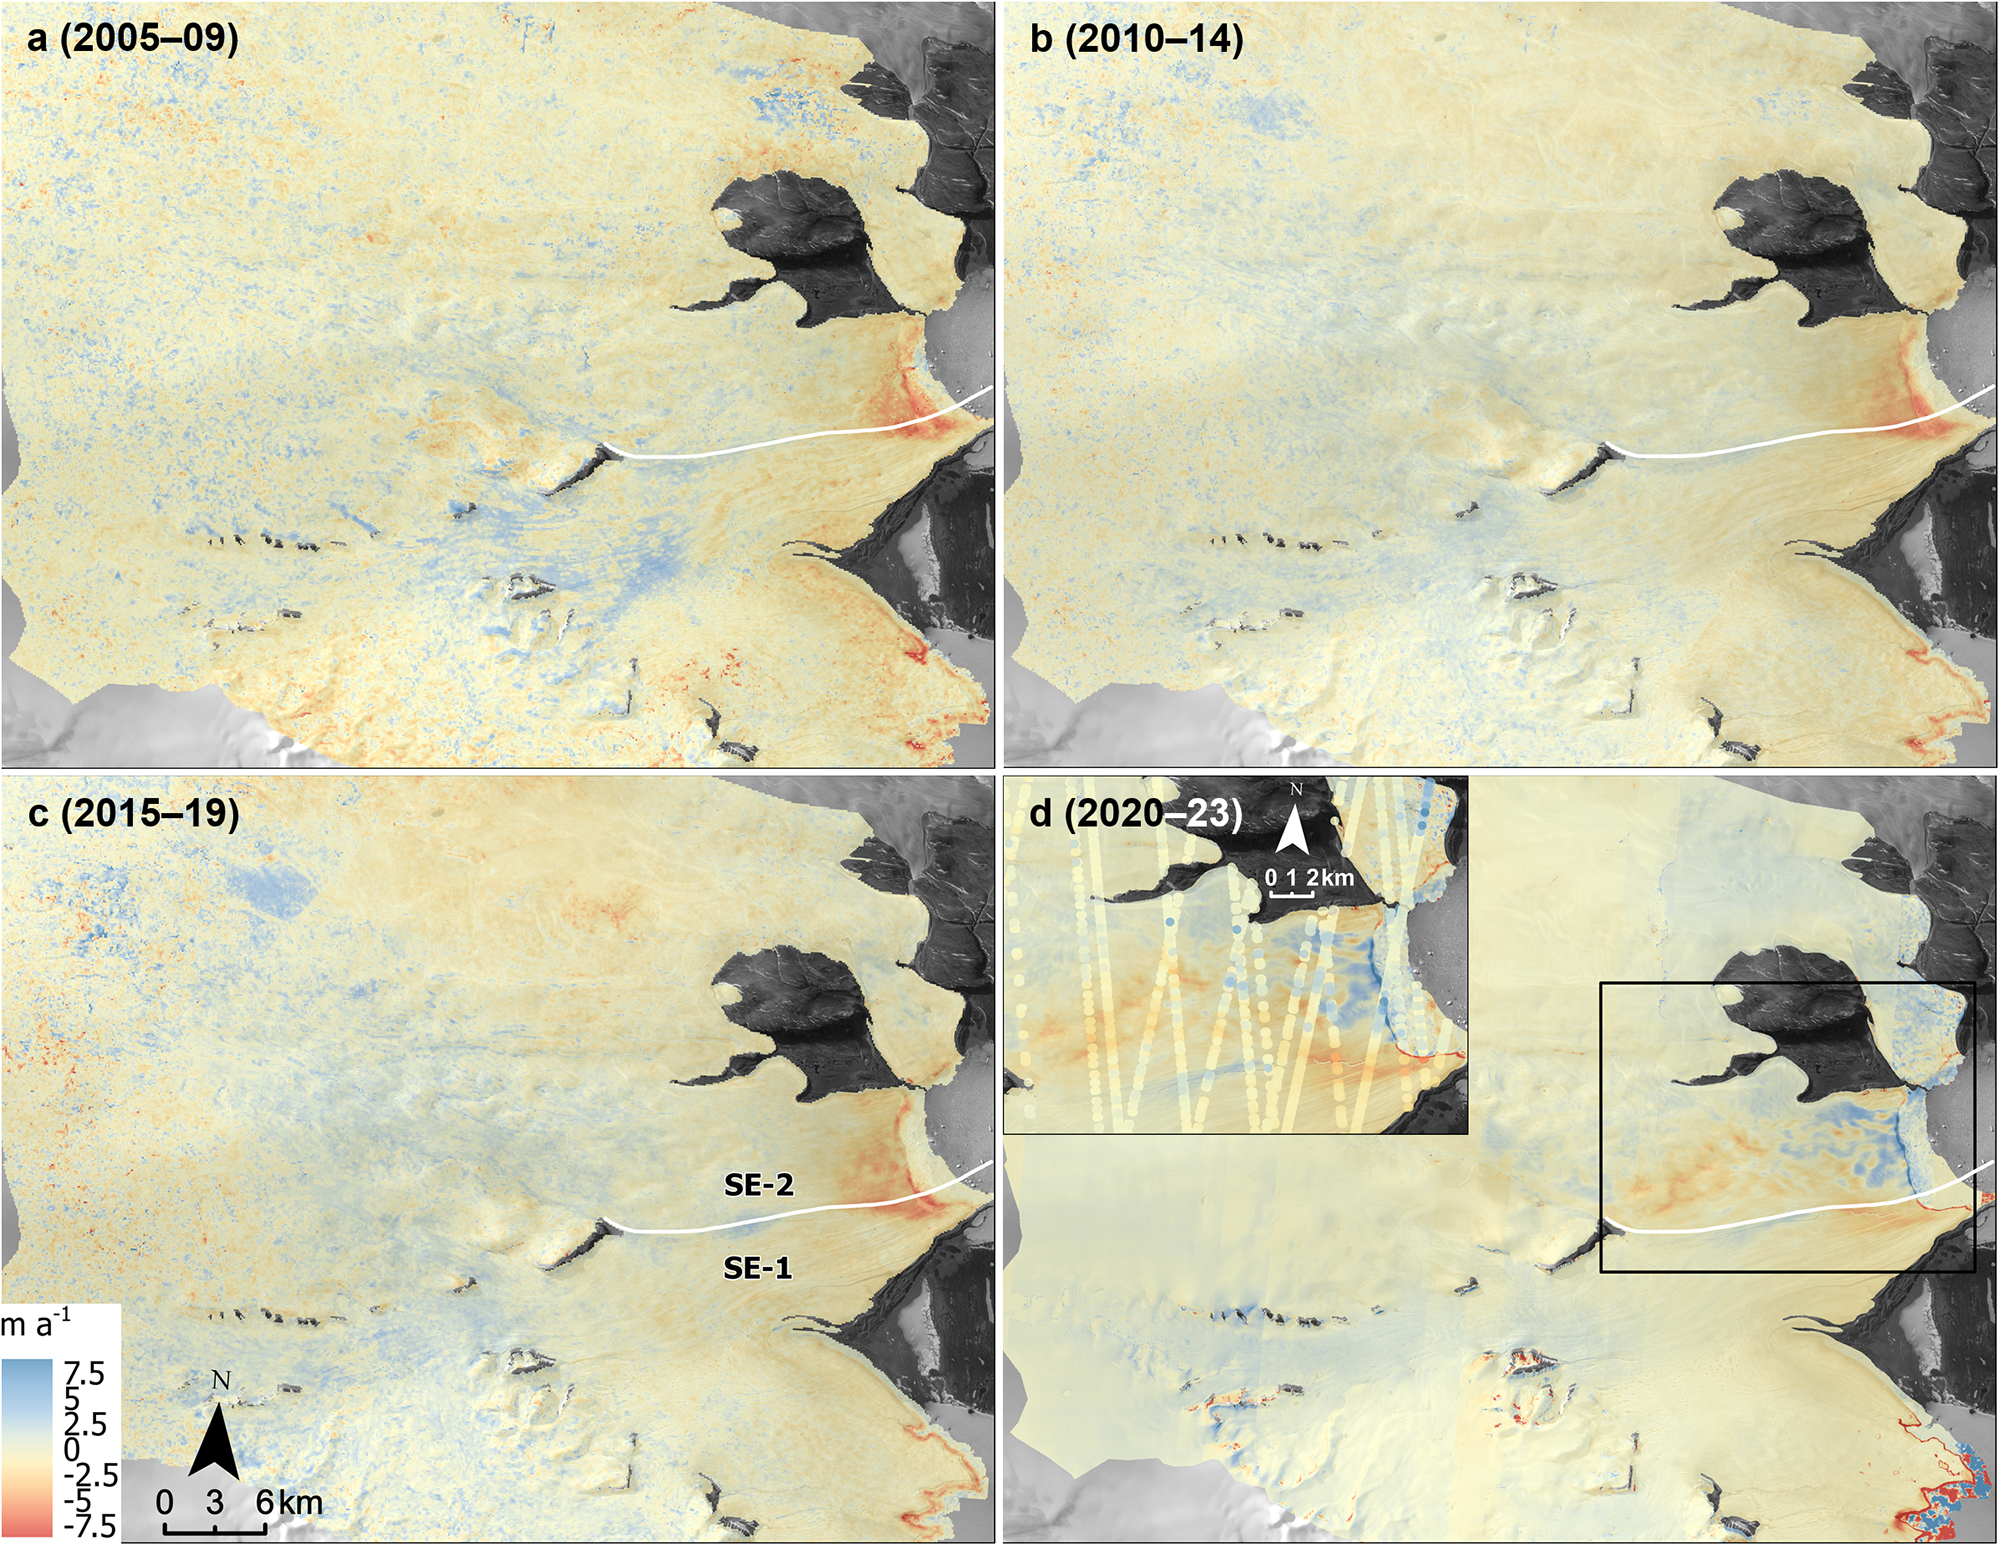
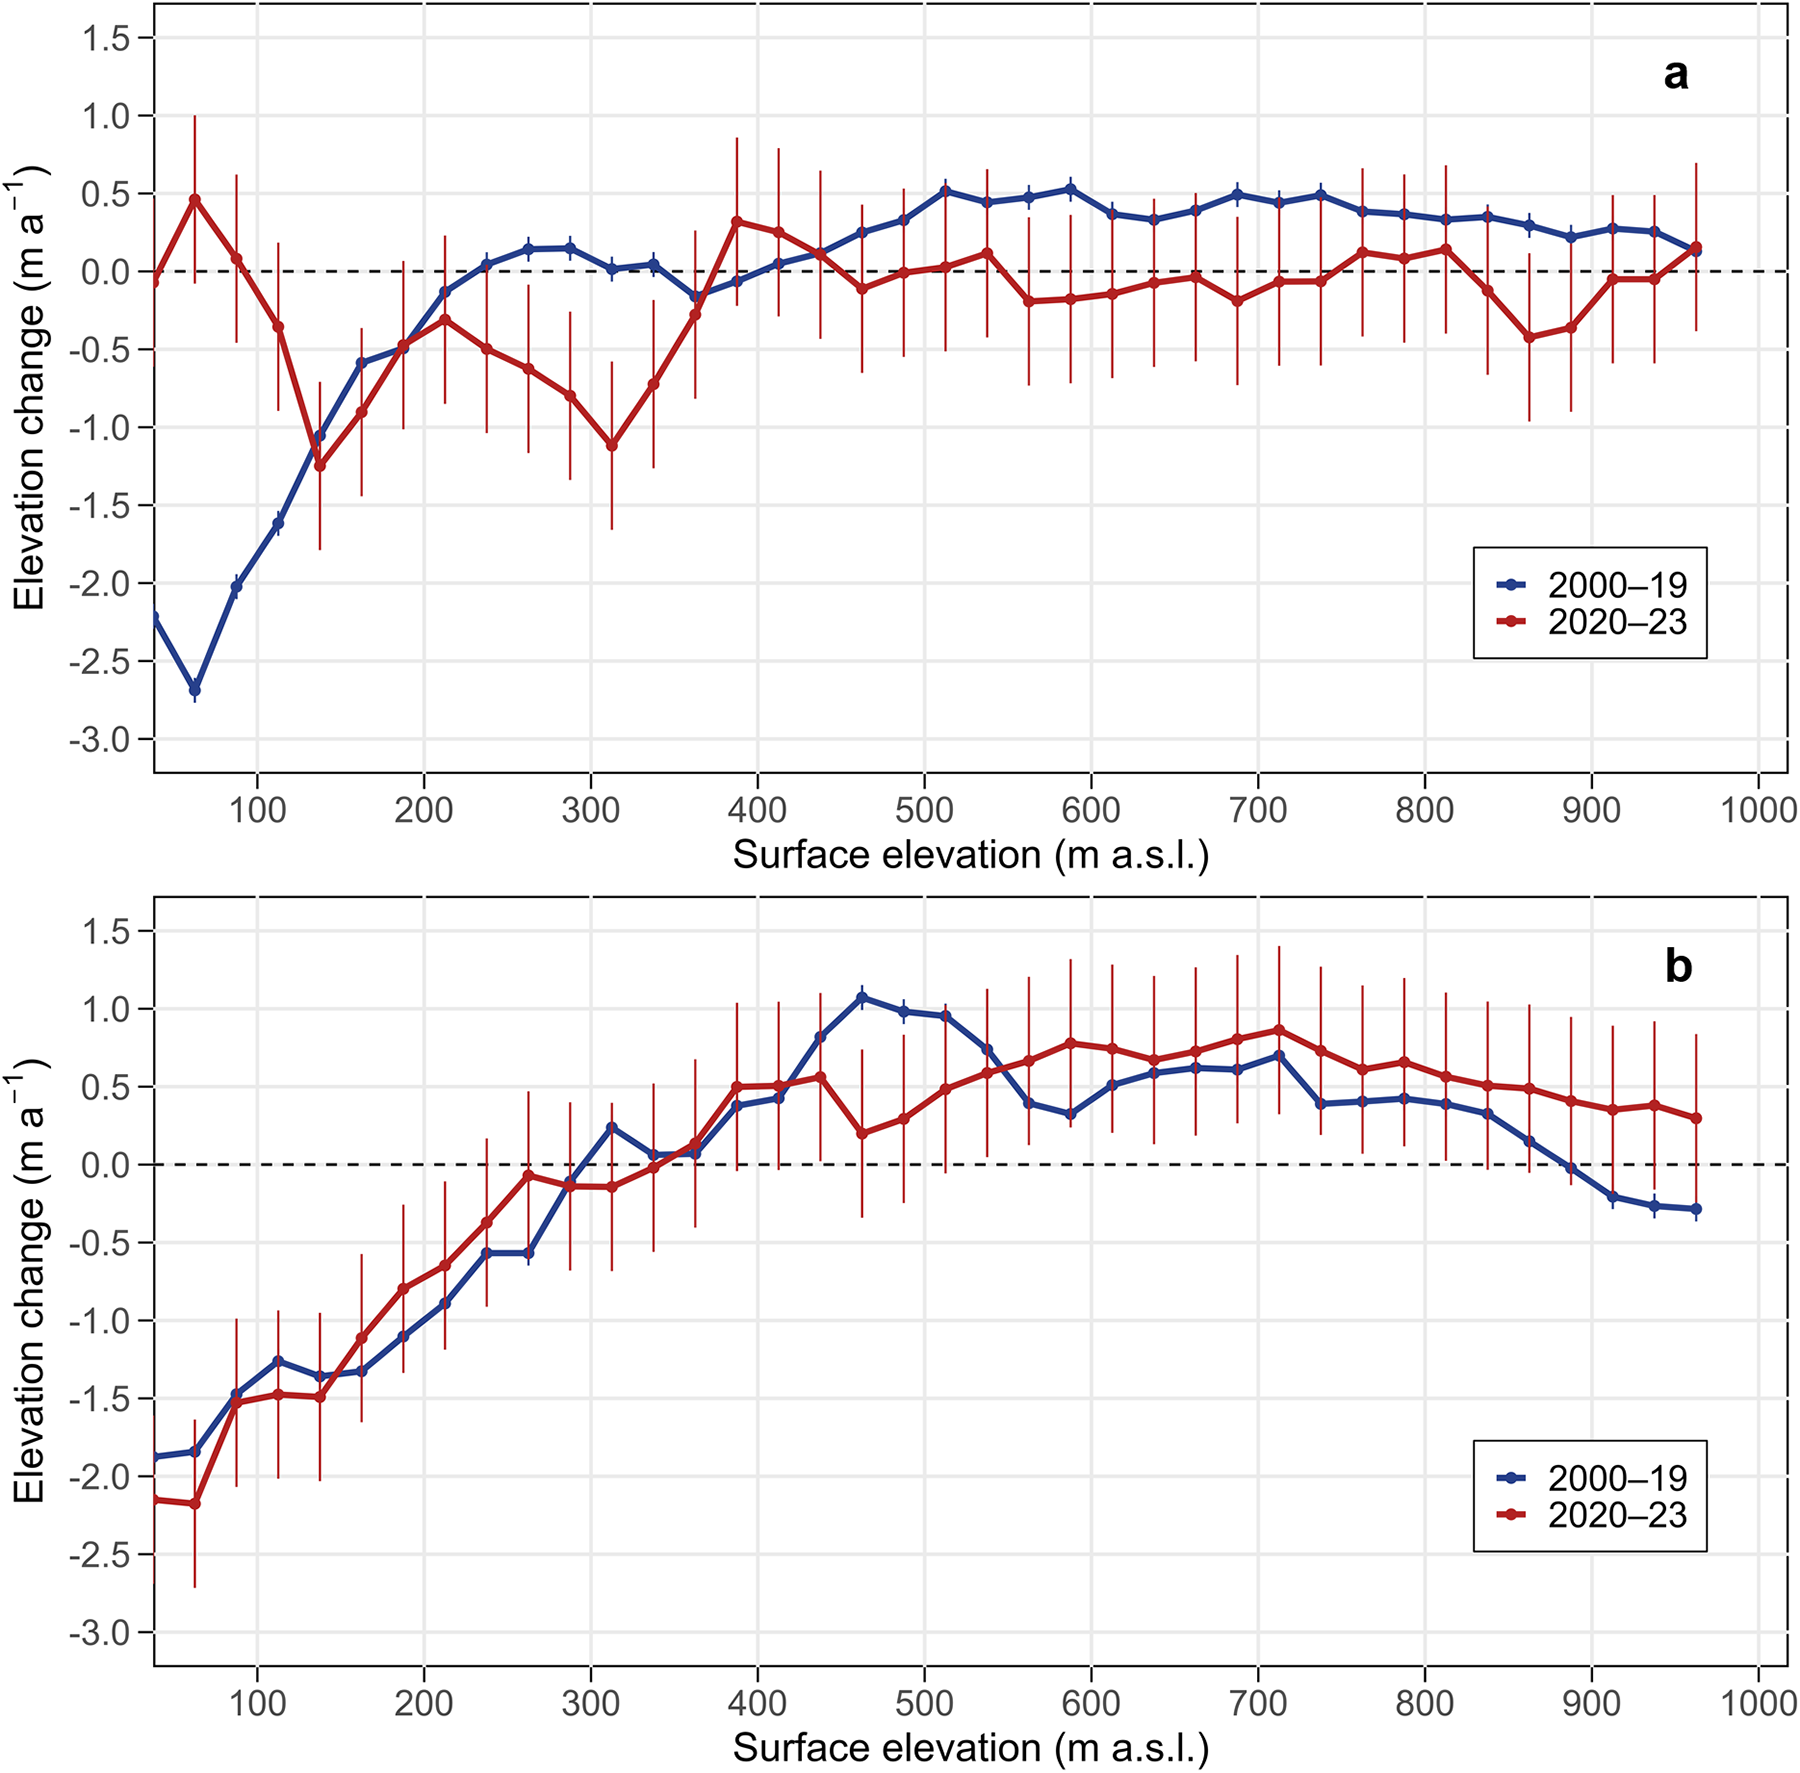
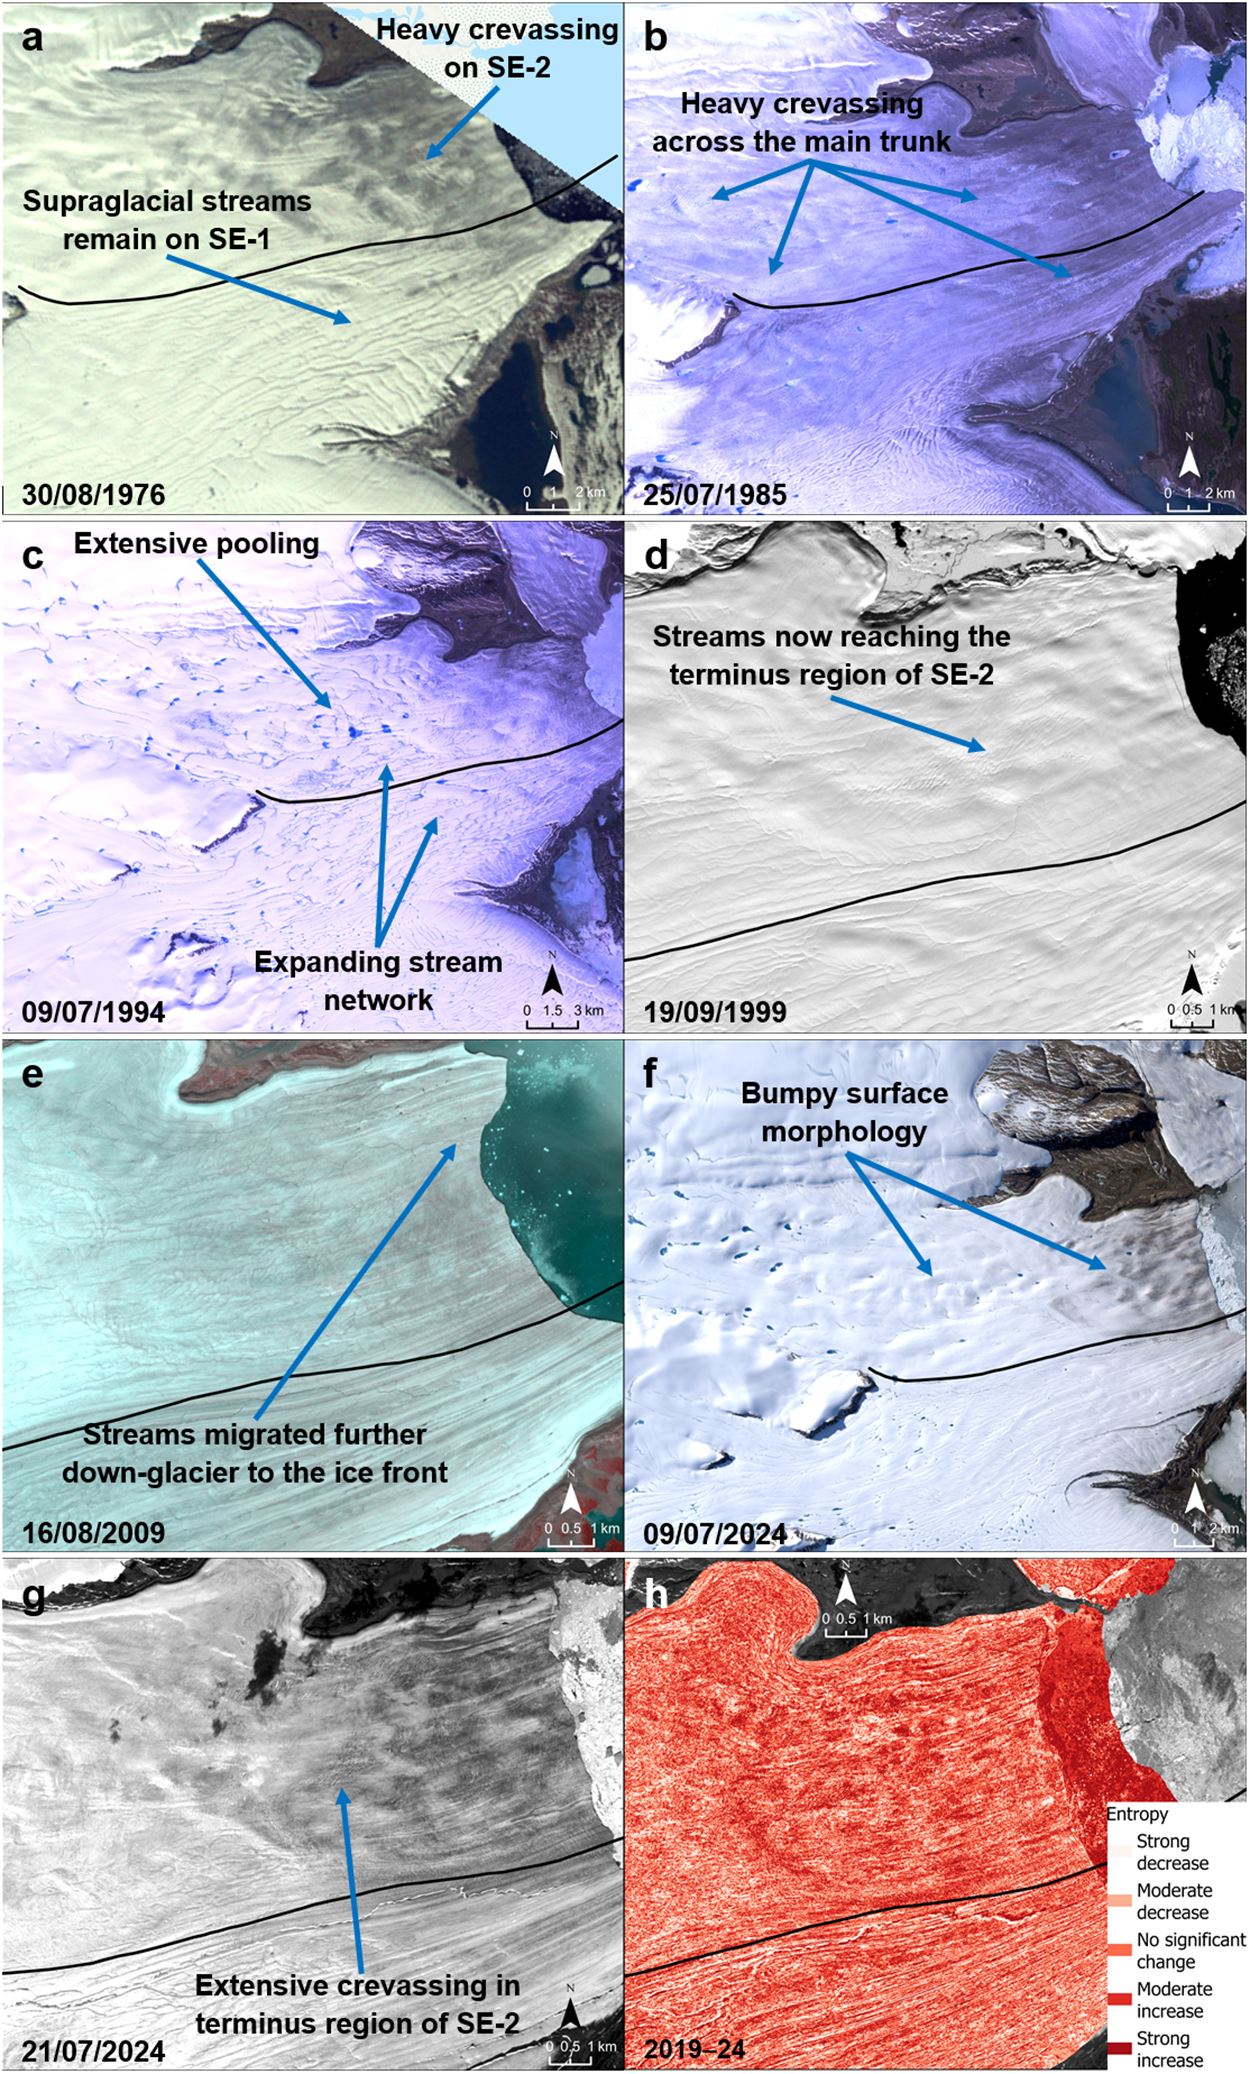
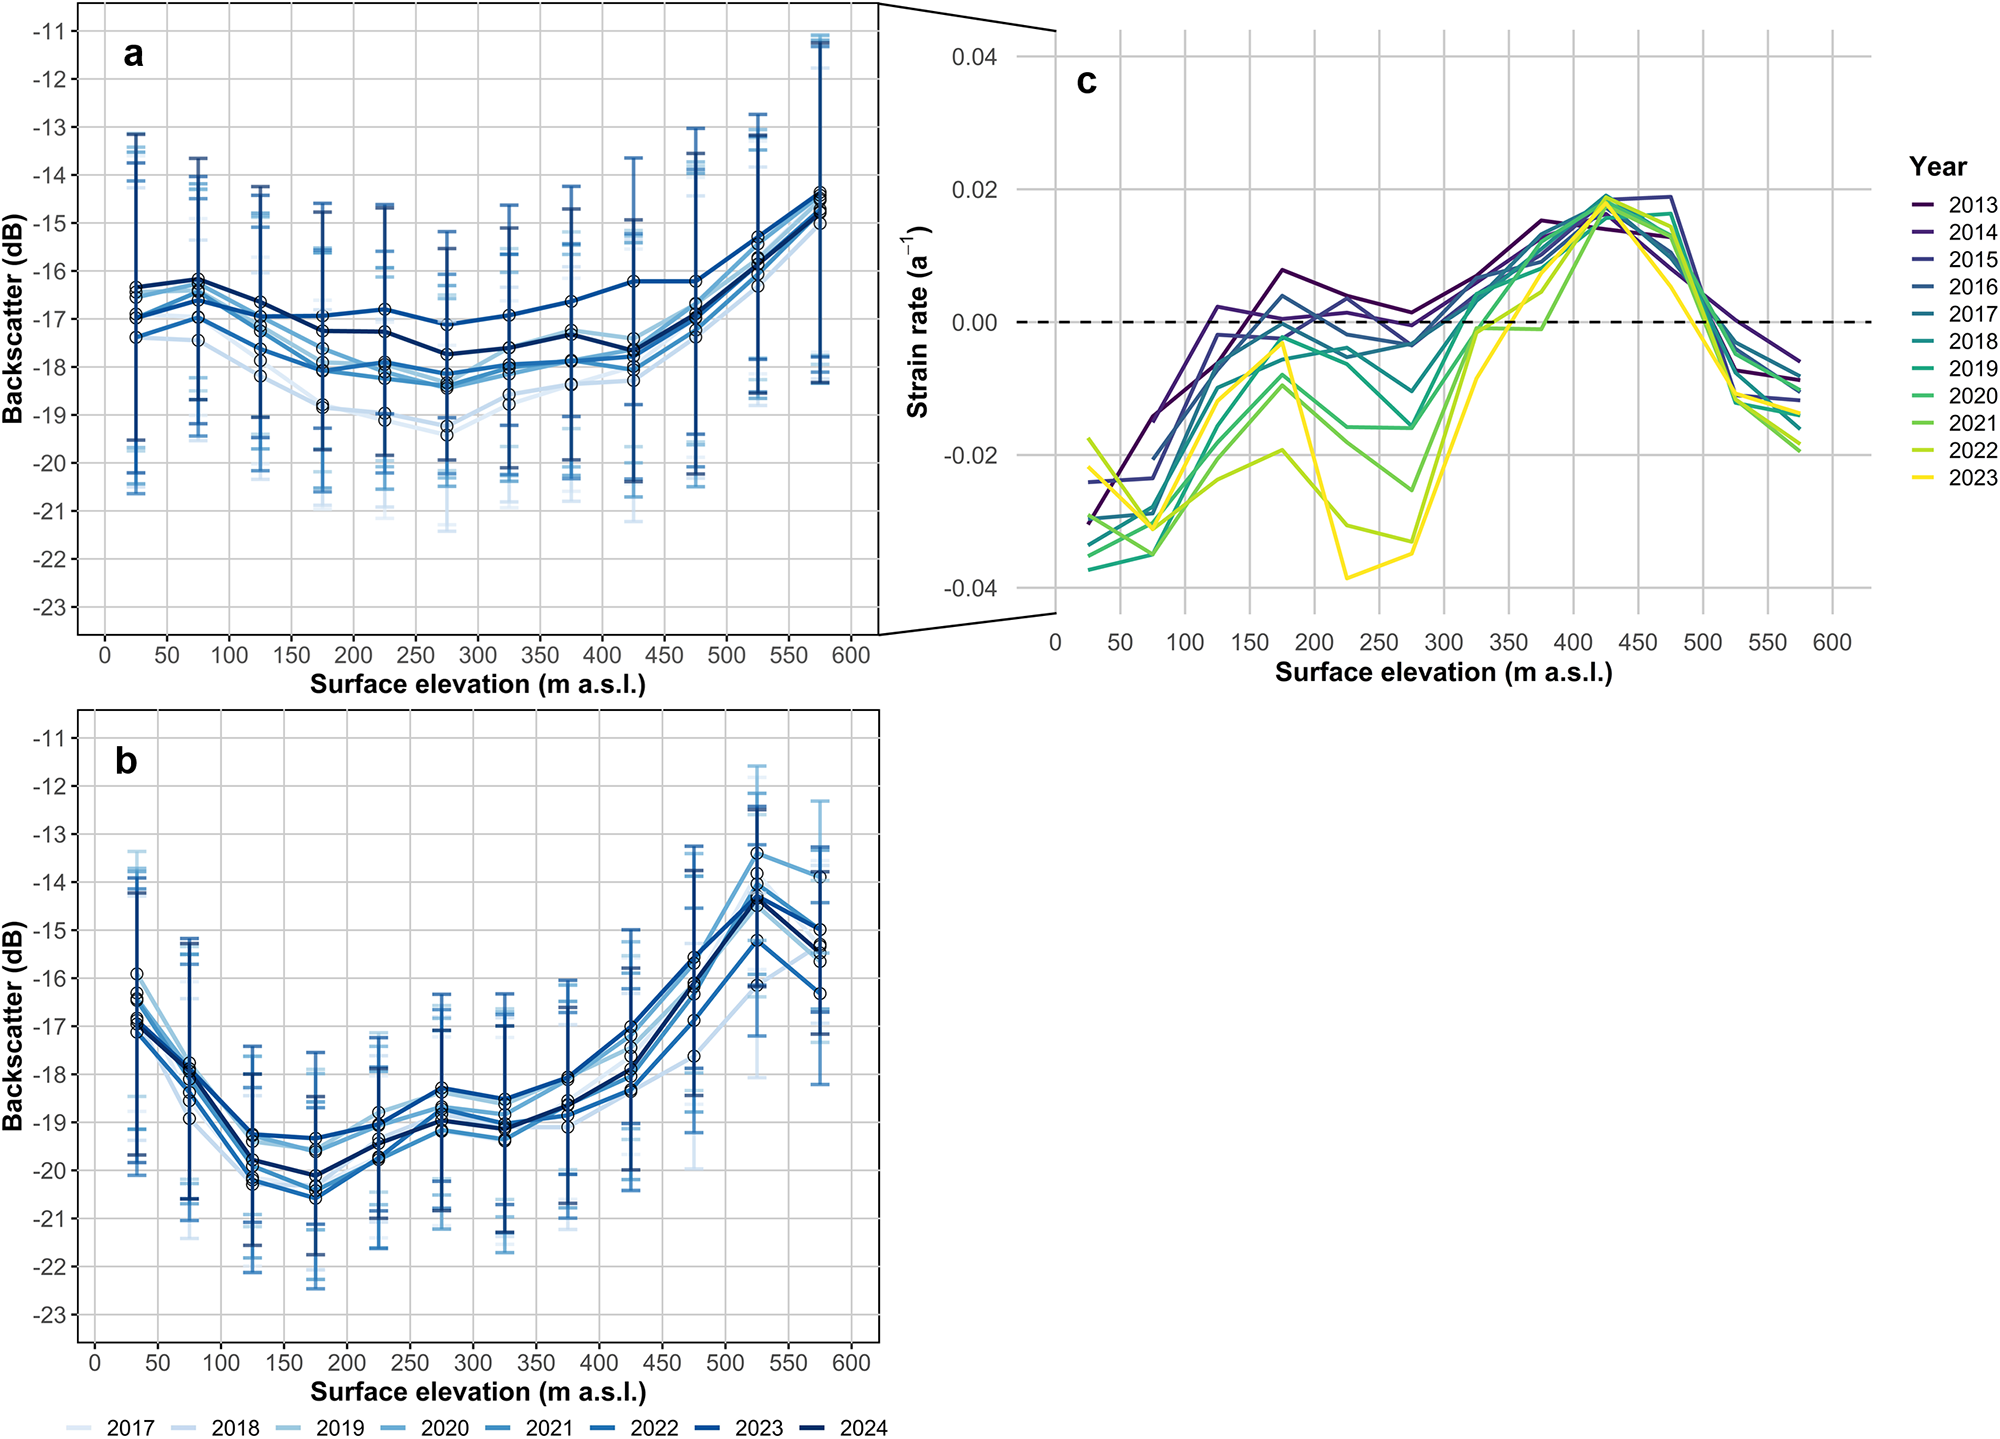
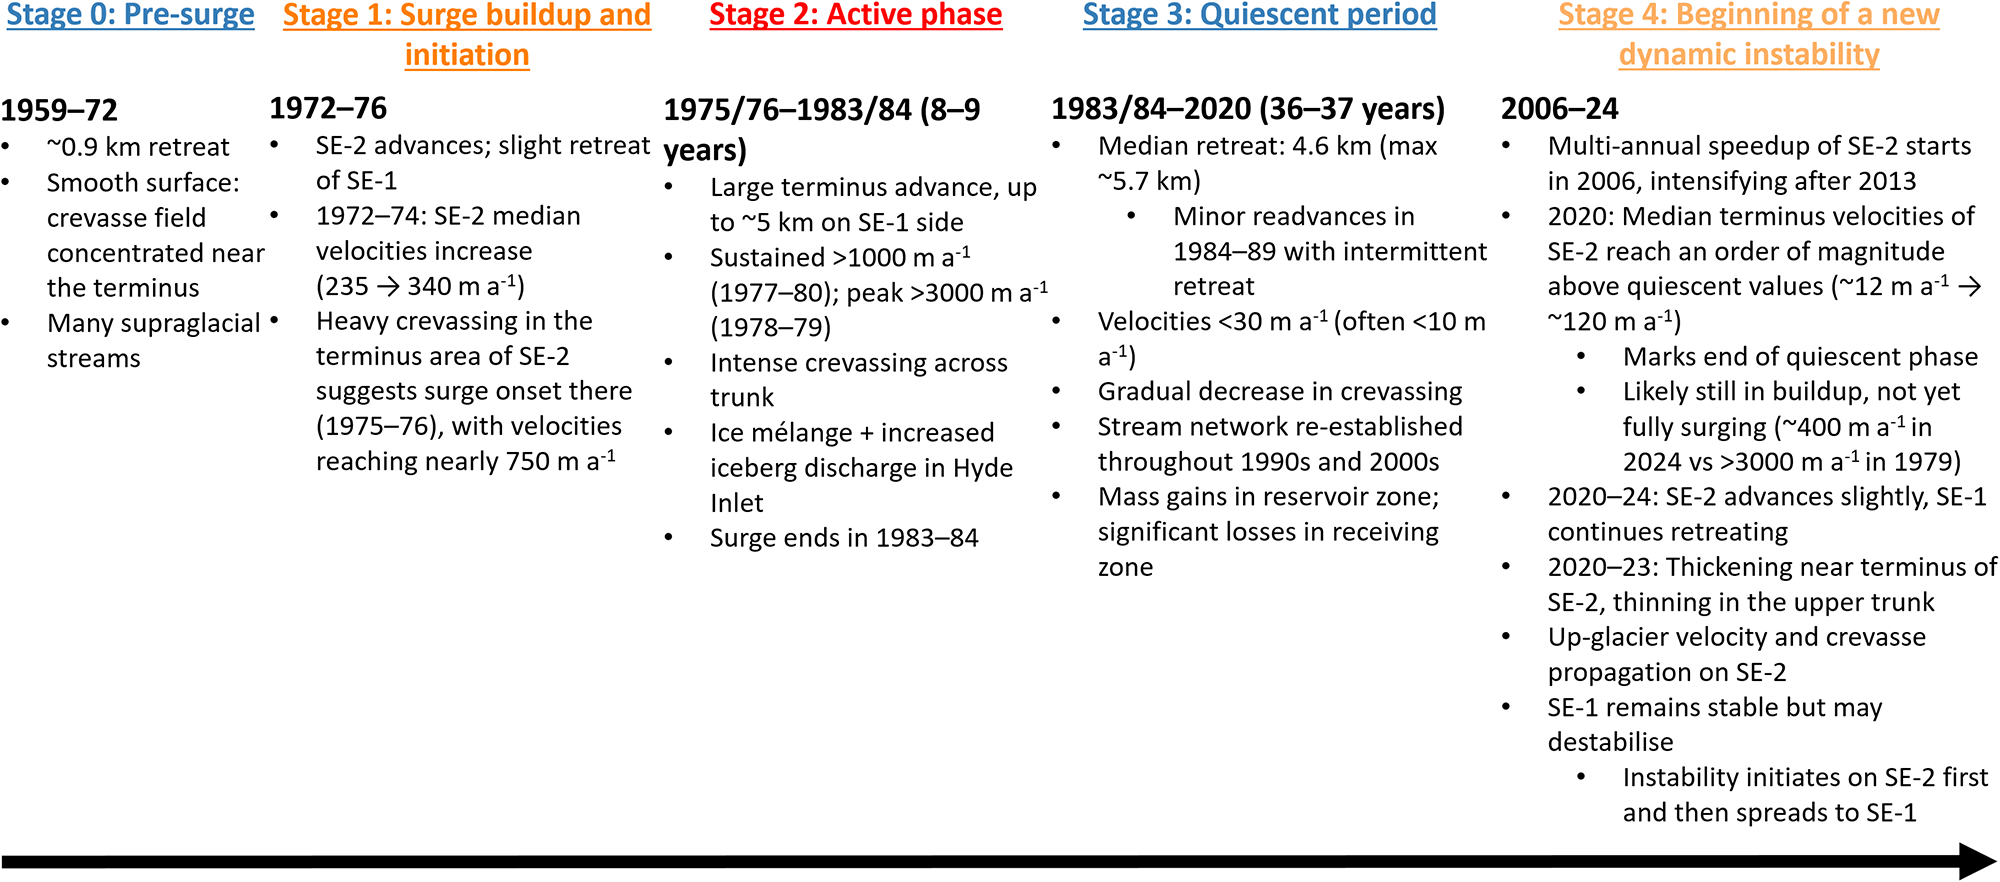
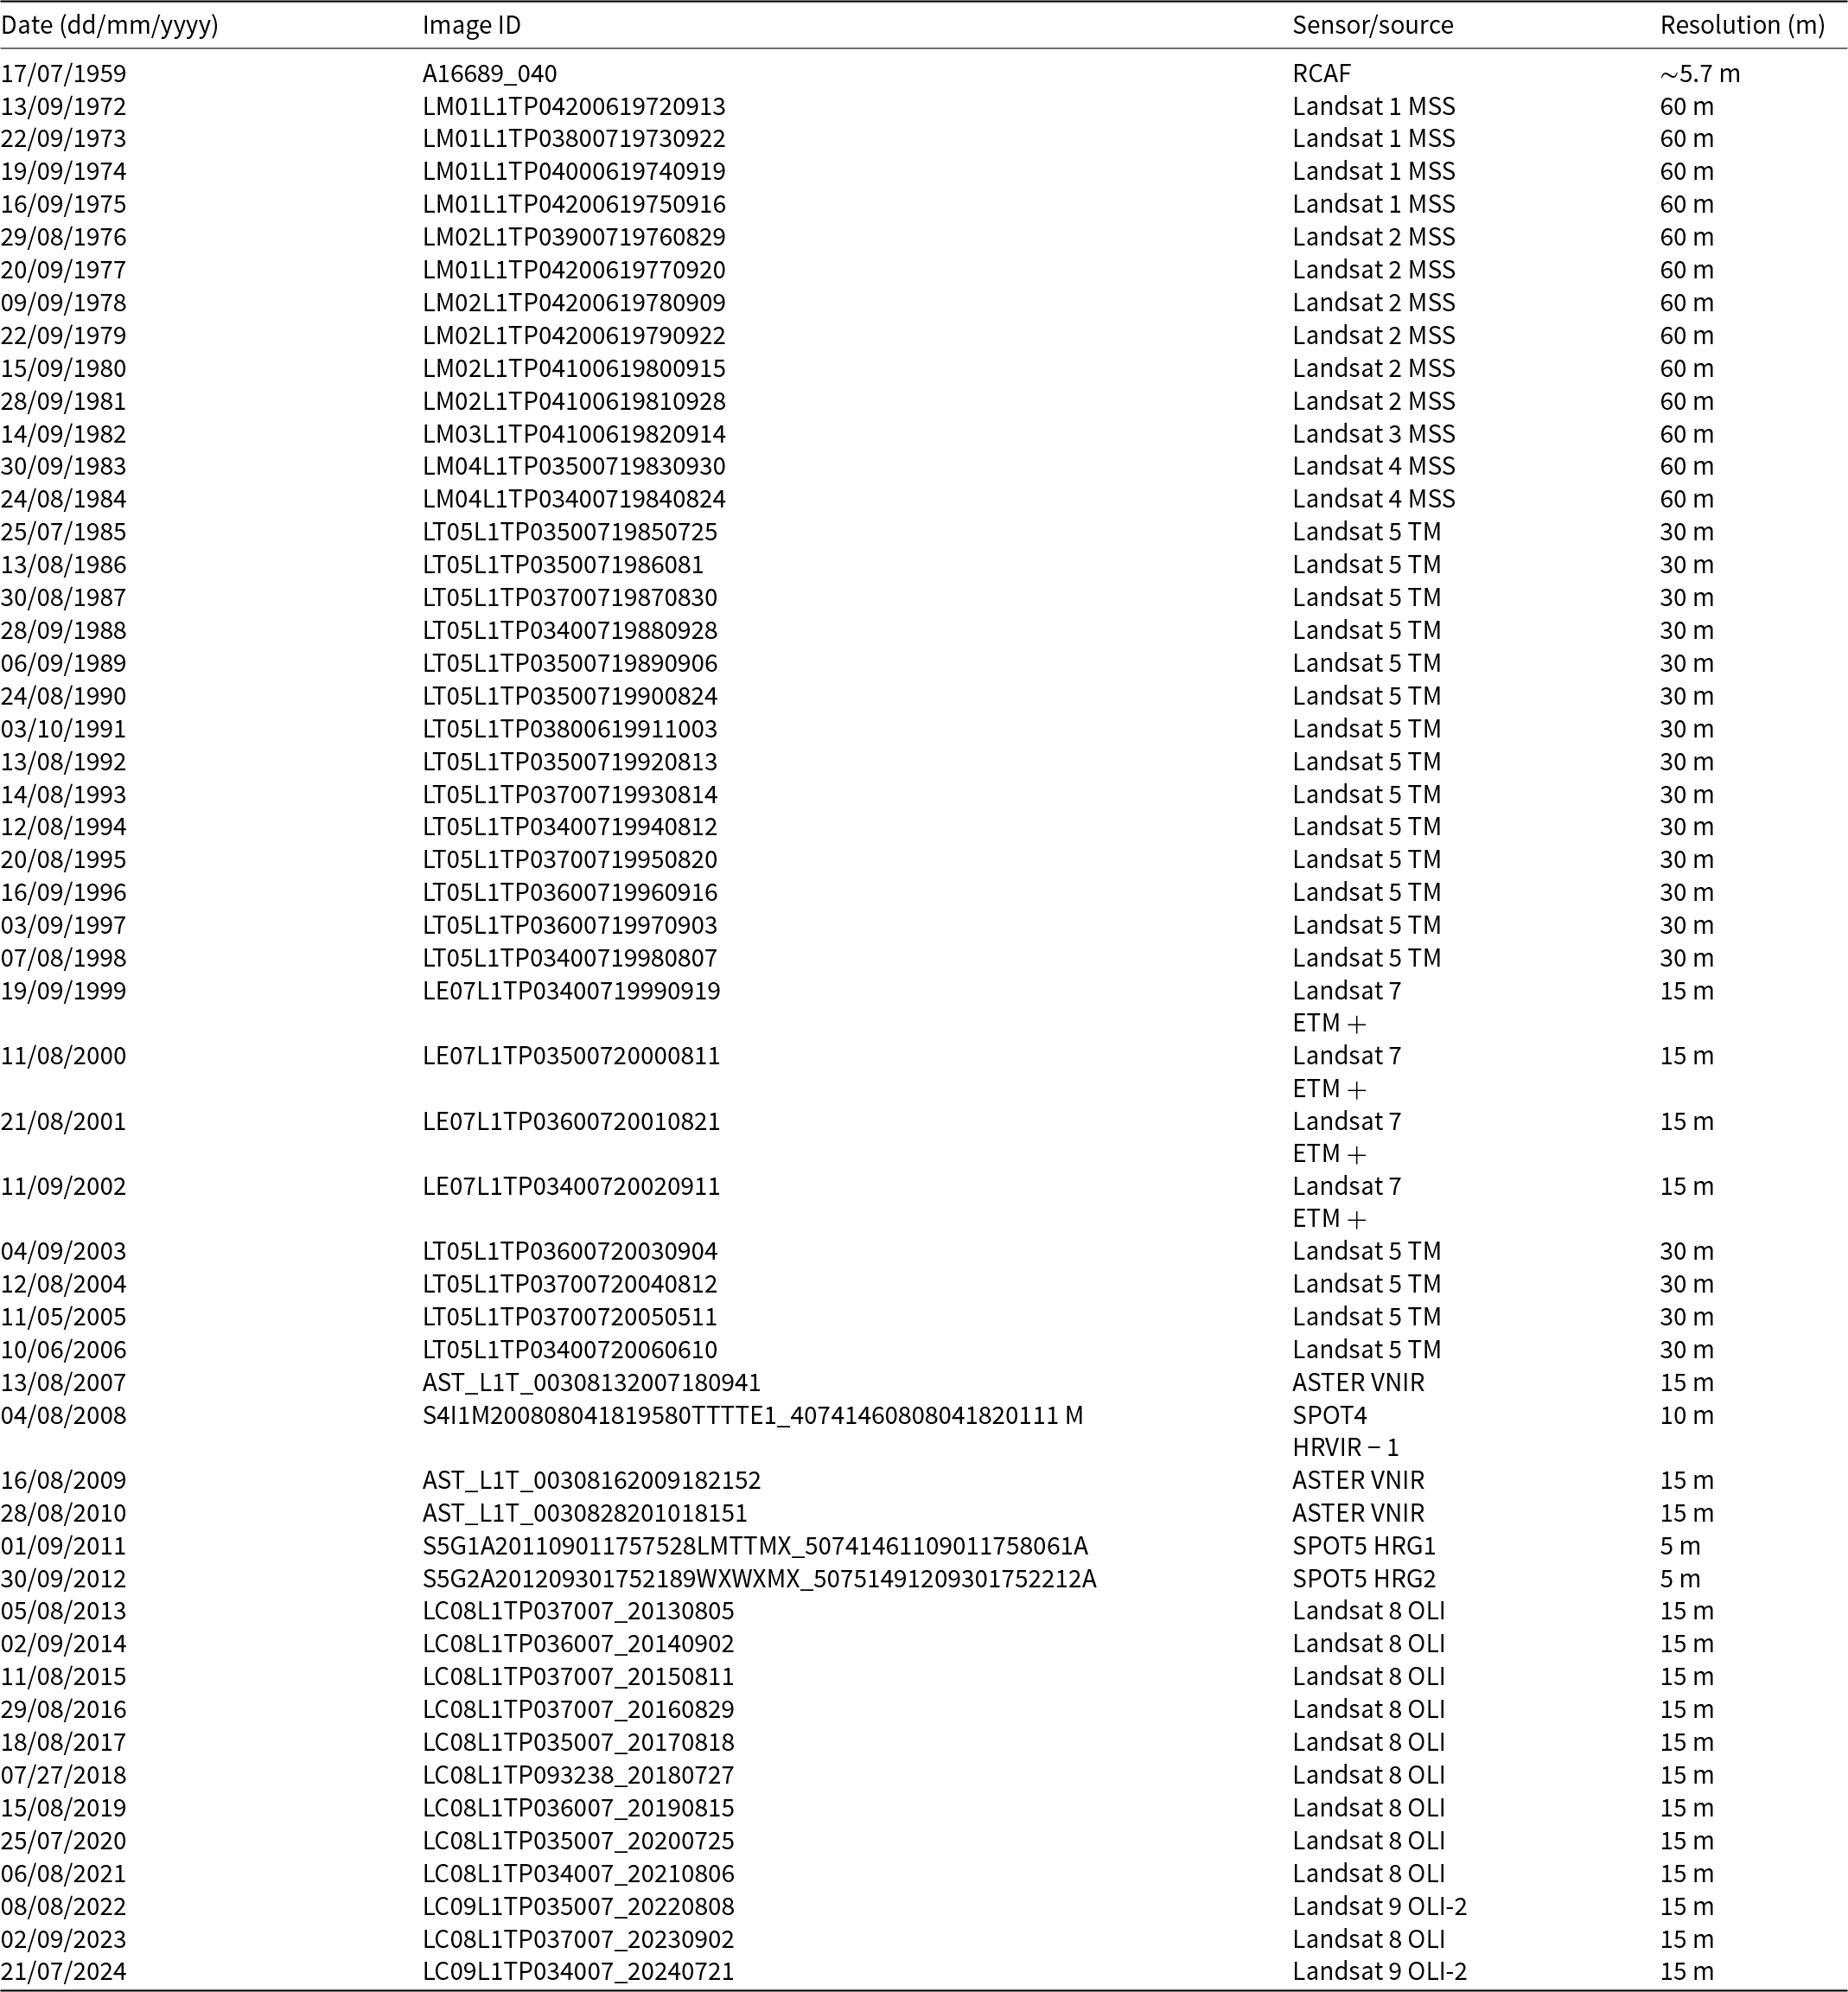
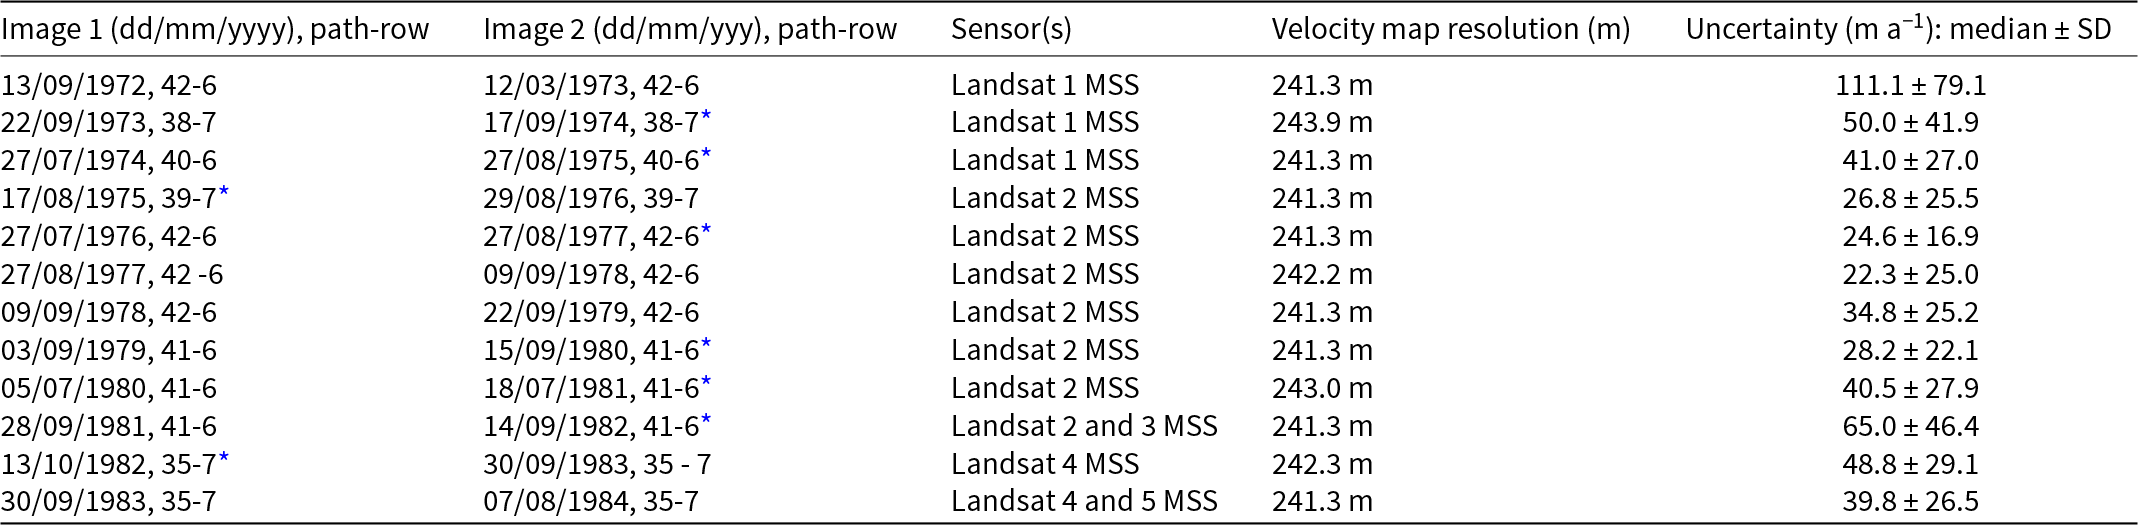

 Open access