

1. Introduction
Natural fractures – in particular, opening-mode fractures – are the most common geologic structures in many sedimentary rocks and are key components to the porosity and permeability of hydrocarbon reservoirs, aquifers and geothermal systems. Fracture prediction in subsurface strata is an important element for both resource exploration and management (Nelson, Reference Nelson2001; Narr et al. Reference Narr, Schechter and Thompson2006; Siler et al. Reference Siler, Zhang, Spycher, Dobson, McClain, Gasperikova, Zierenberg, Schiffman, Ferguson, Fowler and Cantwell2017; Gasparrini et al. Reference Gasparrini, Lacombe, Rohais, Belkacemi and Euzen2021; Prochnow et al. Reference Prochnow, Raterman, Swenberg, Reddy, Smith, Romanyuk and Fernandez2022). Natural fracture networks are products of geologic processes over long timeframes experienced by the host strata and influenced by lithology, diagenesis, burial conditions and tectonism through time (e.g., Laubach et al. Reference Laubach, Olson and Gross2009). In sedimentary rocks, lithology is considered a primary control on fracturing (e.g., Gross, Reference Gross1995; Nelson, Reference Nelson2001; Zahm et al. Reference Zahm, Zahm and Bellian2010; Rustichelli et al. Reference Rustichelli, Agosta, Tondi and Spina2013; Ferrill et al. Reference Ferrill, McGinnis, Morris, Smart, Sickmann, Bentz, Lehrmann and Evans2014; Gale et al. Reference Gale, Laubach, Olson, Eichhubl and Fall2014; McGinnis et al. Reference McGinnis, Ferrill, Morris, Smart and Lehrmann2017), and bed thickness can be an important control on fracture spacing or intensity for competent lithologies (e.g., Ladeira and Price, Reference Ladeira and Price1981; Narr and Suppe, Reference Narr and Suppe1991; McGinnis et al. Reference McGinnis, Ferrill, Morris, Smart and Lehrmann2017). Lithology and bed thickness, however, are not consistently reliable indicators or general predictors of fracture intensity or spacing (Ortega et al. Reference Ortega, Gale and Marrett2010; McGinnis et al. Reference McGinnis, Ferrill, Smart, Morris, Higuera-Diaz and Prawika2015). Previous studies have shown that for some rocks, mineralogy is a more reliable indicator of fracturing in terms of (i) presence or absence of fractures (i.e., failure occurrence; Corbett et al. Reference Corbett, Friedman and Spang1987; Hovorka, Reference Hovorka1998; Bowness et al. Reference Bowness, Cawood, Ferrill, Smart and Bellow2022; Ferrill et al. Reference Ferrill, Cawood, Smart, Lehrmann, Evans, Stockli and Stockli2025a), (ii) failure mode (Gross, Reference Gross1995; Ferrill et al. Reference Ferrill, Cawood, Evans, Smart, King and Zanoni2024), (iii) fracture intensity (Zahm et al. Reference Zahm, Zahm and Bellian2010; Ferrill et al. Reference Ferrill, Cawood, Evans, Smart, King and Zanoni2024, Reference Ferrill, Smart, Cawood, Lehrmann, Zanoni and King2025b) and (iv) spatial clustering of fractures (Gillespie et al. Reference Gillespie, Johnston, Loriga, McCaffrey, Walsh, Watterson, McCaffrey, Lonergan and Wilkinson1999, Reference Gillespie, Walsh, Watterson, Bonson and Manzocchi2001; McGinnis et al. Reference McGinnis, Ferrill, Morris, Smart and Lehrmann2017). Depositional-texture-based classifications – such as grainstone vs packstone vs wackestone vs carbonate mudstone (Dunham, Reference Dunham and Ham1962) – are extremely convenient and important for interpreting depositional environments of carbonate rocks but are not reliable predictors of mechanical behaviour. This is because the mud in these rocks can be either carbonate minerals that are strong and lead to low ductility or clay minerals that are weak and lead to high ductility (Corbett et al. Reference Corbett, Friedman and Spang1987). The distribution of clay (i.e., clay coatings on carbonate grains) can be important for inhibiting fracture formation (Hovorka, 1990; Laubach et al. Reference Laubach, Olson and Gross2009). Porosity can also be an important factor for rock strength (Smart et al. Reference Smart, Ferrill, McKeighan and Chester2023) – an uncemented (high porosity) carbonate grainstone would have lower strength than an otherwise identical calcite-cemented (low porosity) carbonate grainstone. Consequently, deformation behaviour within a single lithological category (e.g., carbonate mudstone) can vary dramatically from bed to bed within a rock sequence as a function of subtle differences in mineralogy, and in particular clay abundance (see Ferrill et al. Reference Ferrill, Cawood, Evans, Smart, King and Zanoni2024) and distribution (Hovorka, Reference Hovorka1998). Because the fracture network developed in rock can vary as a function of numerous factors, studies where multiple potential factors are the same (e.g., burial history, tectonic history and structural position) can be particularly important for isolating the specific influence of certain factors on fracture system development. In this study, we analyse fracture networks in a horizontally bedded Permian limestone and shale section in the Eastern Shelf of the Permian Basin of west-central Texas to isolate the lithologic and mineralogic – mechanical stratigraphic – controls on fracture networks. The results show that opening-mode fracturing in limestone and shale is highly sensitive to mineralogy and that a mineralogic threshold approach may be valuable for fracture prediction.
2. Geologic setting
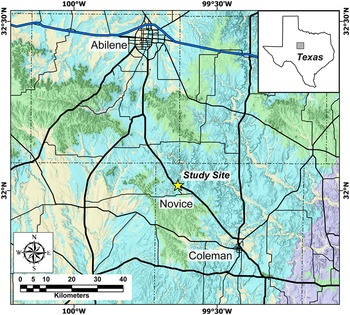
This investigation focuses on a WNW-ESE trending roadcut exposure of the Leonardian Talpa Formation on the north side of US-84 at the intersection of FM-702, approximately 3.25 km north-northwest of Novice, Texas. The Novice roadcut exposes the Permian Talpa Formation (Leonard Series) of the Eastern Shelf region of the Permian Basin (Figure 1). Originally considered a limestone member of the Clyde Formation of the Albany Group, the Talpa unit was later elevated to Formation rank (Cheny, Reference Cheney1940).
Map showing the location of the Novice study site within the Permian outcrop belt (blue shading) in the Eastern Shelf region. Geologic map units are as follows: yellow = Quaternary, green = Cretaceous, blue = Permian, and purple = Pennsylvanian. The inset map shows the area of the geologic map (grey box) with respect to Texas.

Figure 1. Long description
A geologic map of the Eastern Shelf region in west-central Texas, highlighting the Novice study site within the Permian outcrop belt. The map includes various geologic units color-coded as follows: yellow for Quaternary, green for Cretaceous, blue for Permian, and purple for Pennsylvanian. The study site is marked with a yellow star. Key locations labeled on the map include Abilene, Novice, and Coleman. The inset map shows the area of the geologic map within Texas, with the study area indicated by a grey box. The map also features a compass rose for orientation and a scale bar for distance measurement.
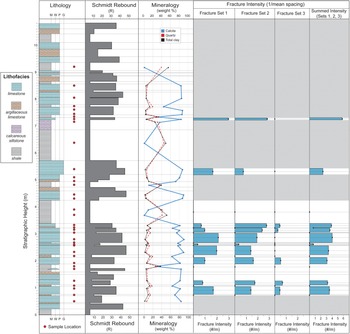
The Novice section of the Talpa Formation consists of medium- to thick-bedded massive fossiliferous lime wackestone to grainstone beds and argillaceous lime mudstone to packstone beds intercalated with medium- to very-thick calcareous mudstone and shale intervals (Figures 2 and 3). The limestone shale alternations are interpreted to represent stratigraphic cycles (parasequences) driven by relatively low-amplitude sea-level fluctuations in a non-glacial greenhouse climate period during the transition from the Pennsylvanian-Early Permian icehouse to the Late Permian greenhouse (Holterhoff, Reference Holterhoff2010). Siliciclastic clay (shale) was delivered onto the shelf during sea-level lowstand, whereas carbonate sediment accumulation thrived during diminished siliciclastic delivery during sea-level highstands in a cyclic-reciprocal pattern. Argillaceous limestone beds in some cases underlie or overlie shale intervals in the cyclicity (Figure 3), consistent with sea-level modulation of delivery of siliciclastic clay to the environment. Siliciclastic clay content does not appear to be correlated with Dunham carbonate texture except that the one grainstone bed has minimal clay content (Figure 3).
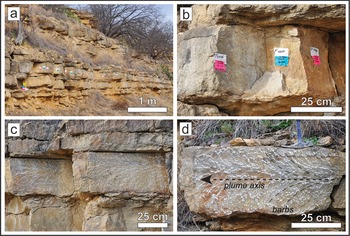
Outcrop photographs of the Novice exposure: (a) The lower part of exposure with fractures in a single bed (bed top and bottom stratigraphic heights are 3.03 and 2.68 m, respectively) is marked with pink (Set 1 fractures) and blue (Set 2 fractures) tape (see text for further discussion of fracture sets). (b) Detail of fractures and fracture intersections. (c) Plumose markings on two Set 1 fractures highlighted by rubbing with white chalk. (d) Detail of plumose markings on a Set 1 fracture highlighted by rubbing with white chalk. Barbs on the plume converge toward the right at the plume axis near the centreline of the bed (e.g., Rysak et al. Reference Rysak, Gale, Laubach and Ferrill2022). Based on the barb and plume axis geometries, the fractures with plumose structures in c and d propagated laterally from right (northeast) to left (southwest).

Lithostratigraphy panel showing measured section, rebound profile, and graphs of weight % abundance for major minerals (calcite, quartz, total clay) and fracture intensity profiles. M = mudstone, W = wackestone, P = packstone, G = grainstone. In “Fracture Intensity” columns, dashed lines indicate scanline positions; black dots and blue-filled bars represent measured fracture intensity for systematic fracture sets; and grey shading indicates beds that were not surveyed.

These beds were buried by younger Permian and Cretaceous overburden. Tectonically, the Eastern Shelf region has been relatively quiet through the Permian to present (Ewing, Reference Ewing2016). Since the Cretaceous Period, these rocks have progressively been exhumed by erosion. In the adjacent Permian Basin to the west, far-field stress from the Laramide orogeny has been attributed to producing northeast-directed maximum horizontal stress. This stress led to the formation of vertical northeast–southwest-striking opening-mode fractures – as part of either a normal-faulting or strike-slip stress regime – that dominate the mesoscale structure of the Midland Basin (Lorenz et al. Reference Lorenz, Sterling, Schechter, Whigham and Jensen2002; Forand et al. Reference Forand, Heesakkers and Schwartz2017; Gale et al. Reference Gale, Elliott and Laubach2018) and are also common across the Delaware Basin (King et al. Reference King1948; Erdlac, Reference Erdlac1993; Forand et al. Reference Forand, Heesakkers and Schwartz2017; Ginn et al. Reference Ginn, Wilkins and Liu2017; Ferrill et al. Reference Ferrill, Cawood, Evans, Smart, King and Zanoni2024). Locally conjugate strike-slip shear or hybrid fractures – indicative of a strike-slip stress regime – in the Midland Basin have been documented (Lorenz et al. Reference Lorenz, Sterling, Schechter, Whigham and Jensen2002). Northeast–southwest-striking vertical opening-mode fractures are common in outcropping strata across the Eastern Shelf, as are orthogonal northwest-southeast-striking vertical opening-mode fractures (Forand et al. Reference Forand, Heesakkers and Schwartz2017; Gale et al. Reference Gale, Elliott and Laubach2018), likely reflecting subtle far-field deformation in the Laramide foreland (Ferrill et al. Reference Ferrill, Smart, Cawood and Morris2021).
3. Methods
3.a. Lithostratigraphy, mechanical stratigraphy, mineralogy, spectral gamma
Critical to this study and for future applications is establishing a cm-scale lithostratigraphic section to provide context for the fracture data. The lithostratigraphic section was measured and described in the field, and samples were collected for standard thin-section petrography and for mineralogic analysis using X-ray diffraction (XRD). Field descriptions distinguished between limestone, argillaceous limestone, calcareous siltstone and shale. Following the classification of Dunham (Reference Dunham and Ham1962), limestones and argillaceous limestones were further categorised as grainstone (grain-supported with no carbonate mud), packstone (grain-supported with carbonate mud), wackestone (carbonate mud-supported with >10% grains) and carbonate mudstone (carbonate mud-supported with <10% grains). Thin-section petrographic analyses were used to verify the field-based descriptions of the lithostratigraphic units. Schmidt rebound data were collected using an N-type Schmidt hammer (10 measurements per position) as a field measure of mechanical competence, and these measurements were averaged to plot a mean rebound profile following the approach of Morris et al. (Reference Morris, Ferrill and McGinnis2009). XRD mineralogic analyses were performed by Ryan King at Ellington Geological Services – following the methodology described in Ferrill et al. (Reference Ferrill, Cawood, Evans, Smart, King and Zanoni2024) – and results expressed in terms of mineral weight percentage.
3.b. Fracture data
Fracture data were systematically collected from 20 beds from the Novice exposure with a focus on acquiring a dataset representative of the range of lithologies and bed thicknesses present in the exposure. Eighteen of the surveyed beds form a continuous section in the lower part of the outcrop that was well exposed and safely accessible. Two additional beds higher in the section were surveyed where safely accessible as examples of a carbonate grainstone bed and a thin carbonate wackestone bed. For each surveyed bed, fractures were marked using coloured duct tape, with each set marked by a unique tape colour, and individual fracture identification numbers marked on tape representing each fracture. Data collection included measuring strike and dip for each fracture and position of fractures (spacings) along the scanline (cf. Marrett et al. Reference Marrett, Gale, Gomez and Laubach2018) coincident with the bed centerline, enabling analysis of spatial clustering (Gillespie et al. Reference Gillespie, Johnston, Loriga, McCaffrey, Walsh, Watterson, McCaffrey, Lonergan and Wilkinson1999, Reference Gillespie, Walsh, Watterson, Bonson and Manzocchi2001). We also recorded field observations regarding vertical fracture penetration and termination for each bed surveyed. Weathering of the outcrop has caused apparent and variable fracture dilation (including some block toppling), and consequently, we decided to not attempt aperture measurement (e.g., Eppes et al. Reference Eppes, Rinehart, Aldred, Berberich, Dahlquist, Evans, Keanini, Laubach, Moser, Morovati, Porson, Rasmussen and Shaanan2024). In addition to these bed-specific fracture spacing datasets, we surveyed the outcrop for fractures with (i) mineralisation (rare) for potential additional research and (ii) plumose markings (common in several beds), which are considered a diagnostic feature of opening-mode fractures (Hancock, Reference Hancock1985). For fractures with plumose markings, we measured the strike and dip of the fractures and recorded the host beds where these plumose fractures are present.
4. Results
4.a. Lithostratigraphy and mechanical stratigraphy
We developed a centimetre-scale measured section of the Novice exposure, including 52 beds representing 11.8 m of Talpa Formation section consisting of limestone, siltstone and shale (Figure 3). Limestone (dominantly skeletal packstone with less common grainstone and wackestone) and argillaceous limestone beds are generally 10–50 cm thick, and siliciclastic shale beds range from 3 to 100 cm thick. Thin-section observations indicate that siliciclastic clay and silt content occurs within the carbonate mud matrix of argillaceous limestone beds. In terms of in situ mechanical character, limestone beds are generally competent, with mean Schmidt rebound values generally ranging from 20 to 40, whereas argillaceous limestone and shale beds are incompetent with mean rebound values of <10 (Figure 3).
4.b. Mineralogy
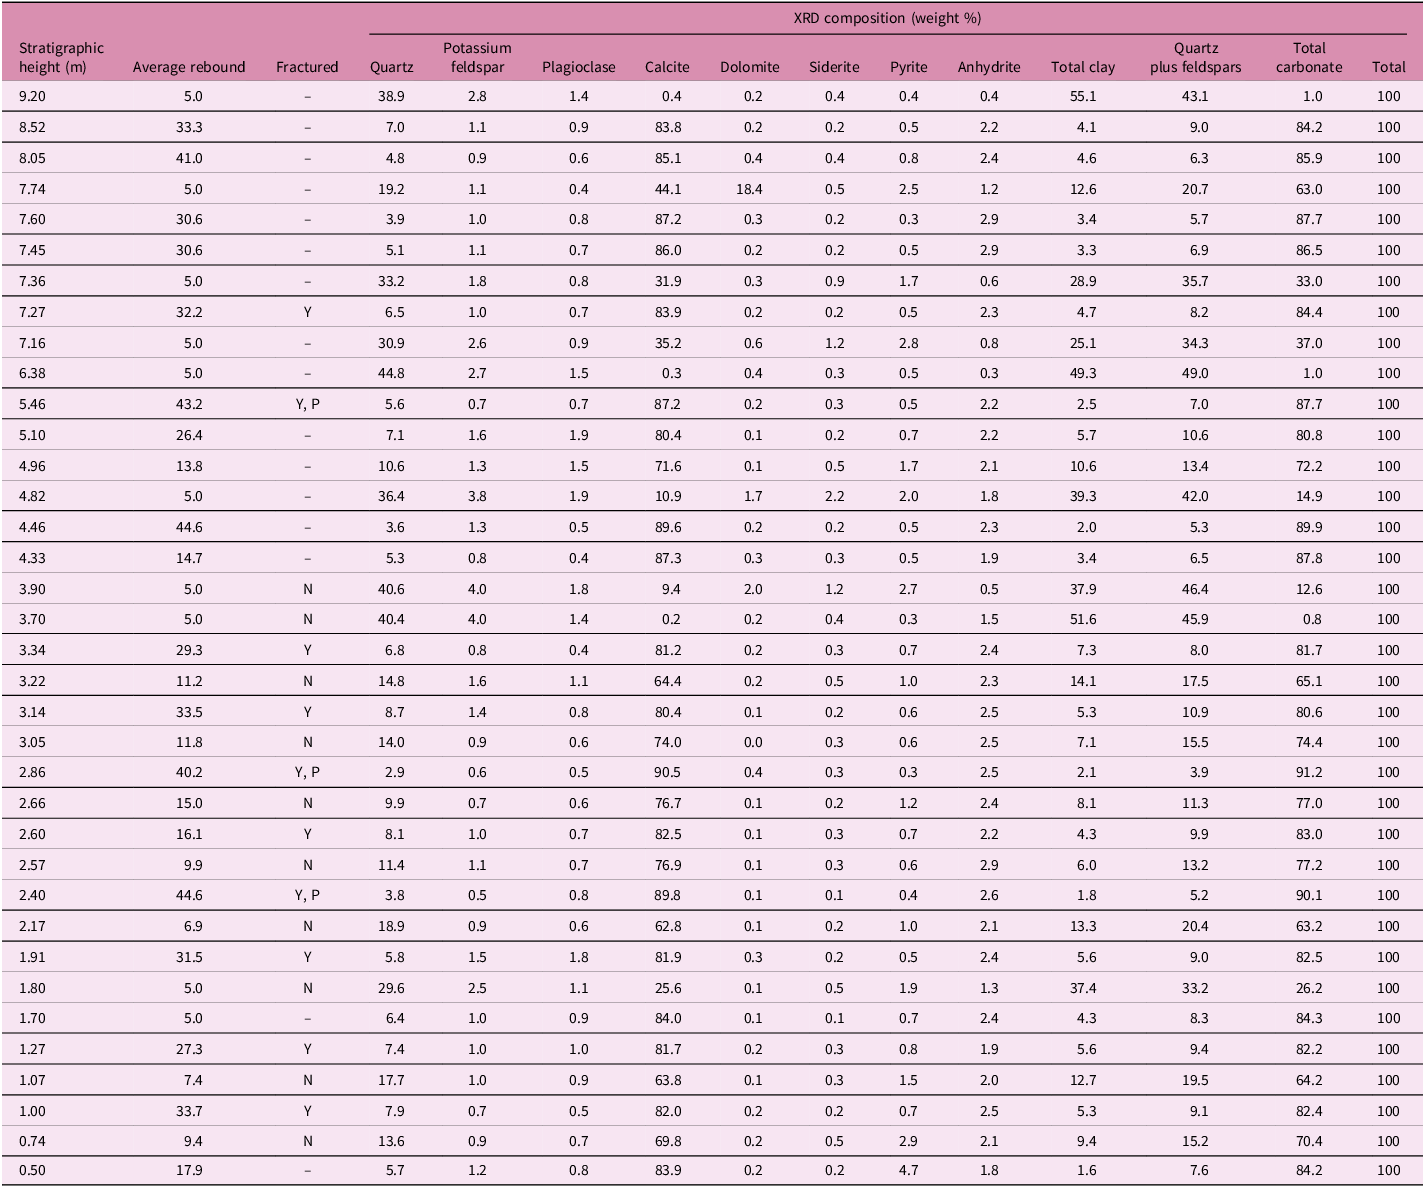
XRD mineralogic analysis was performed on 35 samples from the Novice exposure, including all of the beds included in the detailed fracture surveys. Strata are dominated by calcite, quartz and clay minerals, with minor contributions from potassium feldspar, plagioclase, dolomite, siderite, pyrite and anhydrite (Table 1). Quartz (also quartz + feldspar) exhibits a very strong positive correlation with total clay, and calcite exhibits a very strong negative correlation with total clay (Figure 3). Total clay exhibits a strong negative relationship with rebound (Figure 3), generally consistent with the results of previous studies (e.g., Ferrill et al. Reference Ferrill, Morris, McGinnis, Smart and Ward2011, Reference Ferrill, Cawood, Smart, Lehrmann, Rysak Bryce, Evans, Stockli and Stockli2026; McGinnis et al. Reference McGinnis, Ferrill, Morris, Smart and Lehrmann2017).
Mineralogy data for beds in the Talpa Formation at the Novice exposure. In the “Fractured” column, “Y” and “N” indicate Yes or No, respectively, and “P” indicates the presence of plumose markings – data from the fracture survey of these beds are included in Table 2. “–” in the “Fractured” column indicates the bed is not analysed for fractures

Table 1. Long description
A table titled ‘Mineralogy data for beds in the Talpa Formation at the Novice exposure’ with 35 rows and 15 columns. The columns are labeled as follows: Stratigraphic height (m), Average rebound, Fractured, XRD composition (weight percent) with sub-columns for Quartz, Potassium feldspar, Plagioclase, Calcite, Dolomite, Siderite, Pyrite, Anhydrite, Total clay, Quartz plus feldspar, Total carbonate, and Total. The ‘Fractured’ column includes ‘Y’, ‘N’, and ‘P’ indicating Yes, No, and the presence of plumose markings respectively, and dashes indicating beds not analyzed for fractures. Each row provides data for different stratigraphic heights, showing the average rebound, fracture status, and the weight percent of various minerals. Notable trends include variations in calcite, quartz, and clay minerals across different stratigraphic heights.
4.3. Fracture data
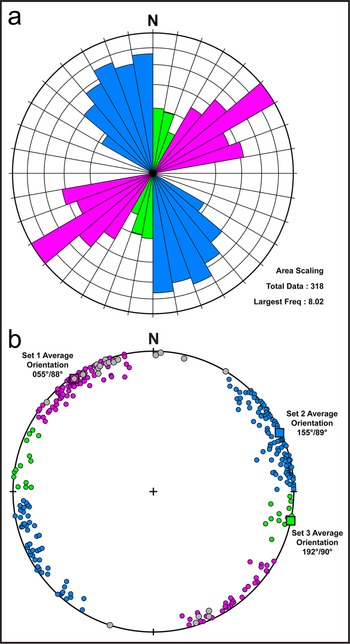
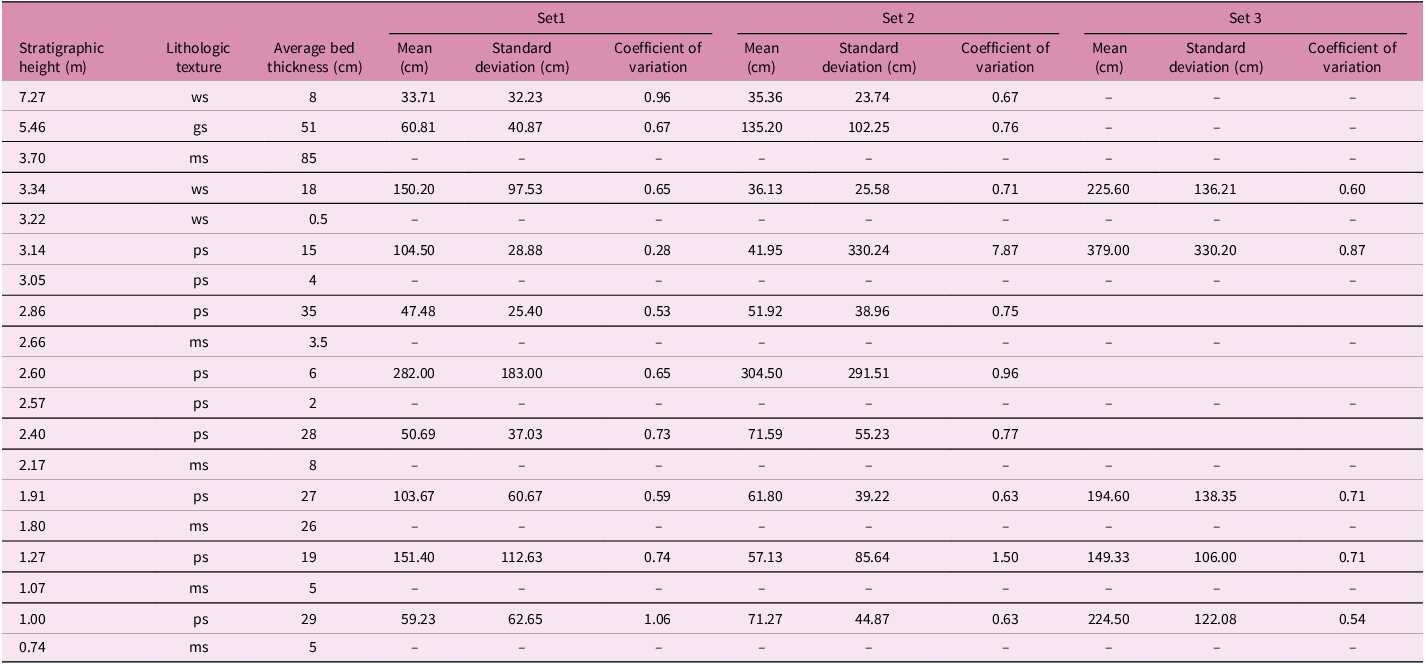
Fractures at the Novice exposure are primarily barren opening-mode joints, with only rare calcite mineralization on fracture faces. In the fractured beds, fractures generally cut the entire thickness of the bed and terminate at or near lithologic bed boundaries (Figure 2a,b; most similar to “perfect bed-bounded” using the terminology of Hooker et al. Reference Hooker, Laubach and Marrett2013). Two dominant fracture sets are present in each of the fractured beds (Figure 4): Set 1 fractures strike northeast–southwest (strike range = 030°–080°; average orientation = 055°/88°), and Set 2 fractures strike northwest–southeast (strike range = 120°–180°; average orientation = 155°/89°). Set 2 fractures abut against the Set 1 fractures, indicating that Set 1 fractures developed prior to Set 2 fractures. An additional subordinate set of fractures, Set 3, that strike north-northeast – south-southwest (strike range = 000°–030°; average orientation = 192°/90°) was recorded in five of the fractured beds, with relatively low intensities compared with Sets 1 and 2 (Table 2).
(a) Rose diagram showing fracture data from Sets 1, 2, and 3 collected in bed-specific fracture surveys. (b) Stereonet showing fracture poles colour-coded for Sets 1, 2, and 3 in bed-specific fracture surveys. Grey dots represent fractures with plumose markings measured throughout exposure.

Figure 4. Long description
Panel A: A rose diagram displays fracture data from Sets 1, 2, and 3. The diagram uses area scaling to represent the frequency of fractures, with the total data points being 318 and the largest frequency being 8.02. The fractures are color-coded into three sets: blue, pink, and green. Panel B: A stereonet shows fracture poles color-coded for Sets 1, 2, and 3. Grey dots represent fractures with plumose markings measured throughout the exposure. The average orientations for Set 1, Set 2, and Set 3 are 655/88, 155/89, and 192/90 degrees, respectively.
Fracture spacing data from the Novice exposure fracture surveys, including the coefficient of variation (CV). “–“ indicates no systematic fractures. ms = mudstone, ws = wackestone, ps = packstone, gs = grainstone

Coefficient of variation (Cv) is calculated as the ratio of the standard deviation of fracture spacing to the mean spacing to quantify variability in fracture spacing (Gillespie et al. Reference Gillespie, Johnston, Loriga, McCaffrey, Walsh, Watterson, McCaffrey, Lonergan and Wilkinson1999). Fracture clustering is indicated by Cv > 1; anticlustering or regular spacing is indicated by Cv < 1, and random spacing (Poissonian distribution) is represented by Cv = 1 (Gillespie et al. Reference Gillespie, Johnston, Loriga, McCaffrey, Walsh, Watterson, McCaffrey, Lonergan and Wilkinson1999; Hooker et al. Reference Hooker, Marrett and Wang2023). In this study, fracture spacings for Set 1 fractures from nine fractured beds have Cv < 1, indicating regularly spaced (anticlustered) fractures, and a single fractured bed has a Cv = 1.06, indicating approximately randomly spaced fractures (Table 2). Fracture spacings for Set 2 fractures from eight beds have Cv < 1, indicating regularly spaced (anticlustered) fractures, and two beds have Cv of 1.50 and 7.47, indicating clustered fractures (Table 2). We recognise there to be significant uncertainty in individual Cv values (Hooker et al. Reference Hooker, Marrett and Wang2023) because of the relatively small sample sizes (n < 30). However, the overall analysis indicates a tendency towards regularly spaced (anticlustered) fractures in the Novice exposure.
From our survey of the entire outcrop, we found that fractures displaying plumose markings (Figure 2) are generally associated with Set 1 (Figure 4). Plumose markings are relatively well developed only in the three most calcite-rich and clay-poor beds with 87.2%–90.5% total calcite and 1.8%–2.6% total clay. These three beds are also the only three beds with mean rebound values >40 (Table 1). Qualitative field observations of other unsurveyed beds in the exposure (Figure 3) are consistent with the observations from surveyed beds that clay-poor beds tend to be systematically fractured with dominant fracture sets striking northeast–southwest and northwest–southeast, and clay-rich beds are unfractured.
5. Discussion
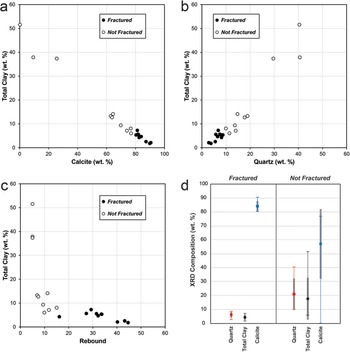
Our analyses indicate that mineralogy is the primary control on opening-mode fracturing (Figure 5). Beds that are systematically fractured all have >80% calcite (mean ± standard deviation 84.1% ± 3.5%), <9% quartz (mean ± standard deviation 6.3% ± 1.8%) and <7.5% total clay (mean ± standard deviation 4.5% ± 1.7%) (Figure 5a, b, d). In contrast, beds >1 cm thick with <80% calcite (mean ± standard deviation 57.1% ± 24.95%), >9% quartz (mean ± standard deviation 21.1% ± 11.0%), and >6 % clay (mean ± standard deviation 17.7% ± 14.9%) are consistently unfractured (Figure 5a, b, d). One thin clay-rich lamina 0.5 cm thick (at stratigraphic height 3.22 m) is transected by several Set 2 fractures that are present in the overlying and underlying beds, but otherwise the lamina is unfractured and terminates fractures from the overlying and underlying limestone beds. Graphical analyses of mean fracture spacing of fractured beds with respect to rebound, bed thickness and mineralogy showed no compelling correlations. However, systematically fractured beds all have mechanical rebound R > 16 (Figure 5c).
(a) Graph of total clay versus calcite for beds included in the fracture survey, illustrating the sensitivity of fracturing to slight differences in clay and calcite percentage. (b) Graph of total clay versus quartz for beds included in the fracture survey, illustrating the close correspondence between clay and quartz as detrital contributions to rock composition. (c) Graph of total clay versus Schmidt rebound for beds included in the fracture survey, illustrating the negative relationship between total clay and rebound. (d) Box and whisker plot for quartz, calcite, and total clay for fractured and unfractured beds. Filled circles indicate the mean, grey bars indicate ±1 standard deviation, and “T” lines indicate range (minimum and maximum). Source data are provided in Table 1.

Figure 5. Long description
Panel A: A scatter plot of total clay versus calcite for beds included in the fracture survey. The x-axis represents calcite in weight percent, and the y-axis represents total clay in weight percent. The plot shows two sets of data points: fractured (filled circles) and not fractured (open circles), illustrating the sensitivity of fracturing to slight differences in clay and calcite percentage. Panel B: A scatter plot of total clay versus quartz for beds included in the fracture survey. The x-axis represents quartz in weight percent, and the y-axis represents total clay in weight percent. The plot shows two sets of data points: fractured (filled circles) and not fractured (open circles), illustrating the close correspondence between clay and quartz as detrital contributions to rock composition. Panel C: A scatter plot of total clay versus Schmidt rebound for beds included in the fracture survey. The x-axis represents rebound, and the y-axis represents total clay in weight percent. The plot shows two sets of data points: fractured (filled circles) and not fractured (open circles), illustrating the negative relationship between total clay and rebound. Panel D: A box and whisker plot for quartz, calcite, and total clay for fractured and unfractured beds. The x-axis represents the mineral composition categories (quartz, total clay, calcite), and the y-axis represents the weight percent. Filled circles indicate the mean, grey bars indicate plus or minus one standard deviation, and T lines indicate the range (minimum and maximum).
Other recent studies of carbonate rocks in extensional settings have shown deformation behaviour to be highly sensitive to total clay and carbonate abundances. Analysis of bedded Cretaceous carbonates (Glen Rose Formation) in the footwall damage zone of the Hidden Valley fault, a normal fault in the Balcones fault system, showed that intensity of fracturing – including normal-displacement shear fractures and opening-mode fractures – is relatively high where carbonate mineral percentage is relatively high, >80%, and total clay is relatively low, <8% (Bowness et al. Reference Bowness, Cawood, Ferrill, Smart and Bellow2022). Similarly, analysis of Cretaceous chalk-dominated carbonates (Anacacho Limestone) showed that beds with >7% clay and <90% carbonate lack well-developed systematic fracture networks, whereas beds with <7% clay and >90% carbonate minerals have systematic fracture networks (Ferrill et al. Reference Ferrill, Cawood, Smart, Lehrmann, Evans, Stockli and Stockli2025a).
Analysis of contractional deformation in carbonate mudstones of the Permian Bell Canyon Formation in the northwest Delaware Basin showed high sensitivity of deformation mode (shear versus compactive failure versus ductile flow) and structural intensity to mineralogy and, in particular, total clay and total carbonate. Carbonate mudstone beds with <2.5% clay accommodated shortening by shear failure producing thrust faults; carbonate mudstone beds with 3.5%–6.5% clay accommodated shortening by compactive failure forming tectonic stylolites; and beds with >8.5% clay accommodated shortening by bulk ductile flow accommodated by mechanisms such as pore collapse and grain-boundary sliding (Ferrill et al. Reference Ferrill, Cawood, Evans, Smart, King and Zanoni2024).
The close association of quartz and total clay in the limestone beds reflects detrital contribution to locally generated carbonate platform sediment by these siliciclastic minerals transported in from a source terrain, in this case for the Talpa Formation delivered to the shelf during sea-level lowstand using the model of Holterhoff (Reference Holterhoff2010). Quartz is a mechanically strong mineral and the dominant strong component in siliciclastic sedimentary rocks (Nelson, Reference Nelson2001; Gale et al. Reference Gale, Laubach, Olson, Eichhubl and Fall2014; Ferrill et al. Reference Ferrill, Smart, Cawood, Lehrmann, Zanoni and King2025b). In limestones, however, clay minerals associated with the quartz control the weakness of the rock, a relationship previously recognised and described by Bowness et al. (Reference Bowness, Cawood, Ferrill, Smart and Bellow2022). Thin-section analysis indicates that siliciclastic clay and quartz are depositional in origin rather than authigenic phases. Laubach et al. (Reference Laubach, Lander, Criscenti, Anovitz, Urai, Pollyea, Hooker, Narr, Evans, Kerisit, Olson, Dewers, Fisher, Bodnar, Evans, Dove, Bonnell, Marder and Pyrak-Nolte2019) emphasised that chemical diagenesis during burial may impact rock strength and fracture evolution. A similar study of the detailed diagenetic evolution of the facies in the Novice section may be a promising focus for future research. In the present study and those by Bowness et al. (Reference Bowness, Cawood, Ferrill, Smart and Bellow2022) and Ferrill et al. (Reference Ferrill, Cawood, Evans, Smart, King and Zanoni2024), the traditional Dunham (Reference Dunham and Ham1962) carbonate texture-based classification – grainstone, packstone, wackestone, mudstone – is shown not to be a reliable indicator of the ability of the carbonate rocks to fracture. The issue is that the carbonate “mud” component in the lime mudstone, wackestone and packstone may be essentially devoid of clay or rich in clay, and rock ductility is highly sensitive to the clay percentage, where higher clay is associated with less or no fracturing. Distinction between “argillaceous limestone” and “limestone” is a useful qualitative indicator of mechanical behaviour because these terms distinguish based on the abundance of clay minerals (e.g., Ferrill and Morris, Reference Ferrill and Morris2008; Zahm et al. Reference Zahm, Zahm and Bellian2010), although these terms lack the precision needed for mineralogy-based fracture prediction. According to the AGI handbook (Carpenter et al. Reference Carpenter and Keane2016) limestone is defined as having <25% siliciclastic clay or silt content (>75% carbonate), whereas argillaceous limestone contains from 25% to 50% clay (75%–50% carbonate). The compositional boundary is close to the boundary between fractured and unfractured beds (Figure 5) such that all fractured beds in the present study classify as limestone and most unfractured beds classify as argillaceous limestone or shale.
Plumose markings (Woodworth, Reference Woodworth1896; Bahat and Engelder, Reference Bahat and Engelder1984; Simon et al. Reference Simon, Arlegui and Pocovi2006; Rysak et al. Reference Rysak, Gale, Laubach and Ferrill2022) were observed on Set 1 fractures in three limestone beds with the highest calcite contents (>87%) and lowest total clay contents (<3%). The plumes shown in Figure 2 are representative examples from the Novice exposure and match the herringbone type of Syme-Gash (Reference Syme-Gash1971), which are also referred to as straight or S-type plumes by Bahat and Engelder (Reference Bahat and Engelder1984). These plumes record primarily horizontal fracture propagation. Plume axes in our study tend to be straight and near the centreline of the beds. In the three examples shown in Figure 2c and d, the interpreted fracture propagation direction was from right to left (southwest-directed), but other examples were observed with the opposite geometry, indicating left to right (northeast-directed) propagation. The general absence of plumose structures on later fractures in the same beds and other fractured limestone beds in the section suggests changing deformation conditions at the time of fracturing or perhaps differences in fracture propagation rate (e.g., Atkinson, Reference Atkinson1984; Bahat and Engelder, Reference Bahat and Engelder1984; Bahat, Reference Bahat1991).
6. Conclusions
Results of fracture and lithologic surveys from the Talpa Formation indicate that mineralogy is the primary control on opening-mode fracturing and that fracture occurrence is best described as a threshold-controlled, binary response. Surveyed beds experienced the same overall burial conditions, but some beds are fractured and others are not, with the threshold apparently governed by total carbonate and total clay content. Systematically fractured beds in this study all have >80% calcite, <9% quartz and <7.5% total clay, with plumose markings only observed in three limestone beds with the highest calcite contents (>87%) and lowest total clay contents (<3%). Beds with <80% calcite, >9% quartz and >6% clay are unfractured. Texture-based lithologic description (grainstone, packstone, wackestone, mudstone) alone is not a robust predictor of the tendency for carbonate rocks to fracture, as the ability to fracture is highly sensitive to mineralogy – in particular the calcite (or total carbonate) and clay percentages.
Acknowledgments
This study was supported by SwRI’s Permian Basin Consortium joint industry project funded Anadarko Petroleum Corporation, Chevron U.S.A. Inc., ConocoPhillips Company, Diamondback E&P LLC, EP Energy E&P Company, Marathon Oil Company, Noble Energy Inc., Pioneer Natural Resources USA Inc., and Shell Oil Company. We thank Harrison Bellow for assistance with field work. We thank Olivier Lacombe for editorial handling of the manuscript and Steve Laubach and John Hooker for their constructive reviews that led to improvements in the manuscript.
Competing interests
The authors declare no competing interests.

 Open access

