


Introduction
Floods are among the most frequent natural disasters worldwide. The health effects of floods occur on different timescales ranging from immediate to multi-year time spans (WHO, 2014). Among the direct effects are physical trauma caused by debris and drowning. Less immediate health effects are diarrhoeal, insect- and rodent-borne diseases, and infections. These effects are strengthened if a flood results in shortages and contamination of drinking water, and in damage to or destruction of water and sanitation infrastructure, property and community facilities, and crops and food supplies. In the worst-case scenario the result is population displacement (WHO, 2014).
In low-lying deltaic areas, the risk of inundation is relatively high due to the presence of rivers, low elevation and gradient, high groundwater levels, and marine influences. One of these regions is located in the Netherlands and western Belgium (NW Europe), where the Rhine, Meuse and Scheldt drain into the North Sea. Preceding large-scale embankment in c. AD 1000–1200, the inhabitants of this region frequently must have been confronted with the impacts of flooding (see https://landschapinnederland.nl/leven-met-waterkaart for a spatial and chronological overview of embankment in the Netherlands).
Using the grain size of sediments, Toonen et al. (Reference Toonen, Donders, Van der Meulen, Cohen and Prins2013) and Cohen et al. (Reference Cohen, Toonen and Weerts2016) developed a chronological overview of extreme flooding events of the Rhine during the past 8200 years. The timing of the reconstructed events has been established within varying confidence intervals using radiocarbon dating and archaeological evidence. The results show that main floods of the Rhine during the first millennium AD in the Netherlands took place in c.282 (with a possibility of having occurred 45 years earlier in c.237; 2σ confidence interval of this date: ±182 years), in c.686 (2σ confidence interval: ± 69 years) and in c.785/6 (with a possibility of having occurred in c.865; 2σ confidence interval: ±127 years). Cohen et al. (Reference Cohen, Toonen and Weerts2016: 77) have suggested that the chronological uncertainty of these dates could be reduced by correlating them to dendrochronologically established growth variations in trees from river-bordering woodlands. The aim of the present study is to complement the Roman and early-medieval part of the Rhine-flood record with an independent, annually resolved reconstruction of hydrological impacts.
Dendrochronological framework
In temperate climate zones, trees form wood tissue directly underneath their bark during the growing season, which in general lasts from March/April (deciduous trees: budding of leaves, formation of woody tissue such as spring vessels) to September/October (shedding of leaves, entering dormancy; Fig. 1). The boundary between the phase of dormancy and the start of the next growing season is visible through differences in cell-wall thickness and other anatomical features. Dendrochronological dating uses similarities between the annual growth variations of simultaneously growing trees, often of the same species but also of multiple species in cases where environmental conditions have affected their growth in a similar manner. These conditions to a large extent are weather-related, determined by rainfall and temperature during the growing season and, through storage of reserves, the previous year(s).
Within-year growth of a tree ring in oak. X-axis: month (March–October); y-axis: accumulative growth (mm). The photo of the tree ring to the right shows the early wood (spring vessels) in the lower part, and the subsequently formed denser summer wood in the upper part (adapted from Baillie (Reference Baillie1982) by P. Doeve).

In addition, annual tree growth is influenced by the following factors (Cook, Reference Cook, Cook and Kairiukstis1990): the age of the tree (the older a tree becomes, the narrower the annual rings that it produces); exogenous non-climatic factors influencing local tree groups (e.g. flooding, forest fires, insect outbreaks); and incidental endogenous impacts only influencing individual trees (e.g. thinning). Since climate compared to exogenous impacts is less variable over larger regions, the dendrochronological dating of tree-ring patterns of archaeological timber in general uses the weather-related high-frequency component of these patterns, expressed as growth variations from year to year, paying less attention to the more locally forced exogenous signal which often consists of multi-year positive or negative growth trends.
Since dendrochronology is applied in the Netherlands to trees preserved in (former) bogs and to archaeological wood from trees with an indigenous provenance, it has become increasingly clear that the exogenous signal in their growth patterns can be quite similar across larger geographical distances (Jansma Reference Jansma1995; Leuschner et al. Reference Leuschner, Sass-Klaassen, Jansma, Baillie and Spurk2002; Sass-Klaassen & Hanraets, Reference Sass-Klaassen and Hanraets2006; Jansma & Doeve, Reference Jansma, Doeve, Dijkstra, Verhoeven and Van Straten2017). This implies that this signal cannot be considered as a locally induced phenomenon that only affected single stands of trees, but instead should be interpreted as reflecting general impacts on prevailing growth conditions in a larger geographical area.
The exogenous signal in part of the dated ring patterns of prehistoric Roman and early-medieval oak, ash and elm in the Netherlands is characterized by sudden growth reductions lasting for several years, followed by marked growth accelerations (Fig. 2). Leuschner et al. (Reference Leuschner, Sass-Klaassen, Jansma, Baillie and Spurk2002) and Sass-Klaassen & Hanraets (Reference Sass-Klaassen and Hanraets2006) have established that such growth reductions often occurred simultaneously across sites in the Netherlands and Lower Saxony (NW Germany) and most likely reflect high groundwater levels and/or inundation. The inverse relationship between (ground)water levels and annual tree growth in low-lying areas is caused by the fact that inundation deprives the roots of the trees of oxygen and, in addition, damages them through the production and accumulation of toxic gases as well as through deterioration of the soil structure (e.g. Coder, Reference Coder1994). Experiments with oak saplings have shown that inundation during the start of the growing season in spring is especially harmful for oak, because it inhibits the initiation of early-wood development in flooded stem parts and afterwards reduces the size of the early-wood vessels (Copini et al. Reference Copini, Den Ouden, Robert, Tardif, Loesberg, Goudzwaard and Sass-Klaassen2016). Although there is consensus that reduced-growth intervals in wood recovered in low-lying parts of the Netherlands and Lower Saxony were caused by inundation and/or high groundwater levels, at the time of this study the reasons for these hydrological fluctuations were undetermined. It should be noted that this linkage between high water levels and narrow rings in oak has not yet been established elsewhere in Europe. Central European studies directed at climate reconstruction use narrow rings in oak as an indicator of low precipitation levels/drought (e.g. Büntgen et al. Reference Büntgen, Tegel, Nicolussi, McCormick, Frank, Trouet, Kaplan, Herzig, Heussner, Wanner, Luterbacher and Esper2011).
An example of growth reductions in oak caused by inundation (sample code Z180010; DCCD identifier 2018001; photo: P. Doeve). A: two narrow annual growth rings consisting of small spring vessels only and dated to AD 425 and 426; B: a single narrow ring solely consisting of spring vessels and dated to AD 432. Note the increasing width of the growth rings formed after these events, expressing a multi-year recovery phase.

Methods and materials
The dendrochronological dataset
The DCCD repository (Jansma et al. Reference Jansma, van Lanen, Brewer and Kramer2012) was queried for dendrochronological time series that include a youngest measured tree ring formed between 100 BC and AD 1300 (date of query: 6 June 2018). The downloaded 626 datasets were complemented with the data from three as yet unarchived research projects, resulting in a collection of 5565 measurement series obtained from tree species indigenous to the Netherlands: 5284 elements of oak (Quercus robur/petreae), 227 elements of ash (Fraxinus excelsior) and 54 elements of elm (Ulmus sp.; Supplementary Table A (available online at https://doi.org/10.1017/njg.2020.10)). This dataset was reduced to 5278 by removing 287 series already identified by Domínguez-Delmás et al. (Reference Domínguez-Delmás, Driessen, García-González, Van Helmond, Visser and Jansma2014), Jansma et al. (Reference Jansma, Haneca and Kosian2014), Jansma & Van Lanen (Reference Jansma, Van Lanen, Willemsen and Kik2015) and Van Lanen et al. (Reference Van Lanen, Jansma, Van Doesburg and Groenewoudt2016) as representing oak brought to the Netherlands from Flanders, the Ardennes and the German Rhineland (Fig. 3).
Regional distribution of the initial dataset. The following materials were deselected: Roman wood from Flanders with growth patterns covering 174 BC to AD 200 and the Ardennes covering 217 BC to AD 219 (shown in red), medieval wood from the German Rhineland covering AD 367 to 826 (green), and medieval wood from the Ardennes covering AD 757 to 1063 (yellow). Background: map showing the Roman coastline, adapted from De Vos & De Vries (Reference De Vos and De Vries2013) (from Jansma et al., Reference Jansma, Van Lanen and Pierik2017).

Statistical comparisons
Statistical comparisons between dated time series were performed using the software package PAST4 (Knibbe, Reference Knibbe2008) and standard dendrochronological cross-dating statistics: (a) Student’s t-values (t H, based on Pearson’s cross-correlation coefficients (r) between measurement series detrended using a logarithmic transformation (Hollstein, Reference Hollstein1980)); and (b) the percentage of parallel variation (%PV) with its significance level P (Eckstein & Bauch, Reference Eckstein and Bauch1969). The assumption is that all archaeological wood before it was used could have been moved an unknown distance from its original growth location. Therefore, in this stage of the research, all individual growth patterns were compared to each other regardless of their geographical and archaeological context.
Chronology compilation and assessment of wood provenance
Tree-ring series from elements derived from the same tree were averaged into single-tree series (TS). Next series with a strong local signal were identified. This was done initially by using existing indigenous chronologies as a reference (Jansma, Reference Jansma1995; Leuschner et al. Reference Leuschner, Sass-Klaassen, Jansma, Baillie and Spurk2002; Jansma & Hanraets, Reference Jansma, Hanraets, Jansma, Bräuning, Gärtner and Schleser2004; Sass-Klaassen & Hanraets, Reference Sass-Klaassen and Hanraets2006; Jansma & Doeve, Reference Jansma, Doeve, Dijkstra, Verhoeven and Van Straten2017). As the work progressed, updated average chronologies were compiled including the corresponding newly identified series. Tree-ring patterns showing strong similarities were grouped together into ‘tree groups’ (TGs) using the same statistical threshold values that were applied by Jansma et al. (Reference Jansma, Haneca and Kosian2014) and Van Lanen et al. (Reference Van Lanen, Jansma, Van Doesburg and Groenewoudt2016) in studies of Roman and early-medieval long-distance connections (i.e. focused on ‘wood imports’ instead of on wood with a local provenance). This means that values of t H ≥ 6.8 and %PV ≥ 68% were interpreted as indicative of comparable growth conditions. In addition, also following these earlier studies, the similarity of the patterns was verified visually with emphasis on multi-year trends of decreasing and increasing ring width, since these similarities cannot be detected using overall values for t H and %PV.
To remove age trend, the TSs in the resulting TGs were detrended and transformed into growth indices using a 128-yr spline with 50% variance cut-off (Cook et al. Reference Cook, Briffa, Shiyatov, Mazepa, Cook and Kairiukstis1990). Next for each site or cluster of adjacent sites represented by >1 cross-dated index series the annual average was calculated. This for each TG resulted in a reduced dataset containing a site-based collection of index series (SBS). Per TG the individual SBSs were compared statistically to the average of all other SBSs. In order to maximise the shared high-frequency variation, SBSs matching against this average with a value of %PV yielding P > 0.0001 were removed from the collection.
The question whether the resulting chronologies against expectation might represent trees brought here from outside the research area was addressed by considering their geographical distribution, the question whether they include palaeo-vegetation remains from the study area that have been recovered in situ, and their internal statistical cohesion versus their statistical match against chronologies from other areas.
Tracing and explaining the hydrological signal
To identify calendar years during which tree growth in each TG was significantly suppressed, in all likelihood mirroring the same growth-limiting forcing(s), for each year the narrowest and widest growth index of the underlying SBSs was identified. These numbers were multiplied, which after normalization resulted in an annually resolved stress-based time series. Negative pointer years (PYs) in the wood, defined here as calendar years during which ≥70–75% of the TSs in each TG show reduced growth relative to the immediately preceding year, were used on identified stress intervals to determine the years of impact more precisely (Schweingruber et al. Reference Schweingruber, Eckstein, Serre-Bachet and Bräker1990). The resulting series of Mi, with i covering the interval AD 1–1000, reflects the overall strength of the environmental impacts on tree growth in the region represented by each TG.
Per TG the Mis were graded according to: (a) their (negative) deviation from the average value of Mi using 0.5, 1, 1.5 and 2σ; and (b) the number of subsequent negative PYs. This resulted in a combined series of negative-impact years, termed Mi*, shared by the growth patterns of all SBSs in the TGs and thus representing the strongest, geographically most widely occurring stress events recorded in the tree rings. The severity of the reconstructed events was estimated by calculating the recurrence frequency (RF; also known as ‘return period’) of the established Mi*s based on the ranking of their values.
Next the Mi*s were compared to independent data sources using a maximum chronological offset of one calendar year. First, the Mi*s were compared to historical documentation of river floods and sea breaches in the Low Countries and surrounding regions unlocked and summarised by Gottschalk (Reference Gottschalk1971) and Buisman (Reference Buisman1995). Here, the assumption is that a reconstructed hydrological impact which chronologically coincides with or immediately follows a historically documented river flood or storm surge was caused by this same flood or surge. In order to include possible impacts that occurred during time intervals characterised by healthy annual growth rates, documented flood years also were compared to negative growth trends (i.e. multi-year intervals of diminishing ring widths) that developed during intervals of above-average growth. During this exercise, the Mi*s in addition were compared to historically documented droughts and/or heatwaves (Buisman Reference Buisman1995).
Second, to better assess the geographical range of the reconstructed Mi*s and their forcing(s), the Mi*s and historically documented floods were compared to intervals of below-average growth in the Lower Saxonian Bog Oak Chronology (LSBOC), which is an average chronology, largely developed in the 1980s, of oaks recovered in (former) bogs in Lower Saxony, NW Germany (Leuschner et al., Reference Leuschner, Delorme, Tüxen and Höfle1986; Leuschner & Delorme Reference Leuschner and Delorme1988; see Achterberg et al., Reference Achterberg, Frechen, Bauerochse, Eckstein and Leuschner2017, fig. 1, for its spatial distribution). Instances of decreased annual growth in this chronology were separated into the following categories: A = growth reduction lasting ≥10 years; B = growth reduction lasting from 3 to 9 years; C = sudden further growth reduction during interval of already reduced growth; D = growth reduction lasting 2 years; E = below-average growth lasting 1 year.
Third, in order to gain a first impression of the impact of the inferred events on the inhabitants of the Rhine–Meuse delta, the derived impact years were compared to dendrochronological felling dates of Rhine revetments in the early-medieval site of Leiderdorp-Plantage (Fig. 4; Dijkstra et al., Reference Dijkstra, Verhoeven and Van Straten2016). The reason this site was selected is that it represents the only published early-medieval settlement in the Netherlands of which all construction wood derived from mature trees was made available for tree-ring research (Jansma & Doeve, Reference Jansma, Doeve, Dijkstra, Verhoeven and Van Straten2017). Part of the dated oak and ash from Plantage-Leiderdorp contained waney edge (i.e. the transition from wood to bark), which means that their dendrochronological end dates represent the moment the trees were cut down. This makes these series highly accurate indicators of construction and repair along this part of the most downstream reach of the Lower Rhine.
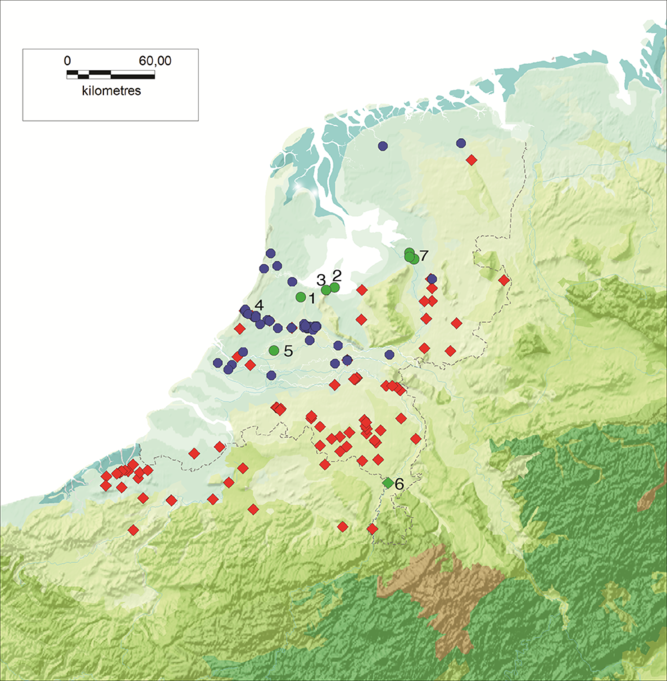
Geographical distribution of the materials underlying the new chronologies. Circles: Chronology A; squares: Chronology B; green: in situ preserved vegetation remains. Locations: 1 = Abcoude; 2 = Flevo Polder; 3 = Huizen Gooimeer; 4 = Leiderdorp-Plantage; 5 = Ouderkerk aan de IJssel; 6 = Stevensweert; 7 = Zwolle. Background: map showing the Roman coastline, adapted from De Vos & De Vries (Reference De Vos and De Vries2013) (from: Jansma et al., Reference Jansma, Van Lanen and Pierik2017).
Results and interpretation
Timber groups
Two timber groups were compiled, both of which bridge the whole of the first millennium AD (Supplementary Table B (available online at https://doi.org/10.1017/njg.2020.10)). Chronology A represents 36 out of 39 initial SBSs (Supplementary Table D (available online at https://doi.org/10.1017/njg.2020.10)). It covers the interval 160 BC to AD 1129, containing 304 TS of oak and some ash and elm mostly from archaeological sites and in situ preserved woodland remains located in the Rhine–Meuse delta including connected peat streams and other water bodies (Figs 4, 5, 6). Ring widths in this chronology vary from 0.09 to 2.99 mm, with an average of 1.06 and a standard deviation of 0.56 (Fig. 5; Supplementary Table B (available online at https://doi.org/10.1017/njg.2020.10)). Chronology B represents 77 out of 96 initial SBSs (Supplementary Table E (available online at https://doi.org/10.1017/njg.2020.10)). It runs from 194 BC to AD 1145, containing 290 TS of oak from sites mainly situated south and east of the Rhine–Meuse delta (Figs 4, 5, 6). Ring widths in this chronology vary from 0.15 to 11.0 mm, with an average of 1.61 and a standard deviation of 0.61 (Fig 5; Supplementary Table B (available online at https://doi.org/10.1017/njg.2020.10)).
Distribution of minimum and maximum ring widths of the TSs underlying Chronologies A and B, expressed in 0.01 mm (i.e. 50 = 0.5 mm).

Annual growth variations of Chronologies A (blue) and B (red) between 100 BC and AD 1100.

Provenance of the wood
Chronology A, mainly developed from archaeological materials, also includes trees that belonged to former woodlands located in low-lying areas and preserved in situ until the time of their discovery (the sites of Abcoude, Flevo Polder, Huizen Gooimeer, Ouderkerk aan de IJssel and Zwolle; Fig. 4; Supplementary Table D (available online at https://doi.org/10.1017/njg.2020.10)). This indigenous component places the whole of the underlying TG in approximately the same deltaic, water-dominated environment. Therefore this chronology, summarising the growth of trees recovered along the Dutch rivers and other water bodies as well as in adjacent low-lying areas, is representative of the low-lying Holocene parts of the Netherlands. The periodic hydrological stress that shaped the growth patterns underlying this chronology is expressed by its relatively narrow ring widths in comparison to those of Chronology B (Fig. 5) and its prolonged intervals of below-average annual growth (Fig. 6).
Chronology B represents archaeologically recovered oak from the higher Pleistocene areas in the Netherlands and Belgium and the remains of a single oak that died naturally and was preserved in sediments of the Meuse at Stevensweert near its original growth location (Fig. 4; Supplementary Table E (available online at https://doi.org/10.1017/njg.2020.10)). Statistical comparison to independent chronologies from adjacent areas shows that it most strongly resembles Chronology A (t H = 15.6 and %PV = 65.0; Table 1), followed closely by the Central European chronology developed by Hollstein (Reference Hollstein1980) which predominantly represents materials from the German Rhine and its tributaries (t H = 14.5 and %PV = 63.7; Table 1). Visual inspection confirms that Chronology A agrees best, with dissimilarities mostly occurring during intervals in which the growth values of Chronology A are minimal (i.e. exhibit a weakened year-to-year variability; Fig. 6). This indicates that observed annual differences most likely reflect a lower hydrological sensitivity of Chronology B, which must be related to the less water-susceptible growth locations of most trees underlying this chronology. A third, shorter chronology yielding a strong match with Chronology B is the Roman Flanders/Scheldt chronology (t H = 13.3 and %PV = 71.7; Table 1). This result is expected given the geographical overlap of the wood finds included in Chronology B and the Roman Scheldt/Flanders chronology (see Jansma et al., Reference Jansma, Haneca and Kosian2014: Fig. 5). Other available chronologies, developed from wood brought to the Netherlands across larger distances, yield lower agreements (Table 1). Given these results, Chronology B also must reflect tree growth in the area where the majority of the underlying wood has been retrieved (Fig. 4).
Statistical match of Chronology B against independent reference chronologies from the research area and surrounding regions; * = P <0.0000000001

Impact reconstruction
The reconstructed impacts (Mi*) have a recurrence frequency of ≥6, with 21 events showing values of RF ≥ 50 (Fig. 7; Tables 2, 3; Supplementary Table C (available online at https://doi.org/10.1017/njg.2020.10)). The strongest inundation effects (RF ≥ 100) are recorded in the tree rings of AD 49, 144, 151, 191, 232, 263, 282, 431, 602, 827, 854 and 942. One-third of the ≥50-yr events date between AD 185 and 282, in terms of hydrology making this the most flood-intense interval of the first millennium in the research area. The severest reconstructed inundation of the first millennium dates to AD 602 (RF = 1000).
Recurrence frequency of the reconstructed inundations. X-axis: calendar years; y-axis (logarithmic scale): RF ≥ 10. Black: RF ≥ 50.

Reconstructed hydrological impacts (Mi*s) in AD 1–500 (see Supplementary Table F (available online at https://doi.org/10.1017/njg.2020.10) for a detailed overview of historically documented floods and storm surges in comparison to reconstructed Mi*’s). RF: recurrence frequency; LSBOC: Lower Saxony Bog Oak Chronology

Reconstructed hydrological impacts (Mi*s) in AD 501–1000 (see Supplementary Table F (available online at https://doi.org/10.1017/njg.2020.10) for a detailed overview of historically documented floods and storm surges in comparison to reconstructed Mi*’s)

Nature of the hydrological signal
Historical sources document 24 instances of river flooding and two storm surges during the first millennium AD (Supplementary Table F (available online at https://doi.org/10.1017/njg.2020.10)). Of these, 17 chronologically coincide with Mi*s independently reconstructed from the tree-ring data (71%; Fig. 8). These events without exception pertain to river flooding, especially of the Rhine but in at least one instance also of the Meuse (Supplementary Table F (available online at https://doi.org/10.1017/njg.2020.10)). Four other known river-flood years in Chronology A coincide with the onset of a multi-year negative growth trend in intervals of above-average growth (17%; Supplementary Table F (available online at https://doi.org/10.1017/njg.2020.10)). This means that a total of 21 out of 24 of the known flood years (83%) in the research area coincide with negative impacts on tree growth. In contrast, of 14 documented drought and/or heatwave years only three coincide with reconstructed Mi*s (21%; Supplementary Table G (available online at https://doi.org/10.1017/njg.2020.10)).
Chronological overview of research results for AD 1–100. X-axis: calendar years; y-axis: SBS Chronology A = annual variations of the SBSs underlying Chronology A; nr. TS = number of trees included in Chronologies A (dark grey) and B (grey); Known flood: historically documented flood (see Supplementary Table F (available online at https://doi.org/10.1017/njg.2020.10) for details); wood-anatomical photos, top right: A = wood included in Chronology A; B = wood included in Chronology B. Find locations, background: map of the AD 100 or 800 coastline, adapted from De Vos & De Vries (Reference De Vos and De Vries2013) (from Jansma et al., Reference Jansma, Van Lanen and Pierik2017), with waterways reconstructed by Pierik et al. (Reference Pierik, Stouthamer and Cohen2017).

Chronological overview of research results for AD 101–200 (see caption of Fig. 8A for details).

Chronological overview of research results for AD 201–300 (see caption of Fig. 8A for details).

Chronological overview of research results for AD 301–400 (see caption of Fig. 8A for details).

Chronological overview of research results for AD 401–500 (see caption of Fig. 8A for details).

Chronological overview of research results for AD 501–600 (see caption of Fig. 8A for details).

Chronological overview of research results for AD 601–700 (see caption of Fig. 8A for details).

Chronological overview of research results for AD 701–800 (see caption of Fig. 8A for details).

Chronological overview of research results for AD 801–900 (see caption of Fig. 8A for details).

Chronological overview of research results for AD 901–1000 (see caption of Fig. 8A for details).

The observed agreement between decreased annual growth rates and historically documented flood years indicates that during these years the trees included in this study predominantly suffered from river overflow and/or related raised groundwater levels. Assuming uniformity of environmental impacts on tree growth in the research area through time, this means that river overflow and related high groundwater levels also were a main cause of reduced tree growth during years not documented by written sources.
Throughout the first millennium, 76 of 152 instances of repressed growth in the research area coincide with reduced growth values categorised as A, B, C or D-events in the LSBOC (50%; Tables 2, 3). The implication is that inundation in the research area and Lower Saxony often occurred simultaneously. Since the LSBOC represents the growth of oaks well outside the catchment basins of the Rhine and Meuse (see Achterberg et al., Reference Achterberg, Frechen, Bauerochse, Eckstein and Leuschner2017; Fig. 1), overflow of these rivers cannot explain this synchronicity. This points to regional precipitation as a main forcing in these cases. On the other hand, of the 17 historically documented floods during the interval covered by the LSBOC, only 4 coincide with below-average growth in this chronology (24%; Table 5). This indicates that the majority of documented floods during this time interval in all likelihood were not caused by regional precipitation (which would have negatively impacted tree growth in the research area as well as in Lower Saxony), but by high precipitation rates and/or melt water levels in the upstream catchments of the Rhine and Meuse.
A first assessment of human response to flooding
Of 80 absolutely dated series from Leiderdorp-Plantage, 19 are from oak and ash elements containing waney edge (Jansma & Doeve, Reference Jansma, Doeve, Dijkstra, Verhoeven and Van Straten2017). Eleven of these, all from Rhine-lining revetments, have an end date that coincides with an inferred flood impact, together matching with ten impacts dated to AD 583, 658, 704, 754, 757, 796, 806, 810, 814 and 827 (Fig. 9; 7 ≤ RF ≤ 100; Table 5). The strong relationship between flooding and wood construction at Leiderdorp-Plantage indicates that the river-related infrastructure at this site in these cases was damaged sufficiently to invoke counter-measures.
Reconstructed floods versus construction and repair at Leiderdorp-Plantage. X-axis: reconstructed floods (graph labels: left); y-axis: absolute felling dates (graph labels: right).

Discussion and conclusions
Dendrochronology: the role of ‘climatic’ versus ‘exogenous’ growth conditions
From a theoretical perspective, the inundation signal in the selected tree-ring patterns cannot be a straightforward reflection of climate, because its drivers could include (combinations of) river run-off, land use, groundwater and sea levels, storm surges and human activity (e.g. water management), most of which in dendrochronology would be categorised as non-climatic, ‘exogenous’ factors. However, part of the flood events recorded in the tree rings has been historically documented as caused by abundant rainfall (Gottschalk Reference Gottschalk1971; Buisman Reference Buisman1995), and the results of the present study indicate that the negative growth responses of the trees were triggered by both regional precipitation and high precipitation rates and/or melt water levels in the upstream catchments of the Rhine and Meuse. This indicates that in low-lying deltaic regions, when it comes to hydrology, there is no strict boundary between climatic and exogenous growth conditions.
Accuracy of the dendro-hydrological flood record
Replication of the data
The dendrochronological data used in this study predominantly originate from archaeological sites, with their number through time depending on factors such as: (a) preferred settlement locations (river-bordering sites on average contain more preserved wood than settlements on higher locations, due to better conservation conditions); (b) demography (less populated areas/time intervals are represented by smaller amounts of archaeological wood finds); and (c) archaeological sampling strategy (obtaining a single date for an archaeological site requires considerably fewer wood samples than unravelling the intricacies of timber construction at this site through time). The result is that the replication of the data underlying this reconstruction strongly varies throughout the first millennium (Fig. 8). However, this does not seriously affect the reliability of the reconstruction through time, because only highly similar series were used for the compilation of the TGs. For example, the 4th century in Chronology A is covered by materials from two natural woodland sites only, which are situated in the present Flevo Polder and Zwolle (Fig. 4; Fig. 8D). The SBSs from these sites, respectively covering AD 269–477 and 137 BC–AD 551, during their earlier and later intervals strongly resemble SBSs from a considerably wider area (Figs 8C, E, F), and this wider spatial validity also must be true for the less replicated 4th century and other less-replicated time intervals (i.e. the end of the 2nd century, the start of the 3rd century, the end of the 8th century and the start of the 9th century). This relative independence of data replication through time is confirmed by the many synchronous growth reductions observed in the LSBOC (Tables 2, 3).
Reliability of the reconstructed recurrence frequencies
Using a ranking system to calculate RF may induce problems towards the magnitude estimation of largest events (Toonen, Reference Toonen2015). Also the reconstructed RF of the largest event on record, in AD 602, given the length of the studied time interval is restricted to 1000 yrs, whereas in reality it may have been larger. This means that the values of RF presented in this study are not absolute and will need adjustment as the dendro-hydrological record is extended in time.
Dating accuracy
The annual resolution of the new dendro-hydrological record suggests that each event recorded in the underlying tree rings has been dated to the year. However, stress-induced growth responses in year i mask the effect of hydrological events in year i + 1, since the growth of the trees in year i already is minimal. This makes it difficult to reconstruct floods that took place in consecutive years. In addition, the new record shows the response year of the trees, not the year or season of the actual event. River overflow in for example December–February may have led to inundation lasting to March–April, which would show up in the tree rings as if the event itself happened during spring. In other words, narrow growth rings and a negative PY formed during year i can represent an inundation that started during the dormant season at the end of year i − 1, during the dormant season at the start or year i or during the first part of the growing season of year i. Inferring the most likely season of the reconstructed impacts is outside the scope of this study. In order to further refine the new dendro-hydrological record, as a follow-up it is advisable that the timing of floods is deduced based on anatomical examination of dendrochronologically dated wood from varying locations. This is only possible if after dendrochronological analyses directed at obtaining felling dates, which is the most common archaeology-based application of dendrochronology, the wood is curated and remains available for further inspection. The precise timing of well-dated human responses to flooding, such as repairs to infrastructure and the construction of new water wells, by providing ante quem dates could also help to estimate the season of flooding more precisely.
Inundation or drought
Dendroclimatical studies focused on Central Europe as a rule use narrow ring width in oak as an indicator of drought (e.g. Büntgen et al., Reference Büntgen, Tegel, Nicolussi, McCormick, Frank, Trouet, Kaplan, Herzig, Heussner, Wanner, Luterbacher and Esper2011). However during the first millennium AD most trees in low-lying areas of the Low Countries were adversely affected, showing healthy growth rates during documented drought and reduced growth responses to high water levels (Supplementary Tables F, G (available online at https://doi.org/10.1017/njg.2020.10)).
It is important to note that in three instances the dendro-hydrological reconstruction is at odds with the historical sources: negative impacts on tree growth during AD 921 (RF = 7), 981 (RF = 14) and 994 (RF = 6) most likely did result from drought (Supplementary Table G (available online at https://doi.org/10.1017/njg.2020.10)). This means that reconstructed Mi*s with relatively low values of RF (< 20) need to be confirmed archaeologically (i.e. using felling dates of river-lining structures and/or death dates of trees buried underneath river-avulsion sediments) before they can be used as evidence of inundation.
Relationship with known Rhine floods of the first millennium
The dendro-hydrological reconstruction places the severest floods of the 3rd century in 232 and 282 (RF = 501 and 200; Table 2; Fig. 7). This agrees well with the reconstruction by Toonen et al. (Reference Toonen, Donders, Van der Meulen, Cohen and Prins2013), who identify 237 or 282 ± 182 yrs as a possible extreme-flood year (Cohen et al., Reference Cohen, Toonen and Weerts2016, 41). However, the new reconstruction shows that tree growth during both these years suffered from inundation. Although the 686 ± 69 flood reconstructed by the same authors is visible in the tree-ring data of 686, the signal is too weak to firmly corroborate this date (RF = 21). Given the inundation signal in the tree-ring data, it is more likely that this event took place in 602 (RF = 1000). Given the flood-related felling dates inferred for Leiderdorp-Plantage, the AD 785/6 ± 127 flood reconstructed by Toonen et al. (Reference Toonen, Donders, Van der Meulen, Cohen and Prins2013) and Cohen et al. (Reference Cohen, Toonen and Weerts2016) was part of a series of Rhine overflows that extended into the early second quarter of the 9th century (827; Fig. 9). This flooding sequence probably was related to the final silting-up of the Rhine in the central and western Netherlands reconstructed by Van Dinter et al. (Reference Van Dinter, Cohen, Hoek, Stouthamer, Jansma and Middelkoop2017).
Conclusions and outlook
The new flood record shows that during the first millennium AD the effects of extreme Rhine discharges had an impact on, or occurred simultaneously with similar events in, all low-lying parts of the research area. This indicates that the Holocene flood record of the Rhine developed by Toonen et al. (Reference Toonen, Donders, Van der Meulen, Cohen and Prins2013) and Cohen et al. (Reference Cohen, Toonen and Weerts2016) has a wider geographical validity than expected.
The hydrology-induced stress signal identified in this study is lacking in the tree rings in the dendrochronological dataset formed after AD 1129 (distribution area of Chronology A) and 1145 (distribution area of Chronology B; Figs 3, 4). A major cause must have been large-scale embankment of rivers and coastal areas in the research area in AD 1000–1200, including the damming of the Rhine in the central Netherlands near Wijk bij Duurstede in 1122, since these measures must have significantly reduced the number of inundations. An additional factor may have been the relocation of settlements to higher grounds, resulting in diminished access to, and use of, flooding-sensitive trees and in less favourable conservation conditions for organic materials such as wood. In addition, due to deforestation after c.1200 construction timber was predominantly brought to the Netherlands from other regions. As a result, it is not possible to extend the present dendro-hydrological reconstruction past c.1150 using indigenous tree-ring patterns. However, the reconstruction can be extended backwards using tree-ring series derived from vegetation remains in the Netherlands recovered in situ, which without chronological gaps extend from the earliest centuries covered by Chronology A to 2888 BC (Jansma, Reference Jansma1995; Leuschner et al., Reference Leuschner, Sass-Klaassen, Jansma, Baillie and Spurk2002 (extended dataset)). These patterns without exception have been derived from trees that after their demise were preserved in the soil due to high groundwater levels, indicating growth conditions similar to those represented by Chronology A.
A comparison to absolute felling dates of oak used in Rhine-lining revetments at the early-medieval settlement of Leiderdorp-Plantage shows that at this location c.50% of construction or repair took place in association with a reconstructed flood impact. This implies that water management during this period was high on the agenda of the inhabitants. Throughout the Rhine–Meuse delta, similar relationships between flooding and construction must have existed in other time intervals. A promising example dating to the Roman Period is the Fossa Corbulonis directly to the east of the coastal sand barriers of the North Sea (De Kort & Raczynski-Henk Reference De Kort and Raczynski-Henk2014). This dug canal, which connected the Rhine and Meuse, was constructed with oak harvested in March/April of AD 50 after a serious flood that occurred in AD 49 (Fig. 6; Table 2). Its timing raises the possibility that this canal was intended as a flood catchment basin designed to improve the hydrological conditions along the Roman Rhine-based defence system. Such relationships between reconstructed floods and human activity need to be explored further.
Acknowledgements
This study is part of research programme ‘The Dark Age of the Lowlands in an interdisciplinary light: people, landscape and climate in the Netherlands between AD 300 and 1000 (NWO/SSH 2012-2019; project number 360-60-110). Petra Doeve (The Netherlands Centre for Dendrochronology/RING Foundation) provided and annotated the wood-anatomical photos shown in Figure 8 and gave graphical support. I am very grateful to Hans-Hubert Leuschner (Göttingen University) for allowing me to work with the Lower Saxony Bog Oak Chronology and to Petra Doeve (RING Foundation; BAAC Archaeology and Building History), Sjoerd van Daalen (Van Daalen Dendrochronologie), Kristof Haneca (Flanders Heritage Agency) and Marjolein van der Linden (BIAX Consult) for contributing data through the DCCD repository and personal communication. Harm Jan Pierik (Utrecht University, Faculty of Geosciences), Menne Kosian (Cultural Heritage Agency of the Netherlands (RCE)) and Rowin J. van Lanen (RCE; Wageningen University) helped with GIS aspects of the work. Kim Cohen (Utrecht University, Faculty of Geosciences) advised me about the calculation of recurrence frequencies. Jos Bazelmans (RCE), Willem Toonen (VU Amsterdam), and an anonymous reviewer provided valuable suggestions which led to significant improvements of this paper. Chronologies A, B and their underlying SBSs are available through DANS/EASY (doi: 10.17026/dans-x3y-xkjm).
Supplementary material
To view supplementary material for this article, please visit https://doi.org/10.1017/njg.2020.10


 Open access

