


The term ‘geopolymers’ was first introduced by Glukovsky (Reference Glukovsky1959) and later used by Davidovits (Reference Davidovits1988) to describe binders produced from aluminosilicate materials (Liebau, Reference Liebau1985), such as clays and feldspars, or industrial waste products, such as coal fly ash and metallic blast furnace slag (Xu & van Deventer, Reference Xu and Van Deventer2003; Brew & MacKenzie, Reference Brew and MacKenzie2007).
There has been significant recent interest in geopolymers because of their physical properties such as high mechanical strength (Zhang et al., Reference Zhang, Sun and Li2010; Ding et al., Reference Ding, Dai and Shi2016), resistance to heat (Fernández-Jiménez et al., Reference Fernández-Jiménez, Pastor, Martín and Palomo2010), anti-corrosion properties (Cui et al., Reference Cui, Zheng, Han, Su and Zhou2008; Babaee & Castel, Reference Babaee and Castel2016) and their potential to reduce energy and carbon emissions (Diop & Grutzeck, Reference Diop and Grutzeck2008; MacKenzie, Reference MacKenzie, Provis and Van Deventer2009; Davidovits, Reference Davidovits2011; Provis, Reference Provis2014; Chakraborty, Reference Chakraborty2014).
Clays, being natural aluminosilicates, are useful as raw materials in various industrial sectors, and they can be used both as supplementary cementitious materials (e.g. Carvalho et al., Reference Carvalho, Carvalho, Pinto and Labrincha2008; Fernandez et al., Reference Fernandez, Martirena and Scrivener2011; Tironi et al., Reference Tironi, Trezza, Scian and Irassar2013; Garg & Skibsted, Reference Garg and Skibsted2014; Hollanders et al., Reference Hollanders, Adriaens, Skibsted, Cizer and Elsen2016) and as primary aluminosilicate precursors in alkali activation, which may be a sustainable alternative to Portland cement (Reig et al., Reference Reig, Tashima, Borrachero, Monzó, Cheeseman and Payá2013; Marsh et al., Reference Marsh, Heath, Patureau, Evernden and Walker2018).
The most common clay material used for geopolymers is dehydroxylated kaolin, known as metakaolin (Duxson et al., Reference Duxson, Mallicoat, Lukey, Kriven and Van Deventer2007; Hounsi et al., Reference Hounsi, Lecomte-Nana, Djétéli and Blanchart2013; Shaqour et al., Reference Shaqour, Ismeik and Esaifan2017). Less frequently, 2:1 dioctaheral-layer silicates such as illite, smectite or even interstratified illite–smectite may be used for the production of these binders. Common clays are abundant and well distributed worldwide in soils; therefore, they represent a valid and cheap raw material for the production of sustainable binders.
This work examines the potential of an illite-kaolinite-rich clay to be used as a low-carbon binder after alkali activation. The studied clays of Lower Cretaceous age (Hauterivian–Barremian) are widely exposed in the region of Kebili (southern Tunisia).
Geological setting
Tunisia is particularly rich in sedimentary deposits that may be exploited for construction purposes. Numerous studies have been carried out on the valorization of natural clay reserves in ceramic and chemical industries throughout the country (e.g. Hajjaji et al., Reference Hajjaji, Moussi, Hachani, Medhioub, Lopez-Galindo and Rocha2010; Bennour et al., Reference Bennour, Mahmoudi, Srasra, Boussen and Htira2015a, Reference Bennour, Mahmoudi, Srasra, Hatira, Boussen, Ouaja and Zargouni2015b; Hammami-Ben Zaied et al., Reference Hammami-Ben Zaied, Abidi, Slim-Shimi and Somarin2015; Selmani et al., Reference Selmani, Essaidi, Gouny, Bouaziz, Joussein, Driss and Rossignol2015; Mahmoudi et al., Reference Mahmoudi, Bennour, Meguebli, Srasra and Zargouni2016; M'barek-Jemaï et al., Reference M'barek-Jemaï, Sdiri, Salah, Aissa, Bouaziz and Duplay2017; Anis et al., Reference Anis, Wissem, Riheb, Biswajeet and Essghaier2019; Mkaouar et al., Reference Mkaouar, Maherzi, Pizette, Zaitan and Benzina2019), but few studies have focused on the southern range of the Chotts zone.
The study area corresponds to the convergence of several structural domains in southern Tunisia. It is bounded to the north by the Southern Atlas, to the east by the coastal Jeffara plain and to the south by the platfoxrm of Daher and the Tebaga chain of Kebili (Fig. 1).
(a) Location of the studied area (triangle symbol: sampling points), (b) Panoramic view of the area.
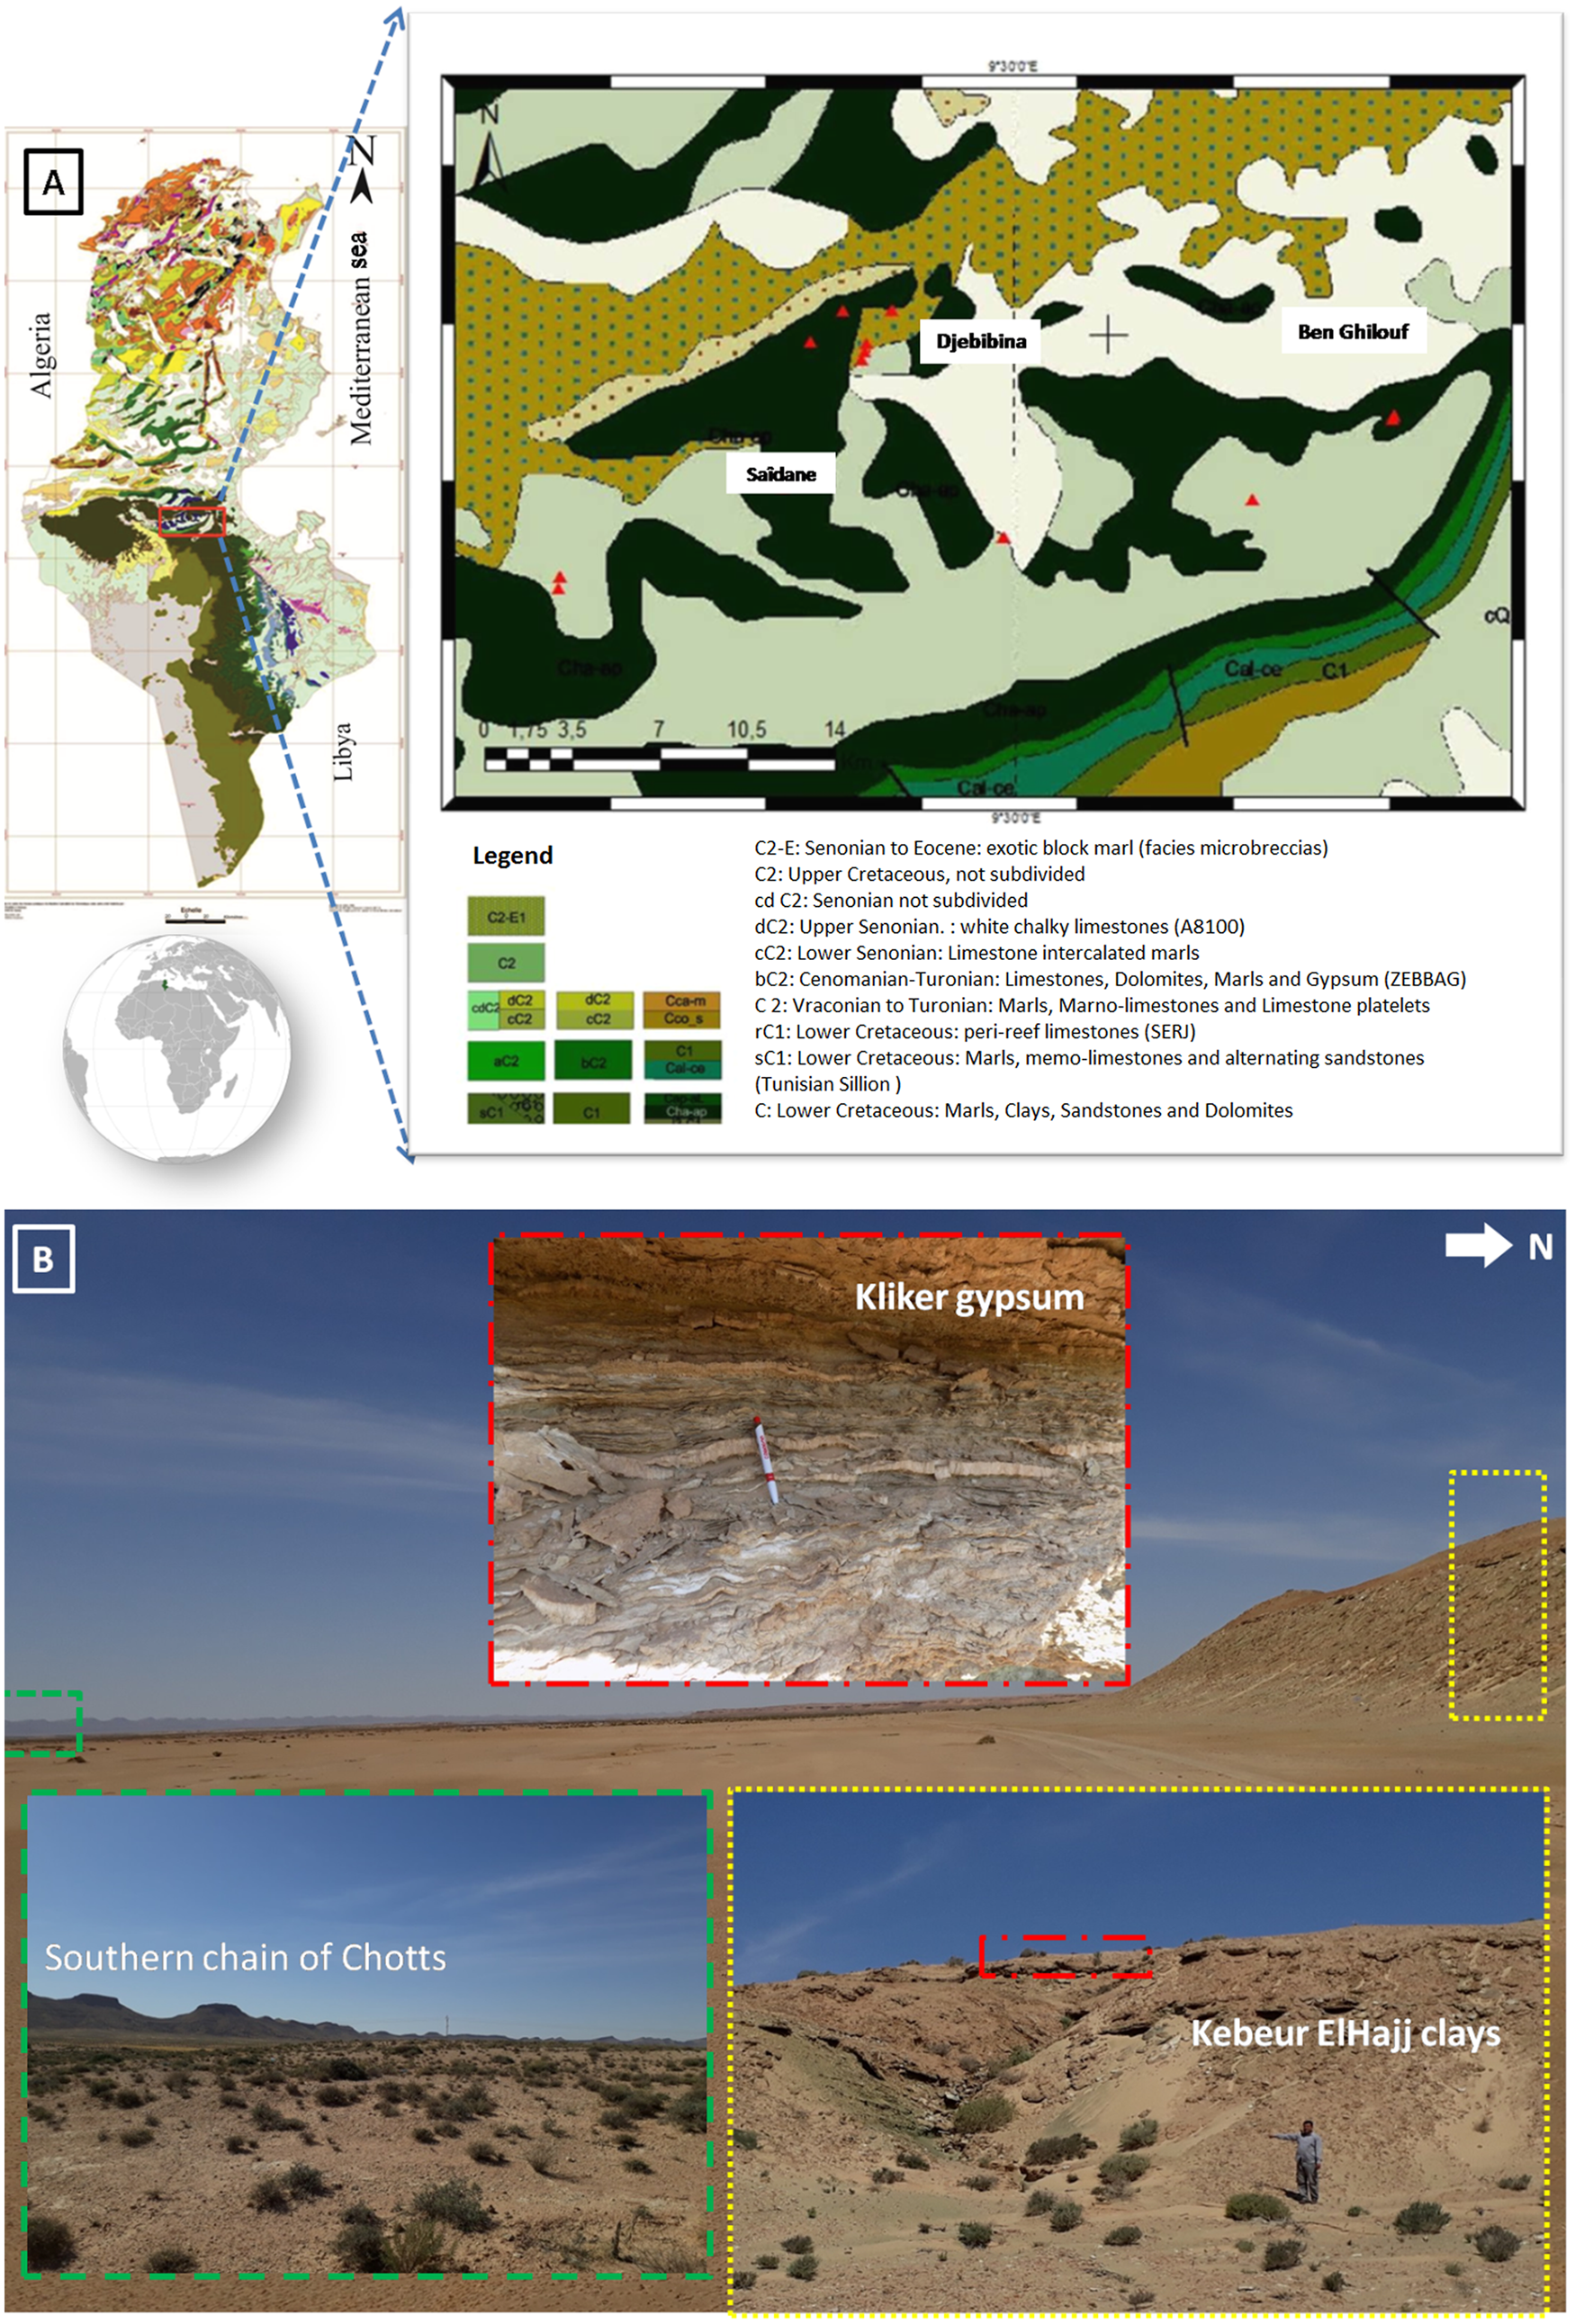
During the Cretaceous, the Chotts zone, particularly the southern range and the eastern part of the north range, was a site of tectonic activity that controlled sedimentation in this basin (Abbes & Tlig, Reference Abbes and Tlig1991). Thus, the southern chain of the Chotts zone corresponds to a monoclinal set of approximately east–west direction, sloping at 30–40° towards the south (Ghanmi & Potfaj, Reference Ghanmi and Potfaj1991). It consists of an alignment of Cretaceous ridges that extend for ~100 km from the El Hamma region to Kebili (Ghanmi & Potfaj, Reference Ghanmi and Potfaj1991).
Previous work on the stratigraphic series of the basin of the Chotts zone (e.g. Rabia, Reference Rabia1984; Ben Youssef & Peybernes, Reference Ben Youssef and Peybernes1986) increased brought stratigraphic precision in the Lower Cretaceous (Barremian–Albian). The zone of interest corresponds to the Bouhedma and Sidi Aîch Formations of Barremian age, which comprise six lithostratigraphic units: from the base to the top, Ben Ghilouf, Doukhane, Kebeur ElHajj, Kliker, Berada and SidiAîch (Ghanmi & Potfaj, Reference Ghanmi and Potfaj1987). All of these formations are composed of an alternation of gypsum, clays, sandstones and carbonates with silicified wood. The thickness of the Barremian series varies from ~350 m in the region of Tebaga Kebili (Oued el Guetar) in the south to ~800 m in the region of Bir Rekeb (Oued Tmirina) in the north (Abbes & Tlig, Reference Abbes and Tlig1991).
Experimental methods and material characterization
X-ray diffraction (XRD) measurements were performed using a Panalytical X'Pert Pro diffractometer equipped with a Co anode X-ray tube (40 kV, 40 mA), a Bragg-BrentanoHD optical module and an X'Celerator detector (with a detection length of 2.122°2θ). The divergence slit was fixed at 1/4°, primary and secondary Soller slits were fixed at 0.04 rad and a spinning sample holder (27 mm diameter) was adopted to obtain optimum particle statistics.
The samples were back-loaded into the sample holders, and diffraction patterns were collected in the 3–85°2θ range, with a 0.02°2θ step size, counting an equivalent time of 100 s per step. Quantitative phase analysis was performed using the Rietveld method.
Atomic absorption spectroscopy was used for the determination of the major element composition. The loss on ignition was evaluated from the weight difference between samples heated at 100°C and 1000°C for 2 h. The results are expressed in percentage concentration of oxides. The specific surface area was used to record the clay-fraction activity, and it was determined with the methylene blue index method. A total of 10 g of powdered clay was dispersed in 100 mL of distilled water and mixed with the methylene blue solution (10 g L–1) (Sivapullaiah et al., Reference Sivapullaiah, Prasad and Allam2008). One drop of this suspension was placed on filter paper, and the specific surface was determined from the amount of adsorbed methylene blue (Ferrari & Gualtieri, Reference Ferrari and Gualtieri2006).
The Atterberg limits were determined using the Casagrande method (LCPC, 1987; Grabowska-Olszewska, Reference Grabowska-Olszewska2003) with an experimental error of ±3 SD. The grain-size distribution was obtained by wet granulometric analysis. Micro-size analysis was performed by sedimentation in a Micromeritics SediGraph 5120 particle-size analyser in the size range 0.1–300 μm. Compressive strength tests were performed on hardened alkali-activated samples consisting of prisms of 1.5 cm in diameter and 6.0 cm in height using a Sun 2500 universal benchtop testing machine (Galdabini, Varese, Italy), with a full-scale of 2500 N and an accuracy of 0.03%.
Fourier-transform infrared (FTIR) spectra of the studied clays were obtained using the KBr pellet technique with a Perkin Elmer 783 FTIR spectrometer in the range 4000–400 cm−1. Scanning electron microscopy (SEM) images were obtained on polished sections to observe the microstructure of the reacted samples using a CamScan MX3000 (Applied Beams, Beaverton, OR, USA). Thermal analysis was performed using a Mettler Toledo TGA/DSC 3+ thermal analyser (Zurich, Switzerland) in static air and from room temperature up to 1200°C with a temperature ramp of 10°C min–1.
Semi-adiabatic calorimetry was carried out using Omega (Norwalk, CT, USA) thermocouples and Styrofoam containers with a measured coefficient of heat loss of 25 mJ K–1 s–1.
Clay sampling and characterization
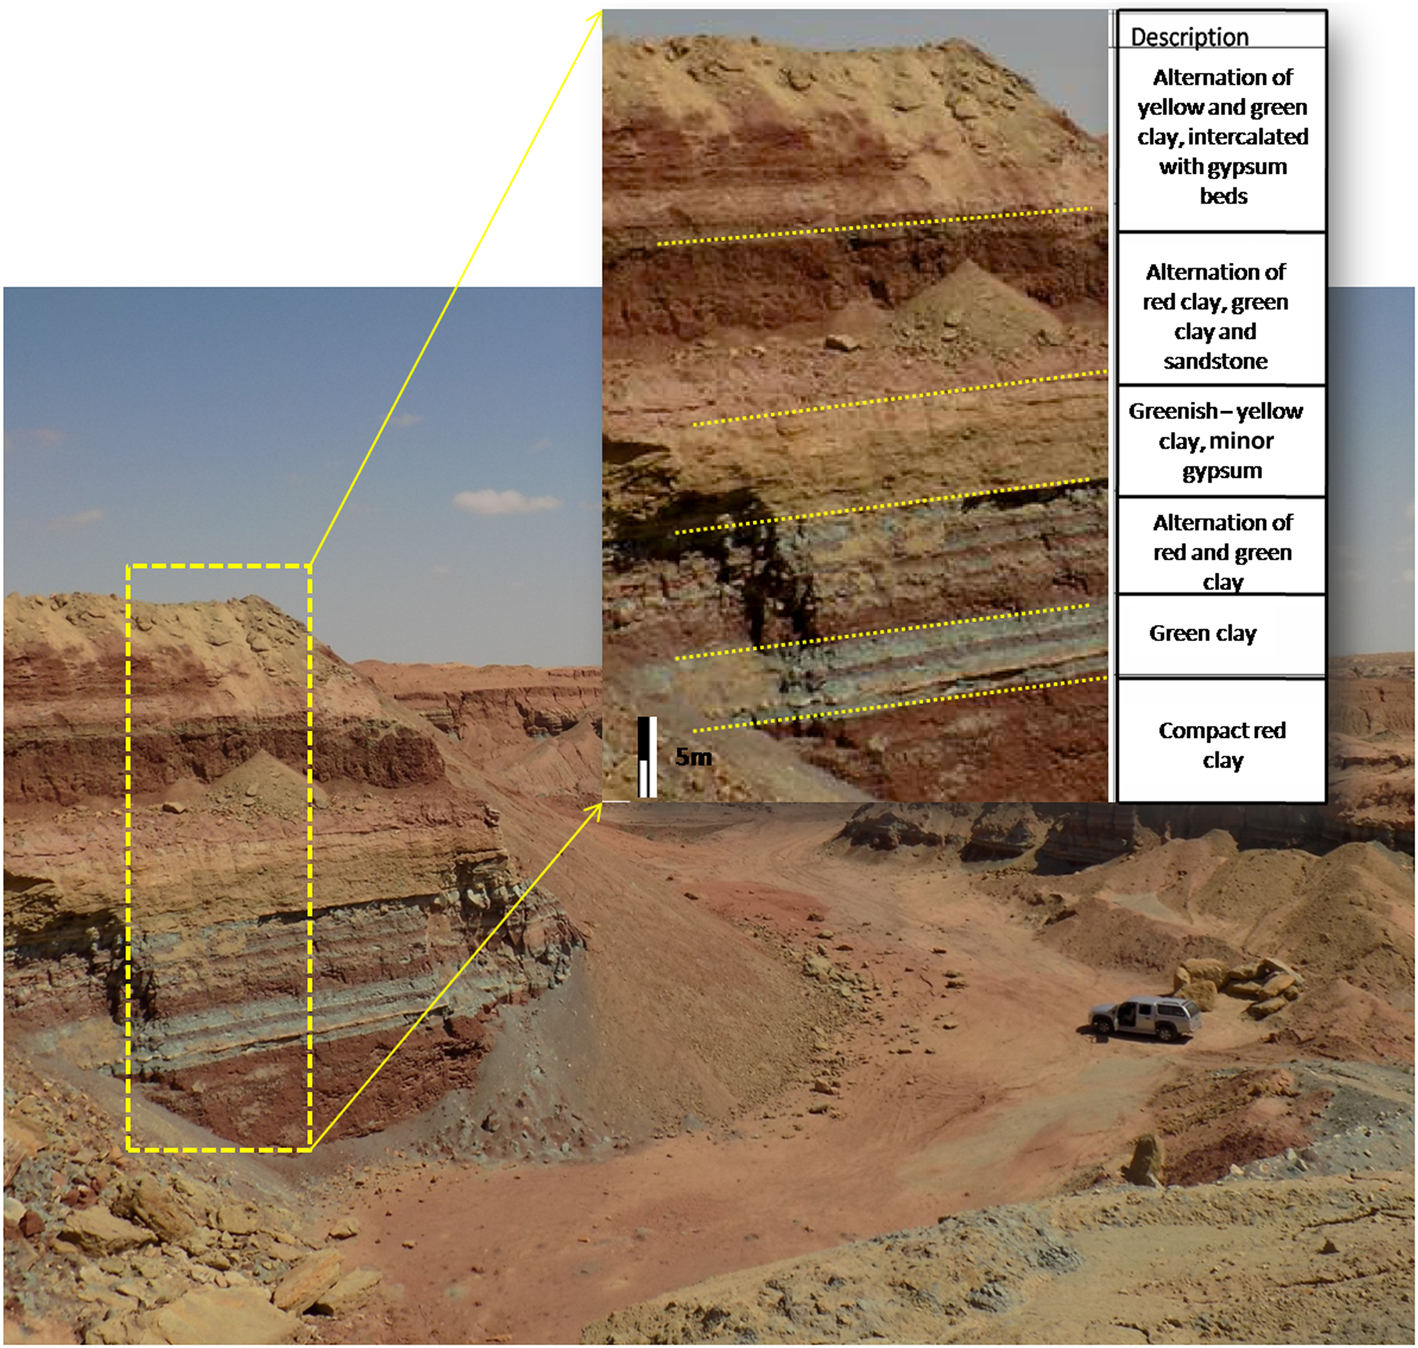
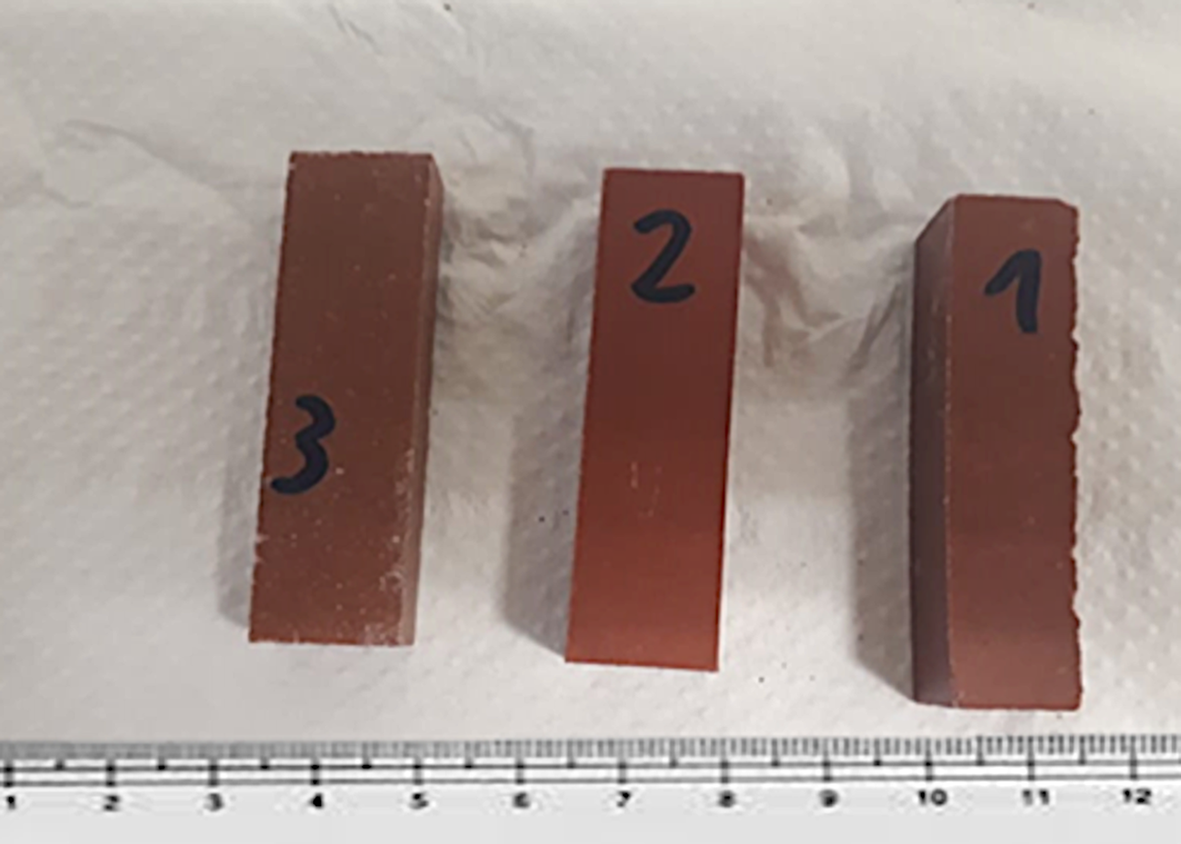
Clay samples were collected from the base of the Lower Cretaceous series (Hauterivian–Barremian) in widely exposed outcrops in the region of Kebili (southern Tunisia). Figure 2 shows the alternation of red, green and yellow clays with the intercalation of other lithologies, including gypsum, marl and sandstone. Forty-five samples were collected from each level. These samples were blended and quartered to ensure representability and labelled Cr1, Dj1, C2 and BM2 for laboratory assessment, including identification of clay properties and behaviour upon alkali activation.
Photograph of red–yellow–green superposed clays from the Kebili region (Lower Cretaceous).
The chemical compositions of the raw samples are reported in Table 1. The samples are characterized by SiO2 contents in the range 47–56% and Al2O3 contents in the range 13–18%. The Al2O3:SiO2 ratio is close to the minimal optimum value (0.3) for clay reactivity in cement systems (Alujas Diaz, pers. comm.), except for sample Dj1, for which the Al2O3:SiO2 ratio was 0.2. The average alkali content (K2O + Na2O) is 5.4%. Generally, alkalis in clays reduce their refractory characteristics. The loss on ignition varies between 9% and 13% due to carbonate decomposition clay mineral dihydroxylation and sulfur decomposition (Nayak & Singh, Reference Nayak and Singh2007; Celik, Reference Celik2010; Boussen et al., Reference Boussen, Sghaier, Chaabani, Jamoussi and Bennour2016; Mahmoudi et al., Reference Mahmoudi, Bennour, Meguebli, Srasra and Zargouni2016).
Chemical composition (wt.%) of the raw materials.
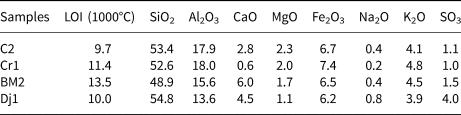
The analytical error is ±2%.
LOI = loss on ignition.
The mineralogical composition of the samples is listed in Table 2. The clay mineral content exceeds 50% in all samples. Illite is the dominant clay mineral and kaolinite is present in smaller amounts (illite:kaolinite ratio ≈ 4:1). All samples contain significant amounts of quartz. Carbonate phases (dolomite and/or calcite) are present in all samples except Cr1. Significant amounts of gypsum are present in sample Dj1. Iron oxides are detected in Cr1 and Dj1.
Mineralogical composition (wt.%) of the raw materials.
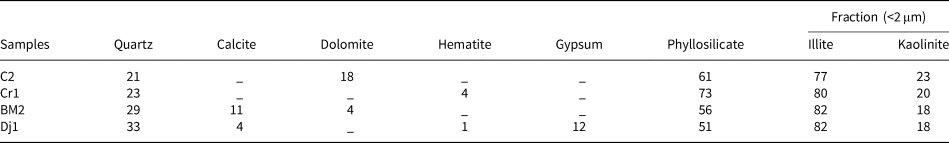
The analytical error is ±5%.
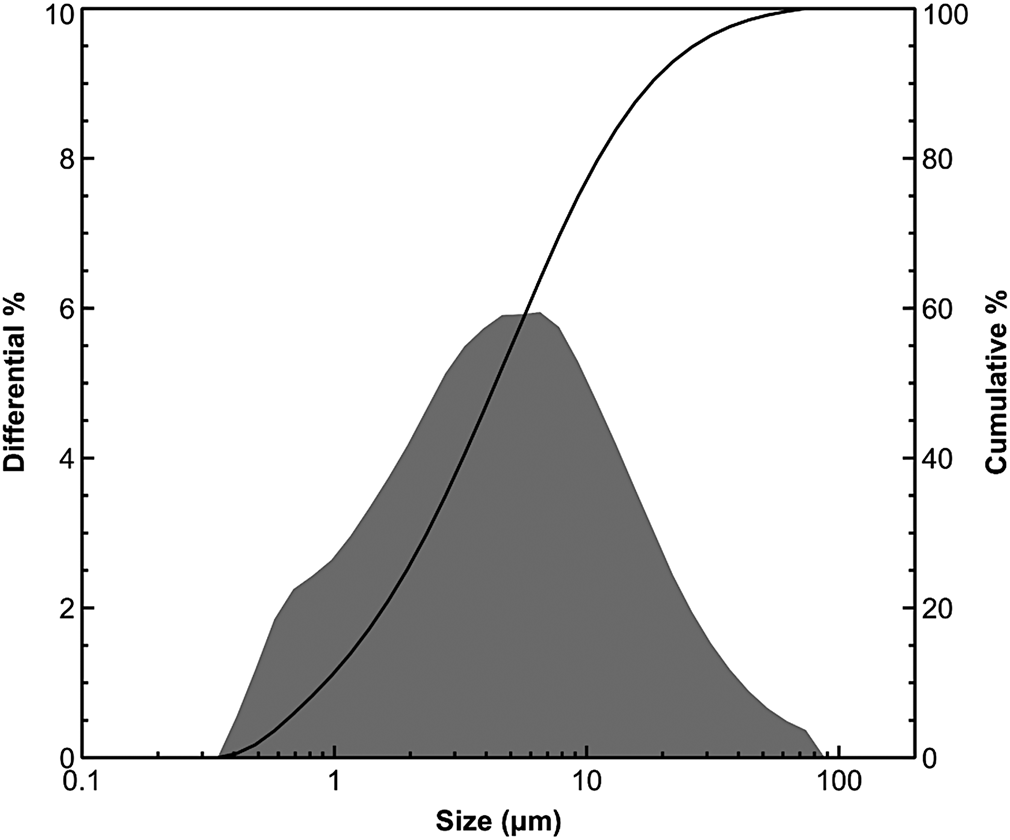
The grain-size distribution of representative samples, obtained by laser scattering, revealed a predominance of the silt fraction (2–20 μm). This fine fraction is acceptable for geopolymer synthesis (Allahverdi & Kani, Reference Allahverdi and Kani2009; Merabtene et al., Reference Merabtene, Kacimi and Clastres2019). Figure 3 shows the particle-size distribution curve of the C2 sample.
Micro-granulometric analysis of the C2 sample.
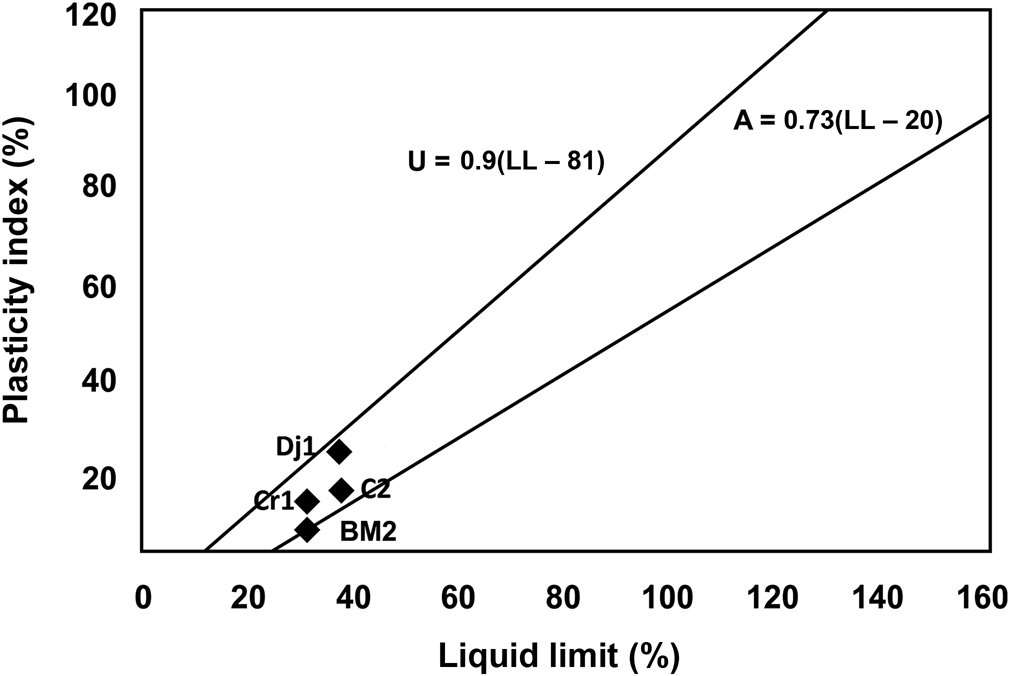
The relatively low values of specific surface area (38 m2 g–1), determined using the methylene blue index method, are consistent with the lack of expansible clay minerals and the existence of abundant non-clay minerals (i.e. quartz, calcite). Plasticity measurements showed a moderate plasticity index (Fig. 4).
Plasticity of the studied samples Dj1, C2, BM2 and Cr1. Projection of the samples in the Casagrande diagram (Casagrande, Reference Casagrande1947). The A line separates clays from silts. The U line defines the upper limit of the correlation between PI and LL. LL = liquid limit; PI = plasticity index.
The FTIR spectra of the samples are typical of phyllosilicates (Srasra et al., Reference Srasra, Bergaya and Fripiat1994; Madejová, Reference Madejová2003), with bands at 3620 cm–1 attributed to octahedral OH-stretching in illite and the inner hydroxyls of kaolinite (Fig. 5). The stretch band at 3693 cm–1 corresponds to the inner surface octahedral OH of kaolinite. The bands close to 1635 and 1425 cm–1 indicate water and carbonates, respectively (Petit, Reference Petit, Bergaya and Lagaly2006). Bands in the low-frequency range (1200–900 cm–1) are associated with the presence of quartz, especially those at 1030 and 915 cm–1, and clay minerals. Quartz, present to significant extents in all of the samples, also presents two other characteristic bands at 800 and 781 cm–1 (Farmer, Reference Farmer1974; Hajjaji et al., Reference Hajjaji, Kacim, Alami, El Bouadili and El Mountassir2001, cited in Sdiri et al., Reference Sdiri, Higashi, Hatta, Jamoussi and Tase2010). A large band at 1032 cm–1 is attributed to Si–O–Si of the clay minerals (Handke & Mozgawa, Reference Handke and Mozgawa1993; Mozgawa et al., Reference Mozgawa, Sitarz and Rokita1999).
FTIR spectra of the studied raw materials.
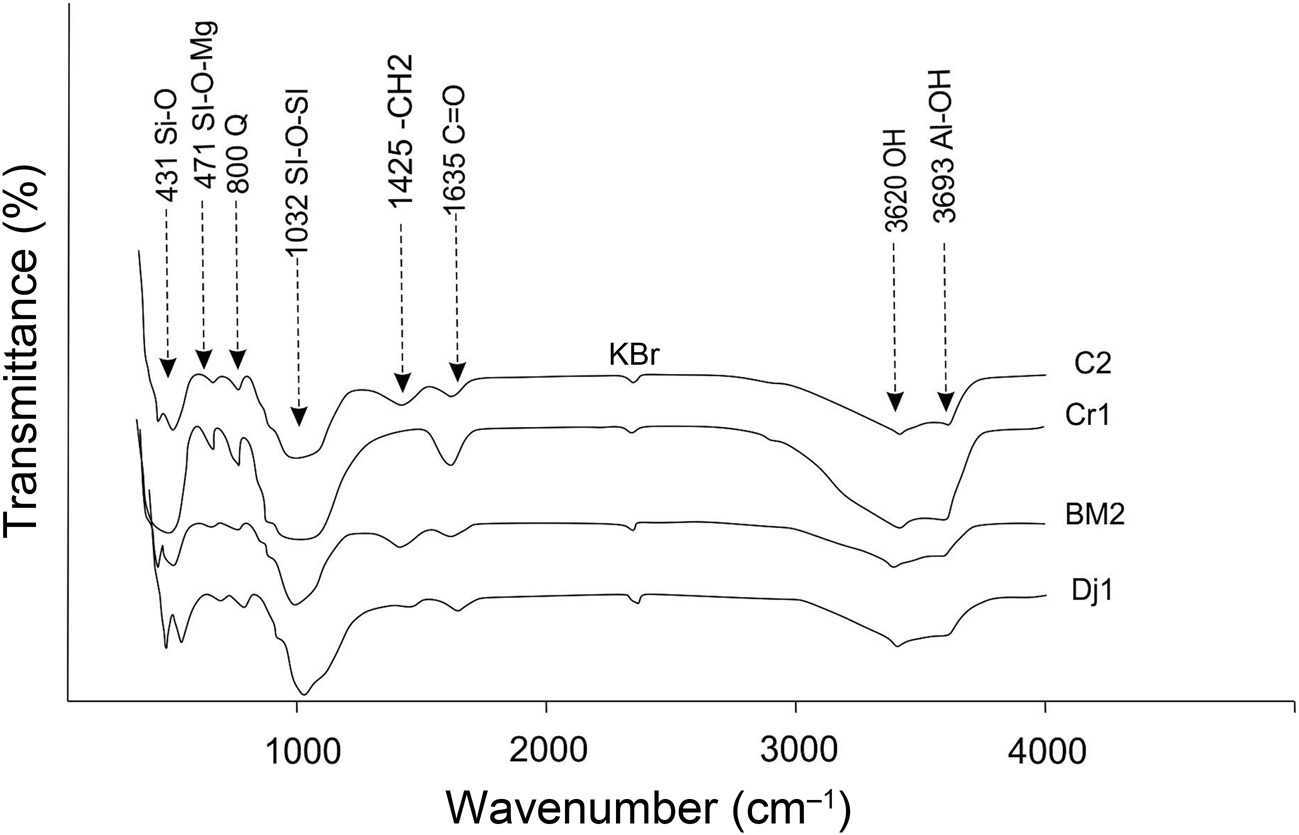
The band at 471 cm–1 is attributed to Si–O–Mg bending (van der Marel & Beutelspacher, Reference van der Marel and Beutelspacher1976). The C=O elongation vibration was recorded at 1720 cm–1 (Guo & Rockstraw, Reference Guo and Rockstraw2006). The FTIR results obtained are in agreement with the chemical and mineralogical results mentioned earlier in the text.
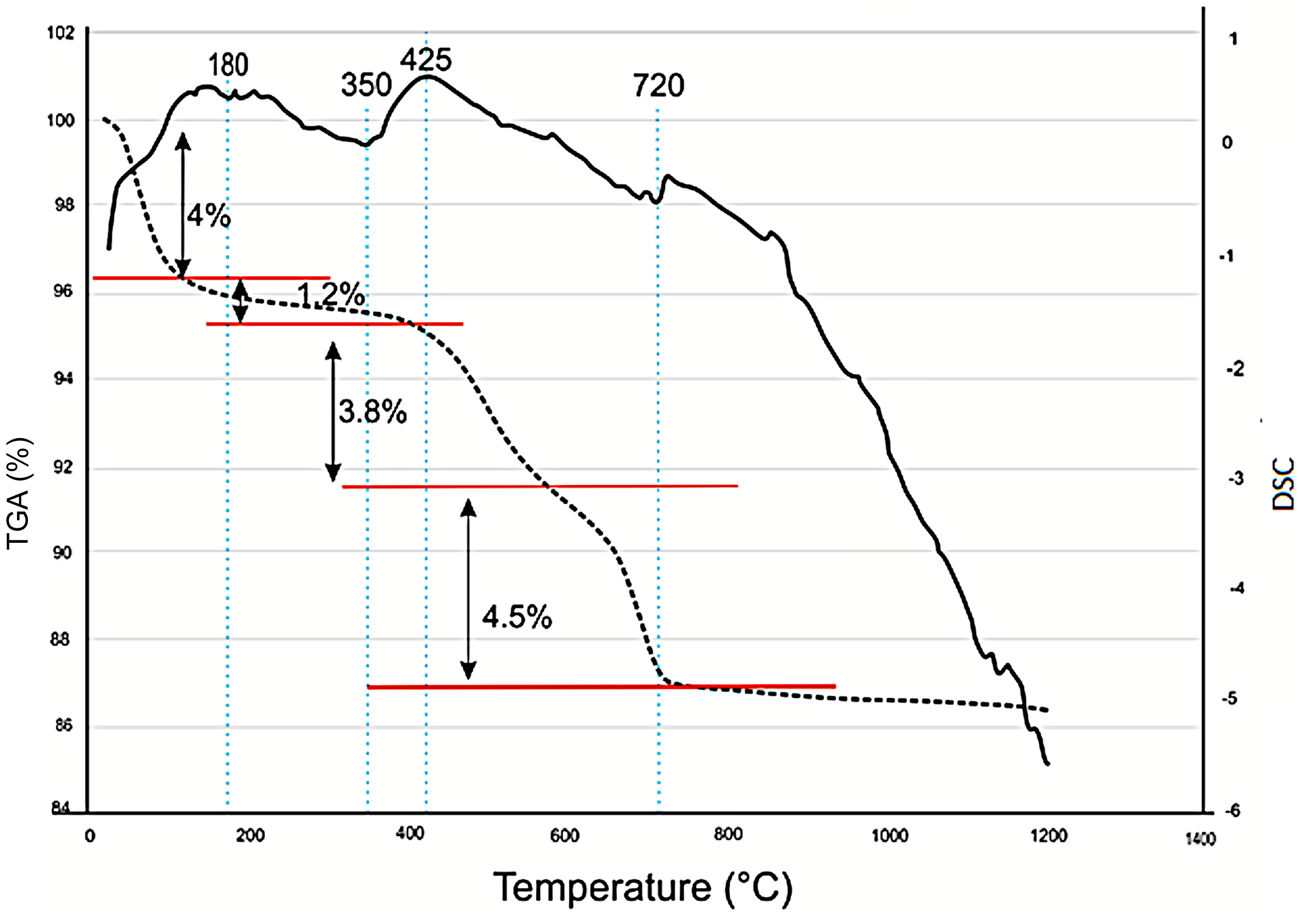
A representative differential scanning calorimetry (DSC)/thermogravimetric analysis (TGA) curve of the C2 sample is displayed in Fig. 6. The first endothermic peak at 180°C corresponds to the removal of adsorbed water, with a total loss of mass of 5.2%. A second exothermic peak appears at 425°C, which corresponds to the decomposition of organic matter with a mass loss of 3.8% (Mahmoudi et al., Reference Mahmoudi, Bennour, Meguebli, Srasra and Zargouni2016). A third endothermic peak is detected at 720°C, corresponding to decarbonation and associated with a mass loss of ~4.5%. Previous thermal analyses performed on clays containing kaolinite and illite provided similar results (Bennour et al., Reference Bennour, Mahmoudi, Srasra, Hatira, Boussen, Ouaja and Zargouni2015b).
TGA/DSC curves and weight loss (%) for the C2 sample. DSC is shown by the continuous line and TGA is shown by the dotted line.
Binder preparation and testing
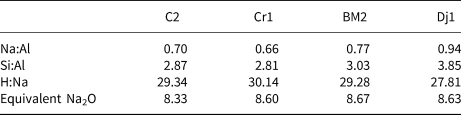
The clay samples were dried in an oven at 80°C prior to grinding. Calcination was then carried out in an electric furnace at 800°C for 5 h. Depending on the clay composition, the calcination temperature commonly varies between 600°C and 900°C (Mohammed, Reference Mohammed2017) and enhances reactivity in an alkaline environment due to structural breakdown of clay minerals subsequent to dehydroxylation (He et al., Reference He, Osbaeck and Makovicky1995; Sabir et al., Reference Sabir, Wild and Bai2001; Dietel et al., Reference Dietel, Warr, Bertmer, Steudel, Grathoff and Emmerich2017). Prior to mixing with the alkaline activator, the clay samples were blended with waste marble powder. The purpose of this addition was to enhance further the environmental properties of the binder by reusing a waste material that would otherwise be landfilled and to reduce the amount of alkaline activator needed due to dilution of the clay component, considering that the largest contribution to the CO2 emissions of geopolymers is associated with the alkaline activators. It has been shown that, while reducing the environmental footprint, the addition of up to 30% of waste calcium carbonate does not negatively affect the materials’ properties (Valentini et al., Reference Valentini, Mascarin, Ez-zaki, Bediako, Mwiti Marangu and Bellotto2020). Marble waste from Tunisian quarries has been used previously in the preparation of self-compacting concrete (Alyousef et al., Reference Alyousef, Benjeddou, Khadimallah, Mohamed and Soussi2018). Considering that marble production in Tunisia represents an important industrial sector (Ministry of Industry and SMEs, Republic of Tunisia, 2014) and that up to 60% of the gross production of waste occurs during marble quarrying, polishing and processing (Montani, Reference Montani2017), the addition of this waste has potential for the development of sustainable binders based on locally sourced raw materials through adopting a circular economy approach. Each sample consisted of 40.00 g of calcined clay, 10.00 g of marble powder, 11.24 g of sodium silicate pentahydrate powder and 24.80 g of water according to a one-part geopolymer approach (Luukkonen et al., Reference Luukkonen, Abdollahnejad, Yliniemi, Kinnunen and Illikainen2018). The resulting elemental molar ratios are reported in Table 3.
Mix design elemental ratios and the equivalent Na2O values of the geopolymers.
After mixing for 3 min, part of the paste was used to perform semi-adiabatic calorimetry measurements to assess qualitatively the early reaction kinetics. The results obtained are within the accepted limits for semi-adiabatic calorimetry (RILEM, 1997). The detailed procedure is described elsewhere (Valentini et al., Reference Valentini, Contessi, Dalconi, Zorzi and Garbin2018). The remaining paste was placed in Teflon moulds and cured at 95% relative humidity and ambient temperature for 3 days. Subsequently, the samples were demoulded and cured at ambient humidity and temperature for 7 days until compressive strength testing (Fig. 7) was carried out using a universal benchtop testing machine. After mechanical testing, the samples were kept in ethanol for 24 h and prepared for XRD and SEM analyses after drying. The XRD measurements were obtained using the same experimental conditions used for the unreacted samples described in the previous section. Microstructure analysis was performed on polished sections using a SEM equipped with an energy-dispersive spectrometer (EDS).
Specimens of prepared geopolymers of each sample.
Results and discussion
Phase composition and microstructure
The disappearance of kaolinite basal and prismatic reflections was observed for the calcined samples (Fig. 8). The illite peaks were reduced in intensity, but did not disappear completely. Previous studies have shown that dehydroxylated illite persists at 800°C and only displays complete structural collapse at temperatures ≥1000°C (McConville & Lea, Reference McConville and Lee2005). Dolomite also disappeared in sample Dj1, and gypsum was converted to anhydrite. Hematite is observed in all of the calcined samples.
XRD traces for the four clay samples before calcination (raw), after calcination (calc.) and after reaction (react.). Phase identification was based on International Centre for Diffraction Data (ICDD) and Crystallography Open Database (COD) databases. I = illite; K = kaolinite; Q = quartz; C = calcite; A = anatase; F = feldspar; D = dolomite; H = hematite; G = gypsum; An = anhydrite; S = sodium carbonates (trona, thermonatrite); B = burkeite.
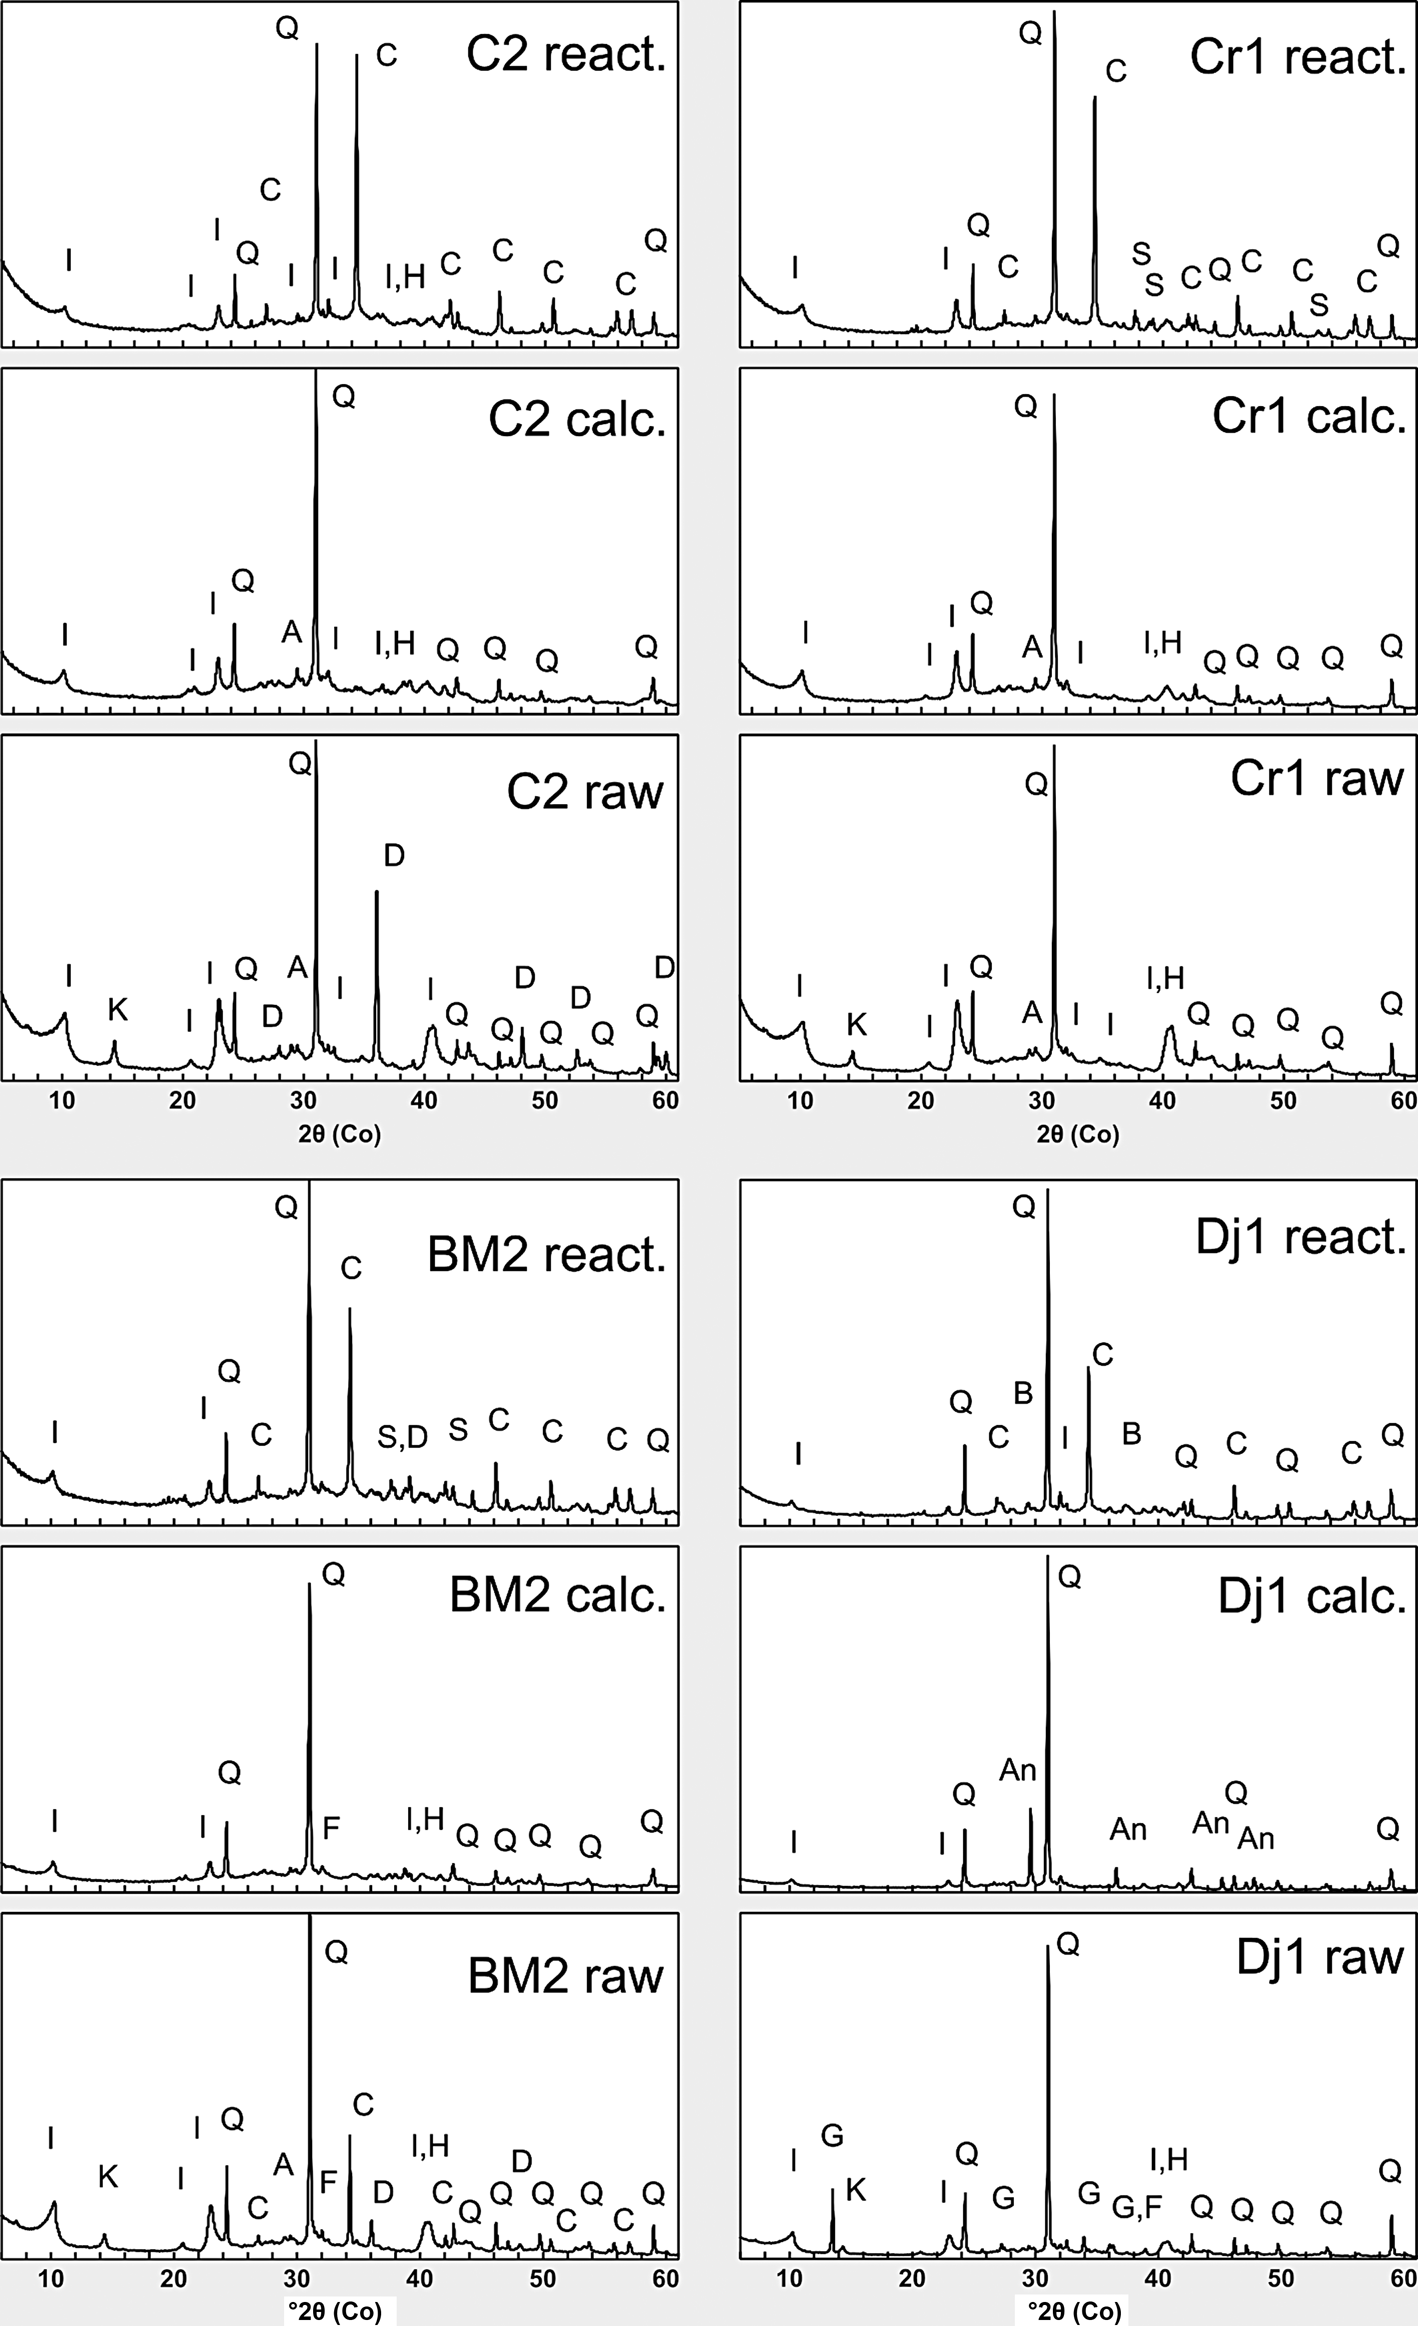
Upon reaction with the alkaline activator, alkaline carbonates (trona, thermonatrite) formed in samples Cr1 and BM2. These phases formed through the reaction of the Na+ ions present in the solution with atmospheric CO2, as well as carbonate ions being derived from partial dissolution of calcite present in the waste marble. Burkeite (Na6(CO3)(SO4)2) formed in the Dj1 sample containing sulfates. The presence of calcite in all of the samples is due to the addition of waste calcium carbonate.
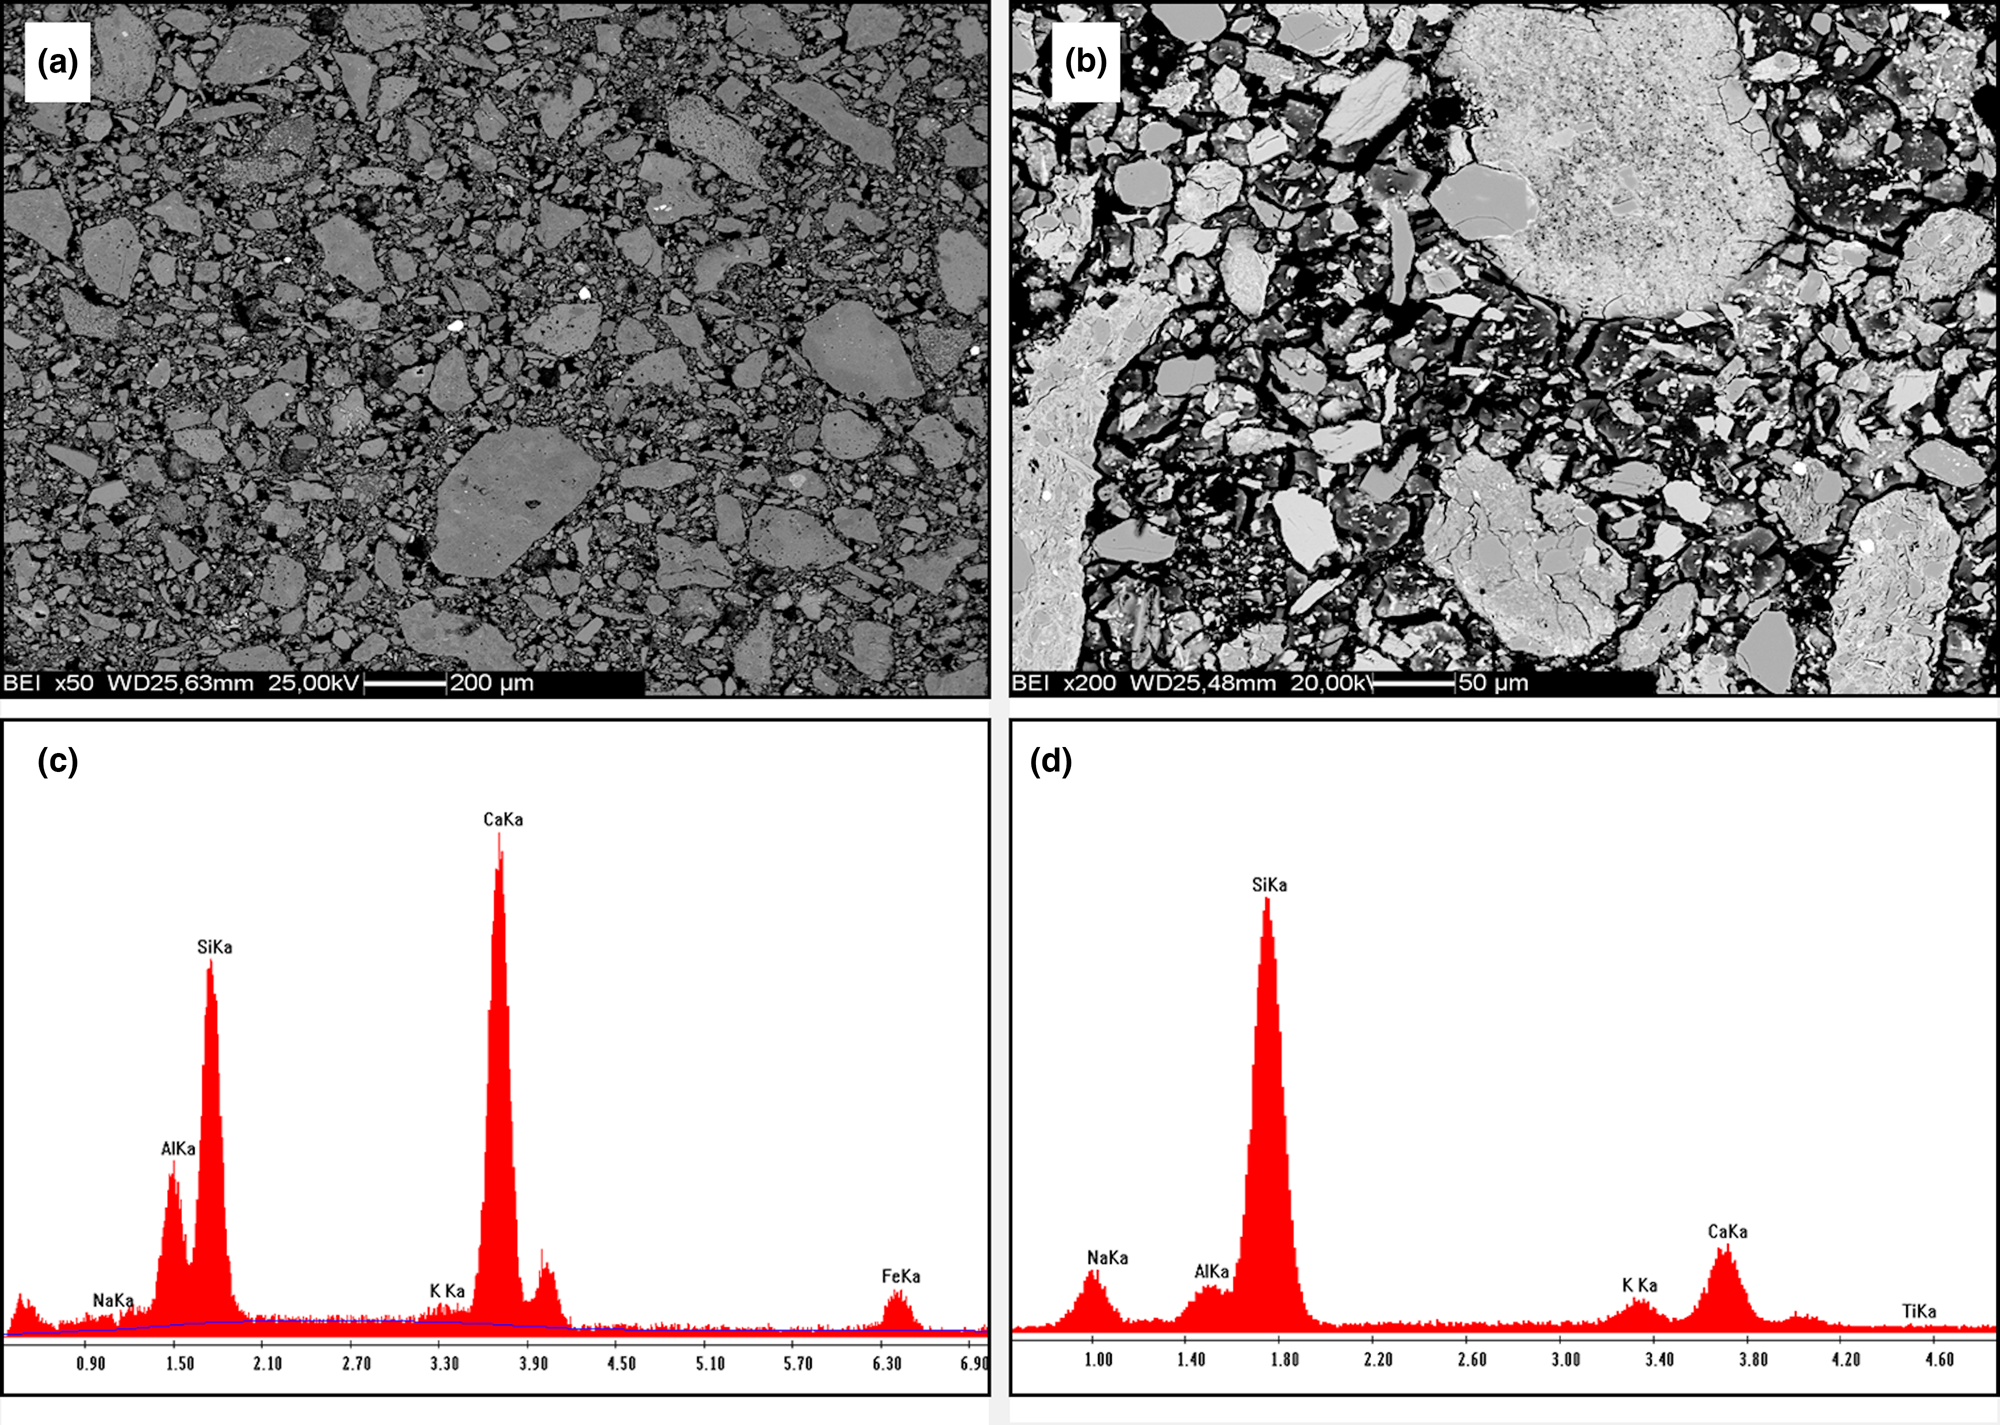
The SEM back-scatter detector images display microstructures consisting of grains of clay minerals, quartz and carbonates surrounded by a matrix of variable compactness and porosity (Fig. 9a,b). The composition of the matrix consisted of varying ratios of Si, Al, Na and Ca, which may suggest a co-precipitation of Na,Al-silicate hydrate (N-A-S-H) and Ca,Al-silicate hydrate (C-A-S-H) phases (Fig. 9c,d).
SEM back-scatter detector images of reacted samples C2 (a) and Dj1 (b). (c,d) Example compositions of the sample matrices obtained using EDS analysis.
Strength development and reaction kinetics
The compressive strengths of samples C2, Cr1, BM2 and Dj1 after 7 days were 25.0, 11.5, 10.6 and 8.0 MPa, respectively, indicating non-refractory clays (Salah et al., Reference Salah, Sdiri, Jemai and Boughdiri2018). Although the XRD results show that only kaolinite, which represents only a minor fraction of the total clay mineral content, became completely amorphous upon thermal treatment, samples such as C2 developed satisfactory mechanical strength. Essaidi et al. (Reference Essaidi, Samet, Baklouti and Rossignol2013, Reference Essaidi, Samet, Baklouti and Rossignol2014) showed similar results for the illitic–kaolinitic Medenine clays calcined at 800°C.
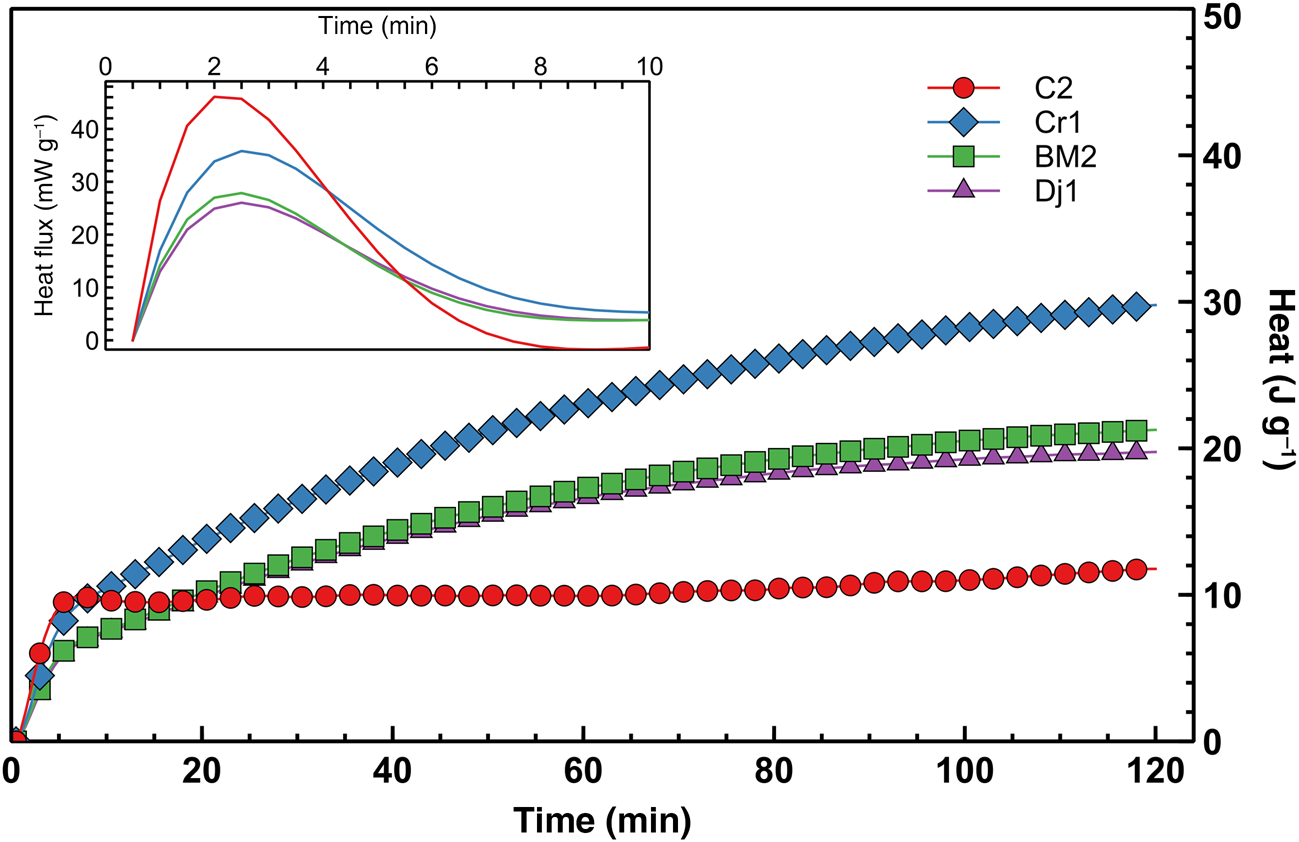
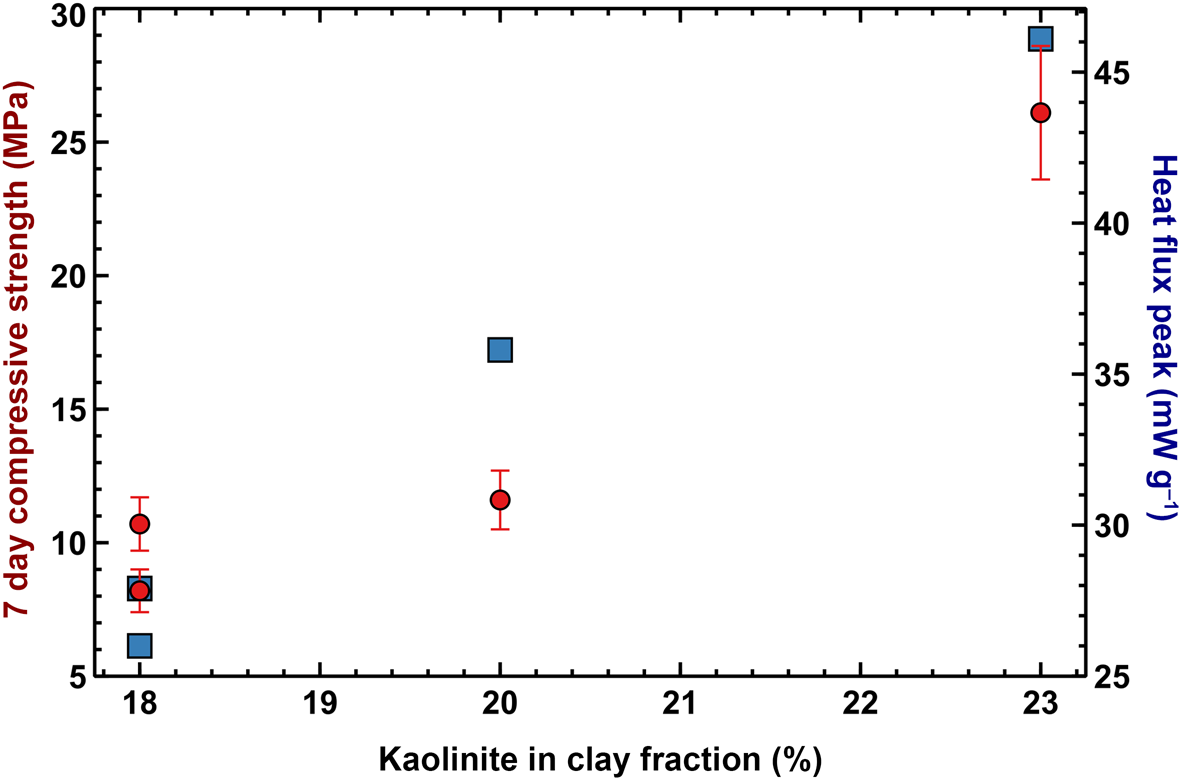
The early-stage reaction kinetics, as assessed by semi-adiabatic calorimetry, are shown in Figure 10. The cumulative heat release over the first 2 h of reaction is not correlated with the mechanical performance at 7 days, but seems to be proportional to the amount of heat released during the very early stages of the reaction, where the large exothermic peaks after ~2 min are probably associated with exothermic dissolution of the solid alkaline activator. However, as the mass ratio between sodium silicate and water was equal for all of the mixes, the varying magnitudes of the peaks may be related to the varying degrees of early aluminosilicate dissolution, facilitated by the temperature increase that was induced by the dissolution of the alkaline activator. Both the early heat release and compressive strength are proportional to the amount of kaolinite in the clay mineral fraction (Fig. 11), suggesting that the kaolinite:illite ratio exerts primary control over the development of a stiff matrix due to the total structural collapse of kaolinite with respect to illite resulting in better reactivity. Nevertheless, although samples C2 and Cr1 have similar kaolinite contents, the former displays significantly greater compressive strength. This might be due to the thermal decomposition of the dolomite present in sample C2 that leads to the formation of MgO, which contributes to strength development, although its presence is not easily detectable in the XRD pattern. Previous studies have suggested that the presence of MgO in geopolymers is beneficial to strength development due to the mitigation of shrinkage (Li et al., Reference Li, Zhang, Wang, Chen, Jia and Cong2019).
Semi-adiabatic calorimetry heat release curve (differential curve over the first 10 min displayed in the inset).
Kaolinite percentage in the clay fraction vs compressive strength (red circles) and vs magnitude of the peak in the differential heat release curve (blue squares).
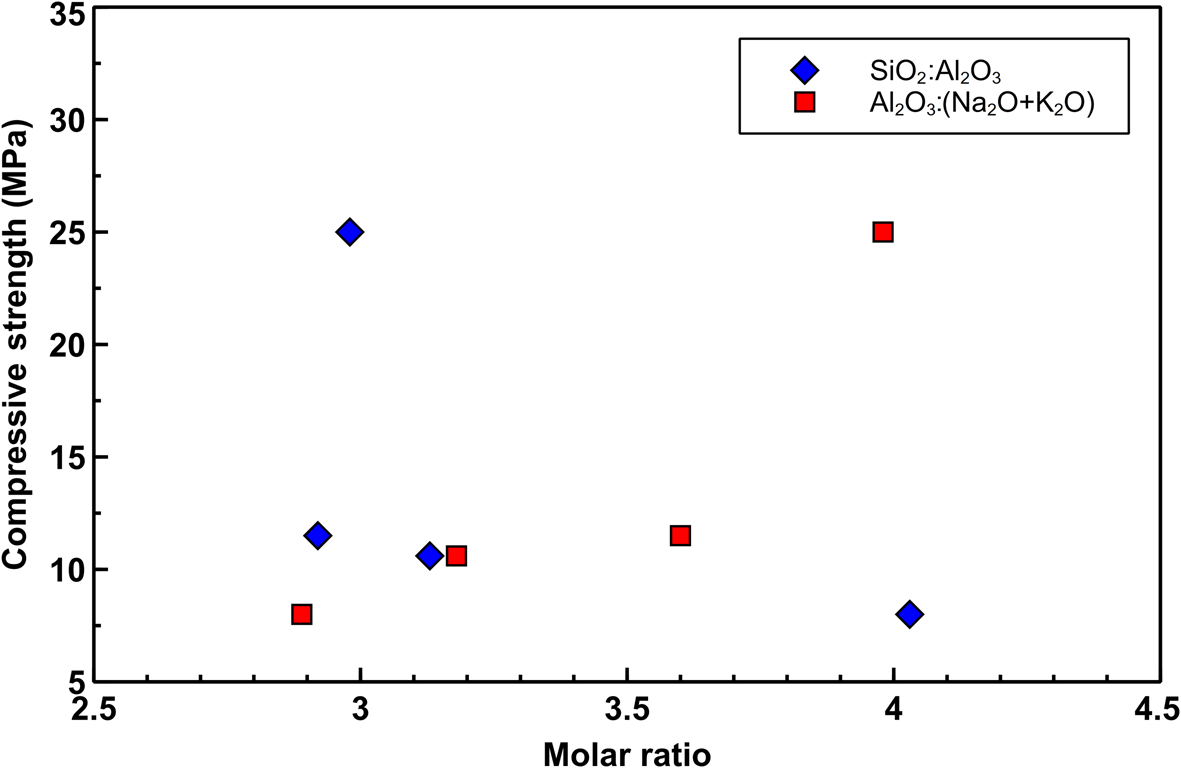
The mechanical results are correlated with the SiO2:Al2O3 and Al2O3:(N2O + K2O) ratios. The strength of the hardened pastes decreases slightly with increasing SiO2:Al2O3 ratios and increases with increasing Al2O3:(N2O + K2O) ratios (Fig. 12) (Keppert et al., Reference Keppert, Vejmelková, Bezdička, Doleželová, Čáchová and Scheinherrová2018).
Correlation between the SiO2:Al2O3 and Al2O3:(N2O + K2O) ratios and compressive strength.
Conclusion
This study yielded satisfactory results for geopolymeric binders based on natural clays collected from the Kebili region of southern Tunisia, consisting of clay fractions dominated by illite and lesser amounts of kaolinite. Although the kaolinite contents of these clays are <30%, these materials showed promising mechanical performance upon thermal treatment and alkali activation, reaching mechanical strengths of 25 MPa after 1 week for sample C2, which contains significant amounts of dolomite in addition to illite and kaolinite. The addition of waste marble was not detrimental to mechanical strength, while being beneficial in terms of environmental performance. Partial dissolution of the calcite present in waste marble seems to lead to the co-precipitation of N-A-S-H and C-A-S-H products, as suggested by the significant amounts of Ca present in the matrix.
Mechanical results were discussed in terms of the SiO2:Al2O3 and Al2O3:(N2O + K2O) ratios. These results indicate that the higher compressive strength matches with lower SiO2:Al2O3 ratios and higher Al2O3:(N2O + K2O) ratios, which reflects the kaolinite content before alkali activation.
This study shows that careful selection of raw materials based on mineralogical and chemical analysis is fundamental for the achievement of suitable material properties. Additional studies will be necessary to assess the suitability of the Kebili clays for the industrial production of sustainable building materials by optimization of the mix design as well as of other properties, such as workability and durability.
Acknowledgements
The authors thank all of the laboratory staff in the institutions where the analyses were carried out: Inter-Departmental Research Centre for the Study of Cement Materials and Hydraulic Binders (Padua, Italy), National Office of Mines (ONM; Tunisia) and the National Centre of Research in Materials Sciences (CNRSM; Tunisia).


