


1. Introduction
The equilibrium line is the theoretical line on a glacier where annual mass accumulation equals annual mass loss. Glacier behaviour such as advance or retreat is controlled by variations in the equilibrium line (Reference Wang, He, Pu, Xi and JingWang and others, 2010). Variations in the glacier equilibrium-line altitude (ELA) are more sensitive to climate change than are variations in glacier length or area, and thus have been studied to understand the relationships between glacier variations and climate regime (e.g. Reference Kuhn and OerlemansKuhn, 1989; Reference Ohmura, Kasser and FunkOhmura and others, 1992; Reference Fountain, Lewis and DoranFountain and others, 1999; Reference Benn and LehmkuhlBenn and Lehmkuhl, 2000; Reference Wang, He, Pu, Xi and JingWang and others, 2010; Reference Rabatel and EckertRabatel and others, 2013). To date, because it is difficult to access glaciers to conduct fieldwork, the ELAs of only a few glaciers have been studied using instrumental data (Reference Kaser, Cogley, Dyurgerov, Meier and OhmuraKaser and others, 2006; WGMS, 2012). In recent years, many studies have used remote-sensing data to analyse variations in glacier area and length over more extensive regions including the Tien Shan, northwest China (e.g. Reference Haeberli, Bamber and PayneHaeberli, 2004; Reference Aizen, Kuzmichenok, Surazakov and AizenAizen and others, 2007; Reference BolchBolch, 2007; Reference Paul and HaeberliPaul and others, 2007; Reference Kutuzov and ShahgedanovaKutuzov and Shahgedanova, 2009; Reference Racoviteanu, Paul, Raup and ArmstrongRacoviteanu and others, 2009; Reference Narama, Duishonakunov and AbdrakhmatovNarama and others, 2010; Reference BolchBolch and others, 2012; Reference YaoYao and others, 2012; Reference Wang, Li, Wang, Li, Zhou and JinWang and others, 2013). Remote-sensing techniques provide a unique opportunity to determine ELA over a large area.
Snowfall supplies glaciers with mass, so snow-covered areas should indicate where accumulation has occurred. Early studies hypothesized that the snowline from optical images in the late ablation season could be used as an indicator of the ELA (Reference LaChapelleLaChapelle, 1962; Reference LliboutryLliboutry, 1965). This theory has been applied to the Himalaya, western North America, the Patagonia icefields, the European Alps and to tropical glaciers to estimate glacier ELA, or even mass balance (e.g. Reference KulkarniKulkarni, 1992; Reference ChinnChinn, 1995; Reference Lamont, Chinn and FitzharrisLamont and others, 1999; Reference Clare, Fitzharris and SalingerClare and others, 2002; Reference Rabatel and VincentRabatel and others, 2005, Reference Rabatel, Thibert and Vincent2008, Reference Rabatel2012; Reference Barcaza, Aniya, Matsumoto and AokiBarcaza and others, 2009; Reference Shea, Menounos, Moore and TennantShea and others, 2013). In these areas, aerial photographs, Thematic Mapper (TM)/Enhanced TM (ETM) or Moderate Resolution Imaging Spectroradiometer (MODIS) satellite and other optical remote-sensing images have been used to determine the snowline at the end of the ablation season. In the Tien Shan, however, both accumulation and ablation occur mainly in the warm season, making it difficult to obtain the representative (i.e. highest) snowline due to a scarcity of remote-sensing images with high temporal and spatial resolution. The Environment Satellite 1 (also known as the HJ-1 satellite) launched in 2008 revisits a given point on the Earth’s surface every 48 hours (Reference BaiBai, 2009), and acquires multispectral images with a spatial resolution of 30 m, making it possible to image the highest snowline. In this paper, we use HJ-1 satellite images with a high temporal resolution to derive snowline altitude (SLA). We then compare the highest image-derived SLA with the annual ELA from in situ measurements during the 2009 (most positive mass-balance year since 1990) and 2010 (most negative mass-balance year since 1990) ablation seasons at Ürümqi glacier No. 1, and assess the limitations on the use of SLA as an indicator of ELA. Unlike previous studies (Reference Lamont, Chinn and FitzharrisLamont and others, 1999; Reference Rabatel and VincentRabatel and others, 2005, Reference Rabatel, Thibert and Vincent2008, Reference Rabatel2012; Reference Shea, Menounos, Moore and TennantShea and others, 2013), which focused on the statistical correlations between SLA and ELA over long periods, the present study focuses on the differences between SLA and ELA for a specific set of representative years at Ürümqi glacier No. 1, thereby aiming to understand the differences between SLA and ELA in the Tien Shan.
2. Study Area
Ürümqi glacier No. 1, lying on the north slope of Tianger mountain (43°06’ N, 86°49’ E), Tien Shan, consists of two cirque valley glaciers, an east branch and a west branch (Fig. 1). In 2006, the east glacier covered an area of 1.086 km2, with a maximum elevation of 4267 m and terminus at an altitude of 3743 m, while the west glacier covered 0.591 km2, with a maximum elevation of 4484 m and terminus at 3845 m (WGMS, 2012). Both accumulation and melt of the glacier occur mainly in the warm season, when the glacier develops superimposed ice typical of a continental glacier. Ürümqi glacier No. 1 is representative of continental glaciers in central Asia and is one of the ten reference glaciers selected for the World Glacier Monitoring Service (WGMS) monitoring network (WGMS, 2012). Observations of Ürümqi glacier No. 1 date from 1959 (Reference Li, Han, Jing, Yang and JiaoLi and others, 2003) and constitute the longest glacier mass-balance record in China. Much glaciological research has been conducted here, including mass balance, variation in ELA, variation in glacier length/area/volume, and the response of the glacier to climate change (e.g. Reference LiLi, 2011; Reference Wang, Li and HiWang and others, 2011, Reference Wang, Li, Li, Wang and Yao2014). In this paper, the ELA from in situ measurements is compared with the SLA derived from remote-sensing images.
Location of Ürümqi glacier No. 1 in central Tien Shan, northwest China. The bold black lines indicate the outlines of the two glaciers.

3. Materials And Methods
In 2009, 41 stakes were drilled into the glacier from the terminus to the head over the east and west branches, covering different altitude zones, and with gaps in elevation generally no more than 50 m. Two snow pits were also dug in the west branch accumulation zone (Fig. 1). The distribution of stakes was similar in 2010. The annual ELA calculation includes the following steps. First, variations in water equivalent accumulation (or ablation) were obtained by measuring the densities of ice and snow at stake points and snow pits, and by measuring the stake height changes from the end of one hydrological year (~31 August in our study area) to the end of the next hydrological year for calculations of point mass balance. Second, using the area– altitude distribution, the point values were extrapolated over the glacier (Reference Østrem and BrugmanØstrem and Brugman, 1991). Third, the ELA was calculated by determining the average contour of the zero equilibrium line (Reference PatersonPaterson, 1994; Reference Fountain, Lewis and DoranFountain and others, 1999; Reference Benn and LehmkuhlBenn and Lehmkuhl, 2000). Thus, the precision of ELA estimates depends on mass-balance measurement. Comparisons between the glaciological and geodetic mass balance at Ürümqi glacier No. 1 over 1981–2009 (Fig. 1) indicated that the glaciological method mass-balance data are of high quality (Reference Wang, Li, Li, Wang and YaoWang and others, 2014), so there is no need to calibrate the ELA data in this study.
The nearest weather station to Ürümqi glacier No. 1 is Daxigou station (3539 m a.s.l.), which is situated ~2.0 km from the end of the glacier. The daily temperature and precipitation at Daxigou station from July to September in 2009 and 2010 are used in the present study, as supplied by the Xinjiang Meteorological Information Center.
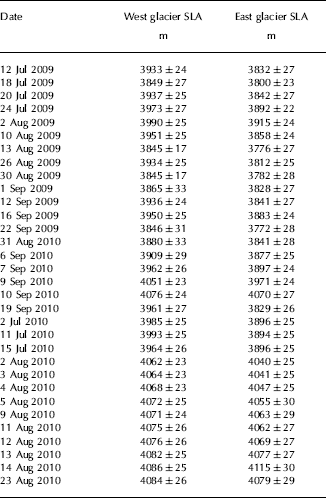
The remote-sensing images are acquired by CCD cameras on the HJ-1 satellite. The HJ-1 satellite, consisting of small twin satellites (HJ-1A and HJ-1B), has two multi-spectral visible light cameras with wide coverage (CCD camera), and the width of a joint image is 710 km when the two CCD cameras operate in parallel view mode. The twin satellites revisit a given point on the Earth’s surface every 48 hours, and create multispectral images with a spatial resolution of 30 m. The spectral range is 0.43–0.9 µm and is divided into four bands: 0.43–0.52, 0.52–0.60, 0.63–0.69 and 0.76–0.90 µm (Reference BaiBai, 2009). In the present study, we use a set of HJ-1 images for the period July to September in 2009 and 2010, as obtained from the China Centre for Resources Satellite Data and Application (http://www.cresda.com). The July–September period spans the entire late ablation season. From July to September 2009, there are image records for 61 days out of a total of 92, but most of the images were not used because they are affected by cloud shadows or because the surface is completely snow-covered, and only 13 usable images are retained (Table 1). In 2010, 19 suitable images out of a total of 66 are used (Table 1).
SLAs derived from HJ-1 satellite images, and their uncertainty
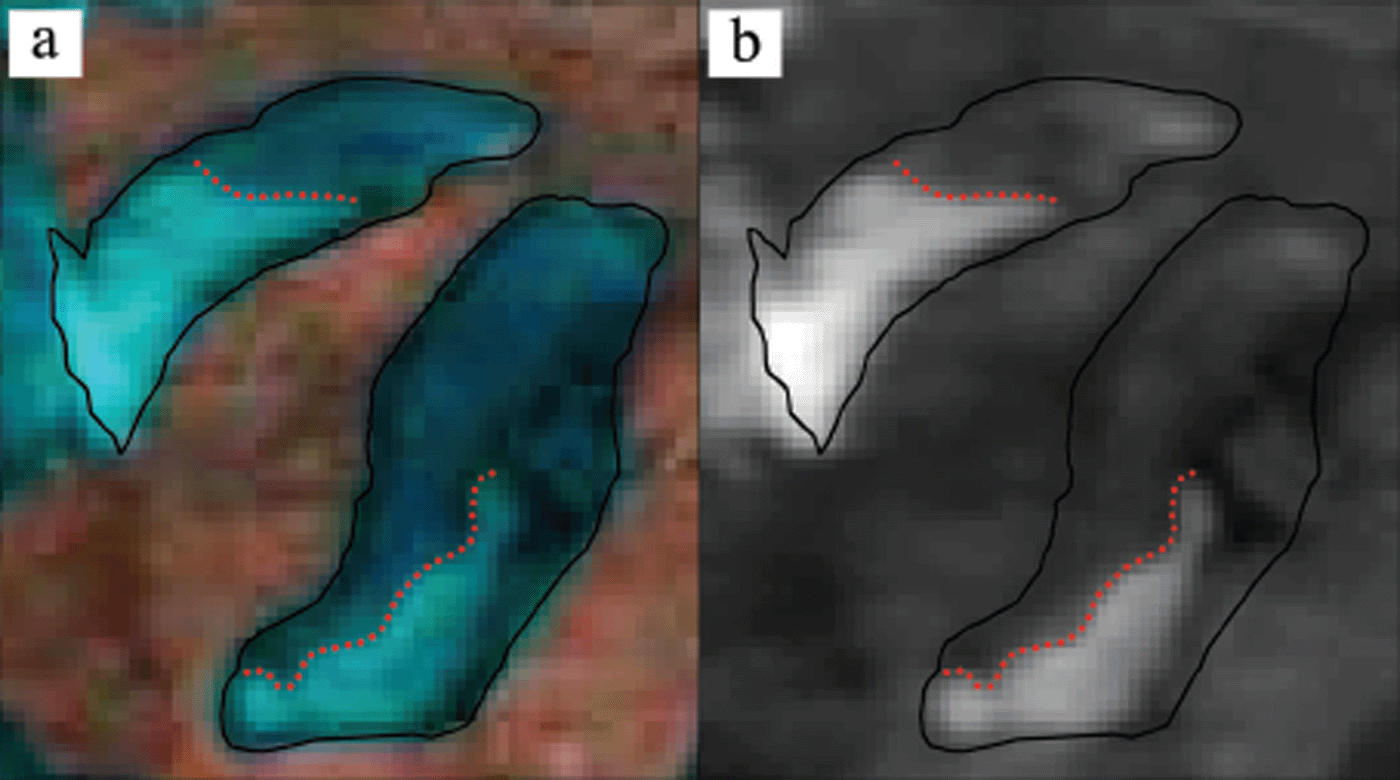
Landsat TM and ETM+ data have been widely used for snowline identification because of the obvious reflectance differences between ice and firn or snow (Reference Williams, Hall and BensonWilliams and others, 1991; Reference Klein and IsacksKlein and Isacks, 1999; Reference Bindschadler, Dowdeswell, Hall and WintherBindschadler and others, 2001; Reference PeltoPelto, 2011; Reference Rabatel and EckertRabatel and others, 2013). Using visual interpretation, the manual snowlines from TM/ETM+ images are therefore used to validate the manual snowlines derived from HJ-1 images. The results show high consistency between the snowlines extracted from the fourth spectral band of the HJ satellite and from TM/ETM+ images (combination of spectral bands 5, 4, 3). Figure 2 provides an example to show that using HJ-1 data to extract SLA is the same as using Landsat data on 4 August 2010. Therefore, the fourth spectral band HJ satellite images are used to determine variations of the snowline on Ürümqi glacier No. 1. In the present study, the SLA is calculated by superimposing the HJ-1 image-derived snowlines on elevation data (described below), using ArcMap software (http://www.esri.com/software/arcgis/arcgis-for-desktop). Since ELA is the average altitude of the equilibrium line, the SLA is also the average value of the corresponding snowline elevation. We have considered that the scarcity of stakes on the steep areas of the glacier may influence the value of the ELA. Thus, we did not take the snowline of the steep areas of the glacier into account for this study. ELA is based on stake mass balance along the glacier; both ends of the manual snowline are also controlled by the stakes’ positions on two sides of the glacier.
Comparisons between snowlines (red dotted lines) at Ürümqi glacier No. 1 identified from (a) a TM image using reflectance integrated over bands 3–5, and (b) the HJ-1 satellite fourth band reflectance image on 4 August 2010.
The elevation dataset is the Global Digital Elevation Model (GDEM, version 2), obtained from the Advanced Spaceborne Thermal Emission and Reflection Radiometer (ASTER). It has 17 m vertical accuracy (P < 0.05) (Reference TachikawaTachikawa and others, 2011), and a horizontal resolution of 26.5 m in the study area. Previous studies have suggested that the average thinning of Ürümqi glacier No. 1 was ~3.1 m during the period 2001–06 (Reference Wang, Li and HiWang and others, 2011). Because the GDEM is obtained after December 1999, there was no need to undertake altitudinal correction of the SLA since the GDEM accuracy is an order of magnitude larger than the change in surface height.
The uncertainty was estimated for each SLA, and there are two main sources of error. First, a vertical error is caused by the horizontal error in the location of the snowline. Due to the obvious reflectance differences between ice and firn or snow (Reference Bai and OhataBai and Ohata, 1989), the errors in location of the manual snowline will not exceed one pixel in remote-sensing images; therefore, we defined one pixel size (i.e. 30 m) as the horizontal error of the snowline. The vertical error associated with the horizontal error can be obtained by multiplying the pixel size by the slope of the glacier in the vicinity of the SLA. The second source of error is the vertical accuracy of the GDEM, which was 17 m (P < 0.05). The uncertainty in SLA will not exceed the sum of these two independent errors, and the calculated errors range from ±17 to ±33 m (Table 1).
4. Results
The SLAs were extracted from the available HJ satellite images (Table 1). It is well known that snowfall will lower, while an increase in temperature will raise, the SLA of a glacier. Transient SLAs derived from individual images will therefore rise or fall depending on temperature and precipitation (Fig. 3).
Comparisons between the SLA of Ürümqi glacier No. 1, extracted from the HJ-1 satellite images, and the daily temperature (green line) and precipitation (blue bars) records at Daxigou station, for the periods (a) 1 July to 30 September 2009 and (b) 1 July to 30 September 2010 (horizontal axis date format is month/day). The SLA from the west branch is shown in red bars, while that from the east branch is shown in black bars. The colourful belts in the middle denote the influences of external factors on the HJ-1 satellite images: white blocks indicate clear-sky conditions; grey blocks indicate that the images are affected by clouds (including thick clouds, thin clouds, or fog); orange blocks indicate that the glacier is fully covered by snow; and black blocks indicate no image records (except for 14 July 2009, when the image is so deformed that registration cannot be done properly).
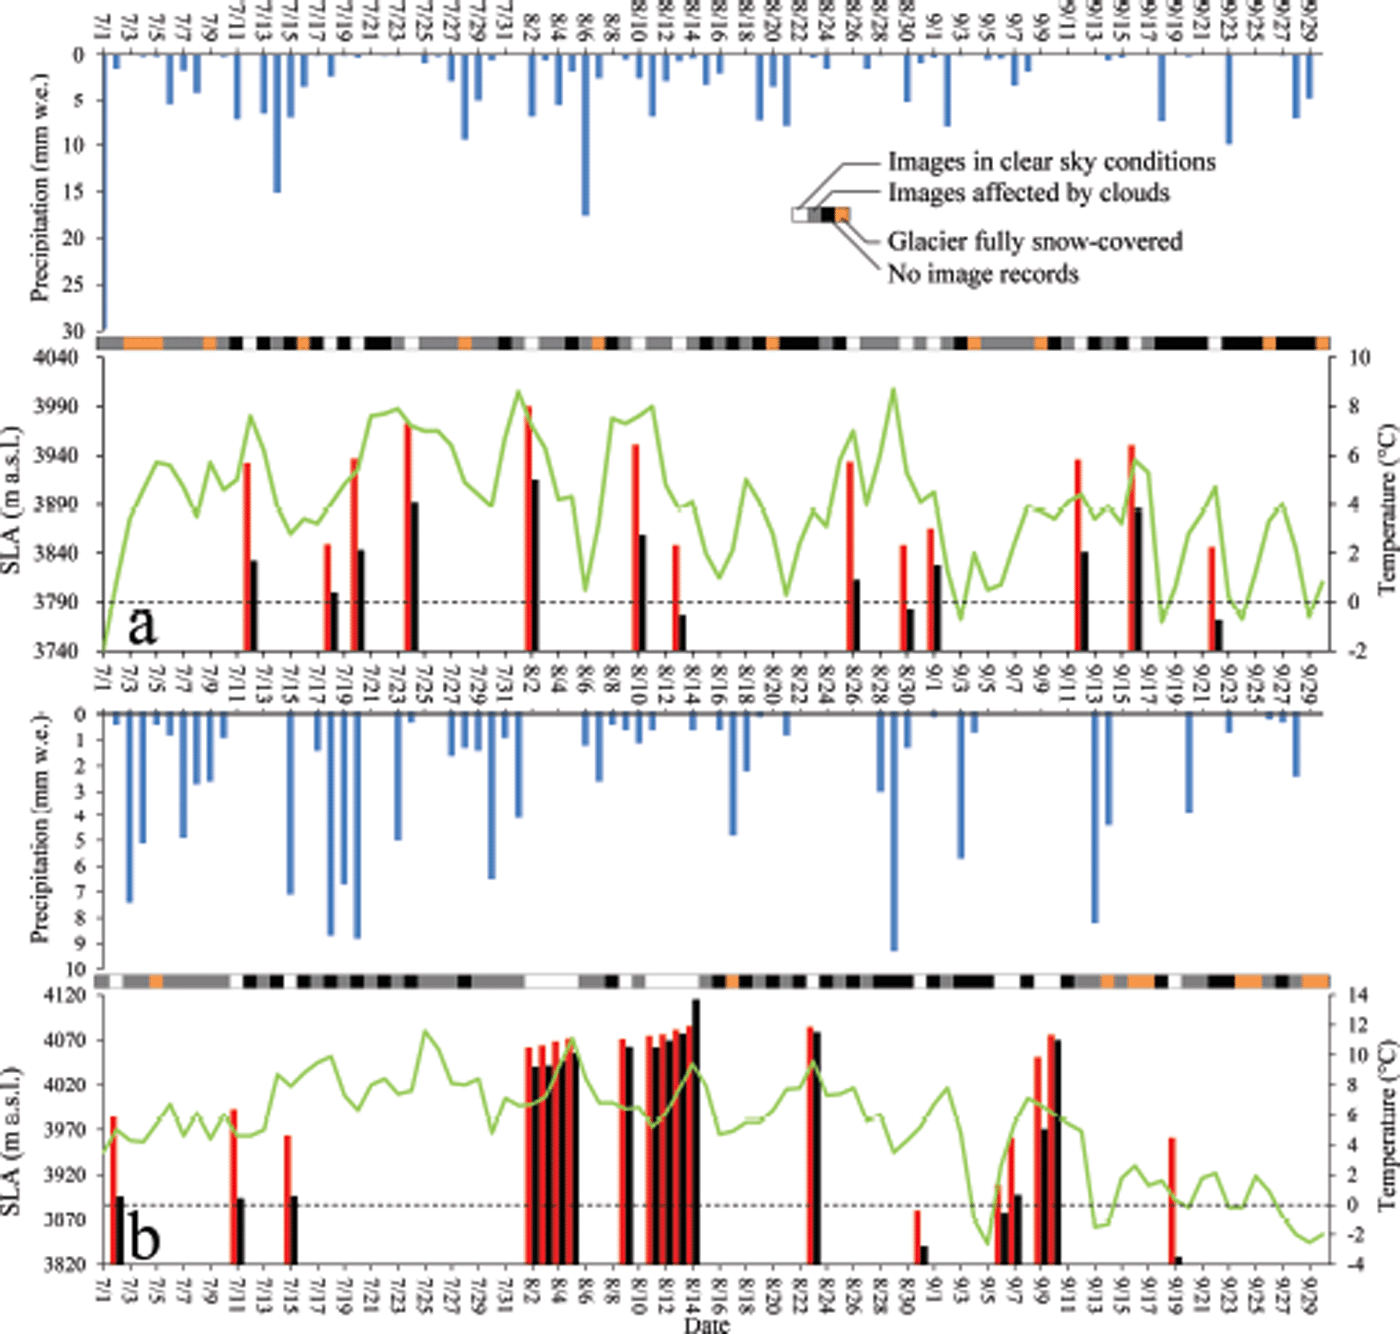
Figure 3 shows that for periods between precipitation events, the relationship between temperature and SLA is clear, i.e. increased temperature results in an increased SLA. Therefore, precipitation has minimal impact on the extracted maximum SLA for a given temperature, and we can examine the relationship between temperature and SLA independent of precipitation events. For a given temperature a, the corresponding SLAs may differ because they are affected by specific snowfall and weather conditions. We extracted the maximum value of all the SLAs whose corresponding temperature is ±a and defined it as SLA a (the relative highest SLA for temperature a). This is easy to extend when a temperature b is greater (less) than a: SLA b (the relative highest SLA for temperature b) will be no less (no greater) than SLA a . We filtered all the image-derived SLAs according to this rule, and then obtained ‘the relative highest SLA’ as a function of temperature in 2009–10 (Fig. 4). We omitted the SLA on 19 September 2010, because the temperature that day was too low (0.3°C) to influence the SLA given that the meteorological station is ~200 m below the glacier terminus.
Ürümqi glacier No. 1 SLA extracted from HJ-1 satellite images as a function of temperature in (a) 2009 and (b) 2010 over the east (circles) and west (squares) glaciers, and their corresponding quadratic regression lines. The relative highest SLAs are shown as solid red (east) and blue (west) symbols.
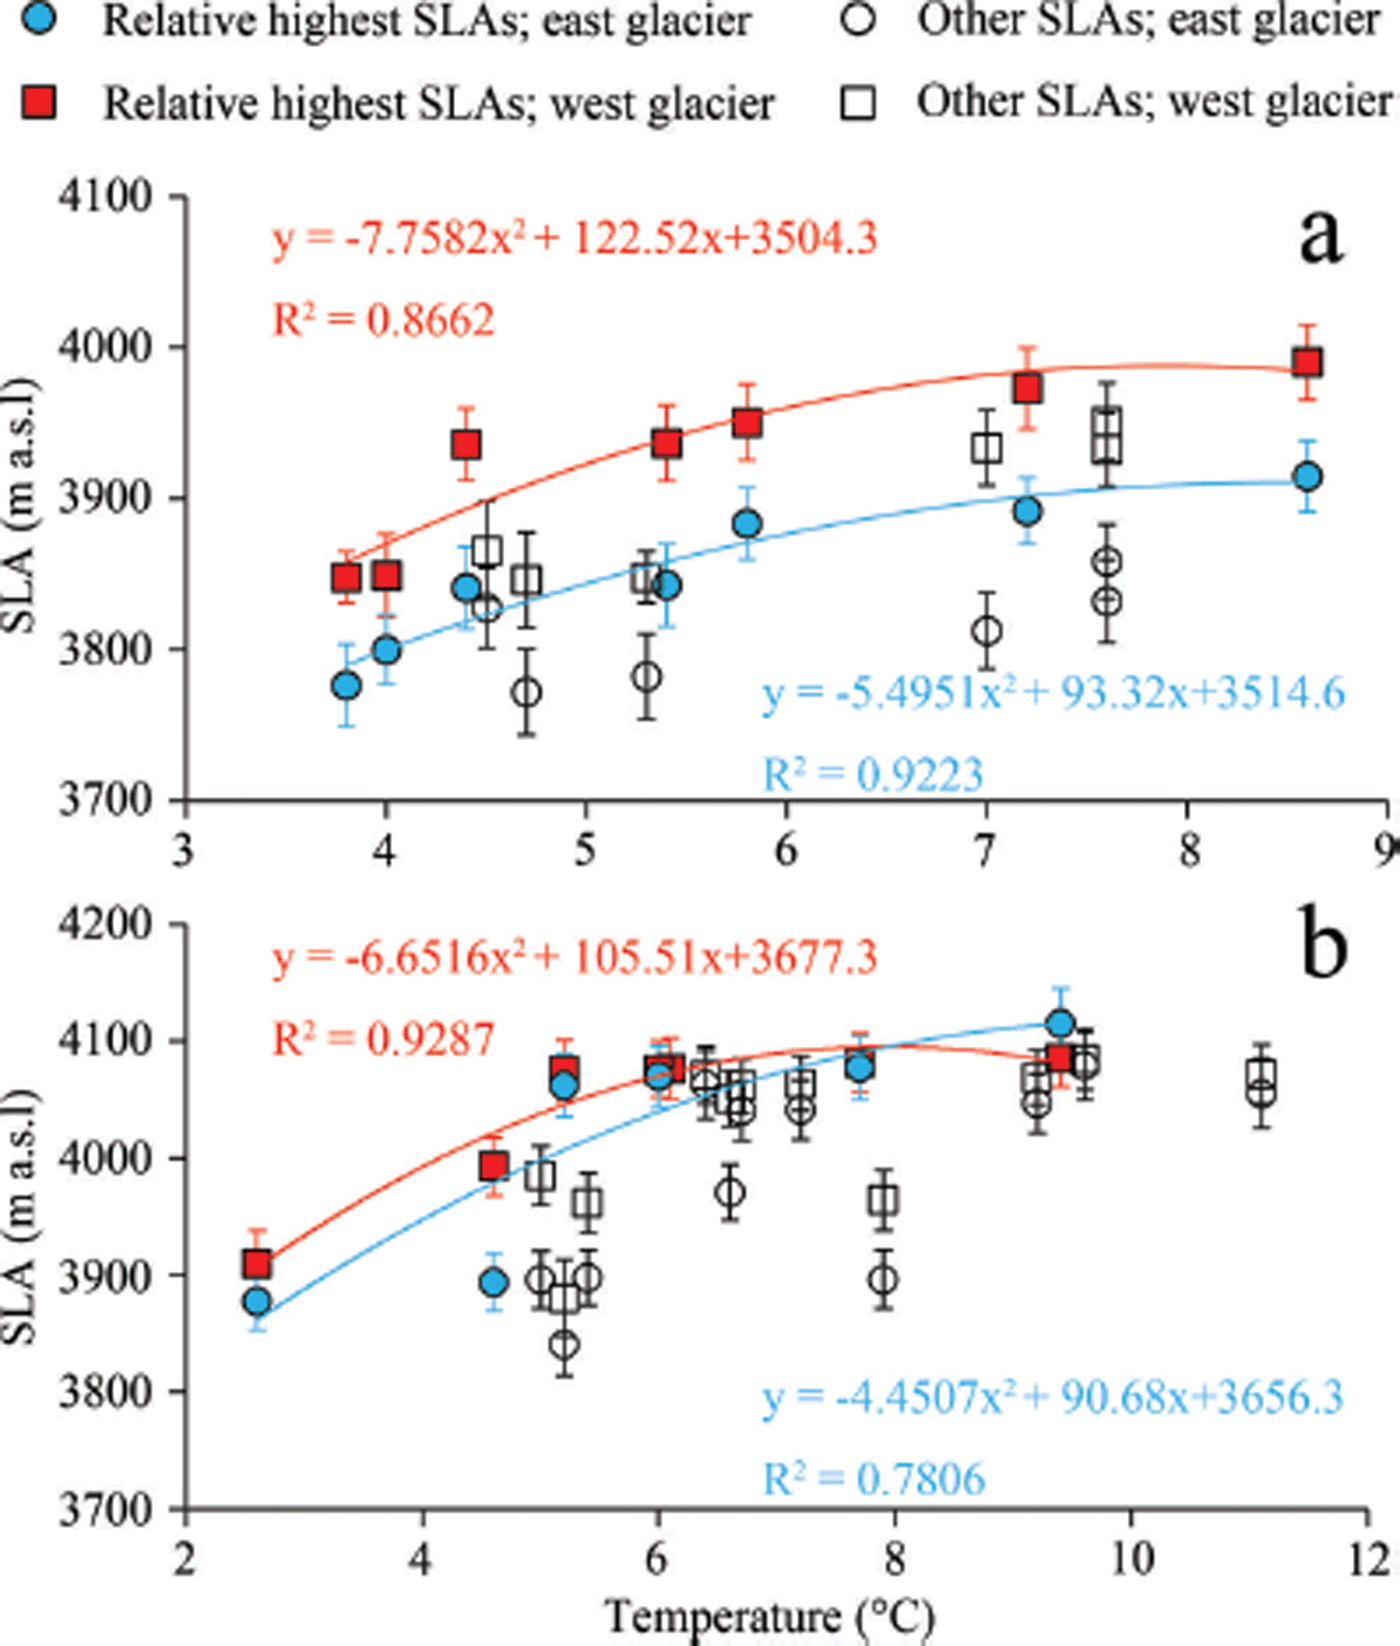
Comparisons between the daily mean temperature and the relative highest SLA (Fig. 4) indicate that the rate of increase of the SLA declines to near zero when it exceeds certain threshold values (8.6°C and 9.4°C for 2009 and 2010 respectively, both of which are the daily mean temperature of highest remote-image-derived SLA). Therefore, the highest image-derived SLA can be considered as the highest SLA of the corresponding years. We infer that temperature rises will initially increase the SLA, but then might have relatively less impact on the SLA. We now examine the temperature time series to identify the highest SLA for both years and glaciers, based on Figure 3. On 1 August 2009, the daily mean temperature was the second highest during the 2009 study period (8.6°C), which contributed to the highest HJ-image-derived SLA, 3915 ± 24 m and 3990 ± 25 m for the east and west glaciers, respectively (the SLA of 2 August is taken to be the same as that of 1 August, since the satellite passed over the glacier before the precipitation event that occurred on 2 August). The warmest day was 29 August (8.7°C), but because of cloud shadowing we cannot directly obtain the SLA. We deduce from the temporal variation of the relative highest SLAs that the image-derived SLA on 1 August 2009 may represent the highest SLA in 2009. In 2010, the SLA on 14 August (9.4°C) had the highest HJ-image-derived SLA, with 4115 ± 30 m and 4086 ± 25 m elevations on the east and west glaciers, respectively. Only 5 out of 92 days (from July to September) had temperature higher than that of 14 August in 2010: 17 and 18 July (9.5°C and 9.9°C, respectively; and there was a heavy snowfall on 15 July); 25 and 26 July (11.6°C and 10.4°C, respectively; and there was a heavy snowfall on 23 July); and 5 August (11.1°C, and the SLA was smaller than that of 14 August). A heavy snowfall will dramatically lower the SLA on those days with higher temperature. Consequently, there is very low probability that the corresponding SLAs were higher than the SLA on 14 August, and we infer that the SLA on 14 August represents the highest SLA in 2010.
In 2009, the differences between the deduced highest SLA (3915 ± 24 m and 3990 ± 25 m for the east and west glaciers, respectively) and the measured ELA (3975 and 4010 m for the east and west glaciers, respectively) are 60 ± 24 m and 20 ± 25 m, respectively. The west glacier SLA can be used to indicate the ELA; however, the difference for the east glacier is large for such a small glacier (the range in altitude is 524 m).
The ELA in 2010 was higher than the mountain peak. The ELA of the east glacier was no less than 4267 m, and that of the west glacier was no less than 4484 m, so the deduced snowline elevations on the east and west glaciers were at least 152 ± 30 m and 398 ± 25 m lower respectively than their corresponding ELAs. If the ELA of one year exceeds the glacier peak, then there will be no accumulation area on the glacier that year, and the snowline is actually the lower boundary of the accumulated firn of previous years. In this case, there is no theoretical relationship between SLA and ELA.
It was believed that the superimposed ice of the cold glacier would cause the SLA in the late ablation season to exceed the ELA (Reference Lliboutry, Williams and FerrignoLliboutry, 1998), but the estimated SLA is lower than the ELA in both 2009 and 2010. Consequently, the superimposed ice may have less impact on SLA as an indicator of ELA than the other limitations on Ürümqi glacier No. 1.
5. Discussions And Conclusions
In 2009, the highest SLA and the measured ELA were very close on the west glacier, as shown schematically by Figure 5a. However, large differences existed between SLA and ELA on the east glacier, which suggests that the applicability of the image-derived SLA for identifying ELA varies even for two adjacent glaciers in the Tien Shan. The topography of individual glaciers and their surroundings may be one of the reasons for this discrepancy (Reference Hock and HolmgrenHock and Holmgren, 1996, Reference Hock and Holmgren2005; Reference Hulth, Denby and HockHulth and others, 2013). Although we cannot determine the specific reasons for this difference, given the limits of the current data and the complexity of glacier ablation, this discrepancy is still real.
The 2010 image-derived highest snowline of Ürümqi glacier No. 1 indicates that optical remote-sensing images only distinguish snow (or firn) from ice (Reference Williams, Hall and BensonWilliams and others, 1991; Reference Parrot, Lyberis, Lefauconnier and ManbyParrot and others, 1993; Reference Pope and ReesPope and Rees, 2014a,Reference Pope and Reesb), but cannot distinguish snowfall in the present year from that accumulated previously. This limitation will confuse the firn line from previous years with the snowline from the present year, while the equilibrium line should refer to the snowline from the present year’s accumulated snow.
Schematic diagram showing a lengthwise cross section of a mountain glacier (after Reference Brown, Kirkbride and VaughanBrown and others, 1999; De Ruyter de Wildt and others, 2002). The glacier surface in the late ablation season in the present mass-balance year (the last mass-balance year) is shown by blue solid (dotted) lines. The division between firn (blue hatching) and ice is shown by the blue dashed line. (a) When snow covers all the firn, ELA equals SLA. (b) When the mass balance is much more negative than in previous years, firn is exposed and ELA is larger than SLA.
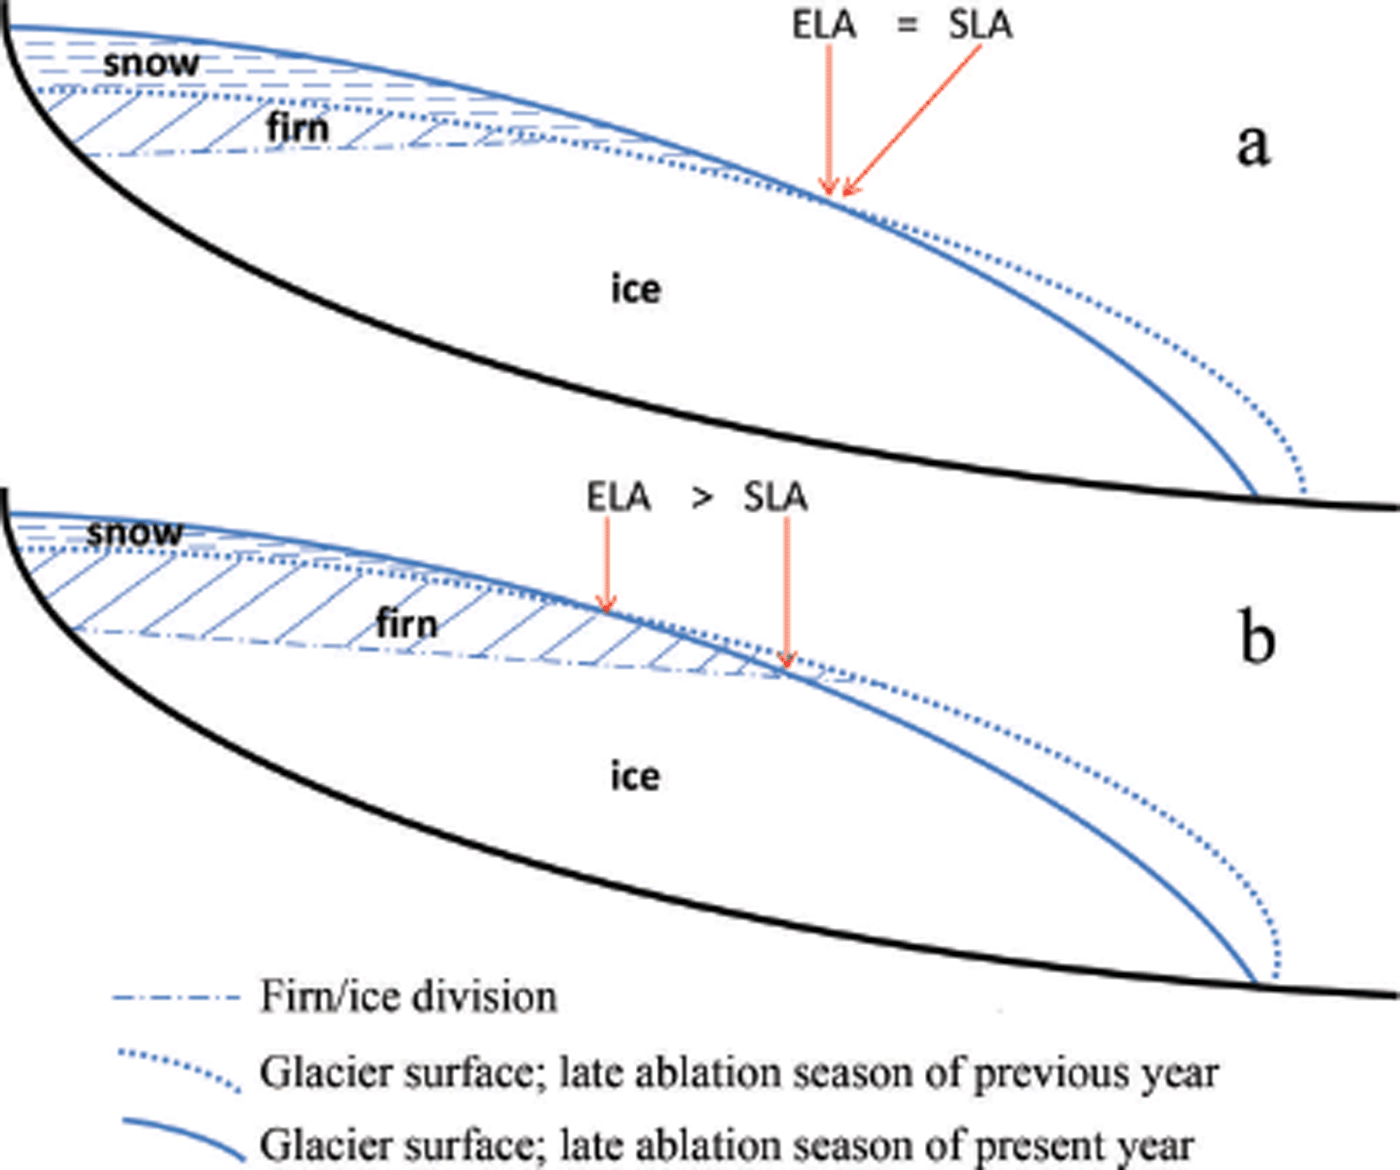
We present three scenarios, without considering glacier movement and superimposed ice, for Ürümqi glacier No. 1 (Fig. 5). The first scenario (Fig. 5a) often occurs in positive mass-balance years, when the present year’s snow (or firn) layer can completely cover the firn portion from the previous year. In this situation, the equilibrium line and snowline extracted from remotely sensed images are the same line, and SLA equals ELA. The second scenario may occur in positive or negative mass-balance years (Fig. 5b), when ablation can reach the firn layer accumulated the previous year, so the image-deduced snowline is actually the lower boundary of the firn layer from the previous year. When the glaciers conform to either of these scenarios (i.e. when the difference between SLA and ELA is small), the correlations between SLA and ELA may succeed in passing the statistical significance test at a long timescale, or the absolute values of SLA and ELA will be approximate (e.g. the SLA and ELA of the west branch of Ürümqi glacier No. 1 in 2009). In these cases, the SLA can be an indicator of the ELA. The third scenario could be seen as a severe case of the second scenario: ELA exceeds the summit of the glacier, primarily occurring in the years with extremely negative mass balance. The glacier surface is identical to the ablation zone, which indicates that the image-derived snowline is the lower boundary of firn accumulated in previous years. In this scenario, there is no theoretical relationship between SLA and ELA. This situation has also been proposed previously (Reference Brown, Kirkbride and VaughanBrown and others, 1999; Reference De Ruyter de Wildt and OerlemansDe Ruyter de Wildt and others, 2002), and is apparent for Ürümqi glacier No. 1 in 2010, as there was no snow from this year on the glacier surface and the firn from previous years was exposed everywhere.
Establishing a dataset of temporal and spatial ELAs from remote-sensing images is an attractive idea, and an understanding of the limitations of using SLA to indicate ELA is necessary. Reference Engeset and WeydahlEngeset and Weydahl (1998) and Reference Engeset, Kohler and MelvoldEngeset and others (2002) proposed that the ELA could be derived by synthetic aperture radar (SAR) imagery; however, there has been considerable debate about this approach (Reference Hall, Williams, Barton, Smith and GarvinHall and others, 2000; Reference Jaenicke, Mayer, Scharrer and GudmundssonJaenicke and others, 2006; Reference CaseyCasey and Kelly, 2010; Reference Huang, Li, Tian, Chen and ZhouHuang and others, 2013). In microwave remotely sensed imagery, the present year’s accumulated snow lies on top of the old stratigraphy, so the equilibrium line may be obscured by old firn, since snow and firn look similar on SAR images (Reference Hall, Williams, Barton, Smith and GarvinHall and others, 2000; Reference König, Winther and IsakssonKönig and others, 2001). Our results reveal the same problem for optical remote-sensing images. Whether optical remote-sensing images can distinguish snow from firn is still a critical issue. In recent years, the ablation of glaciers has been accelerating in many parts of the world (Reference CogleyCogley, 2009; Reference Jacob, Wahr, Pfeffer and SwensonJacob and others, 2012; Reference GardnerGardner and others, 2013). High-ablation years, exemplified by Ürümqi glacier No. 1 in 2010, will likely impact other glaciers. The intensities of glacier ablation will also affect the applicability of using SLA to indicate ELA.
Acknowledgements
We thank the Tien Shan Glaciological Station for the source data, WGMS for shared ELA data, the contributors of remote-sensing images for their efforts in constructing the image database used in this study and the Xinjiang Meteorological Information Center for meteorological data. We also thank two anonymous reviewers for critical comments on the manuscript. This work was supported by the National Basic Research Program of China (2010CB951404), the Young Talents funding of the Cold and Arid Regions Environmental and Engineering Research Institute, Chinese Academy of Sciences (Y35111001), the ‘Strategic Priority Research Program (B)’ of the Chinese Academy of Sciences (XDB03030204), and the National Natural Science Foundation of China (41190084).



