

Introduction
Interest in the processes by which human populations expanded from a presumed centre of origin in Africa to colonise the rest of the world has never been higher, thanks to new fossil, archaeological, palaeoclimatic and genetic data. Strong attention currently focuses on the Arabian Peninsula, and the proposal, stimulated by palaeogenetic interpretations, that Anatomically Modern Humans originating in East Africa dispersed rapidly across the southern end of the Red Sea and the Arabian Peninsula about 60 000 years ago, fuelled by new adaptations involving reliance on marine foods and seafaring, and culminating in the colonisation of New Guinea and Australia (Reference WalterWalter et al. 2000; Reference MacaulayMacaulay et al. 2005; Reference MellarsMellars 2006).
Despite the controversies surrounding them (e.g. Reference DennellDennell & Petraglia 2012; Reference ScallyScally & Durbin 2012), these hypotheses focus on a region that has previously been much neglected, notwithstanding an extensive and long-known record of Stone Age surface finds that includes material of Middle and Lower Stone Age aspect, and palaeoclimatic data that demonstrate a periodic 'greening' of the Arabian desert during the Pleistocene and early Holocene, reinforced by new dates for Stone Age sites in the time range 130 000 to 50 000 years ago (Reference PetragliaPetraglia & Rose 2009; Reference Armitage, Jasim, Marks and ParkerArmitage et al. 2011; Reference PetragliaPetraglia et al. 2011; Rose et al. 2011; Delagnes et al. 2012).
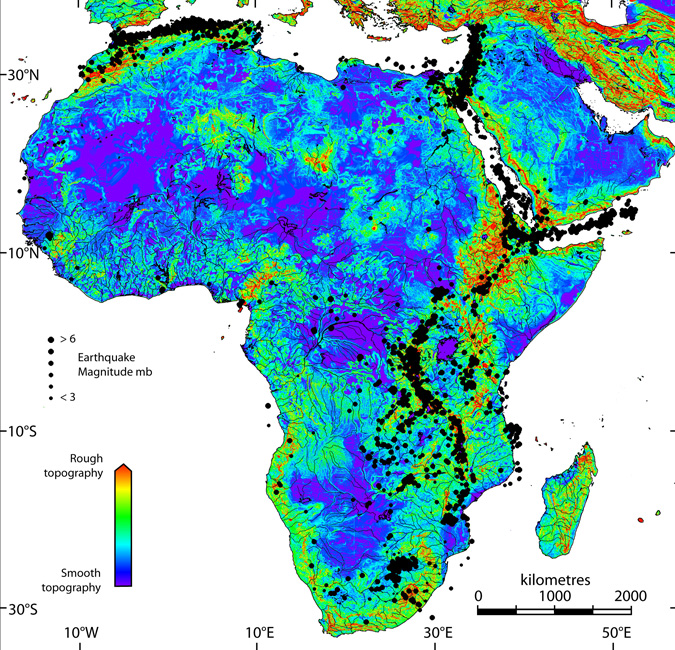
These debates also bring into focus the potentially far-reaching impact on human adaptive strategies and dispersal patterns of physical landscapes subject to geological instability associated with sea level change, crustal warping, rifting, plate motions, seismic activity and volcanism. These processes dominate the geological history of the regions of Africa and southern Eurasia where early finds are concentrated, but they have received little attention in comparison with other sources of evidence (Figure 1).
Map of Africa and adjacent regions, showing the distribution of complex topography and modern seismic activity. Topographic complexity, or roughness, is derived from SRTM 30 digital elevation data filtered using a ~18db/octave hi-pass filter to emphasise roughness at scales of 5km or less.

Project aims
The DISPERSE project places these processes of geological instability and dynamic landscape change centre-stage, not as occasional disruptions that hamper the archaeological task of reconstruction, but as 'agents without intent', which have forged strategies of human adaptation and social action at every scale, from the local to the continental, from the short-term event of a single earthquake or flood event to wholesale reconfiguration of the physical landscape.
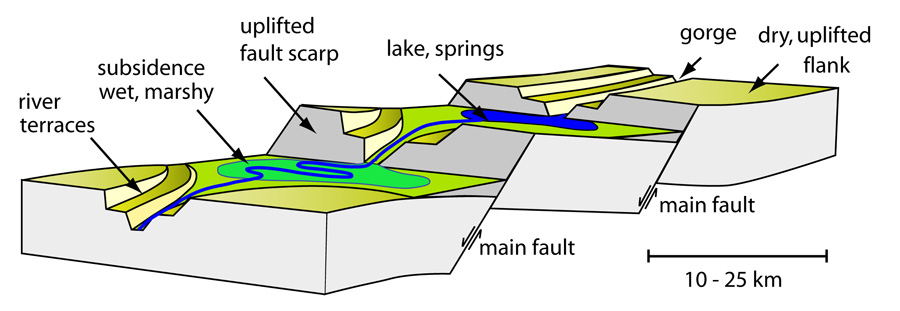
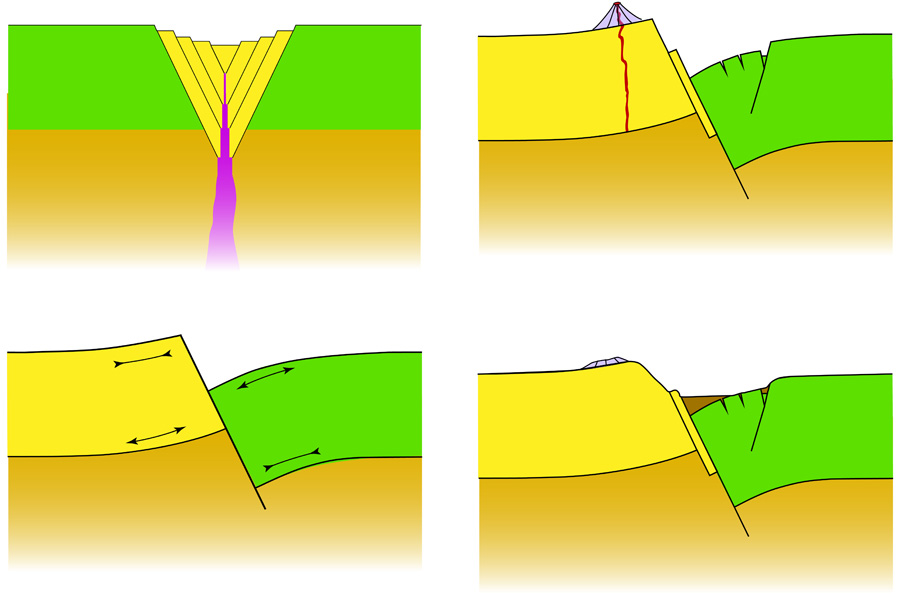
Moreover, despite the potentially destructive risks associated with these dynamic landscapes, we argue that in the longer term they can play a powerful role in creating and rejuvenating complex topography and ecological diversity, offering fertile sediment and water traps, tactical advantage in targeting animal prey or avoiding predators, and local and regional mediation of global climate changes (Figures 2 and 3); and that they provide a missing link in the complex of selection pressures that shaped the early human evolutionary trajectory (King & Bailey 2006; Bailey et al. 2011; Winder et al. 2013). In the case of the southern Red Sea, no discussion of Pleistocene coastal dispersal can be pursued very far without investigating the impact of sea-level change on the width of the southern channel, or the nature of the now-submerged landscapes exposed at lower sea level. And, of course, it is on the now-submerged palaeocoastlines that we should be looking for earlier traces of coastal archaeology, given that sea level has been substantially lower than at present for most of the Pleistocene.
Model of landscape deformation in an extensional region with normal faulting. Major fault zones create back-tilting with uplifted fault scarps forming rough ground or physical barriers and downcutting of rivers, alternating with down-dropped basins that trap sediments and surface water. Repeated earthquake activity continuously rejuvenates these features. Similar features are present in compressional zones with reverse faulting and long-term regional uplift.

Cross section of rift formation, showing asymmetric nature of rift flanks, back-tilting, valley formation and volcanic activity. Volcanic cones and lava flows add to topographic complexity and ecological diversity by contributing to soil fertility and creating additional localised barriers and areas of rough ground.

Testing these hypotheses places high demands on the ability to reconstruct local and regional landscape morphology; this is doubly difficult in regions that have undergone long-term and often substantial geological change, especially in coastal regions such as the Red Sea, where rifting, volcanism, local tectonics and sea level change are combined. New technologies of remote sensing on land and under water, and a new generation of satellite imagery are providing fresh tools alongside conventional surface mapping and dating of land forms and sedimentsfor modelling the underlying geophysical processes of landscape evolution.
Our objectives then are to:
-
1. Develop techniques for reconstructing the physical morphology of dynamic landscapes at various geographical and temporal scales, taking account of the geophysical processes that mould and modify the land surface, and to apply those techniques to selected regions on the main pathways of early human dispersal in Africa and the Near East.
-
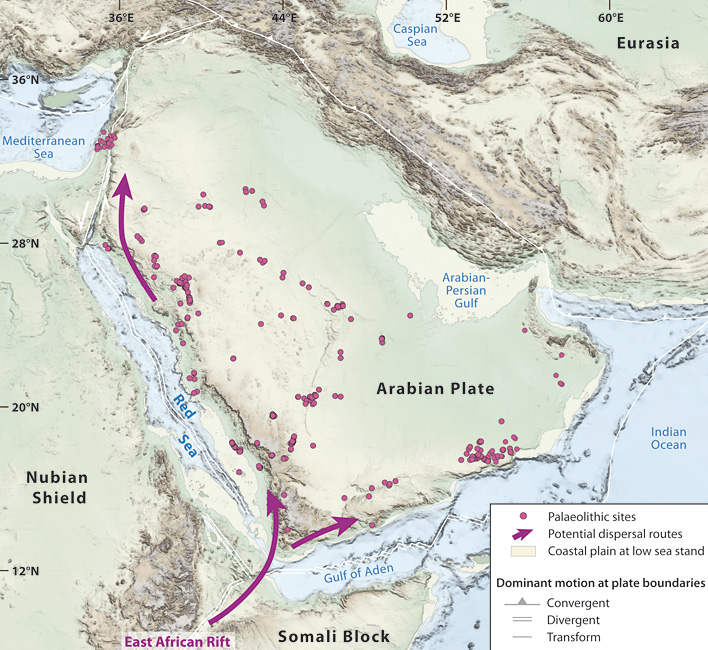
2. Investigate the Stone Age archaeology and landscapes of South-western Arabia and search for new archaeological material, treating the prehistoric landscape from the watershed of the western Arabian escarpment to the edge of the continental shelf as a seamless whole (Figure 4)
-
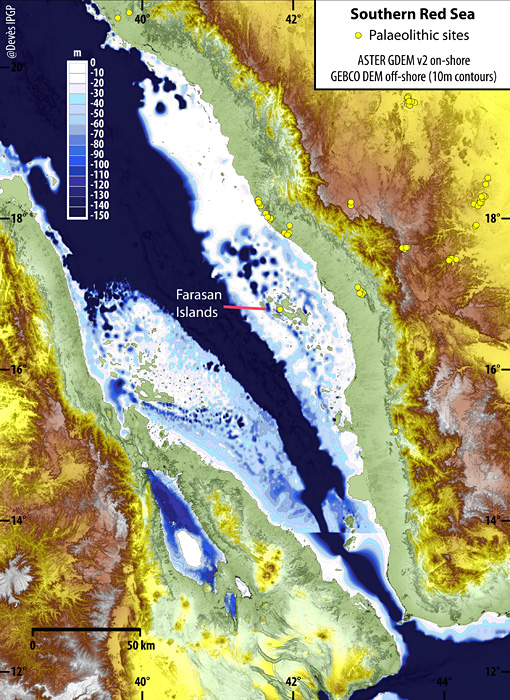
3. Extend techniques of landscape reconstruction to selected areas of the submerged continental shelf in the vicinity of the Farasan Islands in the southern Red Sea, and assess the local environmental and climatic conditions that may have existed there at lower sea level, as well as the prospects for discovery of prehistoric material. This is a key region in discussing the likely connections between Africa and Arabia, and the Farasan Islands are of particular interest because they would have been connected to the mainland at lower sea levels (Figure 5)
-
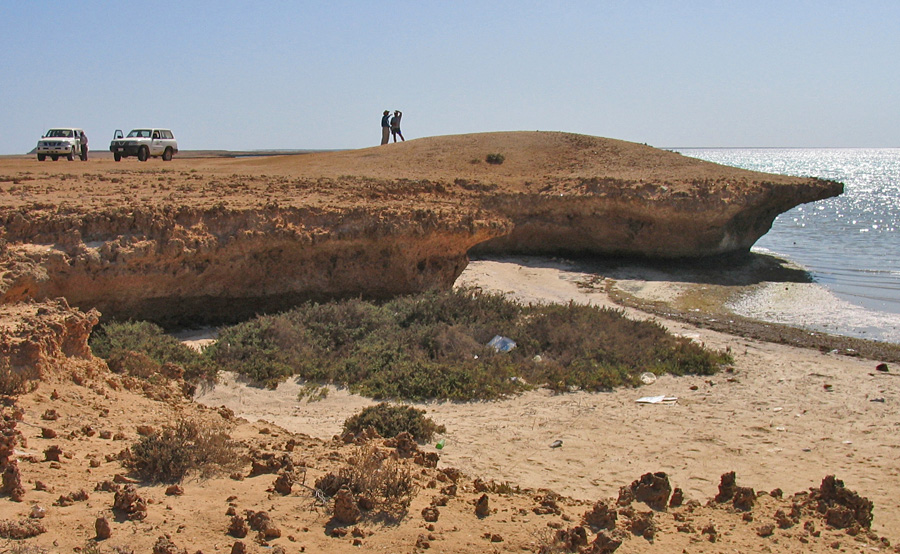
4. Undertake systematic investigation of the mid-Holocene coastal shell mounds on the Farasan Islands, now numbering over 2000, at the heart of our core region. This will act as a benchmark for what constitutes the archaeological signature of an economy based on intensive exploitation of marine resources and seafaring, guiding us on how to interpret earlier traces of coastal settlement and what to look for in underwater explorations (Figure 6)
Map of the Arabian Peninsula, showing schematic plate boundaries, the general distribution of Palaeolithic finds and potential dispersal routes. Topographic and bathymetric data are from the 'GEBCO_08 Grid' continuous terrain model, with a spatial resolution of 30 arc-seconds (http://www.gebco.net). The complexity of the terrain, a key variable influencing favourable environments for human settlement, has been emphasised by superimposing maps of slope and slope derivatives onto a colour-coded elevation model.

The southern Red Sea, showing Palaeolithic surface finds on the eastern coast of the Red Sea, details of topography and location of the Farasan Islands. ASTER DEM v2 elevation model has been used for onshore topography and the 'GEBCO_08 Grid' elevation model for offshore topography. ASTER DEM is a product of METI and NASA.

Shell mound in Janabah Bay, Farasan Islands, located on a fossil-coral platform that has been undercut by marine erosion to form the present-day shoreline. Similar undercut coral platforms can be found under water and mark the position of palaeoshorelines at lower sea level and potential targets for locating underwater archaeological sites (photograph by Hans Sjoeholm, 2006).

Preliminary results
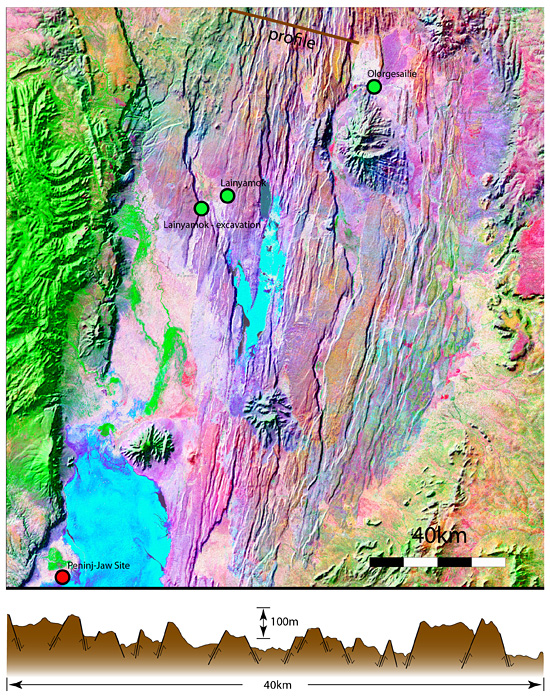
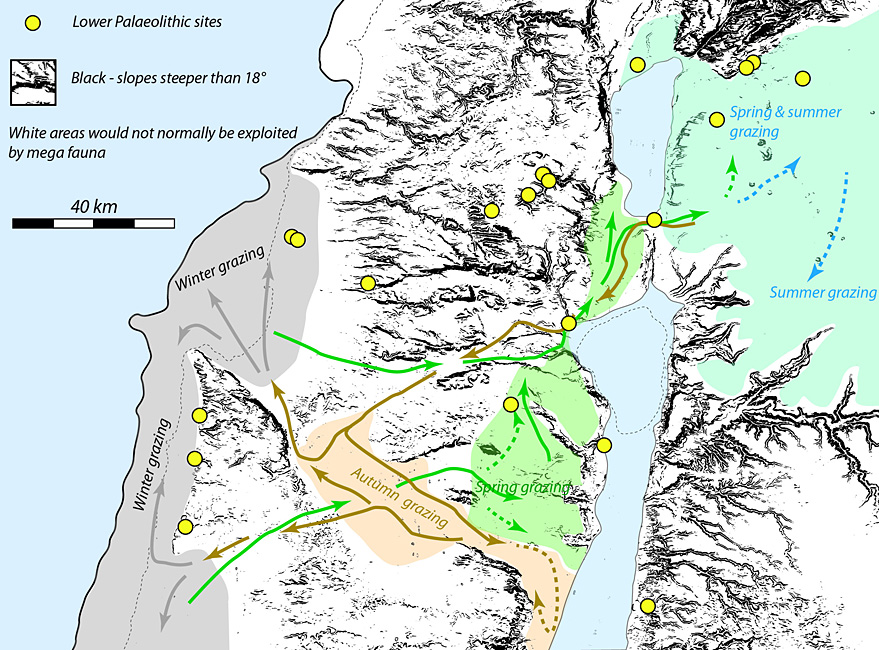
Preliminary field mapping and manipulation of satellite images in the Kenyan Rift emphasises the dramatic effects of long-term faulting, rifting and volcanism on the landscapes of the region (Figure 7). Similar techniques highlight the relationship between topographic barriers, geological features, animal habitats and movements, and archaeological sites in the southern Levant (Figure 8).
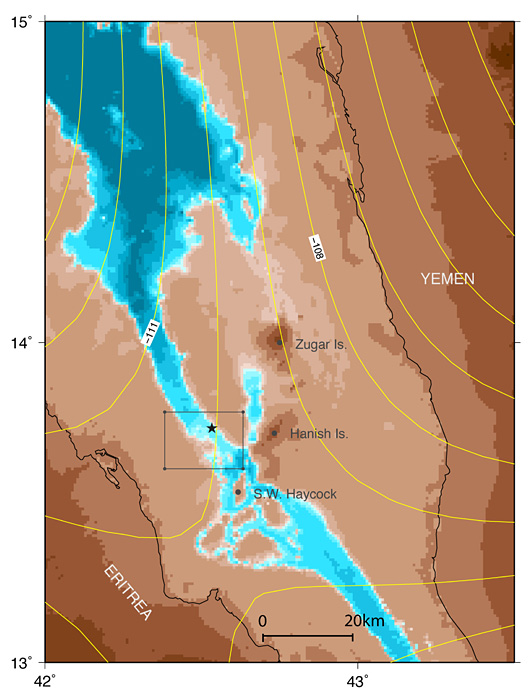
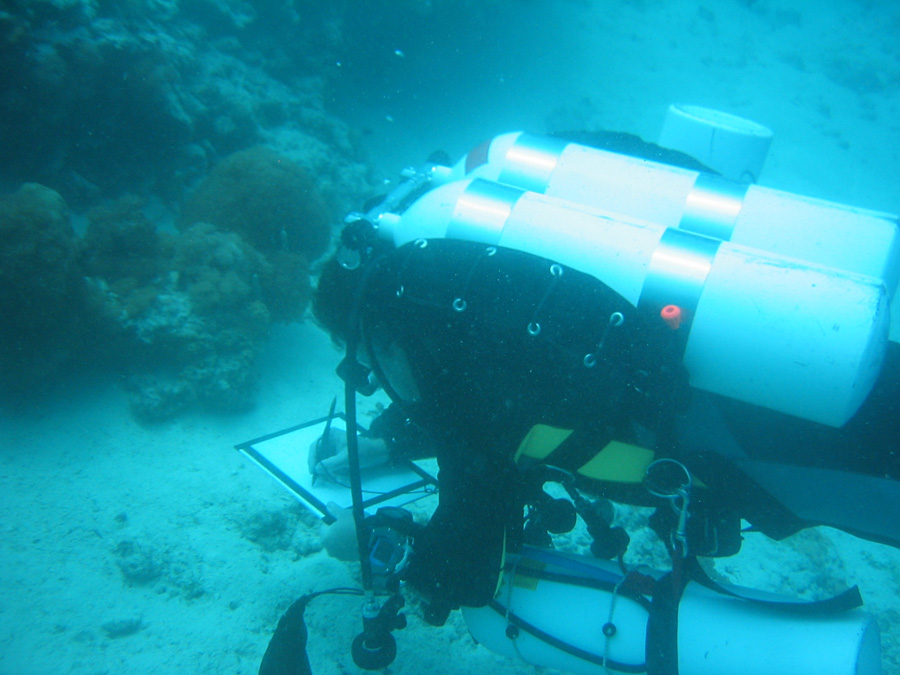
Close attention to the effects of sea level change demonstrates that at maximum lowering of sea level and for a large part of the sea-level cycle the southern end of the Red Sea could have been crossed over sea distances of no more than 4km without the need for sophisticated seafaring skills, a fact that also opens up the possibility of southern Red Sea crossings by earlier hominin species (Figure 9; Lambeck et al. 2011). Lowering of sea level would also have created an extensive coastal landscape with a complex topography and geological and environmental conditions attractive to human settlement. We have already identified submerged palaeoshorelines and other targets with potential for archaeological investigation using deep and shallow diving in the vicinity of the Farasan Islands (Figure 10; Bailey et al., 2007).
False colour image of the southern Kenyan rift, based on ETM + (Earth Thematic Mapper) satellite imagery, combined with SRTM3 digital elevation data. This combination highlights the complexity of topography resulting from parallel rift scarps and volcanic features. Green circles are sites associated with remains of Homo spp., red circles sites associated with Australopithecine remains (site-location information from the Paleobiology Database, http://paleodb.org/cgi-bin/bridge.pl).

Representation of topography in the Jordan rift and Israel during the Lower Palaeolithic period. The topography is derived from SRTM3 digital elevation data, with the addition of the -50m bathymetric contour, and slope angles >18° emphasised to highlight topographic constraints on movement and access in the wider landscape. The identification of preferred seasonal grazing areas for large mammals is based on an edaphic study combining data on geology and topography (Devès et al. in prep).

Reconstruction of palaeoshorelines at the southern end of the Red Sea in the vicinity of the Hanish sill at the maximum regression at 22,000 cal BP. The black line marks the present day coastline. Shoreline positions have been adjusted for isostatic and tectonic movements (courtesy of Kurt Lambeck).

Garry Momber recording features of a submerged palaeoshoreline off the Farasan Islands during a 60m Trimix dive in 2006 (photograph by Mike Pratt).

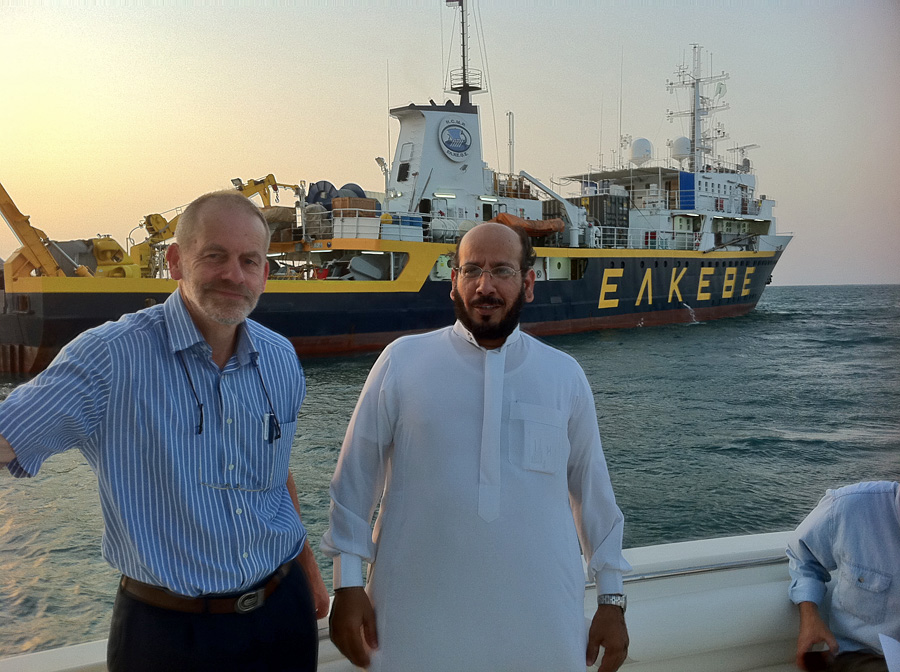
Geoff Bailey and Abdullah Alsharekh with the Hellenic Centre's R/V Aegaeo in the Red Sea, September 2011.

Future work will extend this underwater survey with the Hellenic Centre for Marine Research research vessel, R/V Aegaeo (Figure 11), currently under contract to work in the Red Sea, and with the necessary experience and equipment for underwater archaeological survey, including seismic and acoustic mapping of bathymetry and sub-surface topography, remotely operated vehicles and cameras (ROVs), coring equipment and a submersible. We expect new data on submerged landscapes and palaeoenvironments and new targets for closer investigation and possible discovery of underwater archaeological material.
It may seem paradoxical that unstable landscapes characterised by often-dramatic geological changes provide the key to understanding the human trajectory, and it is certain that the difficulties of landscape reconstruction have been a powerful deterrent to their investigation. However, new technologies are progressively removing these obstacles to investigation and demonstrating the central importance of landscape variability in understanding the long-term relationship between human evolution and climate change.
Acknowledgements
This research is funded by the European Research Council (ERC Project 269586 DISPERSE). We thank our sponsors in the field: in Saudi Arabia, HRH Prince Sultan bin Salman, and Professor Ali al Ghabban of the General Commission for Tourism and Antiquities, and the Department of General Survey of the Ministry of Defense; and in East Africa, the National Museums of Kenya and the British Institute of East Africa, Nairobi. We also thank Derek Sturdy and the Trust for the Southern Levant Human Environment Project for help in the production of Figure 8.