





Nomenclature
- ${\alpha _{damp}}$
-
inertia damping parameter in the PSO
- CAS
-
calibrated airspeed (kts)
- D
-
turbulence
-
${e_{\left( {vs,h} \right)}}$
-
tracking errors (ft/s for vertical speed and ft for altitude)
-
${\hat{\!F}_{\left( {vs,h} \right)}}$
-
functions approximated by the multiplayer fuzzy recurrent neural network (MFRNN)
-
${\tilde{\!F}_{\left( {vs,h} \right)}}$
-
approximation error
-
${F_{\left( {vs,h} \right)}}$
,
${G_{\left( {vs,h} \right)}}$
-
unknown nonlinear functions
-
${g_{\left( {h,vs} \right)}}$
-
positive constant
-
$h$
-
altitude (ft)
-
${h_{ref}}$
-
desired altitude (ft)
-
${h_{trans}}$
-
transition altitude (ft)
-
${i_{max}}$
-
max number of iterations in the PSO
-
${k_{\left( {h,vs} \right)}}$
-
gains of the switching control laws
-
${L_{\left( {h,vs} \right)}}$
-
postive design parameters
-
${m_{\left( {h,vs} \right)}}$
-
mode transition coefficients
-
${p_{max}}$
-
swarm size in the PSO
-
${S_{\left( {h,vs} \right)}}$
-
sliding surfaces
-
${u_{e{q_{\left( {h,vs} \right)}}}}$
-
equivalent control laws
-
${u_{s{w_{\left( {h,vs} \right)}}}}$
-
switching control laws
-
${u_{\left( {h,vs} \right)}}$
-
control laws for the altitude hold (
$h$
) and vertical speed
$vs)$
modes (deg/sec) -
${u_{AT}}$
-
ultimate autopilot control law (deg/sec)
-
$VS$
-
vertical speed (ft/s)
-
$V{S_{ref}}$
-
desired vertical speed (ft/s)
-
$W$
-
weights of the MFRNN
-
$x$
-
aircraft state variable
-
${x_{\left( {vs,h} \right)}}$
-
inputs of the MFRNN
-
${X_{cg}}$
-
centre of gravity (%)
-
${X_{lo}}$
,
${X_{up}}$
-
lower/ upper bounds of the searching range
-
${\mu _{1m}}\left(x\right)\!,\;{\mu _{2n}}\left( x \right)$
-
Gaussian membership functions
-
${\mu _{NHE}}$
-
membership function of the negative high error (NHE) linguistic term
-
${\mu _{ME}}$
-
membership function of the medium error (ME) linguistic term
-
${\mu _{NHE}}$
-
membership function of the positive high error (PHE) linguistic term
-
${{\rm{\Omega }}_1}$
,
${{\rm{\Omega }}_2}$
-
acceleration parameters in the PSO


1.0 Introduction
Improving aircraft safety, efficiency and reliability have been the main topics of many articles in the aerospace and aeronautics fields. Although recent technological advances have helped reduce system failures, human errors remain the cause of approximately 80% of aircraft accidents and incidents [Reference Rankin1]. While conventional control systems continue to perform adequately in flight control applications, artificial intelligence- (AI) based methodologies offer promising enhancements, such as adaptability and improved real-time control performance to autopilot systems. These approaches have the potential to handle uncertainties, unknown dynamics, external disturbances and varying flight conditions without frequent parameter tuning, which is essential for the conventional systems. In addition, they can also help to reduce the pilot’s workload, particularly during high-demand tasks or complex manoeuvres. Therefore, this article introduces a new generation of AI-based autopilot systems for commercial aircraft by using a novel control strategy based on a multilayer fuzzy recurrent neural network (MFRNN) with a two-mode sliding mode control (SMC).
Previously, various conventional methodologies were applied to control unmanned aerial vehicles (UAVs) and quadcopters.
In previous studies, various conventional methodologies were applied to control UAVs and quadcopters. Ahsan and Hanif [Reference Ahsan and Hanif2] presented two methods based on the proportional integral derivative (PID) method to control the altitude of an Aerosonde UAV; one with a single elevator command and the other using both throttle and elevator commands, showing that the second approach could enhance transient response. For the same application, Ahsan et al. [Reference Ahsan, Shafique, Mansoor and Mushtaq3] developed two altitude controllers: one based on PID control and the other using a lead compensator, and found that the lead compensator operated better than the PID.
To improve the altitude tracking performance of UAVs, Liu et al. [Reference Liu, Liu, Wei, Song, Ge and Wang4] developed linear proportional (P), derivative (D), and two derivatives (DD) controllers integrated with a Kalman filter to estimate both the climb and descent rates. Cárdenas et al. [Reference Cárdenas, Boschetti and Celi5] applied a pole-placement methodology to control the altitude and heading of an UAV by using linearised longitudinal and lateral-directional models. A back-tracking search optimisation method combined with PID control was used to enhance the autopilot performance of an unmanned helicopter by improving settling time, rise time and maximum overshoot specifications [Reference Konar and Hatipoğlu6].
Liu et al. [Reference Liu, Egan and Santoso7] proposed a fine-tuned PID-based airspeed, heading and altitude controllers for an UAV. Win et al. [Reference Win, Nyunt and Tun8] developed a PID-based pitch attitude hold autopilot for an YTUEC001 UAV. Qian and Liu [Reference Qian and Liu9] used an uncertainty and disturbance estimator- (UDE) based translational controller for near-hovering phases and an inner-loop attitude controller, ensuring global asymptotic stability under disturbance and payload.
Qi et al. [Reference Qi, Zhu, Wang, Shan and Liu10] showed that using a modified UDE within a cascade PID architecture can ensure accurate attitude tracking of a quadrotor while effectively rejecting disturbances. Similarly, Feng and Liu [Reference Feng and Liu11] proposed a nonlinear model predictive control (MPC) strategy designed to prevent collisions between two UAVs around obstacles using a new flight scenario. Zhao et al. [Reference Zhao, Duan, Yu, Qu and Zhang12] applied global fast terminal SMC for controlling the attitude of an UAV to approach a virtual tanker aircraft for an aerial refueling. As another approach for collision avoidance, Zhang et al. [Reference Zhang, Jia, Zhou, Guo, Yu and Zhang13] developed an autopilot system based on a sliding mode observer (SMO) combined with an energy-efficient trajectory planning strategy for quadrotors, aimed at ensuring the safety of the actuation system.
Zareb et al. [Reference Zareb, Nouibat, Bestaoui, Ayad and Bouzid14] suggested that genetic algorithms (GAs) can be used to optimise the performance of two fuzzy controllers and four PIDs for controlling the attitude and altitude of an AR Drone V2 quadrotor. Wilburn et al. [Reference Wilburn, Perhinschi and Wilburn15] also developed a new GA to optimise controller gains to guarantee and ensure effective trajectory tracking performance for UAVs. Zhou et al. [Reference Zhou, Wang, Yu and Zhang16] proposed a control strategy combining a finite-time SMC system with disturbance observers and an event-triggered communication mechanism. This approach aims to improve the trajectory tracking performance of UAVs while reducing communications load. In another study, the adaptive neuro-fuzzy inference system (ANFIS) was integrated with the brain storm optimisation (BSO) algorithm to improve UAV thrust performance. This hybrid approach effectively optimised parameters related to the propeller, battery and engine [Reference Konar, Hatipoğlu and Akpınar17].
Besides the design of autopilot controllers for UAVs and quadrotors, different methodologies were developed for hypersonic and supersonic aircraft, as discussed below.
Sahbon et al. [Reference Sahbon, Jacewicz, Lichota and Strzelecka18] proposed a Thrust Vector Control (TVC)-based path-following autopilot system for the X-15 aircraft using three PID controllers for roll, altitude and yaw control to compensate for Coriolis effects. Dong et al. [Reference Dong, Qin, Song, Wang and Lei19] implemented a GA-based fractional-order PID controller to achieve active disturbance rejection performance in aircraft pitch control. To achieve rapid altitude tracking performance, Gao et al. [Reference Gao, Chen, Sun, Huang, Wang and Chen20] studied an state observer based cascaded PID altitude controller for hypersonic aircraft to ensure its attitude stability. Fenfen et al. [Reference Fenfen, Xubo, Haiming and Tong21] used an auto-disturbance rejection system (ADRS) combined with a PID controller to mitigate coupling and external disturbances, thereby enhancing tracking performance in hypersonic vehicles.
Taha et al. [Reference Taha, Bayuomi, El-Bayoumi and Hassan22] developed a model reference adaptive control (MRAC) effective for designing authentication header (AH) mode, with improved results using online parameter estimation for the speed autopilot.
Perez et al. [Reference Perez, Moncayo, Perhinschi, Al Azzawi and Togayev23] developed an adaptive PID controller using a GA-based immunity algorithm to enhance supersonic fighter control and ensure model robustness under failures. Perez et al. [Reference Perez, Moncayo, Moguel, Perhinschi, Al Azzawi and Togayev24] used an immunity-based algorithm with dynamics inversion and MRAC to maintain fighter performance under failures with a minimal pilot input. Park et al. [Reference Park, Roh, Lee, Tahk, Choi and Kim25] designed a gain-scheduling autopilot for hypersonic vehicles to control the pitch rate, acceleration and flight path angle amid model uncertainties.
Hiliuta et al. [Reference Hiliuta, Botez and Brenner26,Reference Hiliuta, Botez and Brenner27] evaluated ANFIS and fuzzy clustering to approximate aerodynamic forces in a F/A-18 aeroservoelastic model. They found that the least square method was ineffeive for unsteady aerodynamic forces analyses in the frequency domain and proposed combining fuzzy clustering with shape-preserving methods to improve model accuracy for intermediate frequencies using STructural Analysis RoutineS (STARS) software.
Furthermore, several studies have focused on developing controllers for hypersonic, fighter, supersonic, commercial and business aircraft, as outlined below.
PID-based loop shaping and an ${H_\infty }$
controllers were employed for the autolanding system of a twin-engine civil aircraft to deal with a 25-knots crosswind [Reference Theis, Ossmann, Thielecke and Pfifer28]. Meanwhile, Qiu et al. [Reference Qiu, Delshad, Zhu, Nibouche and Yao29] implemented a non-minimum phase dynamic inversion controller using a U-model root solver for the altitude-hold autopilot of a B747 aircraft to address right-half-plane zeros. Similarly, Santos and Oliveira [Reference Santos and Oliveira30] demonstrated the accurate performance of a PID control methodology using an X-plane flight simulator. This method was also applied for a general aviation civil aircraft, Islam et al. [Reference Islam, Alam, Laskar and Garg31] and for a Piper PA-28-236-DAKOTA aircraft [Reference Raj and Kumar32]. This controller was developed by using root-locus design technique for parameter adjustment, aiming to achieve an overshoot of less than 15% in turbulent condition.
${H_\infty }$
controllers were employed for the autolanding system of a twin-engine civil aircraft to deal with a 25-knots crosswind [Reference Theis, Ossmann, Thielecke and Pfifer28]. Meanwhile, Qiu et al. [Reference Qiu, Delshad, Zhu, Nibouche and Yao29] implemented a non-minimum phase dynamic inversion controller using a U-model root solver for the altitude-hold autopilot of a B747 aircraft to address right-half-plane zeros. Similarly, Santos and Oliveira [Reference Santos and Oliveira30] demonstrated the accurate performance of a PID control methodology using an X-plane flight simulator. This method was also applied for a general aviation civil aircraft, Islam et al. [Reference Islam, Alam, Laskar and Garg31] and for a Piper PA-28-236-DAKOTA aircraft [Reference Raj and Kumar32]. This controller was developed by using root-locus design technique for parameter adjustment, aiming to achieve an overshoot of less than 15% in turbulent condition.
Different AI-based autopilot systems were also designed for civil aircraft. For instance, Nivison and Khargonekar [Reference Nivison and Khargonekar33] proposed a deep gated recurrent neural network (DGRNN) controller for the aircraft longitudinal motion to achieve robustness and trajectory-tracking performance. Using a combination of RNN and GA systems, Juang and Chiou [Reference Juang and Chiou34] developed an enhanced autolanding system under severe wind shear conditions. Vandana et al. [Reference Vandana, Chaturvedi, Jaikumar and Chandar35] designed a two-loops autopilot system that integrated a robust control system combined with an Neural Network (NN) and a UDE for a rigid-body aircraft.
In this article, the proposed longitudinal autopilot control system was tested and validated on a nonlinear simulation platform designed for Cessna Citation X (CCX) business aircraft. Previously, a linear quadratic regulator (LQR) was combined with the guardian maps theory to achieve robustness against uncertainties for the CCX lateral motion [Reference Ghazi and Botez36]. Boughari et al. [Reference Boughari, Ghazi and Theel37] combined an optimal controller with a meta-heuristic optimisation technique to ensure stability of linear and nonlinear models of the CCX aircraft. A combination of PI controller and guardian maps theory was used into the stability and control augmentation systems to control the CCX pitch rate [Reference Ghazi, Rezk and Botez38].
In addition to conventional controllers, several AI-based methodologies have also been proposed for the CCX aircraft Quintin et al. [Reference Quintin, Andrianantara, Ghazi and Botez39] integrated a dynamic inversion system into adaptive neural network (ANN), and a PID controller to control the Cessna Citation X (CCX) roll rate control. Furthermore, combining MPC system with recursive least square (RLS) algorithm and adaptive control system can be efficient to control the CCX pitch rate [Reference Andrianantara, Ghazi and Botez40].
Previously, the authors developed different AI-based controllers for the CCX aircraft, including type-two adaptive fuzzy SMC (T2AFSMC) [Reference Hosseini, Ghazi and Botez41] and a model-referenced adaptive RNN controller [Reference Hosseini, Inga, Ghazi and Botez42] for its longitudinal motion and a combination of T2AFLS, PSO-based and adaptive super-twisting SMC systems for its lateral motion [Reference Hosseini, Bematol, Ghazi and Botez43] across different flight conditions.
This article focuses on developing an MFRNN-based autopilot system for the CCX longitudinal motion during cruise, under both ideal and turbulent conditions using Dryden turbulence model with moderate-intensity value ( ${10^{ - 3}})$
). The novel methodology introduces new features to flight control systems designed using the AI. This autopilot system does not rely on aircraft dynamics models, and it can handle the uncertainties, highly nonlinear and unmodeled dynamics by its adaptive and real-time learning characteristics. These properties can guarantee the aircraft robustness and performance across a wide range of flight conditions without the need for constant parameters adjustment.
${10^{ - 3}})$
). The novel methodology introduces new features to flight control systems designed using the AI. This autopilot system does not rely on aircraft dynamics models, and it can handle the uncertainties, highly nonlinear and unmodeled dynamics by its adaptive and real-time learning characteristics. These properties can guarantee the aircraft robustness and performance across a wide range of flight conditions without the need for constant parameters adjustment.
Therefore, the main contributions of this research are listed below.
-
1. A novel MFRNN-based sliding mode control system for this application
In previous studies, researchers mostly focused on conventional control systems, such as PID, LQR and conventional neural networks (e.g., ANN, GRU). In contrast, in this research, we assumed that the aircraft nonlinear dynamics model is unknown, and we have no knowledge about aircraft systems. To address this challenge, we used an MFRNN as a dynamic approximator within our control system. This approach enhances both robustness and adaptability, enabling the system to effectively manage highly nonlinear dynamics; capabilities that cannot be reliably achieved using simpler architectures or linear controllers.
-
2. Novel hybrid online training process using PSO-based backpropagation
Although the MFRNN structure was adapted as proposed in Fei et al. [Reference Fei, Wang, Liang, Feng and Xue44], this paper introduces a new training algorithm that combines particle swarm optimisation (PSO) with a backpropagation algorithm. The proposed methodology includes:
-
• Off-line initialisation of MFRNN weights using PSO, which facilitates faster convergence.
-
• On-line weight adjustments using backpropagation algorithm to ensure real-time adaptability during flight.
This combination of an off-line initialisation and an on-line training is both unique and novel for the following reasons. This model does not require any dataset or any prior knowledge about the unknown dynamics of aircraft. In addition, the handling of timeseries inputs is a big challenge to approximate spontaneously aircraft dynamics even under turbulence; this capability cannot be found in other research articles. Moreover, the simulation results showed that this methodology could guarantee the robustness and adaptability of the autopilot system by approximating the aircraft dynamics appropriately and integrating it into the SMC system.
-
3. Application to a high-fidelity nonlinear simulation platform
This autopilot system is validated using a nonlinear simulation platform for CCX aircraft, developed based on a Level D Research aircraft flight simulator (RAFS) at the Laboratory of Applied Research in Active Controls, Avionics and Aeroservoelasticity (LARCASE). This RAFS provides flight dynamics data certified to the highest level of accuracy by the FAA, ensuring excellent validation results.
-
4. A novel fuzzy-based mode transition algorithm
A new fuzzy logic-based mode transition algorithm was developed to manage switching between the altitude hold (AH) and vertical speed (VS) modes. This algorithm was inspired by the approach developed by us in-house at LARCASE [Reference Ghazi45]. Unlike conventional autopilot systems, which include three modes such as AH, VS and altitude capture, our system proposes a novel fuzzy logic-based mode transition algorithm with two modes improving performance and efficiency of the autopilot system by reducing the complexity of the transition algorithm across the entire flight envelope of the CCX aircraft during cruise (all 925 flight conditions). The proposed method ensures universal applicability and adaptability, even under both ideal and turbulent conditions.
-
5. Rigorous stability proof using the Lyapunov theorem
This article presents a Lyapunov-based stability analysis for the entire autopilot system, demonstrating that the proposed autopilot system is asymptotically stable. Previous works almost neglected the stability analysis or have not applied Lyapunov theory rigorously across the entire system.
-
6. Pitch rate control system design in the inner loop of the autopilot system
-
The inner loop of our proposed autopilot to control the CCX pitch rate was developed based on our previous work on the application of a Type-one adaptive fuzzy sliding mode control (T1AFSMC) system in Hosseini et al. [Reference Hosseini, Ghazi and Botez46].
Table 1 illustrates a brief explanation of the methodologies proposed in previous articles to clarify the contributions of this research article to the development of an aircraft autopilot system.
Previous methodologies developed for the aircraft autopilot systems

This research is novel for its application to a commercial aircraft such as the CCX and in proposing a new fuzzy-based transition algorithm and MFRNN approximation method, trained with a new approach. A summary of the contributions is shown in Fig. 1.
Simple scheme of the research contributions.

The rest of this paper is organised as follows: Section 2 introduces the aircraft nonlinear model, turbulence model, PSO-based MFRNN design, VS and AH mode controllers and the fuzzy-based transition algorithm. Section 3 presents the results and performance analysis, and Section 4 concludes with a summary of the findings.
2.0 Background
In this section, the three methods used in this study are discussed for designing an autopilot for the aircraft longitudinal motion during cruise.
2.1 Nonlinear state-space aircraft representation
The state-space model is a well-known representation of system dynamics. This representation is typically characterised by two functions, ${F_{\left( {vs,h} \right)}}$
and
${F_{\left( {vs,h} \right)}}$
and ${G_{\left( {vs,h} \right)}}$
, which reflect the aircraft dynamics variations, as the functions existing in the vertical speed (
${G_{\left( {vs,h} \right)}}$
, which reflect the aircraft dynamics variations, as the functions existing in the vertical speed ( $vs$
) and altitude (
$vs$
) and altitude ( $h$
) control systems [Reference Yedavalli49]. Generally,
$h$
) control systems [Reference Yedavalli49]. Generally, ${G_{\left( {vs,h} \right)}}$
in aircraft control systems shows the effectiveness of the control inputs which varies in small ranges during the cruise. Moreover, it was observed that
${G_{\left( {vs,h} \right)}}$
in aircraft control systems shows the effectiveness of the control inputs which varies in small ranges during the cruise. Moreover, it was observed that ${G_{\left( {vs,h} \right)}}$
varied with values around 1. Therefore, to reduce the complexity of the control system design, we assumed that
${G_{\left( {vs,h} \right)}}$
varied with values around 1. Therefore, to reduce the complexity of the control system design, we assumed that ${G_{\left( {vs,h} \right)}}$
is approximately equal to 1
${G_{\left( {vs,h} \right)}}$
is approximately equal to 1 ${G_{\left( {vs,h} \right)}} \approx 1$
. Consequently, the aircraft state-space representation for the vertical speed and altitude modes can be described with a vector of state variables and the control input (i.e., command) denoted by
${G_{\left( {vs,h} \right)}} \approx 1$
. Consequently, the aircraft state-space representation for the vertical speed and altitude modes can be described with a vector of state variables and the control input (i.e., command) denoted by ${x^{}} = [VS,h$
] and
${x^{}} = [VS,h$
] and ${u_{\left( {vs,h} \right)}}$
, respectively:
${u_{\left( {vs,h} \right)}}$
, respectively:
 \begin{align}{x^{\left( n \right)}} = {F_{\left( {vs,h} \right)}} + {G_{\left( {vs,h} \right)}}{u_{\left( {vs,h} \right)}} + D = {F_{\left( {vs,h} \right)}} + {u_{\left( {vs,h} \right)}} + D\end{align}
where $n$
is the order of derivative, and
$n$
is the order of derivative, and $D$
is the atmospheric turbulence.
$D$
is the atmospheric turbulence.
Furthermore, we used a simulation platform developed at the LARCASE for the CCX business jet aircraft [Reference Ghazi45]. This platform was validated using the flight data from a Level-D RAFS available at LARCASE for this business aircraft, as illustrated in Fig. 2. Level D represents the highest certification be issued by the Federal Aviation Authority (FAA) for aircraft flight simulation in terms of flight data accuracy [Reference Ghazi45].
Level D RAFS For the CCX aircraft at LARCASE.

2.1.1 Turbulence model
The Dryden turbulence model is commonly used in aerospace engineering to simulate the atmospheric gusts and turbulence that an aircraft may encounter during flight. This realistic representation of atmospheric turbulence helps to evaluate the safety and performance of the proposed control system. We used the continuous Dryden turbulence model available in MATLAB/Simulink (R2023b) Aerospace Environment blockset configured according to MIL-F-8785C. In this configuration, the turbulence probability of the exceedance of high-altitude intensity was selected as moderate ( ${10^{ - 3}})$
with wind speed of 5 meters per second and scale length at medium/high altitudes of 533.4m. In addition, the wingspan of the CCX aircraft was chosen to configure the turbulence model. The turbulence intensity varies with altitude, and it is influenced by the probability of exceeding [Reference Moorhouse and Woodcock50]. In Equation (1),
${10^{ - 3}})$
with wind speed of 5 meters per second and scale length at medium/high altitudes of 533.4m. In addition, the wingspan of the CCX aircraft was chosen to configure the turbulence model. The turbulence intensity varies with altitude, and it is influenced by the probability of exceeding [Reference Moorhouse and Woodcock50]. In Equation (1), $D$
denotes the atmospheric turbulence in the state-space representation.
$D$
denotes the atmospheric turbulence in the state-space representation.
2.2 PSO-based MFRNN approximators
As discussed earlier, the nonlinear state-space representations of the CCX aircraft contain the unknown functions ${F_{\left( {vs,h} \right)}}$
, which were approximated by the following MFRNN, as proposed in Fei et al. [Reference Fei, Wang, Liang, Feng and Xue44], for the design of autopilot system.
${F_{\left( {vs,h} \right)}}$
, which were approximated by the following MFRNN, as proposed in Fei et al. [Reference Fei, Wang, Liang, Feng and Xue44], for the design of autopilot system.
The main architecture of the MFRNN is presented in Fig. 3, which includes four main layers: (1) the input layer, (2) the membership layer, (3) the rules layer and (4) the output layer. There are some feedback loops in the MFRNN, as shown in Fig. 3, which can provide the MFRNN with a self-learning ability to approximate the aircraft dynamics.
Multilayer fuzzy recurrent neural network (MFRNN) scheme.

In this autopilot system, two MFRNNs were developed, one for VS mode and the other architecture for AH mode. The main structure of the layers in these MFRNNs is explained as follows, which is inspired from the well-known structure of the fuzzy logic system, including a fuzzifier (membership layer), an inference engine (rule layer), a defuzzifier (output layer):
-
1. Input layer (2 neurons):
Initially, two signals were measured from the CCX simulation platform: the vertical speed $VS$
and the aircraft altitude
$VS$
and the aircraft altitude $h$
. These signals were used in the definition of the tracking errors
$h$
. These signals were used in the definition of the tracking errors ${e_{vs}}$
, and
${e_{vs}}$
, and ${e_h}$
as calculated in Equations (2) and (3):
${e_h}$
as calculated in Equations (2) and (3):
 \begin{align}{e_{vs}} = VS - V{S_{ref}}\end{align}
 \begin{align}{e_h} = h - {h_{ref}}\end{align}
Two inputs vectors represented by ${I_{vs}}$
(for the VS mode) and
${I_{vs}}$
(for the VS mode) and ${I_h}$
(for the AH mode) were used in the MFRNNs, each composed of the tracking error
${I_h}$
(for the AH mode) were used in the MFRNNs, each composed of the tracking error ${e_{\left( {vs,h} \right)}}$
and its first-order derivative
${e_{\left( {vs,h} \right)}}$
and its first-order derivative ${\dot e_{\left( {vs,h} \right)}}$
, as shown in Equations (4.a) and (4.b), for the VS and AH modes, respectively.
${\dot e_{\left( {vs,h} \right)}}$
, as shown in Equations (4.a) and (4.b), for the VS and AH modes, respectively.
 \begin{align} {I_{vs}} &= \left[ {{e_{vs}};\;{{\dot e}_{vs}}} \right]\\[-5pt]\nonumber \end{align}
 \begin{align} {I_h} &= \left[ {{e_h};\;{{\dot e}_h}} \right]\\[-5pt]\nonumber\end{align}
The inputs defined in Equations (4.a) and (4.b) reflect the control objectives by capturing essential information about deviations in the aircraft dynamics without requiring explicit dependence on the full set of dynamics variables. In addition, the choice of these inputs avoids redundancy, since pitch-rate variations were already represented in the inner loop, and it enhanced stable learning by reducing the effects of undesired variations such as turbulence in the learning process.
In these MFRNNs, shown in Fig. 3, there is a feedback loop from the output layer ( $\, {\hat{\!F}_{\left( {vs,h} \right)}} = {O_4}$
) to the input layer expressed by
$\, {\hat{\!F}_{\left( {vs,h} \right)}} = {O_4}$
) to the input layer expressed by ${F_{{O_4}}}$
. Using the elements in the inputs vectors given in Equation (4.a) for the VS mode denoted by
${F_{{O_4}}}$
. Using the elements in the inputs vectors given in Equation (4.a) for the VS mode denoted by ${I_{vs}}$
, and in Equation (4.b) for the AH mode represented by
${I_{vs}}$
, and in Equation (4.b) for the AH mode represented by ${I_h}$
, we can write:
${I_h}$
, we can write:
 \begin{align} {\delta _1} &= {e_{\left( {vs,h} \right)}}.{W_{41}}.{F_{{O_4}}}\\[-10pt]\nonumber\end{align}
 \begin{align} {\delta _2} &= {\dot e_{\left( {vs,h} \right)}}.{W_{42}}.{F_{{O_4}}}\end{align}
where ${\delta _1}$
is the first neuron output, and
${\delta _1}$
is the first neuron output, and ${\delta _2}$
is the second neuron output in the input layer. Moreover,
${\delta _2}$
is the second neuron output in the input layer. Moreover, ${W_{41}}$
and
${W_{41}}$
and ${W_{42}}$
denote the recurrent weights acting on the connections (internal feedback loop) between the output and the input layers.
${W_{42}}$
denote the recurrent weights acting on the connections (internal feedback loop) between the output and the input layers.
-
2. Membership layer (6 neurons):
In this layer, each neuron is a Gaussian membership function denoted by ${\mu _{1m}}$
and
${\mu _{1m}}$
and ${\mu _{2n}}$
that processes the output of the previous layer (the input layer), denoted by
${\mu _{2n}}$
that processes the output of the previous layer (the input layer), denoted by ${\delta _1}$
and
${\delta _1}$
and ${\delta _2}$
in Equations (5.a) and (5.b), and the feedback connections shown by
${\delta _2}$
in Equations (5.a) and (5.b), and the feedback connections shown by ${F_{1m}}$
and
${F_{1m}}$
and ${F_{2n}}$
, multiplied by their weights
${F_{2n}}$
, multiplied by their weights ${W_{1m}}$
and
${W_{1m}}$
and ${W_{2n}}$
, respectively.
${W_{2n}}$
, respectively. ${F_{1m}}$
and
${F_{1m}}$
and ${F_{2n}}$
contains the previous output values (feedback) of the membership functions calculated by Equations (8.a) and (8.b) [Reference Fei, Wang, Liang, Feng and Xue44].
${F_{2n}}$
contains the previous output values (feedback) of the membership functions calculated by Equations (8.a) and (8.b) [Reference Fei, Wang, Liang, Feng and Xue44].
 \begin{align} {\delta _{1m}} &= {\delta _1} + {W_{1m}}.{F_{1m}}\\[-5pt]\nonumber\end{align}
 \begin{align}{\delta _{2n}} &= {\delta _2} + {W_{2n}}.{F_{2n}}\\[-5pt]\nonumber\end{align}
 \begin{align} {\mu _{1m}}\left( x \right)& = {e^{ - 0.5{{\left( {\frac{{{\delta _{1m}} - {b_{1m}}}}{{{a_{1m}}}}} \right)}^2}}}\\[-5pt]\nonumber\end{align}
 \begin{align}{\mu _{2n}}\left( x \right) &= {e^{ - 0.5{{\left( {\frac{{{\delta _{2n}} - {b_{2n}}}}{{{a_{2n}}}}} \right)}^2}}}\\[-5pt]\nonumber\end{align}
In Equations (7.a)–(8.b), $m = \left\{ {1,2,3} \right\}$
and
$m = \left\{ {1,2,3} \right\}$
and $n = \left\{ {1,2,3} \right\}\;$
are the neurons indices. Equations (7.a) and (7.b) show that when calculating the input layers
$n = \left\{ {1,2,3} \right\}\;$
are the neurons indices. Equations (7.a) and (7.b) show that when calculating the input layers ${\delta _{1m}}$
and
${\delta _{1m}}$
and ${\delta _{2n}}$
, the weights
${\delta _{2n}}$
, the weights ${W_{1m}}$
and
${W_{1m}}$
and ${W_{2n}}$
act on the internal feedback loops (
${W_{2n}}$
act on the internal feedback loops ( ${F_{1m}}$
and
${F_{1m}}$
and ${F_{2n}}$
) in the membership layers. The values of the parameters in the Gaussian memberships are provided in Tables 2 and 3 for each VS and AH mode approximator, as follows.
${F_{2n}}$
) in the membership layers. The values of the parameters in the Gaussian memberships are provided in Tables 2 and 3 for each VS and AH mode approximator, as follows.
-
3. Rules layer (9 neurons)
Configurations of the membership functions in the VS mode

Configurations of the membership functions in the AH mode

Each neuron in this layer was used to calculate the product of the input signals serving as the product inference engine in the fuzzy logic system (FLS) architecture. The output of this layer ${O_r}$
is given in Equation (9):
${O_r}$
is given in Equation (9):
 \begin{align}{O_r} = \mathop \prod \limits_{m.n = 1}^3 {\mu _{1m}}\left( x \right).{\mu _{2n}}\left( x \right)\end{align}
where $r = \left\{ {1, \ldots ,9} \right\}$
is the total number of the rules.
$r = \left\{ {1, \ldots ,9} \right\}$
is the total number of the rules.
-
4. Output layer (1 neuron)
Using the 9 outputs ${O_r}$
obtained at each neuron in the rules layer and their corresponding weights, the final output of the MFRNN-based approximators can be expressed in Equation (10) for both the VS and AH controllers:
${O_r}$
obtained at each neuron in the rules layer and their corresponding weights, the final output of the MFRNN-based approximators can be expressed in Equation (10) for both the VS and AH controllers:
 \begin{align}{\hat{\!F}_{\left( {vs,h} \right)}}\left( {{x_{\left( {vs,h} \right)}}} \right) = \mathop \sum \limits_{r = 1}^9 \,{W_r}{O_r}\end{align}
2.2.1 The MFRNN training algorithm
Each of the MFRNN-based approximators, explained earlier for both autopilot modes, was trained using a new approach, as follows:
PSO algorithm parameters

-
i. Initially the MFRNNs receive the vector
${x_{vs}}$
in the VS controller and the vector
${x_h}$
in AH controller as input layers. -
ii. All weights {
${W_{41}}$
,
${W_{42}}$
,
${W_{1m}}$
,
${W_{2n}}$
and
${W_r}$
} were initialised using the PSO algorithm designed by the expressions in Equations (11) and (12), Gad [Reference Gad51] and the cost function given in Equation (13), while
${W_{41}} = {W_{42}}$
and
${W_{1m}} = {W_{2n}}$
on the feedback loops. Thus, the PSO was used to find the values of three weights, called decision variables ={
${W_{4\left( {1,2} \right)}}$
,
${W_{\left( {1m,2n} \right)}}$
,
${W_r}$
}. Each particle
$X_p^i$
in the PSO searches in a space between its bounds [
${X_{lo}}$
,
${X_{up}}]$
, which means that all decision variables could only take a value within the defined range. In addition, in Equation (11),
${P_{best}}$
and
${G_{best}}$
are the personal and global best results, respectively, and
${\beta _1}$
and
${\beta _2}$
denote two random values within [0, 1] [Reference Gad51].(11)
\begin{align}\mathop \sum \limits_{i = 1}^{{i_{max}}} \mathop \sum \limits_{p = 1}^{{p_{max}}} Y_p^{i + 1} = {\alpha _{damp}} \times {\rm{\;}}Y_p^i + {\rm{\;}}{{\rm{\Omega }}_1} \times {\beta _1}{\rm{*}}\left( {{P_{best}} - {\rm{\;}}X_p^i} \right) + {\rm{\;}}{{\rm{\Omega }}_2} \times {\beta _2}\left( {{\rm{\;}}{G_{best}} - {\rm{\;}}X_p^i} \right)\end{align}
(12)
\begin{align}\mathop \sum \limits_{i = 1}^{{i_{max}}} \mathop \sum \limits_{p = 1}^{{p_{max}}} X_p^{i + 1} = {\rm{\;}}X_p^i + Y_p^{i + 1}\end{align}
(13)
\begin{align}Cost\left( {Y_p^i} \right) = \frac{1}{2} \times \mathop \sum \limits_0^\tau {\left( {{e_{\left( {vs,h} \right)}}} \right)^2}\end{align}
Equation (13) was selected to directly minimise the tracking error, which constitutes the main control objective of this study. Although the literature shows that model-free approximation methods may incorporate the equations of motion (EOMs) as constraints within the cost function, such an approach contradicts our objective of prioritising tracking-error minimisation. In practice, it was observed that introducing the EOMs as additional penalty terms tended to bias the optimisation toward reproducing intermediate dynamics variables rather than minimising the tracking error. Therefore, the defined cost function in Equation (13) solely based on the tracking errors ensures consistent agreement between the learning and control objectives without degrading the performance of the autopilot system.
In Equations (11)–(13),
${{\rm{\Omega }}_1}$
and
${{\rm{\Omega }}_2}$
are the personal and social acceleration parameters, respectively,
${\alpha _{damp}}$
is the damping inertia,
${p_{max}}$
is the total swarm size (population),
${i_{max}}$
is the maximum number of iterations,
$Y_p^i$
is the particle velocity and
$X_p^i$
is the particle position. The values for each parameter in Equations (11) and (12) in Table 4.As shown in Table 4, the maximum number of iterations
${i_{max}}$
was set to 10 to achieve a good balance between computational efficiency and accuracy. It was observed that increasing the number of iterations primarily led to longer search times for the PSO, without significantly improving control system performance. Similarly, the swarm size
${p_{max}}\;$
was set to 500, which was empirically determined through extensive trial and error testing to ensure a good exploration of the search space. Increasing the swarm size beyond this value did not meaningfully enhance performance but substantially increased computational time. -
iii. Finally, the weights connecting the rules layer to the output layer, denoted by
${W_r}_{\left( {1 \times 9} \right)}$
, were updated with the initial values founded by the PSO, using a backpropagation (BP) algorithm, as shown below.(14)
\begin{align}{W_r}\left( {t + 1} \right) = {W_r}\left( t \right) - {\eta _{{w_r}}}{\rm{\Delta }}{W_r}\end{align}
(15)
\begin{align}{\tilde{\!F}_{\left( {vs,h} \right)}} = {F_{\left( {vs,h} \right)}} - {\hat{\!F}_{\left( {vs,h} \right)}}\end{align}
(16)where
\begin{align}{\rm{\Delta }}{W_r} = {\tilde{\!F}_{\left( {vs,h} \right)}}{O_r}\end{align}
${\eta _{{w_r}}} = 0.7$
is the learning rate which was found after trying different values,
$W_{r}\!\left({t}\right)$
represents the current weights and
${W_r}\left( {t + 1} \right)$
denotes the future value of the weights, and
${\tilde{\!F}_{\left( {vs,h} \right)}}$
is the error between the predicted signal
${\hat{\!F}_{\left( {vs,h} \right)}}$
and the reference signal
${F_{\left( {vs,h} \right)}}$
. This training algorithm helps to update the approximated function with respect to the given reference online at each iteration. The reference signal in the VS controller was
${F_{vs}} = \dot VS,\;$
and in the AH controller
${F_h} = \dot h$
measured from the nonlinear simulation platform for the CCX aircraft.


2.3 Design of the VS and AH mode control systems
This section describes the control methodologies designed for the VS and AH modes. These controllers were developed based on an SMC system combined with PSO-based MFRNN approximators, as explained in the previous section. Furthermore, a novel transition algorithm was implemented using the FLS to switch between autopilot modes during the flight, thus efficiently to capture the altitude.
2.3.1 VS mode control system design
In the VS mode control system, a MFRNN-based sliding mode controller was proposed to force the aircraft to track the desired vertical speed. Accordingly, the tracking error ${e_{vs}} = VS - V{S_{ref}}$
given in Equation (2) and its first-order derivative
${e_{vs}} = VS - V{S_{ref}}$
given in Equation (2) and its first-order derivative ${\dot e_{vs}}$
were used to define the sliding surface, given in Equation (17) [Reference Khalil52]:
${\dot e_{vs}}$
were used to define the sliding surface, given in Equation (17) [Reference Khalil52]:
 \begin{align}{S_{vs}} = {\dot e_{vs}} + {L_{vs}}{e_{vs}}\end{align}
where ${L_{vs}} \gt 0$
.
${L_{vs}} \gt 0$
.
Taking the first-order derivative of the sliding surface defined in Equation (17), and knowing that ${\ddot{e}_{vs}} = \ddot{VS} - \ddot{V}{S_{ref}} = {F_{vs}} + {u_{vs}} + D - \ddot{V}{S_{ref}}$
from the state-space representation in Equation (1), it gives:
${\ddot{e}_{vs}} = \ddot{VS} - \ddot{V}{S_{ref}} = {F_{vs}} + {u_{vs}} + D - \ddot{V}{S_{ref}}$
from the state-space representation in Equation (1), it gives:
 \begin{align}{\dot S_{vs}} = {\ddot e_{vs}} + {L_{vs}}{\dot e_{vs}} = {F_{vs}} + {u_{vs}} + D - \ddot V{S_{ref}} + {L_{vs}}{\dot e_s}\end{align}
Therefore, the equivalent control law ${u_{e{q_{vs}}}}$
in the SMC system can be obtained by considering
${u_{e{q_{vs}}}}$
in the SMC system can be obtained by considering ${\dot S_{vs}} = 0$
[Reference Khalil52]. In addition, the turbulence
${\dot S_{vs}} = 0$
[Reference Khalil52]. In addition, the turbulence $D$
is unknown, so
$D$
is unknown, so ${u_{e{q_{vs}}}}$
becomes:
${u_{e{q_{vs}}}}$
becomes:
 \begin{align}{u_{e{q_{vs}}}} = - {F_{vs}} + \ddot V{S_{ref}} - {L_{vs}}{\dot e_{vs}}\end{align}
The switching control law ${u_{s{w_{vs}}}}$
was designed in its conventional form [Reference Khalil52], where
${u_{s{w_{vs}}}}$
was designed in its conventional form [Reference Khalil52], where $sat$
stands for the saturation function, and
$sat$
stands for the saturation function, and ${k_{vs}} \gt 0$
:
${k_{vs}} \gt 0$
:
 \begin{align}{u_{s{w_{vs}}}} = - {k_{vs}}sat\left( {{S_{vs}}} \right)\end{align}
In Equation (19), we assumed that ${F_{vs}}$
is an unknown nonlinear function; therefore, it should be replaced with its approximated function
${F_{vs}}$
is an unknown nonlinear function; therefore, it should be replaced with its approximated function ${\hat{\!F}_{vs}}$
, as calculated with Equation (10). Thus, the VS mode control law
${\hat{\!F}_{vs}}$
, as calculated with Equation (10). Thus, the VS mode control law ${u_{vs}}$
, using both Equations (19) and (20), becomes:
${u_{vs}}$
, using both Equations (19) and (20), becomes:
 \begin{align}{u_{vs}} = {u_{e{q_{vs}}}} + {u_{s{w_{vs}}}} = - {\hat{\!F}_{vs}} + \ddot V{S_{ref}} - {L_{vs}}{\dot e_{vs}} - {k_{vs}}sat\left( {{S_{vs}}} \right)\end{align}
To prove the stability of the system, the following Lyapunov candidate ${V_{vs}}$
is defined [Reference Khalil52]:
${V_{vs}}$
is defined [Reference Khalil52]:
 \begin{align}{V_{vs}} = \frac{1}{2}{\left( {{S_{vs}}} \right)^2}\end{align}
Then, the derivative of the ${V_{vs}}$
is calculated as given in Equation (23), by using the expression of
${V_{vs}}$
is calculated as given in Equation (23), by using the expression of ${\dot S_{vs}}$
in Equation (18) and by replacing
${\dot S_{vs}}$
in Equation (18) and by replacing ${u_{vs}}$
with its expression in Equation (21), as follows:
${u_{vs}}$
with its expression in Equation (21), as follows:
 \begin{align}{\dot V_{vs}} = {S_{vs}}{\dot S_{vs}} = {S_{vs}}\left[ {{F_{vs}} + {u_{vs}} + D - \ddot V{S_{ref}} + {L_{vs}}{{\dot e}_{vs}}} \right] = {S_{vs}}\left[ {{F_{vs}} - {{\hat{\!F}}_{vs}} + D - {k_{vs}}sat\left( {{S_{vs}}} \right)} \right]\end{align}
In this equation, we assumed that ${F_{vs}}$
and
${F_{vs}}$
and $D$
are two unknown bounded functions such that
$D$
are two unknown bounded functions such that $\big| {{F_{vs}}} \big| \le {F_{v{s_{MAX}}}}$
and
$\big| {{F_{vs}}} \big| \le {F_{v{s_{MAX}}}}$
and $\big| D \big| \le {D_{MAX}}$
[Reference Slotine and Li53–Reference Wang55], where
$\big| D \big| \le {D_{MAX}}$
[Reference Slotine and Li53–Reference Wang55], where ${F_{v{s_{MAX}}}}$
and
${F_{v{s_{MAX}}}}$
and ${D_{MAX}}$
are two positive values. Thus, due to the following aspects,
${D_{MAX}}$
are two positive values. Thus, due to the following aspects, ${\hat{\!F}_{vs}}\left( {{x_{vs}}} \right)$
can be considered as a bounded function:
${\hat{\!F}_{vs}}\left( {{x_{vs}}} \right)$
can be considered as a bounded function:
-
i. As presented in the membership layer of the MFRNN, we used two Gaussian memberhsip functions denoted by
${\mu _{1m}}\left( x \right)$
and
${\mu _{2n}}\left( x \right)$
in Equations (8.a) and (8.b), respectively. These membership functions are smooth and naturally bounded, with outputs that change over a finite interval, meaning that they are bounded. These outputs are propagated to the next layer (the rules layer) which calculates the product of the received inputs. Thus, mathematically, the product of some bounded inputs is also bounded [Reference Apostol56]. -
ii. As explained in Section 2.2.1, the weights between the rules layer and the output layer are updated by
${W_r}\left( {t + 1} \right) = {W_r}\left( t \right) - {\eta _{{w_r}}}{\rm{\Delta }}{W_r}$
(see Equation (14)). In this equation,
${\eta _{{w_r}}}$
should be selected to be small enough to ensure that weights
${W_r}\;$
are adjusted such that the error between the approximated function and its given reference is reduced over time. -
iii. According to the explanations above and by knowing the boundedness of the output of the rule layer, we can conclude that
${\hat{\!F}_{vs}}$
also varies in a bounded interval, so that
$\big|\, {{{\hat{\!F}}_{vs}}} \big| \le {Q_{v{s_{MAX}}}}$
, where
${Q_{v{s_{MAX}}}} \gt 0.$


Therefore, using the triangle inequality [Reference Mitrinović, Pečarić and Fink57], we can write:
 \begin{align}\big| {{F_{vs}} - {{\hat{\!F}}_{vs}}} \big| \le \big| {{F_{vs}}} \big| + \big| { - {{\hat{\!F}}_{vs}}} \big|\end{align}
where $\big| {{F_{vs}}} \big| \le {F_{v{s_{MAX}}}}$
and
$\big| {{F_{vs}}} \big| \le {F_{v{s_{MAX}}}}$
and $\big|\, {{{\hat{\!F}}_{vs}}} \big| \le {Q_{v{s_{MAX}}}}$
. Thus,
$\big|\, {{{\hat{\!F}}_{vs}}} \big| \le {Q_{v{s_{MAX}}}}$
. Thus, $\big| {{F_{vs}} - {{\hat{\!F}}_{vs}}} \big| \le {F_{v{s_{MAX}}}} + {Q_{MAX}} = {\varepsilon _{vs}}$
and
$\big| {{F_{vs}} - {{\hat{\!F}}_{vs}}} \big| \le {F_{v{s_{MAX}}}} + {Q_{MAX}} = {\varepsilon _{vs}}$
and ${\varepsilon _{vs}}$
is a too small positive constant.
${\varepsilon _{vs}}$
is a too small positive constant.
According to the proof of boundedness in Equation (23), we can rewrite ${\dot V_{vs}}$
as follows:
${\dot V_{vs}}$
as follows:
 \begin{align}{\dot V_{vs}} \le \big| {{S_{vs}}} \big|\big| {{F_{vs}} - {{\hat{\!F}}_{vs}}} \big| + \big| {{S_{vs}}} \big|\big| D \big| - {k_{vs}}\big| {{S_{vs}}} \big| \le \big| {{S_{vs}}} \big|\left( {{\varepsilon _{vs}} + {D_{MAX}} - {k_{vs}}} \right)\end{align}
So that:
 \begin{align}{\dot V_{vs}} \le \big| {{S_{vs}}} \big|\left( {{\varepsilon _{vs}} + {D_{MAX}} - {k_{vs}}} \right)\end{align}
The expression in Equation (26) indicates that for ${k_{vs}} \gt {\varepsilon _{vs}} + {D_{MAX}}$
, there will be always
${k_{vs}} \gt {\varepsilon _{vs}} + {D_{MAX}}$
, there will be always $\;{\dot V_{vs}} \lt 0$
, and therefore the proposed control system will be asymptotically stable.
$\;{\dot V_{vs}} \lt 0$
, and therefore the proposed control system will be asymptotically stable.
2.3.2 AH mode control system design
Similarly, the AH mode controller can be designed using the sliding surface defined in terms of the tracking error ${e_h}$
in Equation (3) and its first-order derivative
${e_h}$
in Equation (3) and its first-order derivative ${\dot e_h}$
, as follows [Reference Khalil52]:
${\dot e_h}$
, as follows [Reference Khalil52]:
 \begin{align}{S_h} = {\dot e_h} + {L_h}{e_h}\end{align}
where ${L_h}$
is a positive constant.
${L_h}$
is a positive constant.
Taking the derivative of the sliding surface ${S_h}$
, and using the state-space representation
${S_h}$
, and using the state-space representation $\ddot h\left( x \right) = {F_h} + {u_h} + D$
according to Equation (1), and the second order time derivative of the tracking error
$\ddot h\left( x \right) = {F_h} + {u_h} + D$
according to Equation (1), and the second order time derivative of the tracking error ${\ddot e_h} = \ddot h - {\ddot h_{ref}}$
from Equation (3), the sliding surface derivative becomes:
${\ddot e_h} = \ddot h - {\ddot h_{ref}}$
from Equation (3), the sliding surface derivative becomes:
 \begin{align}{\dot S_h} = {\ddot e_h} + {L_h}{\dot e_h} = {F_h} + {u_h} + D - {\ddot h_{ref}} + {L_h}{\dot e_h}\end{align}
As presented for the VS mode in Section 2.3.1, for the AH mode, the equivalent control term ${u_{e{q_h}}}$
was designed using
${u_{e{q_h}}}$
was designed using ${\dot S_h} = 0$
[Reference Khalil52], which lead to the final form of the control law
${\dot S_h} = 0$
[Reference Khalil52], which lead to the final form of the control law ${u_h}$
:
${u_h}$
:
 \begin{align}\begin{array}{*{20}{c}}{u_h} = {u_{e{q_h}}} + {u_{s{w_h}}} = \end{array}\underbrace { - {{\hat{\!F}}_h} + {{\ddot h}_{ref}} - {L_h}{{\dot e}_h}}_{{u_{e{q_h}}}}\underbrace { - {k_h}sat\left( {{S_h}} \right)}_{{u_{s{w_h}}}}\end{align}
To prove the stability of the control law in Equation (29), the Lyapunov candidate in Equation (30) and its derivative in Equations (31) and (32) become [Reference Khalil52].
 \begin{align}{V_h} = \frac{1}{2}{\left( {{S_h}} \right)^2}\end{align}
 \begin{align}{\dot V_h} = {S_h}{\dot S_h} = {S_h}\left[ {{F_h} + {u_h} + D - {{\ddot h}_{ref}} + {L_h}{{\dot e}_h}} \right]\end{align}
 \begin{align}{\dot V_h} = {S_h}\left[ {{F_h} - {{\hat{\!F}}_h} + D - {k_h}sat\left( {{S_h}} \right)} \right]\end{align}
The same calculations were applied for the AH mode controller as for the VS mode controller. Replacing ${u_h}$
in Equation (31) with its expression given in Equation (29) and knowing that
${u_h}$
in Equation (31) with its expression given in Equation (29) and knowing that $\big| {{F_h} - {{\hat{\!F}}_h}} \big| \le {F_{{h_{MAX}}}} + {Q_{{h_{MAX}}}} = {\varepsilon _h}$
, which was calculated from the triangle inequality [Reference Mitrinović, Pečarić and Fink57] (with
$\big| {{F_h} - {{\hat{\!F}}_h}} \big| \le {F_{{h_{MAX}}}} + {Q_{{h_{MAX}}}} = {\varepsilon _h}$
, which was calculated from the triangle inequality [Reference Mitrinović, Pečarić and Fink57] (with $\big| {{F_h}} \big| \le {F_{{h_{MAX}}}}$
and
$\big| {{F_h}} \big| \le {F_{{h_{MAX}}}}$
and $\big|\, {{{\hat{\!F}}_h}} \big| \le {Q_{{h_{MAX}}}}\;$
, where
$\big|\, {{{\hat{\!F}}_h}} \big| \le {Q_{{h_{MAX}}}}\;$
, where ${F_{{h_{MAX}}}}\;$
and
${F_{{h_{MAX}}}}\;$
and ${Q_{{h_{MAX}}}}$
are positive values and
${Q_{{h_{MAX}}}}$
are positive values and $\big| {sat\left( {{S_h}} \right)} \big| \le \big| {{S_h}} \big|$
), the final expression of
$\big| {sat\left( {{S_h}} \right)} \big| \le \big| {{S_h}} \big|$
), the final expression of ${\dot V_h}$
is obtained as shown in Equation (33):
${\dot V_h}$
is obtained as shown in Equation (33):
 \begin{align}{\dot V_h} \le \big| {{S_h}} \big|\left( {{\varepsilon _h} + {D_{MAX}} - {k_h}} \right)\end{align}
Similarly, with respect to the expression in Equation (33) and with ${k_h} \gt {\varepsilon _h} + {D_{MAX}}$
, it can be concluded that
${k_h} \gt {\varepsilon _h} + {D_{MAX}}$
, it can be concluded that $\;{\dot V_h} \lt 0$
, representing the asymptotical stability of the proposed control methodology for the AH mode system.
$\;{\dot V_h} \lt 0$
, representing the asymptotical stability of the proposed control methodology for the AH mode system.
To ensure the appropriate transition between the VS and AH modes, a new algorithm was developed to switch between these modes and is described next in Section 2.4.
2.4 FLS-based autopilot mode transition algorithm
This section presents a novel mode transition algorithm based on the FLS to make smooth transition between modes. Using this transition algorithm, when the aircraft climbs or descends to the pilot’s commanded altitude, as soon as it reaches a specific distance ( $\Delta h)$
) from this commanded altitude, the transition algorithm switches from the VS mode to the AH mode. Once the aircraft reaches this distance, the AH control system tries to maintain the commanded altitude, preventing the aircraft from climbing further or descending to lower altitudes.
$\Delta h)$
) from this commanded altitude, the transition algorithm switches from the VS mode to the AH mode. Once the aircraft reaches this distance, the AH control system tries to maintain the commanded altitude, preventing the aircraft from climbing further or descending to lower altitudes.
As explained in Ghazi [Reference Ghazi45], the distance at which the AH mode becomes engaged can be calculated with in Equation (34):
 \begin{align}\Delta h = {h_{ref}} - {h_{trans}} = \left( {\frac{{V{S_{ref}}^2}}{{0.05 \times g}}} \right)\left( {\frac{{e - 1}}{e}} \right)\end{align}
where $g \approx 9.81$
is the gravitational acceleration.
$g \approx 9.81$
is the gravitational acceleration.
This fuzzy logic transition algorithm is the core decision-making component in this autopilot system, which switches between its modes. As shown in Fig. 4, an FLS is composed of four main components: (1) fuzzifier, (2) fuzzy rule base, (3) inference engine and (4) defuzzifier. These components are explained in details in Wang [Reference Wang55].
Main components of the FLS.

In this algorithm, we used the altitude tracking error ${e_h}$
in Equation (3) as the input that was given to the FLS. This variable was fuzzified using three different membership functions defined by some linguistic variables such as Negative High Error (NHE), Medium Error (ME) and Positive High Error (PHE). Regarding these linguistic variables, we defined a minimum number of fuzzy rules to simplify the design of the FLS. In addition, the outputs were selected by two singleton values between 0 and 1 for each
${e_h}$
in Equation (3) as the input that was given to the FLS. This variable was fuzzified using three different membership functions defined by some linguistic variables such as Negative High Error (NHE), Medium Error (ME) and Positive High Error (PHE). Regarding these linguistic variables, we defined a minimum number of fuzzy rules to simplify the design of the FLS. In addition, the outputs were selected by two singleton values between 0 and 1 for each ${m_{vs}}$
and
${m_{vs}}$
and ${m_h}$
coefficient. The equations of each membership function are presented in Equations (35.a)–(35.c):
${m_h}$
coefficient. The equations of each membership function are presented in Equations (35.a)–(35.c):
 \begin{align} {\mu _{{\rm{NHE}}}}\left( {{e_h},{a_1},{a_2},{a_3},{a_4}} \right) &= \left\{ {\begin{array}{l@{\quad}l}{0} & {if\;{e_h} \lt {a_1}\;\;}\\[5pt] {\dfrac{{{e_h} - {a_1}}}{{{a_2} - {a_1}}}} & {if\;{a_1} \le {e_h} \le {a_2}}\\[10pt] {1} & {if\;{a_2} \le {e_h} \le {a_3}\;}\\[5pt] {\dfrac{{{a_4} - {e_h}}}{{{a_4} - {a_3}}}} & {if\;{a_3} \le {e_h} \le {a_4}}\\[10pt] {0} & {if\;{e_h} \lt {a_4}} \end{array}} \right.\\[-10pt]\nonumber\end{align}
 \begin{align} {\mu _{{\rm{ME}}}}\left( {{e_h},{b_1},{b_2},{b_3}} \right) &= \left\{ {\begin{array}{l@{\quad}l}0 {}& {if\;{e_h} \lt {b_1}}\\[5pt] {\dfrac{{{e_h} - {b_1}}}{{{b_2} - {b_1}}}\;} & {}{if\;{b_1} \le {e_h} \le {b_2}}\\[10pt] {\dfrac{{{b_3} - {e_h}}}{{{b_3} - {b_2}}}} & {}{if\;{b_2} \le {e_h} \le {b_3}}\\[10pt] 0 & {}{if\;{e_h} \gt {b_3}}\end{array}} \right.\\[-10pt]\nonumber\end{align}
 \begin{align} {\mu _{{\rm{PHE}}}}\left( {{e_h},{c_1},{c_2},{c_3},{c_4}} \right) &= \left\{ {\begin{array}{l@{\quad}l}{0} & {if\;{e_h} \lt {c_1}\;\;}\\[5pt] {\dfrac{{{e_h} - {c_1}}}{{{c_2} - {c_1}}}} & {if\;{c_1} \le {e_h} \le {c_2}}\\[5pt] {1} & {if\;{c_2} \le {e_h} \le {c_3}\;\;}\\[5pt] {\dfrac{{{c_4} - {e_h}}}{{{c_4} - {c_3}}}} & {if\;{c_3} \le {e_h} \le {c_4}}\\[5pt] {0} & {if\;{e_h} \gt {c_4}}\end{array}} \right.\end{align}
The parameters values selected for each membership function are presented in Table 5.
Parameter values of the membership functions in the transition algorithm

Block diagram of the developed autopilot system.

The values of ${h_{trans}}$
were calculated in accordance with the variations of
${h_{trans}}$
were calculated in accordance with the variations of $V{S_{ref}}$
, as shown in Equation (34). After fuzzifying the altitude tracking error
$V{S_{ref}}$
, as shown in Equation (34). After fuzzifying the altitude tracking error ${e_h}$
using the membership functions in Equations (35.a) to (35.c), the fuzzy rules should be defined to specify the relationship between the input and the outputs in this FLS. These fuzzy rules were proposed using a single input
${e_h}$
using the membership functions in Equations (35.a) to (35.c), the fuzzy rules should be defined to specify the relationship between the input and the outputs in this FLS. These fuzzy rules were proposed using a single input ${e_h}$
and multiple outputs such as
${e_h}$
and multiple outputs such as ${m_{vs}}$
and
${m_{vs}}$
and ${m_h}$
. Applying each linguistic variables shown by NHE, ME and PHE, we defined two combined IF-THEN fuzzy rules, as follows:
${m_h}$
. Applying each linguistic variables shown by NHE, ME and PHE, we defined two combined IF-THEN fuzzy rules, as follows:
-
• Rule 1. IF
${\boldsymbol{{e}}_\boldsymbol{{h}}}$
is NHE OR
${\boldsymbol{{e}}_\boldsymbol{{h}}}$
is PHE THEN
${\boldsymbol{{m}}_{\boldsymbol{{vs}}}}$
is Activated
-
• Rule 2. IF
${\boldsymbol{{e}}_\boldsymbol{{h}}}$
is ME AND NOT
${\bf{NHE}}$
OR IF
${\boldsymbol{{e}}_\boldsymbol{{h}}}$
is
$\boldsymbol{{ME}}$
AND NOT
${\bf{PHE}}$
THEN
${\boldsymbol{{m}}_\boldsymbol{{h}}}$
is Activated


Typically, in an FLS, the operator AND is implemented by the $min$
function, and NOT is a complement operator that can be expressed by
$min$
function, and NOT is a complement operator that can be expressed by $1 - \mu $
. The relationship between the antecedent (IF-part) and the consequent (THEN-part) parts was aggregated using the OR operator implemented by the
$1 - \mu $
. The relationship between the antecedent (IF-part) and the consequent (THEN-part) parts was aggregated using the OR operator implemented by the $max$
function [Reference Wang55]. Therefore, the rules 1 and 2, given above, were defined as shown in Equations (36) and (37):
$max$
function [Reference Wang55]. Therefore, the rules 1 and 2, given above, were defined as shown in Equations (36) and (37):
 \begin{align}{m_{vs}} = \max \left[ {\min \left( {{\mu _{NHE}},1} \right),\min \left( {{\mu _{PHE}},1} \right)} \right]\end{align}
 \begin{align}{m_h} = max\left[ {\min \left( {{\mu _{{\rm{ME}}}},1 - {\mu _{NHE}}} \right),min\left( {{\mu _{{\rm{ME}}}},1 - {\mu _{PHE}}} \right)} \right]\end{align}
By using this algorithm, at each time, one of the coefficients ${m_{vs}}$
and
${m_{vs}}$
and ${m_h}$
will be active with values between 0 and 1. Hence, the final control law
${m_h}$
will be active with values between 0 and 1. Hence, the final control law ${u_{AT}}$
was developed for the autopilot system with Equation (38), using the values obtained from Equations (36) and (37) for each
${u_{AT}}$
was developed for the autopilot system with Equation (38), using the values obtained from Equations (36) and (37) for each ${m_{vs}}$
and
${m_{vs}}$
and ${m_h}$
, respectively:
${m_h}$
, respectively:
 \begin{align}{u_{AT}} = {m_{vs}}{g_{vs}}{u_{vs}} + {m_h}{g_h}{u_h}\end{align}
where ${g_{vs}}$
,
${g_{vs}}$
, ${g_h} \gt 0$
.
${g_h} \gt 0$
.
Figure 5 illustrates the main architecture of the developed autopilot system in this article, where $_{AT}$
acts as the reference pitch rate signal given to the pitch rate controller in the inner loop. The pitch rate controller was designed by using a new T1AFSMC methodology, developed by researchers at LARCASE and published in Hosseini et al. [Reference Hosseini, Ghazi and Botez46].
$_{AT}$
acts as the reference pitch rate signal given to the pitch rate controller in the inner loop. The pitch rate controller was designed by using a new T1AFSMC methodology, developed by researchers at LARCASE and published in Hosseini et al. [Reference Hosseini, Ghazi and Botez46].
3.0 Results
This section presents the experimental results obtained from a high-fidelity nonlinear simulation platform developed for the CCX aircraft, as well as comprehensive analysis using the methodologies proposed in this article for the design of the autopilot system. This platform was initialised using the parameter ranges given in Table 6 to generate a total of 925 different flight conditions, covering the entire flight envelope of the CCX. It is important to note that the values shown in each row of Table 6 do not represent any combinations of altitude, CAS, Weight and Xcg. Rather, they define the overall range of each parameter. The 925 flight conditions were generated by iteratively combining parameter values in (Altitude-CAS) and (Weight-Xcg) pairs, without implying that each altitude corresponds to a single or fixed CAS, Weight or Xcg value.
Parameters for selecting 925 flight conditions

The pitch rate control system in the inner loop of this autopilot system was designed using the T1AFSMC presented in Hosseini et al. [Reference Hosseini, Ghazi and Botez46], whose parameters are given in Table 7.
Parameters of the pitch rate control system (T1AFSMC)

In addition, the other parameters values in the proposed autopilot control laws, given in Equations (21), (29) and (38) are shown in Table 8.
Design parameters of the autopilot control laws

It should be stated that all hyperparameters, gains and design parameters were carefully and experimentally selected to ensure the performance of the autopilot system across all flight conditions with and without turbulence.
The validation of proposed methodologies in this article starts with the simulation results obtained for approximators proposed in Section 2.2. As previously described, two MFRNNs were used to approximate the aircraft dynamics in both VS and AH mode, without any prior knowledge of the aircraft model or its subsystems.
The variations of approximated dynamics vs the true signals in VS hold mode for 19 random flight conditions at different flight levels.

Figures 6 and 7 illustrate the variations of the approximated dynamics functions with respect to the true signals, which were defined as ${F_{vs}} = \dot VS$
for the VS mode, and
${F_{vs}} = \dot VS$
for the VS mode, and ${F_h} = \dot h$
for the AH mode.
${F_h} = \dot h$
for the AH mode.
The variations of approximated dynamics vs the true signals in altitude hold mode for 19 random flight conditions at different flight levels.

These results were obtained for 19 random flight conditions at different altitudes, showing very good dynamics approximations with a minimum number of measured inputs to be integrated into the design of autopilot systems.
To achieve our first control objective, which is to satisfy the tracking performance of both autopilot modes in ideal flight conditions (without turbulence), the following flight scenario was considered:
-
i. VS mode control: In this mode, the desired vertical speed was set to 9 m/s (
$ \approx $
1800 ft/min) to specify the rate of climb (ROC). -
ii. We equalised the desired altitude
${h_{ref}}\;$
to
${h_{trim}} + 1000$
meters (
$ \approx $
3280 ft), where
${h_{trim}}$
is the aircraft initial altitude at the beginning of simulation which varies at each flight condition. In this scenario, the aircraft started climbing at the commanded vertical speed. As soon as the aircraft arrived at a specified altitude (
${h_{ref\;}} \pm {h_{trans}}$
), the transition algorithm automatically engaged the AH mode to capture and maintain the desired altitude
${h_{ref}}$
. -
iii. After 500 secs, we set the desired rate of descent was set to 5 m/s (
$ \approx $
1000 ft/min) and then the desired altitude
${h_{ref}}$
was changed to
${h_{trim}} + 300$
meters (
$ \approx $
984 ft), meaning that the aircraft descended by 700 meters (
$ \approx 2296\;$
ft) with respect to the previous reference altitude
${h_{ref}}$
in the climb manoeuvre.


The results obtained for the scenario described above are shown in Figs. 8 to 13. For the VS mode, we have chosen the climbing rate at 9 m/s ( $ \approx $
1800 ft/min). This rate was immediately increased to reach the desired vertical speed. Once the aircraft reached the desired climbing rate, it maintained the desired vertical speed until it reached a distance
$ \approx $
1800 ft/min). This rate was immediately increased to reach the desired vertical speed. Once the aircraft reached the desired climbing rate, it maintained the desired vertical speed until it reached a distance ${h_{trans}}$
from the desired altitude that was calculated using Equation (34). At this point, the VS mode control system was deactivated (the VS signal returned to zero). During the climb, the VS mode remained engaged until
${h_{trans}}$
from the desired altitude that was calculated using Equation (34). At this point, the VS mode control system was deactivated (the VS signal returned to zero). During the climb, the VS mode remained engaged until $t = 106$
sec, and then it was reactivated between
$t = 106$
sec, and then it was reactivated between $t = 500$
sec and
$t = 500$
sec and $t = 638$
sec for the descent manoeuvre. The AH mode was engaged outside of these periods during the simulation. As shown in Figs. 8 and 9, at
$t = 638$
sec for the descent manoeuvre. The AH mode was engaged outside of these periods during the simulation. As shown in Figs. 8 and 9, at $t = 500$
sec, a descent command was issued, making the AH mode inactive, and the VS started to decrease to 5 m/s (
$t = 500$
sec, a descent command was issued, making the AH mode inactive, and the VS started to decrease to 5 m/s ( $ \approx $
1000 ft/min). As the aircraft achieved the desired descent rate, it remained within an interval of
$ \approx $
1000 ft/min). As the aircraft achieved the desired descent rate, it remained within an interval of ${h_{ref\;}}{}_ - ^ + \;{h_{trans}}$
, where the AH mode was activated. Figures 8 and 9 represent the results for the time variations of the aircraft vertical speed, and the aircraft altitude for flight conditions with altitudes (a) 8000, 10000 and 15000 ft, (b) 20000, 25000 and 30000 ft and (c) 35000, 38000 and 42000 ft.
${h_{ref\;}}{}_ - ^ + \;{h_{trans}}$
, where the AH mode was activated. Figures 8 and 9 represent the results for the time variations of the aircraft vertical speed, and the aircraft altitude for flight conditions with altitudes (a) 8000, 10000 and 15000 ft, (b) 20000, 25000 and 30000 ft and (c) 35000, 38000 and 42000 ft.
VS time variations at the altitudes (a) 8000 to 15000 ft, (b) 20000 to 30000 ft and (c) 35000 to 42000 ft in ideal flight conditions (no turbulence) across 925 flight conditions (coloured lines).

Altitude time variations at altitudes (a) 8000 to 15000 ft, (b) 20000 to 30000 ft and (c) 35000-to 42000 ft in ideal flight conditions (no turbulence) across 925 flight conditions (coloured lines).

The initial altitude values at each flight condition were different; therefore, for the sake of clarity in the presentation of our results, we superimposed all altitude signals to start from zero in Fig. 9. In addition, Fig. 9 shows the variations of aircraft altitude according to the performance of the VS mode and the AH mode controllers. The dashed blue lines in Fig. 9 depict the altitude range ( ${h_{ref\;}}{}_ - ^ + \;{h_{trans}})$
where the AH mode was engaged (between the blue lines); outside of this range, the VS mode control system became engaged. Figure 9 clearly shows how the width of the region varied with respect to the variations of the
${h_{ref\;}}{}_ - ^ + \;{h_{trans}})$
where the AH mode was engaged (between the blue lines); outside of this range, the VS mode control system became engaged. Figure 9 clearly shows how the width of the region varied with respect to the variations of the $V{S_{ref}}$
.
$V{S_{ref}}$
.
The results in Figs. 8 and 9 demonstrate the excellent performance of the proposed autopilot system under ideal flight conditions, with no oscillations or overshoots. The variations of the altitude signal also showed that the aircraft successfully captured the commanded altitude ${h_{ref\;}}$
using the proposed controllers, and that it was adequately stabilised at the altitude reference signal over the time. A detailed analysis of these results is presented in Fig. 10 to illustrate the performance of the fuzzy logic-based transition algorithm described in Section 2.4.
${h_{ref\;}}$
using the proposed controllers, and that it was adequately stabilised at the altitude reference signal over the time. A detailed analysis of these results is presented in Fig. 10 to illustrate the performance of the fuzzy logic-based transition algorithm described in Section 2.4.
T variations of the coefficients ${{\rm{m}}_{{\rm{vs}}}}$
and
${{\rm{m}}_{{\rm{vs}}}}$
and ${{\rm{m}}_{\rm{h}}}$
((a.1) and (b.2), respectively), and of the signals; (a.2)
${{\rm{m}}_{\rm{h}}}$
((a.1) and (b.2), respectively), and of the signals; (a.2) ${{\rm{m}}_{{\rm{vs}}}}{{\rm{u}}_{{\rm{vs}}}}$
and (b.2)
${{\rm{m}}_{{\rm{vs}}}}{{\rm{u}}_{{\rm{vs}}}}$
and (b.2) ${{\rm{m}}_{\rm{h}}}{{\rm{u}}_{\rm{h}}}$
, without turbulence across 925 flight conditions (coloured lines).
${{\rm{m}}_{\rm{h}}}{{\rm{u}}_{\rm{h}}}$
, without turbulence across 925 flight conditions (coloured lines).

The procedure implemented by the proposed fuzzy logic-based transition algorithm is illustrated in Fig. 10(a.1), showing the variations of the ${m_{vs}}$
, while Fig. 10(a.2) illustrates the controller output (
${m_{vs}}$
, while Fig. 10(a.2) illustrates the controller output ( ${m_{vs}}{u_{vs}}$
) for the VS mode control system. The variations for the AH control system are shown in Figs. 10(b.1) and 10(b.2). In these figures, when the VS mode controller or the AH mode controller is engaged,
${m_{vs}}{u_{vs}}$
) for the VS mode control system. The variations for the AH control system are shown in Figs. 10(b.1) and 10(b.2). In these figures, when the VS mode controller or the AH mode controller is engaged, ${m_{vs}}$
and
${m_{vs}}$
and ${m_h}$
, respectively, are equal to 1, and when they are not engaged, they decrease to 0. Due to the abrupt variations of
${m_h}$
, respectively, are equal to 1, and when they are not engaged, they decrease to 0. Due to the abrupt variations of ${m_{vs}}$
and
${m_{vs}}$
and ${m_h}$
, there are some spikes on the signals in Fig. 8(a.2), e.g., at
${m_h}$
, there are some spikes on the signals in Fig. 8(a.2), e.g., at $t = 500$
sec, and in Fig. 10(b.2) at
$t = 500$
sec, and in Fig. 10(b.2) at $t = 638$
sec. To smooth out these signals, we used a filter to produce an input that could be easily handled by the pitch rate control system in the inner loop of the proposed autopilot system (see Equation (39)). It should be mentioned that the sum of the control signals
$t = 638$
sec. To smooth out these signals, we used a filter to produce an input that could be easily handled by the pitch rate control system in the inner loop of the proposed autopilot system (see Equation (39)). It should be mentioned that the sum of the control signals ${u_{vs}}$
and
${u_{vs}}$
and ${u_h}$
generated by
${u_h}$
generated by ${u_{AT}} = {q_{ref}}$
, which was calculated in Equation (38), is reference pitch rate signal (deg/s) controlled by the T1AFSMC.
${u_{AT}} = {q_{ref}}$
, which was calculated in Equation (38), is reference pitch rate signal (deg/s) controlled by the T1AFSMC.
 \begin{align}\frac{{{q_{ref}}}}{r} = \frac{{\omega _n^2}}{{{s^2} + 2\xi {\omega _n}s + \omega _n^2}}\end{align}
In Equation (39), ${\omega _n} = 3$
rad/s is the natural frequency and
${\omega _n} = 3$
rad/s is the natural frequency and $\xi = 0.7$
is the damping ratio.
$\xi = 0.7$
is the damping ratio.
Thus, the obtained pitch rate signal used in the inner loop of the autopilot system is presented in Fig. 11, for altitudes 8000, 10000, 15000 and 20000 ft, and for altitudes 25000, 30000, 35000, 38000 and 42000 ft in Fig. 12.
Time variations of the pitch rate reference at the altitudes of 8000, 10000, 15000 and 20000 ft without turbulence across 925 flight conditions (coloured lines).

Time variations of the pitch rate reference at 25000, 30000, 35000, 38000 and 42000 ft without turbulence across 925 flight conditions (coloured lines).

The pitch rate reference signals shown in Figs. 11 and 12 for all 925 flight conditions were zoomed out in Figs. 11 (a.1) to 11(a.4) and Figs. 12(b.1) to 12(b.4) to represent the smoothness of the pitch rate reference signal produced by the filter in Equation (39).
Another goal considered in the design of the autopilot control system was to generate elevator control signals without high-frequency oscillations to avoid mechanical damage to the elevator actuators. This characteristic can be clearly seen in Fig. 13 for the elevator deflections across all 925 flight conditions.
To evaluate the performance of our autopilot system in critical flight conditions and to provide evidence of the validity of our proposed methodologies, further simulations were performed in the presence of the moderate-intensity turbulence ( ${10^{ - 3}})$
during flight.
${10^{ - 3}})$
during flight.
For this purpose, another flight scenario was defined in which the aircraft was climbing to a specific altitude and then maintained that altitude. The results shown in Figs. 14 and 15 indicated that the VS mode controller remained activated until the aircraft reached the transition altitude ${h_{trans}}$
represented by the blue line (used to calculate the distance
${h_{trans}}$
represented by the blue line (used to calculate the distance $\Delta h$
in Equation (34)). At this point, the transition algorithm automatically engaged the AH mode control system to maintain the aircraft at the specified reference altitude, even in the presence of the turbulence effects.
$\Delta h$
in Equation (34)). At this point, the transition algorithm automatically engaged the AH mode control system to maintain the aircraft at the specified reference altitude, even in the presence of the turbulence effects.
Time variations of the elevator deflections without turbulence across 925 flight conditions (coloured lines).

Time variations of the aircraft altitude in turbulent condition across 925 flight conditions (coloured lines).

Time variations of the aircraft vertical speed in turbulent condition across 925 flight conditions (coloured lines).

Time variations of the pitch rate reference across 925 flight conditions (coloured lines) with turbulence.

MAE values at each flight condition for (a) VS mode and (b) AH mode in ideal flight conditions (no turbulence).

Figure 15 also shows that the VS mode control system could track the given VS reference with a small number of oscillations with the least possible amplitudes, which are acceptable in this research (when the VS mode was engaged between $t = 0$
sec and
$t = 0$
sec and $t = 105$
sec). It should be noted that the oscillations after the activation of the AH mode control system, due to the absence of the aircraft VS control system. The oscillations from
$t = 105$
sec). It should be noted that the oscillations after the activation of the AH mode control system, due to the absence of the aircraft VS control system. The oscillations from $t = 105\;$
sec to
$t = 105\;$
sec to $t = 300$
sec on the vertical speed signal were induced by the turbulence which is natural and expected as the VS mode control system is not active to directly dampen these fluctuations. Instead in this period, the AH mode was active in the autopilot system and the aircraft altitude was stabilised and controlled with too small oscillations, as shown in Fig. 14.
$t = 300$
sec on the vertical speed signal were induced by the turbulence which is natural and expected as the VS mode control system is not active to directly dampen these fluctuations. Instead in this period, the AH mode was active in the autopilot system and the aircraft altitude was stabilised and controlled with too small oscillations, as shown in Fig. 14.
Accordingly, the control signal generated by the autopilot, which is the aircraft pitch rate reference used in the inner loop, is shown in Fig. 16. This signal varied within a bounded interval in response to the turbulence. The observed oscillations are expected to result from the turbulence-induced effects on the aircraft vertical speed and altitude.
Previously, we analysed the performance of the aircraft autopilot control systems under both turbulent and non-turbulent conditions and assessed the validity of the results. Furthermore, the performances of the VS and AH controllers were also validated in terms of tracking error values, calculated by mean absolute error (MAE) metric with and without turbulence. Table 9 shows the flight condition numbers related to each altitude range at all 925 flight conditions (FC) that were used in Figs. 17 and 18, to examine the precision and the accuracy of the tracking performance of the autopilot system at different altitudes.
Figure 17(a) presents the MAE values for the VS mode calculated with respect to the time variations of the VS signals in Fig. 8. Similarly, Fig. 17(b) presents the MAE values for the AH mode calculated with respect to the time variations of the altitude signals in Fig. 9. In both figures, the black lines depict the MAE values during the climb manoeuvre, and the red lines show the MAE values for each flight condition range during the descent.
The MAE values shown in Figs. 17(a) and 17(b) demonstrated that the proposed controllers for both autopilot modes have negligible error values under all flight conditions without turbulence, indicating that the aircraft VS and AH controllers could track very well their commanded reference values.
The MAE values presented in Figs. 18(a) and 18(b) provide more details about the results presented in Figs. 14 and 15. The ranges of the MAE values shown in Fig. 18 for both VS and AH modes are acceptable in the presence of moderate intensity ( ${10^{ - 3}})$
turbulence for the scope of this research. In addition, for the VS mode, Fig. 18(a) shows that the developed controller could perform better at higher altitudes than at lower ones, as MAE values decreased as the altitude increased from the first flight condition to the 925th, referring to Table 9.
${10^{ - 3}})$
turbulence for the scope of this research. In addition, for the VS mode, Fig. 18(a) shows that the developed controller could perform better at higher altitudes than at lower ones, as MAE values decreased as the altitude increased from the first flight condition to the 925th, referring to Table 9.
All the results presented in this section confirm the adaptability and real-time applicability of the proposed autopilot system. The PSO algorithm was executed offline over representative flight conditions spanning the entire CCX flight envelope to initialise all MFRNN weights. During the online learning process, only the last-layer weights were updated using a backpropagation algorithm. This hybrid offline-online learning strategy, combined with the MFRNN internal feedback loops enhanced both the adaptability and corrective responses of the autopilot without any additional computational cost. In addition, the Type-1 adaptive fuzzy sliding-mode control system used in the inner loop further improved the overall robustness and stability of the autopilot system. Furthermore, all hyperparameters and controller gains were kept constants for all 925 flight conditions distributed throughout the CCX flight envelope, both in the presence and absence of turbulence. These results demonstrate that the autopilot system is applicable in real-time across all flight conditions of the CCX aircraft. Hence, this validation process supports the reliability of the proposed methodology.
Distribution of flight conditions by altitudes authorised in the CCX flight envelope

MAE values at each flight condition for (a) VS mode and (b) AH mode in turbulent condition.

4.0 Conclusion
This article proposed applying a hybrid control system constructed by use of MFRNNs as approximators for the aircraft dynamics, and a multi-modal sliding mode control system in which each mode was activated using two distinct coefficients. These coefficients values were calculated by a new mode transition algorithm developed based on a fuzzy logic system. This algorithm operated so that when the VS mode was engaged, the AH mode became inactive, and vice versa based on the variations of the altitude tracking error without using a conventional altitude capture mode. As stated earlier, two MFRNNs were developed separately, for approximating the aircraft dynamics in the state-space representations of the VS and AH modes. These approximations were successfully obtained only by using the measured altitude and vertical speed tracking errors and their first-order derivatives even under turbulent flight conditions. These MFRNNs were trained by initialising all weights with the PSO algorithm. Only the weights between the rules layer and the output layer were updated online, using the backpropagation method, while the other weights were fixed at their initialised values. The approximations were obtained without knowledge of the aircraft dynamics mathematics in the state-space representations. The Lyapunov theorem was used to prove the stability and boundedness of each controller. In addition, the results showed that the control systems developed for each autopilot mode could meet the desired tracking performance with negligible tracking errors with and without turbulence. In addition, control systems attenuated the drastic effects of moderate-intensity turbulence across the whole flight envelope of the CCX aircraft. This research can be extended in the future by incorporating adaptive fuzzy rules and adaptive membership functions, both of which offer fast convergence with low computational cost while preserving real-time operation. Additional validation scenarios could also be examined such as engine failure, severe turbulence and wind shear, to further evaluate the reliability and robustness of the autopilot system in different critical operating conditions.
Acknowledgements
This research was performed at the Laboratory of Applied Research in Active Controls, Avionics and AeroServoElasticity (LARCASE). This research was realised and funded within the Canada Research Chair in Aircraft Modeling and Simulation New Technologies. For more information related to this research, please visit the LARCASE website at http://larcase.etsmtl.ca. The research aircraft flight simulator (RAFS) for the CCX aircraft was obtained by Ruxandra Botez, full professor, and thanks to research grants from the Canadian Foundation of Innovation and Ministère du Développement Économique, de l’Innovation et de l’Exportation (MDEIE), as well as from CAE, Inc. The authors would like to thank the CAE, Inc., team and Oscar Carranza Moyao for their support in the development of the RAFS at the LARCASE laboratory. The authors also thank Odette Lacasse at the ETS for her support.


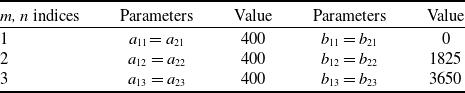
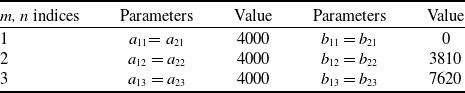





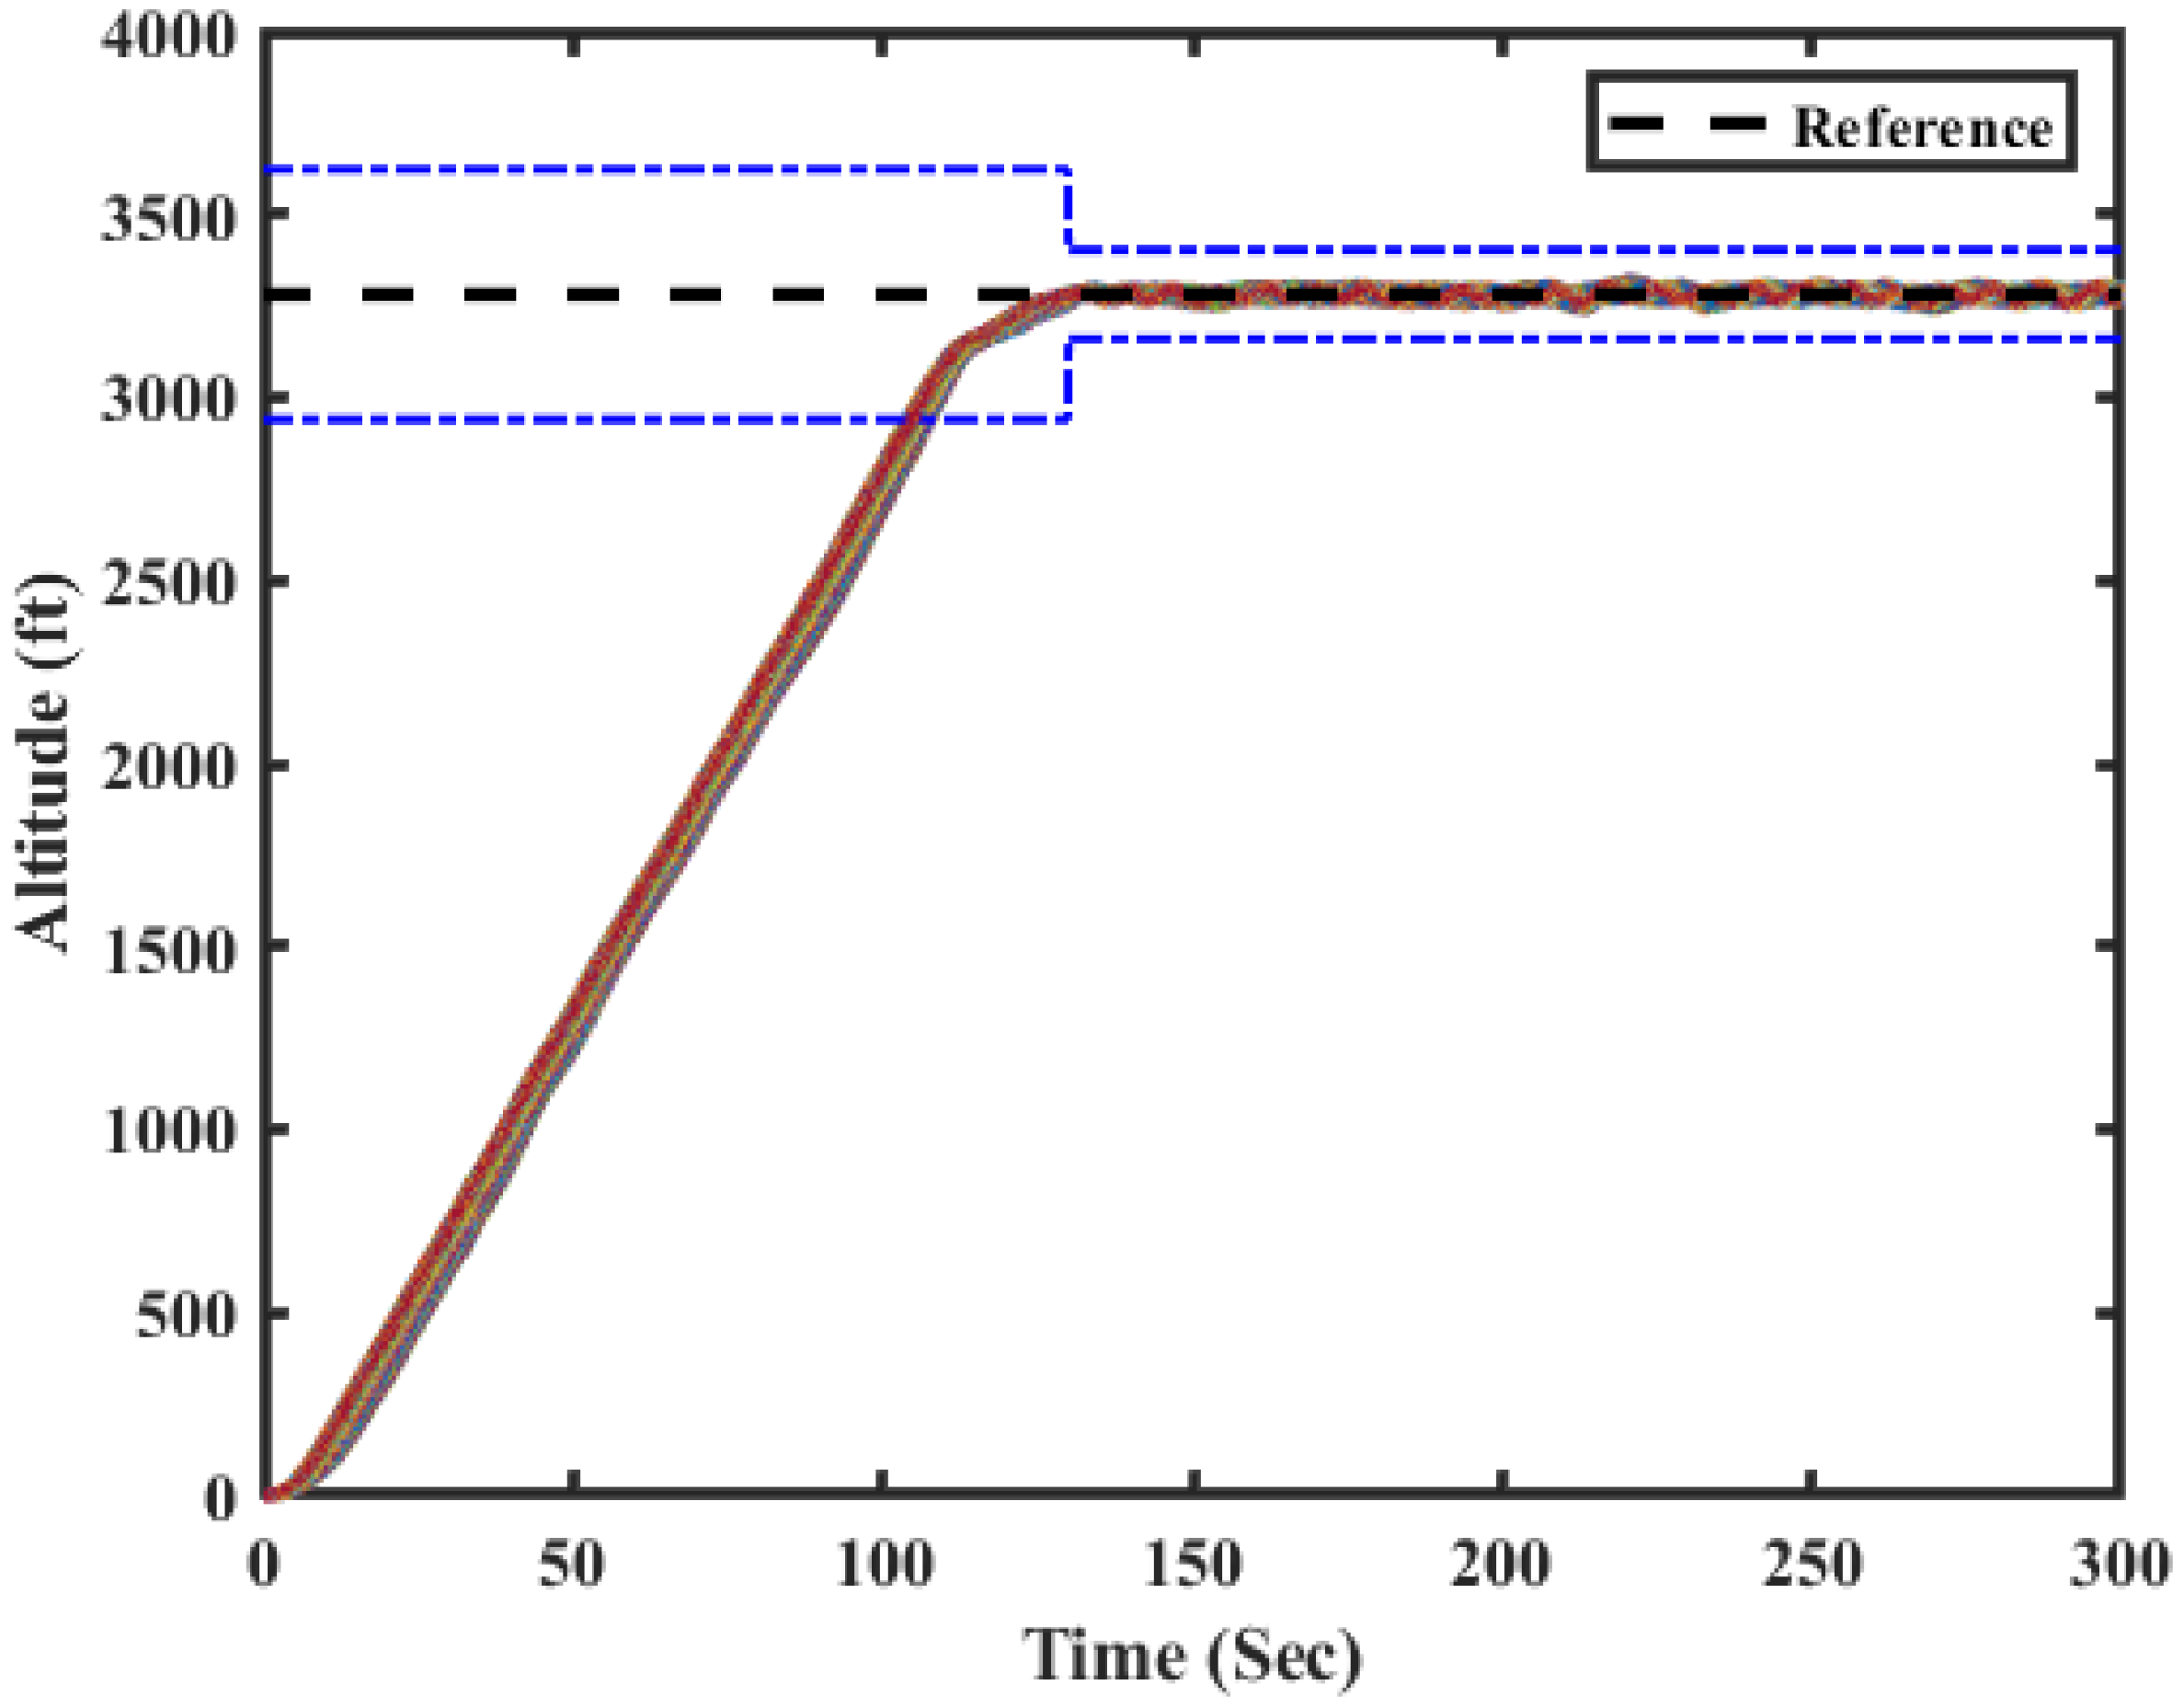


 Open access

