


1. Introduction
The Arctic is warming rapidly, with surface air temperatures increasing twice as fast as the global average (Overland and others, Reference Overland2018). In the Canadian Arctic Archipelago (CAA), which contains 28% by area of global land ice outside of the Greenland and Antarctic ice sheets (Sharp and others, Reference Sharp and Kargel2014), glacier surface temperatures have risen by almost 1°C between 2000 and 2015 (Mortimer and others, Reference Mortimer, Sharp and Wouters2016). Climate models, remote sensing and in situ observations all indicate that Canadian Arctic glaciers are losing mass (e.g. Gardner and others, Reference Gardner2011; Radić and Hock, Reference Radić and Hock2011; Lenaerts and others, Reference Lenaerts2013; Millan and others, Reference Millan, Mouginot and Rignot2017; Box and others, Reference Box2018; Cook and others, Reference Cook2019; Ciracì and others, Reference Ciracì, Velicogna and Swenson2020). Ciracì and others (Reference Ciracì, Velicogna and Swenson2020) reported that the average rate of glacier mass loss in the CAA was 73 ± 9 Gt a−1 over the period 2002–19, the highest in the world outside of the Greenland and Antarctic ice sheets. Radić and Hock (Reference Radić and Hock2011) and Lenaerts and others (Reference Lenaerts2013) predicted that Canadian High Arctic glaciers will be the largest contributors to global sea level rise outside the ice sheets through to the end of the 21st century, with projected total contributions of 2.7 ± 1.2 and 3.5 ± 2.4 cm, respectively, between 2000 and 2100.
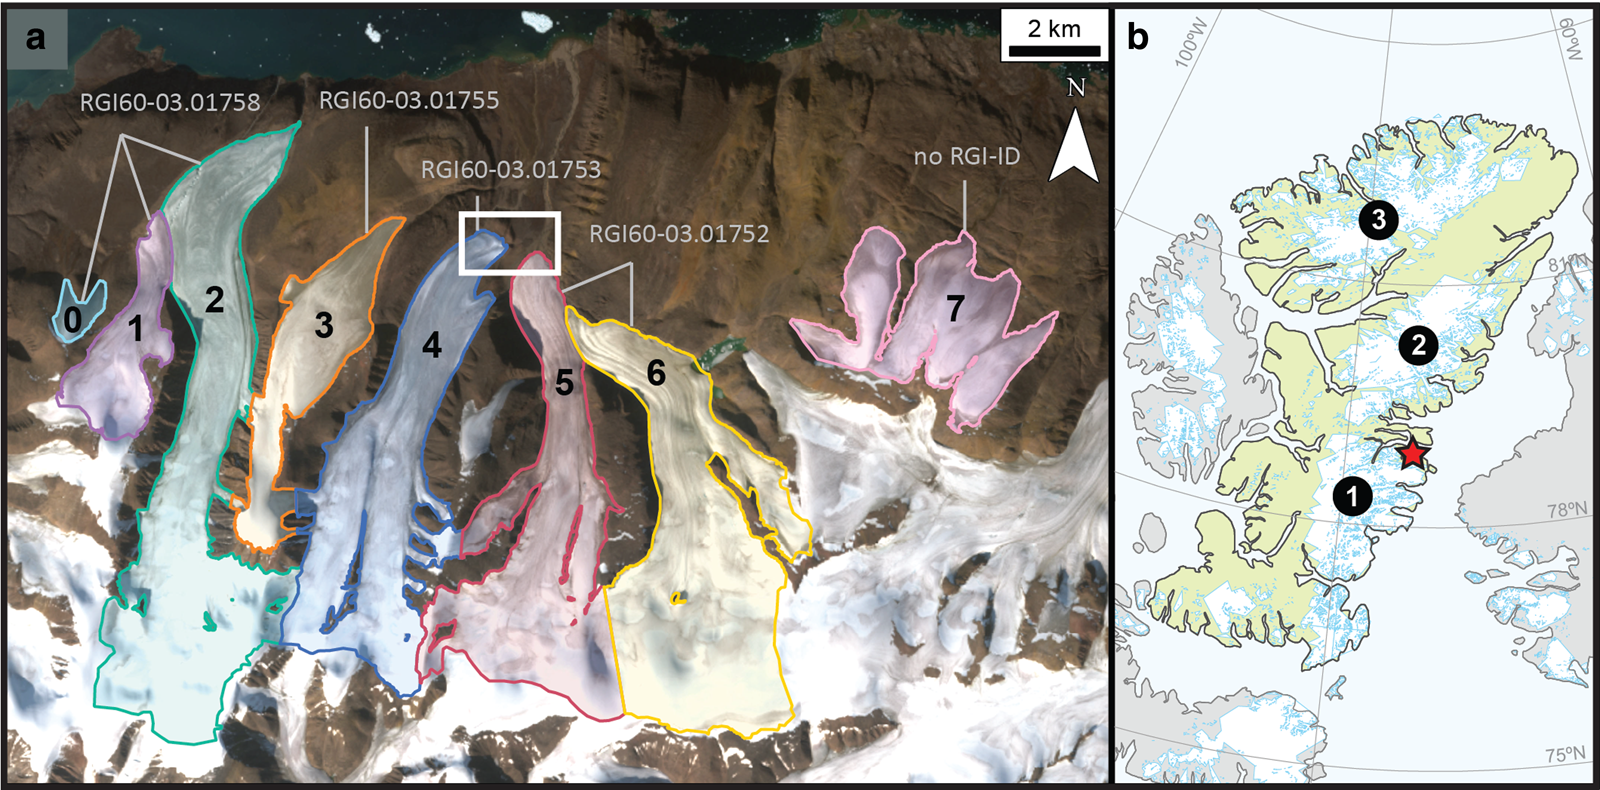
About 70% of ice in the CAA is concentrated in the Queen Elizabeth Islands (QEI). Alexandra Fiord is situated at the northern edge of the Prince of Wales (POW) Icefield on Ellesmere Island, the largest island of the QEI (Fig. 1). Between 1959/60 and 2000/01, Sharp and others (Reference Sharp and Kargel2014) reported that of 125 major outlet glaciers in the QEI, 77% of land-terminating glaciers and 70% of tidewater glaciers retreated. More recently, Cook and others (Reference Cook2019) reported that >94% of 300 tidewater glaciers in the CAA have retreated since 1959, with mean retreat rates in the QEI ~5 times higher in 2009–15 compared to 1959–2001. Studies of recent changes in glacier mass and area have been conducted on Ellesmere Island as a whole (e.g. Wang and others, Reference Wang, Sharp, Rivard, Marshall and Burgess2005; Sharp and others, Reference Sharp2011; Sharp and others, Reference Sharp and Kargel2014), as well as on individual ice caps such as the Northern Ellesmere Icefield (White and Copland, Reference White and Copland2018), Hazen Plateau (Serreze and others, Reference Serreze, Raup, Braun, Hardy and Bradley2017), Agassiz Ice Cap (Williamson and others, Reference Williamson, Sharp, Dowdeswell and Benham2008; Fisher and others, Reference Fisher2012) and the POW Icefield (Kinnard and others, Reference Kinnard2008; Mair and others, Reference Mair2009; Marshall and Sharp, Reference Marshall and Sharp2009). However, comparatively little is known about long-term changes in smaller land-terminating glaciers such as those at Alexandra Fiord.
Study site at Alexandra Fiord. (a) Outlines digitized from the 17 August 2019 Sentinel-2 scene used as the background image. Outline colors are repeated in Figures 5 and 10; white box over glaciers 4 and 5 indicates location of Figure 3a. Glacier numbers referred to in the text are shown in black inside the glacier perimeters. Randolph Glacier Inventory Identification Numbers (RGI-IDs) are listed in gray (note that glaciers 0–2 share one RGI-ID, glaciers 5 and 6 share one RGI-ID, and glacier 7 is not in the RGI database). (b) Ellesmere Island (Statistics Canada, 2011 Census boundary) is highlighted in green, with glacierized areas (Pfeffer and others, Reference Pfeffer2014; RGI Consortium, 2017) in white. Alexandra Fiord is marked with a red star with notable ice bodies indicated: POW Icefield (1), Agassiz Ice Cap (2) and Northern Ellesmere Icefield (3).
Previous studies have documented that the glaciers of Ellesmere Island have responded dramatically to past climate events, including deglaciation in the early Holocene and advance during the Little Ice Age (LIA) (Blake, Reference Blake1981; Bergsma and others, Reference Bergsma, Svoboda and Freedman1984; Fisher and others, Reference Fisher, Koerner and Reeh1995; Koerner and Fisher, Reference Koerner and Fisher2002; Wolken and others, Reference Wolken, England and Dyke2008). The first written documentation of the glaciers at Alexandra Fiord occurred during the Sir George Strong Nares British Arctic Expedition of 1875/76 (Moss, Reference Moss1878; Nares, Reference Nares1878; Markham, Reference Markham1894), which was the first European voyage to successfully navigate the strait (now called Nares Strait) between Ellesmere Island and Greenland. Alexandra Fiord contained a Royal Canadian Mounted Police post in 1953–63 and it was intended for settlement during the High Arctic relocation of 1953–55, although this never occurred there due to difficult sea ice conditions (Marcus, Reference Marcus1991). The site has since been used as a scientific research base, mostly focused on ecological communities (e.g. Bergsma and others, Reference Bergsma, Svoboda and Freedman1984; Svoboda and Freedman, Reference Svoboda and Freedman1994; Rayback and Henry, Reference Rayback and Henry2005; Bjorkman and others, Reference Bjorkman2019).
Here, we use a series of cloud-free end of melt season air photographs and satellite images to quantify length, area, snowline and surface elevation change for eight small land-terminating glaciers at Alexandra Fiord (Fig. 1) from 1959 to 2019. We also investigate historical descriptions and illustrations of two of these glaciers from three publications of the British Arctic Expedition of 1875/76 to extend the record of glacier position at Alexandra Fiord back to the end of the LIA.
2. Methods
Our study area comprises a total of eight land-terminating glaciers, which we number from zero (west) to seven (east) (Fig. 1). This includes six outlet glaciers from the POW Icefield (glaciers 1–6) and two independent ice bodies (glaciers 0 and 7). Only glaciers 4 and 5 have an official name, collectively called Twin Glacier. The glaciers range in elevation from 174 to 1440 m above sea level, and are generally north-facing.
2.1. Selection and alignment of imagery
Four black and white 1959 air photos (Table 1), taken at ~30 000 ft with an RC5A camera, were retrieved from the National Air Photo Library of Natural Resources Canada. These were georectified in ArcGIS 10.6.1 using a projective transformation with eight well-distributed geographic control points on stationary features used for each photograph, with root mean square errors ranging from 52 to 245 m. The geographic control points were placed on distinctive bedrock features between the glacier termini and the coastline in 0.34 m resolution WorldView-3 images from 27 to 28 June 2019. In the satellite era, we used late summer cloud-free Landsat Collection 1 Level-1 Precision and Terrain Corrected (L1TP) images, and Level-1C orthorectified Sentinel-2 images (Table 1). All Landsat and Sentinel-2 images show good correspondence in the location of bedrock features between scenes, so no additional georectification or orthorectification was performed.
Details of images used to determine glacier area, terminus and snowline measurements

RCAF, Royal Canadian Air Force.
Asterisk indicates that the image was used only in snowline analysis.
We also quantified historical ice extents from trimlines, identifiable in satellite images and in the field as abrupt transitions between depauperate light-colored terrain and darker terrain. Trimlines form as glaciers retreat from their most recent maximum extent and release previously scoured terrain, although they fade over time as the fresh bedrock is weathered and repopulated with new growth. The most recent widespread glacial advance in the CAA occurred during the LIA, starting in ~1500–1600 (e.g. Sharp and others, Reference Sharp and Kargel2014) and ending in ~1850–1900 (e.g. Barry and Hall-McKim, Reference Barry and Hall-McKim2019). The trimlines at Alexandra Fiord have been described by previous workers and are believed to represent LIA ice extent (e.g. Bergsma and others, Reference Bergsma, Svoboda and Freedman1984; Wolken and others, Reference Wolken, England and Dyke2005). Notably, Bergsma and others (Reference Bergsma, Svoboda and Freedman1984) report radiocarbon ages for well-preserved plants in the release zone of Twin Glacier (Fig. 2d), providing broad constraints on the timing of the onset of LIA glacial advance at Alexandra Fiord and corroborating the interpretation of trimlines as indicative of later LIA extent. Historical illustrations from the British Arctic Expedition of 1875/76 are the only direct record of glacier position at Alexandra Fiord near the end of the LIA and depict Twin Glacier at or very near the location of modern day trimlines (Figs 2a–c). While climate model outputs indicate that low surface air temperatures may have persisted at Alexandra Fiord through to the early 1900s, we choose to primarily report early post-LIA rates in reference to 1875 as these are the latest direct observations associating LIA extent with the trimlines and align with other estimates of the end of the LIA in this region. Rates of change calculated using the 1875 approximation are likely minimum estimates because it is unknown for how long after 1875 the glaciers remained at their maximum extent.
(a) August 1875 illustration of glacial erratic with glaciers 4 and 5 (Twin Glacier) in the background, from Moss (Reference Moss1878). (b) Photograph of glaciers 4 and 5 showing the same glacial erratic, 23 July 2018. (c) Photograph of glaciers 4, 5 and 6, 30 July 2018. Yellow lines indicate trimline position. Exposure increased using Adobe Photoshop CC 2020 to improve visibility of the trimlines. (d) Photograph of preserved pre-LIA arctic heather exposed near the proglacial zone of glacier 5, 26 July 2018. Lens cap for scale (76 mm in diameter).

2.2. Area measurements
To quantify historical changes in glacier area and terminus position, ice outlines were traced from the air photographs and satellite imagery. For the 1959 air photographs and early satellite images without a shortwave infrared band (Landsat 1–3) we manually digitized the glacier outlines. For more recent images (Landsat 7 and 8, Sentinel-2) we used the normalized difference snow index (Hall and others, Reference Hall, Riggs and Salomonson1995) to automatically delineate glacier outlines, which were then manually corrected to remove artifacts resulting from features such as seasonal snow cover (Paul and others, Reference Paul2013) and shadows. The ice divides in the accumulation zone of the glaciers from all years followed those of the Randolph Glacier Inventory (RGI) version 6.0 (Pfeffer and others, Reference Pfeffer2014; RGI Consortium, 2017) to ensure consistency through time. When boundaries between glaciers in the ablation zone did not exist in the RGI, as was the case for glaciers 1 and 2 and glaciers 5 and 6, we drew new divisions at approximated basin boundaries to demarcate these glaciers. This was also done for glaciers 0 and 1 during the time when they were connected in 1959 and earlier in the satellite era.
2.3. Terminus measurements
We used the box method (Moon and Joughin, Reference Moon and Joughin2008) to calculate the change in terminus length from 1974 to 2019 for all glaciers except for glaciers 1 and 6, whose termini intersect the margins of other glaciers (Fig. 1). We drew boxes at the terminus of each glacier wide enough to quantify retreat parallel to flow, but also narrow enough to exclude marginal retreat. Boxes were long enough to capture the most advanced and retreated terminus positions to ensure that the same boxes could be used for each glacier over the entire study period. For each year we derived mean terminus length by dividing the area of the glacier within the box by the width of the box (Moon and Joughin, Reference Moon and Joughin2008; McNabb and Hock, Reference McNabb and Hock2014). This was converted to relative change in terminus position by calculating the difference in length relative to 1974.
To delineate LIA maximum ice extent we traced the trimlines on the 17 August 2019 Sentinel-2 image for all glaciers where they were readily discernible (glaciers 2–5). Trimline position did not appear to change appreciably between satellite observations, so this scene was chosen as it contained the clearest and highest resolution image of the trimlines with minimal interference from shadows. Use of a satellite scene to trace the trimlines as opposed to the georectified 1959 air photos maximizes the comparability of trimline observations to the other glacier outlines also derived from satellite images. We also visually referenced landmarks in color field photographs (e.g. Fig. 2c) from summer 2018 to confirm that the trimlines traced from the Sentinel-2 scene were reasonably placed for glaciers 2, 4 and 5. We assume that all of the area bounded by the trimlines and the boxes was glaciated, and apply the box method as described above to derive terminus length at the LIA extent.
2.4. Snowline measurements
We use measurements of snowlines as a proxy for equilibrium line altitude (ELA). This assumes that the end-of-summer snowline is equivalent to the ELA, but this does not take into account superimposed ice that can occur on Arctic glaciers below the snowline and add mass to the glacier. Casey and Kelly (Reference Casey and Kelly2010) studied this in detail for Devon Ice Cap, and showed that the superimposed ice zone varied considerably in extent from one year to the next. They concluded that it could not be reliably determined from optical or SAR remote-sensing imagery. However, they argued that the location of the end-of-summer snowline still provides the best estimate of the ELA, with changes in the remote-sensing-derived ELA comparing favorably to measured (in situ) changes in the ELA. We therefore believe that it provides the best available estimate of the ELA in our study area given the lack of field measurements.
We selected late summer satellite imagery with the least snow cover at the highest temporal resolution possible, as snowline typically undergoes greater interannual variability than overall glacier area. For each year that a visual boundary between snow-covered and snow-free ice was readily discernible on at least three of the eight glaciers, three authors manually traced the snowline. Based on the availability of imagery meeting these requirements, we achieved 2–3 year resolution snowlines from 1974 to 1982 and annual resolution from 2014 to 2019. We then intersected the lines with a summer 2012 mosaic of 2 m resolution ArcticDEM strips (henceforth ‘2012 ArcticDEM’; downloaded from the Polar Geospatial Center, University of Minnesota) to extract the elevation of each author's snowlines. We summarize the snowline elevation by year, averaging the snowlines for all glaciers drawn by all digitizers for that year. We do not account for thinning of the glaciers through time, as we do not have elevation change observations with low uncertainty prior to 2001. The snowline elevations should therefore be viewed as minimum values before 2012, and maximum values after.
We also report the accumulation area ratio (AAR) for each glacier in all years when we had both snowline and glacier area measurements. Although snowlines were not digitized for every glacier on a given year, we used the mean snowline elevation for that year to split the glacier polygons into the accumulation zone (above mean snowline elevation) and the ablation zone (below mean snowline elevation). The AAR was then calculated as the fraction of the total glacier area contained within the accumulation zone polygon.
2.5. Elevation change
To determine glacier surface elevation change, we acquired ASTER and WorldView DEMs from 2001 to 2018 to create a time series stack. We then derived the linear elevation change trend across each pixel using pygeotools software from Shean and others (Reference Shean2016). We created DEMs from ASTER Level 1A stereo imagery from 2001 to 2018 (Table S1) downloaded from NASA's Earthdata website (earthdata.nasa.gov). We processed the data at 30 m resolution using MicMac ASTER (Girod and others, Reference Girod, Kääb, McNabb and Galland2017) on Compute Canada's Cedar high performance computing cluster. We downloaded WorldView DEM strips from 2012 to 2018 (Table S1) from the Polar Geospatial Center at the University of Minnesota, and downsampled the original 2 m resolution data to 8 m to make processing possible with a smaller file size and remove some noise without significantly impacting the results. Both ASTER and WorldView DEMs were coregistered to the ArcticDEM using the methods of Nuth and Kääb (Reference Nuth and Kääb2011) in DEM coreg written by Shean and others (Reference Shean2016). They were then filtered to remove cloud observations, and coregistered again using the remaining pixels, before deriving linear elevation change trends across each pixel. We extracted mean rates of change for each glacier within our digitized outlines from the 21 July 2001 Landsat 7 image (Table 1), as these outlines represent the maximum extent of the glaciers during our time series analysis and therefore capture elevation changes around the receding glacier margins.
We also used the elevation of the LIA trimlines along the glacier sidewalls to obtain an average rate of elevation change in the 126 years between the 1875 observations of Nares (Reference Nares1878), Moss (Reference Moss1878) and Markham (Reference Markham1894), and when our high-resolution DEM analysis started in 2001. Because trimlines indicate the past maximum extent of glaciers, we used them to quantify the vertical distance to the modern glacier surface to obtain a minimum measurement of ice thickness loss. Trimlines are most clearly visible on bedrock ridges adjacent to glaciers 2 and 4, so we focused our analysis on a ~2.7 km segment of the eastern margin of glacier 2 (originating ~1.4 km up-glacier from the 2001 terminus), and a ~2.1 km segment of the western margin of glacier 4 (originating ~0.8 km up-glacier from the 2001 terminus). To define the corresponding segment of the 2001 glacier outline for comparison, we connected the trimline endpoints to the 2001 glacier centerline at a perpendicular angle, and took the points of intersection with the glacier outline to be the endpoints for the corresponding 2001 segment. The portion of the 2001 glacier outline between the two endpoints was then manually smoothed, as the zigzag shape of the outline resulting from the pixel-based digitization tends to underestimate elevation. We then intersected the 1875 trimlines and the parallel sections of the 2001 glacier outlines with the 2012 ArcticDEM to extract the elevation of both lines.
2.6. Error analysis
To assess the significance of our results, we computed the errors associated with our methods. We distinguish between accuracy, which relates to the correct positioning of features in geographic coordinate space, and precision, which relates to the ability to replicate the same measurement. Precision is generally the most important source of uncertainty in this study, as it affects the comparability of glacier measurements across years, but we assess both types of error below.
In relation to the accuracy of our imagery, we observe excellent correspondence of bedrock position across all Landsat and Sentinel-2 scenes. The alignment of the 1959 air photos to bedrock in WorldView-3 is poorest in the accumulation zone due to lack of usable geographic control points in that area, but we achieve good matches along the glacier margins and around the termini. These offsets likely have very little effect on the area measurements, but given the difficulty in precisely quantifying the quality of the match to bedrock for the more sensitive terminus length measurements, we do not report terminus position in 1959.
To quantify the accuracy of the glacier outlines derived from these images, which we use to perform the area and terminus measurements, we made comparisons between the automated outlines of glaciers 4 and 5 from the 21 August 2018 Sentinel-2 image and in situ observations made on 26–27 July 2018 (for glacier 5) and 1 August 2018 (for glacier 4) using a Trimble R8s dual frequency GPS (dGPS) unit. A nearby base station located on bedrock was used to correct the dGPS data, with horizontal positions considered to be accurate to within 10 cm. Using survey points collected every few meters by the dGPS, the terminus of glacier 4 was surveyed for a total of 768 m and glacier 5 for a total of 565 m. Overall, the in situ dGPS measurements agreed well with the automated 2018 outline, but were consistently down valley of the satellite-derived glacier position (Fig. 3a). Based on the rates that we report in this study, these glaciers are expected to have retreated by <1 m in the several weeks between our dGPS measurements and the Sentinel-2 scene used for outline digitization, which is a negligible component of the total offset we observed. For glacier 4, 14.3% (110/768 m) of the dGPS track fell within 10 m (1 pixel) of the glacier outline and 95.3% (732/768 m) fell within 20 m (2 pixels) of it. Only 4.7% (36/768 m) of the dGPS track fell outside the 2 pixel margin, with a maximum distance of ~22 m from the outline. For glacier 5, 40.4% (229/565 m) of the dGPS track fell within 10 m of the glacier outline and 96.7% (547/565 m) of the dGPS track fell within 20 m of it. Only 3.2% of the line (18/565 m) fell outside the 2 pixel margin, also by a maximum of ~22 m. This shows our absolute accuracy in satellite-derived glacier position to be within ~20 m, which is better than the 30–60 m pixel resolution of the Landsat data used in this study (Table 1).
Close-up nadir views of Twin Glacier. (a) Comparison of 26–27 July and 1 August 2018 GPS tracks with automated 21 August 2018 outlines (bolded in black), around which a 20 m margin of error (2 pixels) is shown in gray. The portions of the GPS tracks within 10 m (1 pixel) of the automated outline are in yellow, those within 20 m (2 pixels) are in green, and those outside 20 m are in red. (b) 1959–2019 outlines at approximately decadal resolution with the trimline representing the 1875 (LIA) extent. Base image: Sentinel-2, 21 August 2018.

The precision of our glacier outlines is controlled by the pixel resolution of the satellite imagery. We used an automated pixel-based approach to draw glacier outlines since 2001 (with manual correction where necessary), and thus assume that the precision of our results is ±0.5 pixel, at which point the digitizer cannot distinguish the glacier from surrounding bedrock. Maximum estimates for these errors were attained by calculating the area around the ice margins that may have been either: (a) not glacierized, but included in our outlines (an overestimation of 0.5 pixel), or (b) actually glacierized, but not included in our outlines (an underestimation of 0.5 pixel). To do this, we first rasterized the outlines for each year at the pixel size corresponding to the original image resolution (Table 1) and counted the number of pixels comprising each glacier's outline. To find the total pixel area, we multiplied the pixel count by the corresponding image resolution. This was divided by two to yield the ±0.5 pixel errors (Table 2). These methods are consistent with Haritashya and others (Reference Haritashya2018).
Changes in ice area and terminus position at Alexandra Fiord from 1875 to 2019

All errors represent a ±0.5 pixel threshold. Errors for total glacier area were propagated by summation in quadrature. Errors for average terminus position are the average of errors from all glaciers.
To constrain the precision of the glacier outlines created with manual digitization, we compared manual outlines for 2001 to the results of the semi-automated approach. The manual outlines both overestimated and underestimated glacier area compared to the automated outlines, with underestimation being more common. However, the total difference in glacier area between the two digitization methods was always smaller than the area of uncertainty calculated using the pixel-based approach for the automated outlines, ranging from <1% to 56.4% of the ±0.5 pixel area. Based on these results, we conclude that the ±0.5 pixel error can be used as a conservative estimate of precision uncertainty for manually drawn outlines as well as semi-automated ones. Importantly, this pixel-based precision estimate is readily reproducible and less time- and labor-intensive than having multiple individuals trace the glacier outlines.
To determine the uncertainty in our snowline elevations, we calculated 2 SD (2σ) of the elevation from the three digitizers' lines for each glacier in our study region. This number was always larger than the 2 m resolution of the 2012 ArcticDEM, and is therefore more reflective of the error in our measurements. The maximum difference in annual mean elevation estimates between digitizers ranged from 13 m (1982) to 73 m (1976), which indicates good reproducibility between digitizers.
To determine the uncertainty in our analysis of 2001–18 surface elevation changes, we averaged elevation change values for the bedrock areas between the glaciers and the coast to the north of our study area. These areas of stable bedrock should not have substantially changed during our study period. The average elevation change for stable ground was 0.06 m a−1, which we assume to be our uncertainty in deriving the elevation change trend using DEM analysis. We also report 2σ values for each glacier's mean elevation change, which are an indicator of the magnitude of spatial variability in elevation change within each glacier's perimeter.
The most important source of uncertainty in deriving rates of loss between 1875 and 2001 is establishing correspondence between the trimlines and the 2001 glacier margins. To constrain the effects of possible misplacement of the 2001 outline segments, we replicated the intersection and smoothing procedure while offsetting the endpoints either upvalley or downvalley by the magnitude of the horizontal uncertainty reported in Table 2 (49 m for glacier 2 and 51 m for glacier 4). The difference in mean elevation estimates from upvalley and downvalley translation was 8.3 m (0.07 m a−1) for glacier 2 and 7.1 m (0.06 m a−1) for glacier 4. As these are larger than the 2 m resolution of the 2012 ArcticDEM, we take these rates to be a more conservative estimate of error. The 2σ values for the mean trimline and 2001 outline segment elevations are not taken as indicators of error in our measurements, as they mainly reflect the southerly increase in elevation of the terrain along the roughly north-south trending lines, and are thus artificially large.
3. Results
3.1. Area change
The total ice area among the eight glaciers in our study region was 133.99 ± 0.28 km2 in 1959, compared to 118.22 ± 0.59 km2 in 2019 (Figs 4, 5a, Table 2). This is a total area loss of 15.77 ± 0.65 km2 (11.77 ± 0.49%) over 60 years, or an average of 0.26 ± 0.01 km2 a−1. The rates of change for 1959–2001 and 2001–19 were 0.19 ± 0.04 and 0.44 ± 0.10 km2 a−1, respectively. The loss in area over 60 years was widely variable between glaciers (Table 2), with glacier 6 seeing the least absolute reduction in area at 0.34 ± 0.25 km2 and glacier 7 seeing the greatest at 6.09 ± 0.22 km2. Relative to their original size, glacier 6 also saw the lowest percent reduction in area (1.32 ± 0.99%), while glacier 7 saw the second highest (34.27 ± 1.22%). Glacier 0, the smallest glacier studied, lost 0.92 ± 0.04 km2 of ice, or 51.12 ± 2.01% of its original area.
Ice extent at Alexandra Fiord from 1959 to 2019 at approximately decadal resolution. Base image: Sentinel-2, 17 August 2019.

3.2. Terminus position
For all glaciers, the 2019 terminus position was the furthest upvalley recorded over the study period. The total upvalley migration in terminus position between 1974 and 2019 for glaciers 0–7 (Fig. 5b) ranged from 156 ± 95 m (average of 3.5 ± 2.1 m a−1; glacier 2) to 331 ± 109 m (average of 7.4 ± 2.4 m a−1; glacier 4), with a mean across all glaciers of 226 ± 82 m (Table 2). This represents an average 45-year retreat rate of 5.0 ± 1.8 m a−1 at Alexandra Fiord. The average change in terminus position was within method uncertainty for 1974–2001 and 2013–19. The average rates of retreat were 4.1 ± 2.5 m a−1 for 1974–2010, and 8.9 ± 5.1 m a−1 for 2010–19.
The trimline of glacier 4 was not visible for enough distance along the terminus to use the same boxes for length change calculations as were used for the full outlines (Fig. 3b). The trimlines of glaciers 2 and 3 were down-valley of the 1974 outlines by 134 ± 94 and 154 ± 111 m, respectively. Taking 1875 to be the date for the trimlines, this amounts to a retreat rate between 1875 and 1974 of 1.4 ± 0.9 and 1.5 ± 1.1 m a−1 for glaciers 2 and 3, respectively. The average retreat rates over the period 1974–2019 for glaciers 2 and 3 were ~3 and 5 times greater than the rates over 1875–1974, respectively.
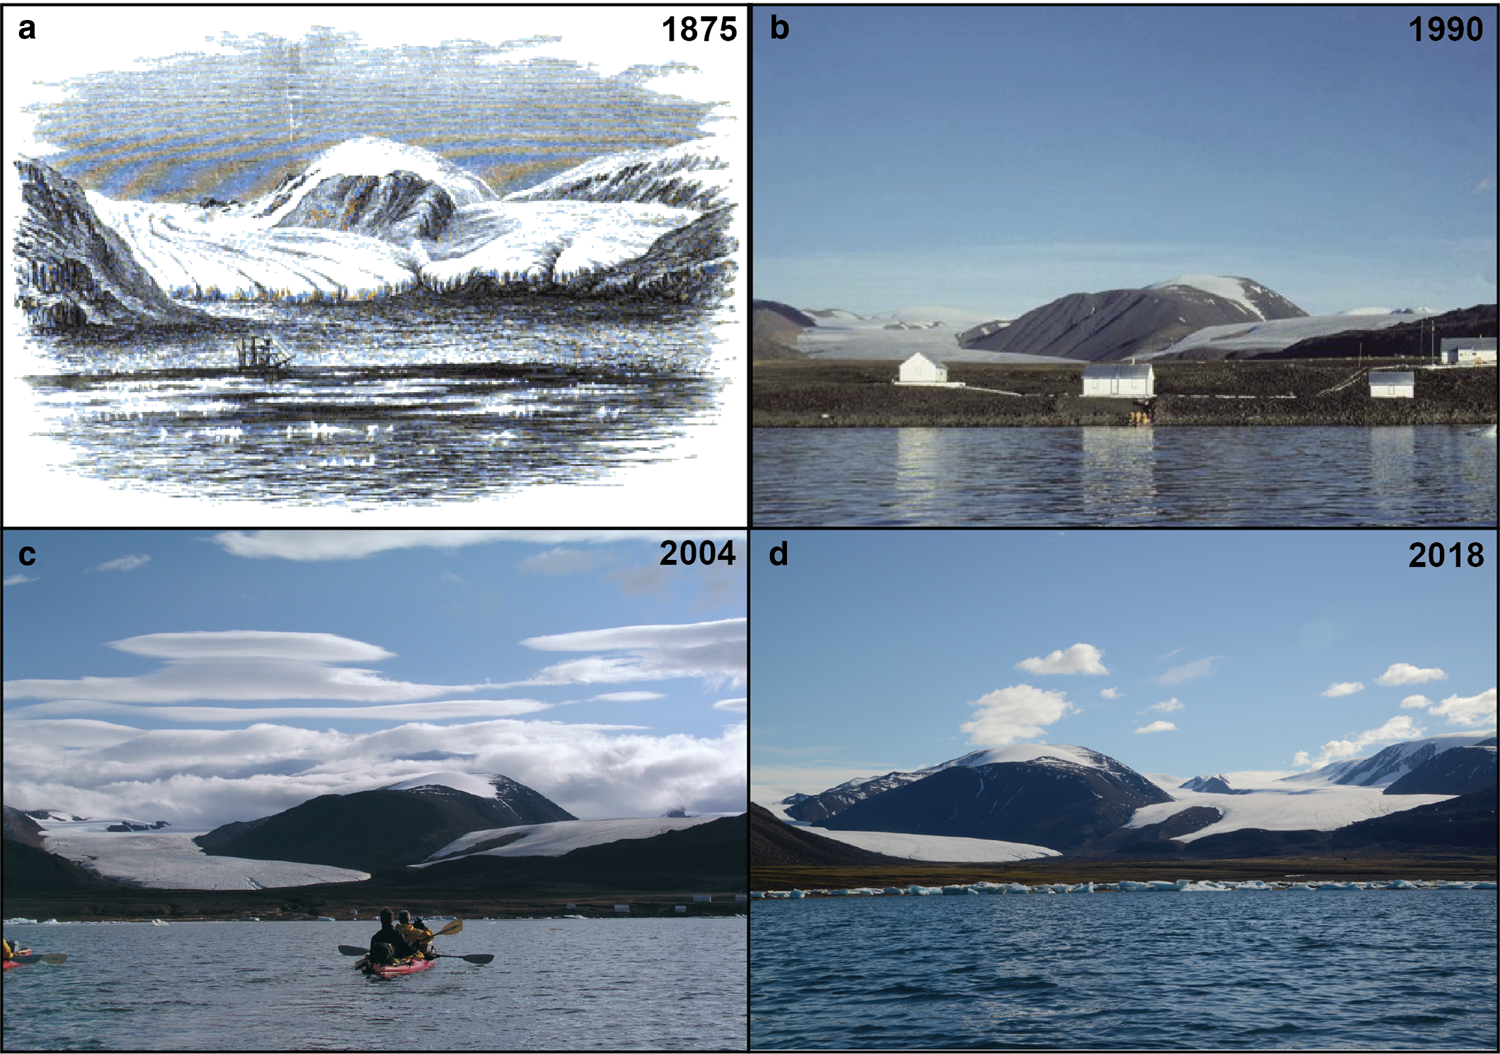
We can make further observations about change at the termini of glaciers 4 and 5 based on comparisons to written descriptions and sketches of Alexandra Fiord made during the British Arctic Expedition of 1875/76, which comprise the first known records of glacier position anywhere on Ellesmere Island. Illustrations from Moss (Reference Moss1878) (Fig. 2a) and Nares (Reference Nares1878) (Fig. 6a) both clearly depict glaciers 4 and 5 in a more advanced position in August of 1875. The fidelity of these illustrations is corroborated in writings by Nares: ‘In the valley off which I had endeavoured to anchor, was found what in these regions may be termed a richly vegetated plain extending about two miles back from the coast, and fronting two valleys each containing a glacier. These glaciers coming from opposite directions about the one against the other, maintaining a constant struggle’ (Nares, Reference Nares1878, p. 67). The expedition's first mate, Albert Hastings Markham also wrote of Twin Glacier: ‘ … we soon found ourselves in a beautiful inlet enclosed by high land, but bounded on one side by one of the grandest sights it is possible to behold: two enormous glaciers coming from different directions, but converging at their termination. They reminded us of two huge giants silently attempting to push and force each other away’ (Markham, Reference Markham1894, p. 60).
In the illustrations of Moss (Reference Moss1878) (Fig. 2a) and Nares (Reference Nares1878) (Fig. 6a), the terminus of glacier 4 also appears to be contiguous, with the ridge now separating the two lobes of the terminus still covered by ice. As glacier 4 thinned, that ridge was exposed and directed the two lobes of the terminus into different drainages (Fig. 3b). This splitting of the terminus occurred sometime between 1875 and 1959, although in the 1959 air photographs both lobes of the glacier 4 terminus were still connected to glacier 5. The 5 August 1979 Landsat 2 image is the first that shows clear separation between the main termini of glaciers 4 and 5, although the eastern lobe of glacier 4 remained connected to glacier 5 until at least 1982. The 21 July 2001 Landsat 7 scene is the earliest satellite image that shows the glaciers fully disconnected at the termini of both lobes, although the photograph in Figure 6b appears to show that they were already separated by 1990.
Not only were the termini more advanced in 1875, they were reportedly of a very different elevation and geometry. Moss (Reference Moss1878), wrote ‘The glacier on the right terminated in a perpendicular cliff seventy feet high’, which can also be seen in his illustration (Fig. 2a) and the Nares (Reference Nares1878) illustration (Fig. 6a). This steep terminus suggests that in 1875, glacier 4 had a positive to neutral mass balance. Based on the 2012 ArcticDEM and 2013 outline, the last 200 m of glacier 4 had a centerline slope of ~11° in 2012. This shallow slope was corroborated by our field observations in 2018 (Figs 2b, c, 6b) and other recent photographs (Figs 6c, d). The loss of this ice cliff further indicates that the mass balance of glacier 4 has become increasingly negative over time.
3.3. Snowlines
The snowline elevation in 2019 was the highest recorded in this study (Figs 5c, 7). Between 1974 and 2019, the total increase in snowline elevation was 360 ± 84 m (Table 3), which amounts to ~8 ± 2 m a−1. Snowline elevation showed more interannual variability and an overall higher average value in 2014–19 (702 ± 69 m, 2σ), compared to 1974–82 (626 ± 48 m, 2σ) (Fig. 5c). The earliest AARs recorded in 1974 ranged from 0.71 (glacier 4) to 0.90 (glacier 3) and remained similar through 2016 (Table 3). For all glaciers, the 2019 AAR was the lowest ever recorded, with both glaciers 0 and 7 reaching an AAR of 0 (the entire glacier was in the ablation zone), and all other glaciers dropping below an AAR of 0.5 (ranging from 0.22 for glacier 4 to 0.47 for glacier 2).
Area, length and snowline elevation change from 1959 to 2019. (a) Glacier area change with error bars showing ±0.5 pixel uncertainties reported in Table 2. (b) Terminus position change relative to 1974 with error bars showing ±0.5 pixel uncertainties reported in Table 2. (c) Snowline elevation averaged by year with error bars showing 2 SD as reported in Table 2.

Comparison of long-term position and thickness change for Twin Glacier (glacier 4 on right, glacier 5 on left; cf. Fig. 2). (a) Sketch from 4 August 1875 (Nares, Reference Nares1878). (b) Photo from summer 1990, including RCMP post at Alexandra Fiord, NU (©Nick Newbery photo archives, Nunavut Archives Program). (c) Photo from 17 August 2004 (©Luciano Napolitano, http://www.travel-tour-guide.com). (d) Photo from 25 July 2018. Panels (b) and (c) have been adjusted for brightness, contrast and color balance using Adobe Photoshop CC 2020 to improve visibility of the glaciers.
Mean snowlines at Alexandra Fiord from 1974 to 2019. Snowlines for each year are drawn as single contours from the 2012 Arctic DEM at the mean elevations reported in Table 4. Contours are not shown for years when the entire glacier area was above the snowline. 2019 glacier outlines shown in black. Base image: Sentinel-2, 17 August 2019.

Temporal variability in snowline elevation and AAR from 1974 to 2019

All errors represent 2 SD of the average.
3.4. Elevation change
The average rate of change in ice surface elevation between 2001 and 2018 was −0.60 ± 0.3 m a−1 (2σ; Fig. 8). We observed the highest average loss rates on glaciers 5 and 6, of 0.74 ± 0.06 m a−1 (2σ = 0.91 m a−1) and 0.78 ± 0.06 m a−1 (2σ = 0.90 m a−1), respectively (Table 4). The highest rate of loss occurred at lower elevations, and the rate of loss tended to decrease up-glacier, reaching close to zero or even positive values in some high elevation areas (Fig. 8). Of all the glaciers, glaciers 0, 5 and 6 underwent the most uniform and high rates of loss over most of their area (Fig. 8). Using an ice area of 126.20 ± 1.71 km2 in 2001, and assuming an ice density of 850 kg m−3 (Huss, Reference Huss2013), we derive a total mass loss of 1.1 ± 0.37 Gt from 2001 to 2018 for the eight glaciers studied at Alexandra Fiord.
Rate of change in surface elevation at Alexandra Fiord from 2001 to 2018. 2001 glacier outlines are shown in black. The area averaged for stable ground reported in Table 4 is delineated in yellow. Glacierized ground not considered in this study is hachured. Base image: Landsat-7, 21 July 2001.

Ice surface elevation changes between 1875 and 2018

Errors for 1875–2001 represent error in rate of change based on the horizontal uncertainty of the 2001 outline. Errors for 2001–18 represent 2 SD of the average.
For glacier 2, the average elevation of the trimline segment was 492 m (2σ = 151 m), and the corresponding smoothed 2001 glacier margin adjacent to the trimline was 469 m (2σ = 141 m). This amounts to an elevation loss of 0.19 ± 0.07 m a−1 between 1875 and 2001, which is about one-third of the rate recorded for 2001–18 by DEM analysis (0.48 ± 0.06 m a−1, 2σ = 0.90 m a−1). For glacier 4, the average elevation of the trimline segment was 461 m (2σ = 83 m), and the corresponding segment of the 2001 outline was 425 m (2σ = 93 m). This amounts to an elevation loss of 0.29 ± 0.06 m a−1 between 1875 and 2001, which is less than half the rate recorded for 2001–18 by DEM analysis (0.64 ± 0.06 m a−1, 2σ = 0.81 m a−1).
4. Discussion
To evaluate our results in the context of historical climate, we reference the CMIP5 RCP4.5 multi-model ensemble average from Climate Reanalyzer (climatereanalyzer.org, Climate Change Institute, University of Maine, USA) for a point location covering Alexandra Fiord. This averages mean annual surface air temperature reconstructions from 42 model outputs under a mid-level warming scenario. Although these are model results and not instrumental observations, they allow us to extend a record of temperature change back to 1861 using multiple climate models and other observations in this region where no local observations are available. The earliest portion of this record (Fig. 9) shows fairly uniform low temperatures through ~1915, with a mean of −19.8 ± 0.4°C (2σ). This is followed by an increase in surface air temperature through ~1976, after which point the mean annual surface air temperature begins increasing at a higher but steady rate. The mean air temperature reported for 2019 was −17.2°C.
Mean annual surface air temperature reconstructions at Alexandra Fiord. Data downloaded from Climate Reanalyzer (climatereanalyzer.org, Climate Change Institute, University of Maine, USA) and originally derived from CMIP5 RCP4.5 multi-model ensemble average.
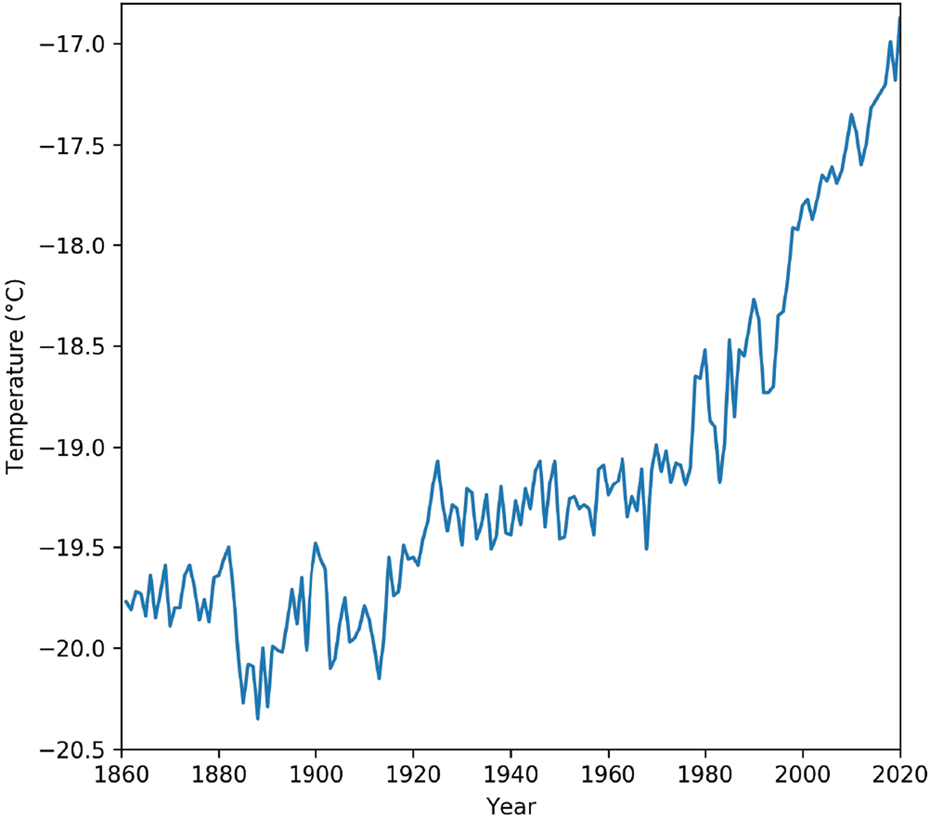
We show that eight glaciers at Alexandra Fiord have lost area, decreased in length, increased in snowline elevation and thinned over the period 1959–2019. The average annual rate of area loss approximately doubled from 1959–82 to 2001–19, which corresponds to substantially warmer mean annual surface air temperatures in the 21st century: in those same time intervals the reconstructed mean annual surface air temperatures were −19.1 ± 0.5°C (2σ) and −17.5 ± 0.5°C (2σ), respectively. Rates of terminus retreat also doubled from 1974–2010 to 2010–19. Both these time intervals saw similar annual rates of increase in air temperature (linear regression lines fit through the annual temperature data both have slopes of +0.05°C a−1), indicating that prolonged steady increases in air temperature can produce accelerating losses of glacier mass. Snowline elevation, while seeing greater interannual variability, shows similar trends to terminus position on the same timescale.
The uniformly low reconstructed surface air temperatures between 1861 and 1915 (Fig. 9) indicate that the 1875 illustrations of the British Arctic Expedition are indeed likely reflective of the maximum LIA extent of the glaciers, although the lack of other specific records of glacier position in this time span creates some ambiguity. As previously noted, the rates of retreat calculated using 1875 should be considered minimum estimates. For example, the estimates of early elevation loss rates for the two glaciers that we analyzed would be ~1.5 times higher if 1915 were taken as the date associated with the trimlines instead of 1875. Analysis of these trimlines reveals that the average rates of elevation loss for these two glaciers in the 17 years between 2001 and 2018 were 1.5–2.5 times higher than their average rate of elevation loss between the end of the LIA and 2001, depending on whether 1915 or 1875 is used as the earliest date.
The response of glaciers elsewhere on Ellesmere Island to rapid warming in the late 20th–21st centuries has been quantified in other studies. Area change of the glaciers at Alexandra Fiord is greater than what has been reported for the glaciers of the POW Icefield as a whole. Sharp and others (Reference Sharp and Kargel2014) reported a mean glacier area change between 1958/1961 and 1999/2001 of −0.9% (n = 39), compared to the observed range of −0.98 ± 3.03% (glacier 2) to −23.43 ± 3.19% (glacier 7) between 1959 and 2001 at Alexandra Fiord. However, in our localized study at Alexandra Fiord, where in 1959 the glaciers ranged in area between 1.81 ± 0.02 and 25.58 ± 0.11 km2, faster retreat is to be expected given that smaller glaciers lose mass more quickly (e.g. White and Copland, Reference White and Copland2018). For glaciers between 10 and 60 km2, Sharp and others (Reference Sharp and Kargel2014) reported an average area loss of 19.3% for the POW Icefield, 6.0% for Agassiz Ice Cap and 21.4% for South Ellesmere. In this size class, all glaciers in our study (except for glacier 7) fell below the POW average area loss. This degree of variability between different ice bodies on Ellesmere Island and ice bodies of different sizes highlights the importance of local studies of glacier area change.
White and Copland (Reference White and Copland2018) quantified the area change of a large number of glaciers of many sizes across the Northern Ellesmere Icefield (location in Fig. 1b) over the period ~1999–2015. For small land-terminating glaciers between 1 and 5 km2 (n = 584), White and Copland (Reference White and Copland2018) reported mean losses of ~1.3% a−1. From 2001 to 2016 we recorded loss at a higher rate of 2.39 ± 0.65% a−1 for glacier 0 (1.49 ± 0.11 km2 in 2001). The average annual area loss for glaciers between 5 and 10 km2 (n = 143) on Northern Ellesmere was ~0.8% a−1. Glacier 1 (6.08 ± 0.27 km2 in 2001) and glacier 3 (9.98 ± 0.43 km2 in 2001) both saw comparable losses of 0.56 ± 0.32 and 0.62 ± 0.32% a−1, respectively. Average annual losses for glaciers between 10 and 100 km2 (n = 216) on Northern Ellesmere was ~0.4% a−1. Glaciers 2 and 4–7 (between 13.60 ± 0.56 km2 for glacier 7 and 27.39 ± 0.83 km2 for glacier 2 in 2001) saw average area losses ranging from 0.20 ± 0.21% a−1 (glacier 2) to 0.89 ± 0.31% a−1 (glacier 7). Overall, the glaciers at Alexandra Fiord appear to be shrinking at a rate similar to other glaciers of comparable sizes on Northern Ellesmere Island since the early 2000s. This is an interesting result as Alexandra Fiord has been described as a polar oasis due to its relatively mild climate (Svoboda and Freedman, Reference Svoboda and Freedman1994).
Among the glaciers at Alexandra Fiord, glaciers 0 and 7 saw the greatest proportion of their original area lost between 1959 and 2019 (51.12 ± 2.01 and 34.26 ± 1.22%, respectively). Their rates of change from 2001 to 2016 were about double what White and Copland (Reference White and Copland2018) report for glaciers of their respective size classes on Northern Ellesmere Island. However, some small ice bodies have been reported to be retreating even faster, as Serreze and others (2017) recorded area reductions of 61–95% over the period 1959–2016 for four small (2.94–7.45 km2) ice caps on the Hazen Plateau, to the north of Agassiz Ice Cap (Fig. 1b).
One factor that can help explain the high rates of area loss for glaciers 0 and 7 is that they are isolated ice masses, so they experienced losses around their entire perimeters. Oerlemans (Reference Oerlemans1986) proposed that the rate of mass loss is sensitively affected by exchange of energy between the glacier and its ice-free surroundings. Their model runs predicted that a larger temperature gradient exists between relatively small glaciers and their surroundings as compared to relatively large glaciers, where marginal ice makes up a smaller fraction of total glacier volume.
Additionally, we calculated the hypsometry of the glaciers in 100 m bins using our 21 July 2001 outlines and a 9 May 2001 ASTER DEM to understand their elevation distribution and the causes of their retreat (Fig. 10). This shows that glaciers 0 and 7 have the largest proportion of their total area at mid-range elevations, and the smallest total ranges in elevation out of the glaciers in this study. In contrast, the glaciers that lost the least percentage of their original area since 1959 (4.35 ± 1.12% for glacier 2; 1.32 ± 0.99% for glacier 6) have the most ice at high elevations and comparatively broad elevation distributions (Fig. 10). As the ELA increases, the AAR for each of the glaciers decreases as more of the glacier area falls within the ablation zone. Even though the other glaciers at Alexandra Fiord extend into lower elevations than the minima for glaciers 0 and 7, they also have more area at higher elevations beyond the maxima for glaciers 0 and 7. Because of the concentration of ice area at mid-range elevations, particularly high ELAs, such as those of 2019, can result in an AAR of 0 for these glaciers while the other glaciers continue to experience some accumulation. This makes these two glaciers extremely vulnerable to future climate change as indicated by the faster rise of ELA coincident with warmer surface air temperatures in the 2010s.
Glacier hypsometry at Alexandra Fiord. Percentage of glacier area within each 100 m elevation band based on 9 May 2001 ASTER DEM and 2001 glacier outlines. Side panel shows the range of elevation bins for each glacier, with a black bar marking the elevation bin containing the largest percent of the glacier's area.

5. Conclusions
Using remote-sensing observations from 1959 to 2019 on eight glaciers at Alexandra Fiord, we find that the annual rate of mass loss approximately doubled between 1959–2001 (0.19 ± 0.04 km2 a−1) and 2001–19 (0.44 ± 0.10 km2 a−1). As a whole, the small glaciers at Alexandra Fiord are losing area faster than the average for the POW Icefield, but the rates are comparable to other glaciers of similar size on Northern Ellesmere Island. Glaciers with a greater fraction of their area at lower elevations have significantly greater rates of area loss as more of their total area falls below the equilibrium line. The ELA for these glaciers has been increasing at an average rate of 8 ± 2 m a−1 since 1974, and in 2019 every glacier had more surface area in the ablation zone than in the accumulation zone. The rate of terminus retreat similarly doubled from 4.1 ± 2.5 m a−1 in 1974–2010 to 8.9 ± 5.1 m a−1 in 2010–19. These findings coincide with historical climate models indicating steadily increasing surface air temperatures over the past several decades.
Analysis of trimlines on two of the glaciers reveal that the rates of terminus retreat between 1974 and 2019 were 3–5 times greater than the rate between the ~1875 LIA maximum and 1974. Between 2001 and 2018, these glaciers saw an average 0.60 ± 0.06 m a−1 decrease in ice surface elevation, amounting to an estimated total loss of 1.1 ± 0.37 Gt. Additional analysis of trimlines from glaciers 2 and 4 reveal that the rates of change between 2001 and 2018 (−0.48 ± 0.06 and −0.64 ± 0.06 m a−1, respectively) were ~2–3 times higher than the rate between ~1875 and 2001 (−0.19 ± 0.07 and −0.29 ± 0.06 m a−1, respectively). The illustrations of Twin Glacier from the British Arctic Expedition of 1875/76 suggest that these glaciers were at or near their LIA maximum extent in 1875, making this a minimum estimate for the end of the LIA at Alexandra Fiord. Comparison of both the written and pictorial descriptions of Twin Glacier with more recent imagery further corroborate the interpretation that the mass balance of these glaciers has become increasingly negative in more recent time.
Supplementary material
The supplementary material for this article can be found at https://doi.org/10.1017/jog.2021.4
Data
The glacier outlines, snowlines and elevation change datasets produced for this study are publicly available in the Polar Data Catalog (CCIN reference number 13205) and can be downloaded from https://www.polardata.ca/pdcsearch/PDCSearch.jsp?doi_id=13205. Other raw data are available upon request to the first author.
Acknowledgements
We thank the University of Ottawa Geographical, Statistical and Government library for acquiring air photographs, and ArcticNet, Natural Sciences and Engineering Research Council of Canada, and University of Ottawa for funding. Summer 2018 fieldwork was sponsored by Susan and John Pohl through the Arctic and Alpine Climate Change Research Experience program of the Dickinson College Department of Earth Sciences. Kendra Bonsey and Madie Ritter assisted with fieldwork, including dGPS measurements of Twin Glacier. Rob Dean assisted with processing of dGPS data. WK was supported by the National Science Foundation Graduate Research Fellowship under Grant No. DGE-1144205 at the University of Maine and is now supported by the NSERC Vanier Graduate Scholarship. WorldView DEMs were provided by the Polar Geospatial Center under NSF-OPP awards 1043681, 1559691 and 1542736. The ASTER DEM production was enabled in part by resources provided by WestGrid and Compute Canada Calcul. We thank the Nick Newbery Photo Archives of the Nunavut Archives Program and Luciano Napolitano for permission to reproduce the images in Figure 6. We thank the scientific editor and two reviewers, whose insight and suggestions improved this manuscript.


 Open access