


1. Introduction
In May 2021, Colonial Pipeline, one of the largest oil pipeline systems in the United States (US), was hit by a ransomware attack and had a shutdown for five days; see Office of Cybersecurity, Energy Security, and Emergency Response (2021). In November 2020, Amazon Web Services, a major cloud service provider that many businesses rely on had a severe outage triggered by an operating system configuration; see Greene (Reference Greene2020). In 2017, Equifax, one of the three largest US credit reporting agencies, experienced a major data breach that exposed the private records of nearly 150 million American citizens; see Equifax (2017). In 2016, a class action was brought against Meta Platforms (formerly known as Facebook) for failing to comply with the Biometric Information Privacy Act in Illinois, and the case was settled for $650 million in 2021; see Holland (Reference Holland2021). These examples illustrate the extraordinary exposure of modern businesses to cyber risk and their possible devastating consequences.
The events listed above represent a wide range of incidents that are considered cyber-related, and they are common in this digital world where business operations rely heavily on data and cyber systems. Cyber insurance products are designed to mitigate the impact of such incidents, offering businesses a means to shield themselves from losses. The insurability of cyber losses is examined in Dacorogna et al. (Reference Dacorogna, Debbabi and Kratz2023), in which their loss expectations are shown to be finite. These cyber insurance products typically cover losses resulting from various perils. As summarized in Romanosky et al. (Reference Romanosky, Ablon, Kuehn and Jones2019), Marotta et al. (Reference Marotta, Martinelli, Nanni, Orlando and Yautsiukhin2017), Woods et al. (Reference Woods, Agrafiotis, Nurse and Creese2017), some cyber insurance policies indemnify losses caused by ransomware, and some policies cover liabilities resulting from data breaches (DB). Indeed, it is common for a single policy to cover losses resulting from various types of cyber incidents.
1.1. Existing form of cyber insurance
To ensure risk exposures are manageable, many cyber insurance policies specify sublimits and separate deductibles for individual coverages. For example, AIG (2019) allows for setting limits and deductibles individually for events such as cyber extortion and computer crime. Romanosky et al. (Reference Romanosky, Ablon, Kuehn and Jones2019) surveyed 67 policies and found many of them use sublimits. In this article, these sublimits and deductibles shall be referred to as incident-specific limits, or simply limits, and incident-specific deductibles or deductibles. Policies that cover multiple cyber perils with incident-specific limits and deductibles are, therefore, called incident-specific cyber insurance policies. The scope of this study, though, does not include the cases in which there is a limit or deductible at the aggregate policy level, which shall be deferred to future research.
Provided that cyber risk is a collective term referring to the risks of multiple types of cyber incidents, and businesses typically demand a risk management strategy that is holistic and, at the same time, can address the subtle differences among various incident types, purchasing an incident-specific cyber insurance policy is then a natural choice for businesses to meet such a need.
Although incident-specific insurance offers advantages to both buyers and sellers, these policy structures make the process of selecting cyber insurance coverage more complex for potential buyers. Given that most companies already have difficulties in determining the appropriate amount of coverage (see Johansmeyer Reference Johansmeyer2021), this problem will only be more of an obstacle that hinders cyber insurance purchases if companies have to impromptu configure the amounts of coverage for individual incident types.
1.2. Related work
Literature on cyber risk modeling often recognizes the distinct risks associated with different types of cyber incidents and rarely considers cyber risk as a singular entity. In Zeller and Scherer (Reference Zeller and Scherer2022), the researchers conducted a survey of cyber risk assessment and modeling techniques and introduced a new marked point process model. This model is based on the understanding that different types of incidents, such as Data Breach, Business Interruption, and Fraud/General, require distinct approaches. In Eling and Wirfs (Reference Eling and Wirfs2019), the authors argued that cyber risks are subcategories of operational risk and used cyber-related data from a database of operational losses to model the loss of four types of cyber incidents, including the ones caused by actions of people, system failure, internal process failure, and external events. In Amin (Reference Amin2017), the author considered the same four categories of cyber risks and used Bayesian networks to model the relationship between risk categories and risk factors. In Ghadge et al. (Reference Ghadge, Weiß, Caldwell and Wilding2019), the authors proposed a different set of incident types for supply chain cyber risk management, including physical threats, breakdown, indirect attacks, direct attacks, and insider threats.
Consistent with prevailing cyber insurance practices and the approach of distinguishing between various types of incidents in risk modeling literature, research on cyber insurance also discusses policies on an incident-specific basis. Braun et al. (Reference Braun, Eling and Jaenicke2023) discusses the transfer of cyber risk by insurers through insurance-linked securities. The feasibility of risk transfer depends on the model risk associated with the cyber peril, and several perils, such as DB and ransomware attacks, are identified as low model risk perils. Awiszus et al. (Reference Awiszus, Knispel, Penner, Svindland, Voß and Weber2023) offer a summary of the literature on cyber insurance pricing based on the premise that cyber risks fall into distinct categories and should be modeled accordingly. From an insurance perspective, Kesan and Zhang (Reference Kesan and Zhang2020a) suggest a cyber peril categorization method based on the magnitude and type of loss triggered by cyber events. Wang (Reference Wang2019) proposes the concept of innovative cyber insurance, which has itemized insurance coverages, that is, separate coverages for different cyber losses, as a key feature. These studies emphasize that cyber risk, while commonly viewed as a collective of several related risks, actually includes numerous subcategories that should be addressed distinctly within insurance practices.
Many studies have examined the differing statistical properties of various cyber perils, which validate the incident-specific design of cyber insurance. However, as previously mentioned, the flexibility of such policies makes it challenging for both buyers and sellers to determine the appropriate indemnity parameters, including incident-specific limits and deductibles. Yet, few have explored how to structure risk sharing between buyers and sellers of incident-specific cyber insurance to accommodate the difference in covered cyber perils.
Moreover, although the differences among various types of cyber risks are widely recognized, the existing studies on cyber insurance pricing rarely touch on the indemnity aspect of policy design. In studies regarding cyber insurance pricing, full coverage or partial coverage with predetermined deductibles or limits is typically assumed.
Antonio et al. (Reference Antonio, Indratno and Saputro2021) propose a Markov-based dynamic model that incorporates the clustering structure of network nodes to assess cyber risk. The premium is determined based on the standard deviation principle under the context of a full transfer of risk. Eling and Jung (Reference Eling and Jung2018) estimate the statistical properties of various types of cyber risks based on real data and models the dependence among them using copula. With the estimated statistics and copulas, the authors further calculated the insurance premiums under the assumption that there is no deductible or limit. A similar effort is made in Eling and Loperfido (Reference Eling and Loperfido2017). With the estimated statistical properties of various types of DB, the authors computed the amounts of premiums to be charged for full coverage based on several premium principles. Xu and Hua (Reference Xu and Hua2019) develop epidemic models for cybersecurity risk assessment for estimating infection probabilities and cost functions. Insurance premiums for full coverage are derived based on both the standard deviation principle and the equivalent utility principle.
Some studies incorporate considerations for partial coverage. Awiszus et al. (Reference Awiszus, Knispel, Penner, Svindland, Voß and Weber2023) offer an overview of various premium principles for pricing idiosyncratic cyber risks based on the statistical properties of claims rather than losses. However, how the choice of indemnities impacts claim sizes is out of the scope. Fahrenwaldt et al. (Reference Fahrenwaldt, Weber and Weske2018) model the spread of cyber threats in a network using an interacting Markov chain and computes expected losses using a mean-field approximation. For insurance pricing, both the cases of full insurance and the existence of a policy limit are discussed, but the policy limit is treated as given. Herath and Herath (Reference Herath and Herath2011) uses copulas to model the dependence between the number of nodes and the loss, which is further used to model the loss distribution. Premiums are determined under the assumption that deductibles and limits are given.
A review of the literature on cyber insurance suggests that most studies focus on the pricing problem with fixed total or partial coverage. Few aim to solve for the optimal amount of coverage. One study in this regard, as an example, is Shetty et al. (Reference Shetty, Schwartz, Felegyhazi, Walrand, Moore, Pym and Ioannidis2010). The authors formulate cyber insurance as a policyholder’s utility maximization problem, wherein the premium is calculated as the expected amount of indemnity. Then, the indemnified amount is derived as a function of the loss when moral hazard is present. The analysis focuses on the conditions required for a cyber insurance market to exist and the impact of cyber insurance on cybersecurity. The heterogeneity among different types of cyber risks and the properties of the indemnity function, however, fall outside the scope of this article.
1.3. Proposed workflow for determining coverage
Provided that incident-specific cyber insurance is a norm in practice but lacks a technical foundation that justifies the determination of coverage amounts, it is in the interests of both insurers and companies, who seek insurance coverage, to make the process of determining incident-specific coverage easy to understand, compatible with the existing underwriting procedures, and mutually beneficial to both parties. To this end, we shall address the aforementioned problem of determining incident-specific coverage from a bilateral perspective.
Drawing inspiration from Asimit et al. (Reference Asimit, Boonen, Chi and Chong2021), which shows that an environment-specific indemnity profile could be Pareto optimal for both the buyer and seller, in this paper, we propose an economically sound workflow that determines the appropriate amount of incident-specific coverage. By doing so, it helps the insured and the insurer reach a Pareto optimality, such that the risk taken by either of the two parties cannot be further reduced without increasing the other’s risk. How such a problem should be formulated and how both parties’ risks are measured are elaborated in Section 2.
The diagram in Figure 1 illustrates this workflow, which consists of three major parts: (I) the incident-specific cyber insurance problem, which serves as the central pillar of this workflow and assigns optimal amounts of risk to the policyholder and the insurer; (II) model inputs, in which severity and incident type can be estimated and statistically learned based on historical cyber incident data and the underwriting process, together with the policyholder’s and insurer’s preferences information for the decision-making part; and (III) the solver for the optimal insurance problem, which can be implemented using either an exact method or an approximated but quick method depending on whether there is a time constraint. The solver produces specifications of the incident-specific insurance coverage, which is the final and desired outcome of this workflow.
Workflow of designing incident-specific cyber insurance coverage.
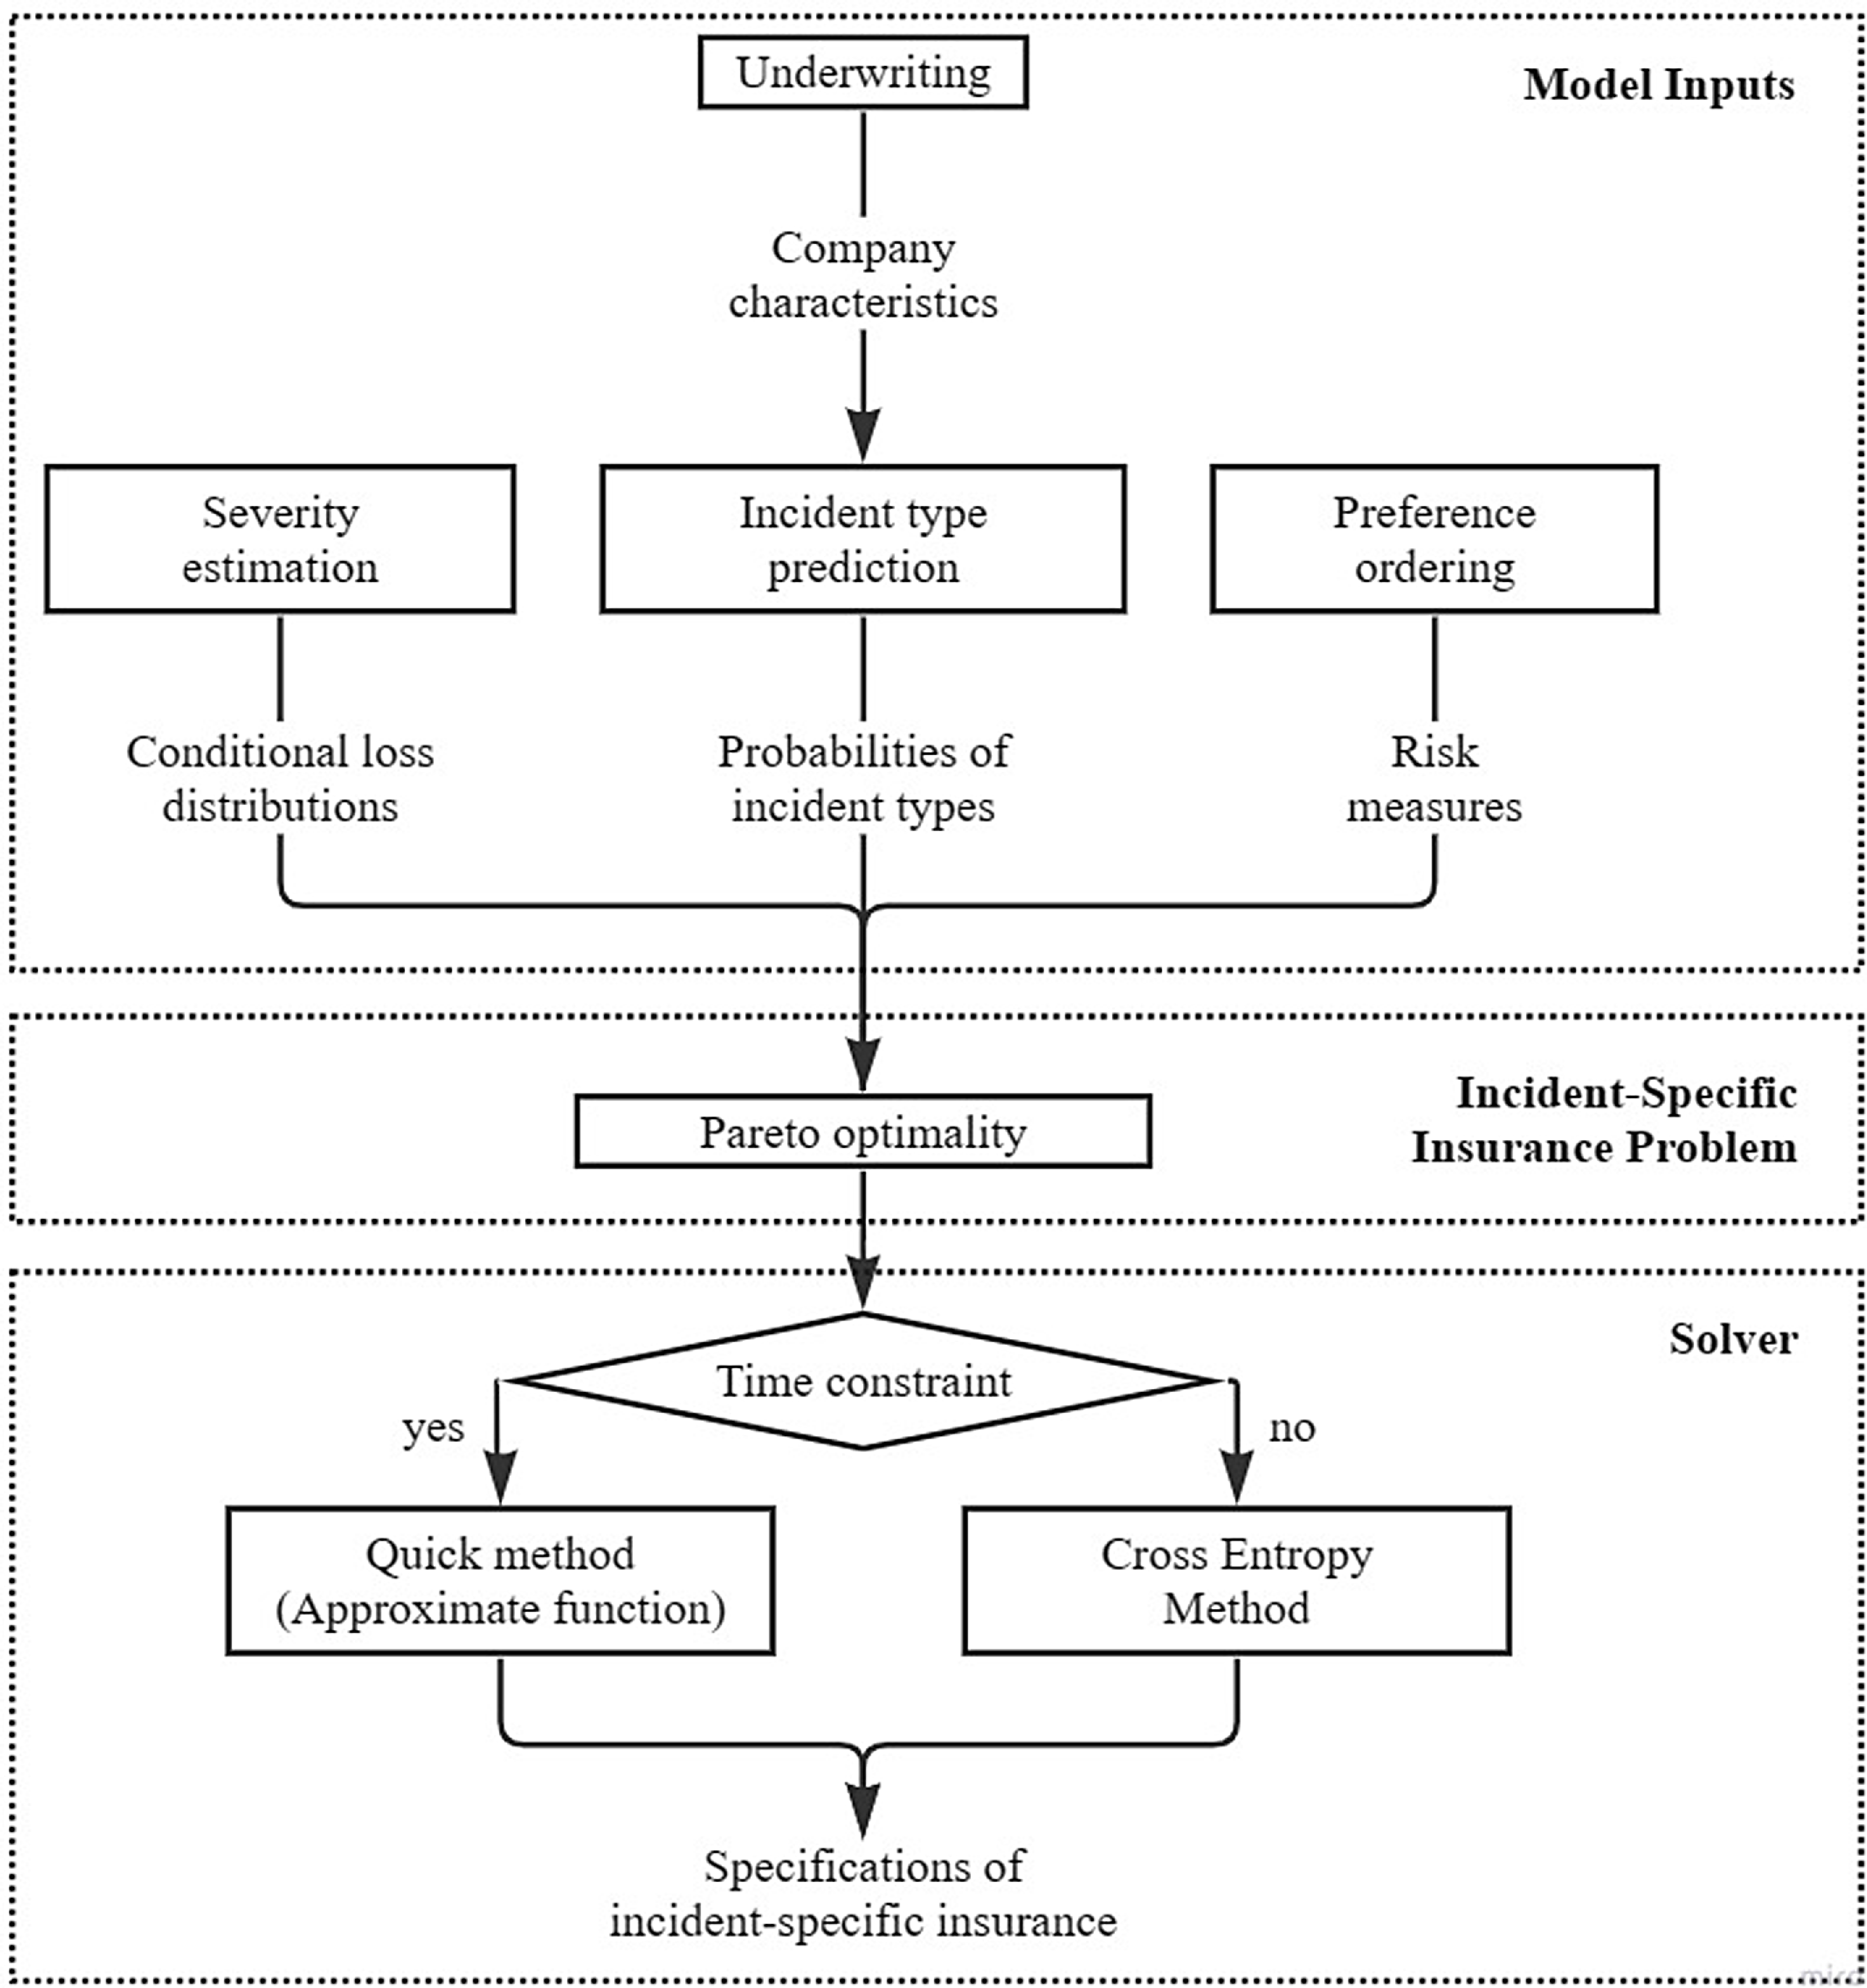
Regarding Part (III), a practical scenario is that the insurer needs to provide a quote and a coverage to a prospective customer on-the-fly. We shall show that using the exact method may result in a long waiting time, and thus the quick method, which generates the results almost instantly, can be a workaround in that situation.
In this article, we shall detail the key components of the proposed workflow for designing incident-specific cyber insurance coverage and then demonstrate it with numerical examples.
1.4. Findings and contributions
First, based on the incident-specific insurance design problem, the cyber insurance contract supplied by the proposed workflow must be reducing the aggregate cyber risk of a company, as an insurance buyer, and the insurer after the risk transfer; the contract must also be mutually beneficial to both the insured and the insurer since a paid premium is less than the buyer’s cyber risk reduction while is able to cover the risk taken by the insurer. However, their aggregate cyber risk reduction is not necessarily effective, in the sense that some insurance buyers might pay more premium than their reduction in the aggregate risk with the insurer; this is indeed observed from the numerical examples presented in Section 5. Second, the proposed workflow is computationally tractable in scenarios that require the specifications of an incident-specific policy to be delivered promptly, such as quick quotes and coverage services, compared to other conventional methods.
Therefore, the contributions of this article are as follows. First, cyber insurance policies commonly cover multiple perils, but the determination of incident-specific coverage amounts lacks justification in practice and literature. The proposed workflow leads to insurance specifications that are justified and economically sound to both the insured and the insurer. Second, the proposed workflow is data-driven and compatible with the existing underwriting procedures. All the data required by this workflow can be obtained from public or proprietary sources by underwriters, which results in no additional work on the frontend. Third, we numerically show that, while the designed incident-specific cyber insurance contract must be rational to both the insured and the insurer, the risk transfer might not be always effective, in the sense that the premium transaction can exceed the reduction in the insured’s and insurer’s aggregate risk by the transfer. Lastly, this article overcomes the possible computational challenges arising from the implementation of such a workflow, making it versatile and adaptable to different scenarios depending on the amount of time permitted to produce results.
The rest of this paper is organized as follows. Section 2 formulates the problem of designing incident-specific cyber insurance as an optimization problem. Section 3 discusses the method and the data that we used to obtain the necessary model inputs. Given the model inputs, Section 4 describes the cross entropy method and how it is used to solve the proposed problem as well as presents and discusses some numerical results. Section 5 presents the use of function approximation to address some computational challenges in the process of solving the optimization problem. We conclude in the last section with discussions of potential applications and future works.
2. Design of incident-specific cyber insurance
2.1. Buyer and seller’s Pareto optimality
Incident-specificity in this study means that, although the insurance product is designed as a package with coverage for a variety of cyber incident types, the coverage for each incident type has its own indemnity function. In addition, a major characteristic of the policy design is that different types of cyber incidents are mutually exclusive, that is, every incident precisely belongs to a unique category. Therefore, the occurrence of one incident would only trigger one and only one corresponding incident-specific coverage. This point will be further illustrated with real data in later sections. Then, the problem of interest in this study is how to determine the incident-specific indemnity functions.
To formulate this problem, let $(\Omega,\mathbb{F})$
be a measurable space, let
$(\Omega,\mathbb{F})$
be a measurable space, let $\mathbb{P}$
be a probability measure on
$\mathbb{P}$
be a probability measure on $(\Omega,\mathbb{F})$
, and let
$(\Omega,\mathbb{F})$
, and let $\mathcal{K}=\left\{1,2,\ldots,K\right\}$
be the set of indices of insurable incident types with cardinality K. For a cyber incident of any type, denote the random variable of the realized nonnegative loss as
$\mathcal{K}=\left\{1,2,\ldots,K\right\}$
be the set of indices of insurable incident types with cardinality K. For a cyber incident of any type, denote the random variable of the realized nonnegative loss as $(X)\mathbb{I}_{\{O=k\}}$
, where X is the loss resulting from a particular cyber event and the indicator function
$(X)\mathbb{I}_{\{O=k\}}$
, where X is the loss resulting from a particular cyber event and the indicator function $\mathbb{I}_{\{O=k\}}$
takes the value of 1 if the Occurred incident type O is k, for some
$\mathbb{I}_{\{O=k\}}$
takes the value of 1 if the Occurred incident type O is k, for some $k \in \mathcal{K}$
, and takes the value of 0 otherwise. Furthermore, let
$k \in \mathcal{K}$
, and takes the value of 0 otherwise. Furthermore, let $I_k$
be the incident-specific Indemnity function, for incident type
$I_k$
be the incident-specific Indemnity function, for incident type $k\in\mathcal{K}$
; that is, the insurance buyer receives
$k\in\mathcal{K}$
; that is, the insurance buyer receives $I_k(X)\mathbb{I}_{\{O=k\}}$
after an incident. The amount of loss Retained by the buyer is
$I_k(X)\mathbb{I}_{\{O=k\}}$
after an incident. The amount of loss Retained by the buyer is $R_k(X)\mathbb{I}_{\{O=k\}} = (X)\mathbb{I}_{\{O=k\}} - I_k(X)\mathbb{I}_{\{O=k\}}$
, which could be nonzero in the scenario that an incident-specific indemnity does not fully cover the corresponding loss.
$R_k(X)\mathbb{I}_{\{O=k\}} = (X)\mathbb{I}_{\{O=k\}} - I_k(X)\mathbb{I}_{\{O=k\}}$
, which could be nonzero in the scenario that an incident-specific indemnity does not fully cover the corresponding loss.
The price to acquire such an incident-specific insurance policy is paid by the buyer via a single premium $\pi$
. From the buyer’s perspective, the total loss at the end of the policy period is,
$\pi$
. From the buyer’s perspective, the total loss at the end of the policy period is, $\pi+\sum_{k=1}^K R_k(X)\mathbb{I}_{\{O=k\}}$
, where the summation is the result of the mutual exclusivity of incident types. The risk-sharing counterparty, that is, the seller, correspondingly bears the risk of value
$\pi+\sum_{k=1}^K R_k(X)\mathbb{I}_{\{O=k\}}$
, where the summation is the result of the mutual exclusivity of incident types. The risk-sharing counterparty, that is, the seller, correspondingly bears the risk of value $\sum_{k=1}^K I_k(X)\mathbb{I}_{\{O=k\}}$
in exchange for receiving the premium
$\sum_{k=1}^K I_k(X)\mathbb{I}_{\{O=k\}}$
in exchange for receiving the premium $\pi$
, thus making the loss at the end of the policy period,
$\pi$
, thus making the loss at the end of the policy period, $-\pi+\sum_{k=1}^K I_k(X)\mathbb{I}_{\{O=k\}}$
. In this study, any potential return generated by the premium during the policy period is neglected for simplicity.
$-\pi+\sum_{k=1}^K I_k(X)\mathbb{I}_{\{O=k\}}$
. In this study, any potential return generated by the premium during the policy period is neglected for simplicity.
To support the decision-making regarding configurations of the contract consisting of the incident-specific indemnity functions and the policy premium, assume that the Buyer and the Seller are endowed with risk measures $\rho_B$
and
$\rho_B$
and $\rho_S$
, respectively, and the Pareto optimality is to be achieved with respect to the risk measures on their post-transfer risk positions, so that neither of the two parties can attain a lower risk, evaluated by the risk measure, without the other party’s risk being increased. Then, as extended in Asimit et al. (Reference Asimit, Boonen, Chi and Chong2021) and first proved in Theorem 3.1 of Asimit and Boonen (Reference Asimit and Boonen2018),Footnote
1
if their risk measures are translation invariant,Footnote
2
their Pareto optimality is achieved by the contract which minimizes:
$\rho_S$
, respectively, and the Pareto optimality is to be achieved with respect to the risk measures on their post-transfer risk positions, so that neither of the two parties can attain a lower risk, evaluated by the risk measure, without the other party’s risk being increased. Then, as extended in Asimit et al. (Reference Asimit, Boonen, Chi and Chong2021) and first proved in Theorem 3.1 of Asimit and Boonen (Reference Asimit and Boonen2018),Footnote
1
if their risk measures are translation invariant,Footnote
2
their Pareto optimality is achieved by the contract which minimizes:
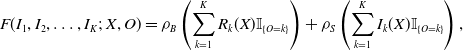
 \begin{equation*} F(I_1,I_2, \ldots, I_K,\pi;\, X, O) = \rho_B\left(\sum_{k=1}^K R_k(X)\mathbb{I}_{\{O=k\}}+ \pi \right) + \rho_S\left(\sum_{k=1}^K I_k(X)\mathbb{I}_{\{O=k\}} -\pi\right).\end{equation*}
With their risk measures being translation invariant and the policy premium $\pi$
being a deterministic decision variable, the objective function, with a slight abuse of notation, can be simplified to
$\pi$
being a deterministic decision variable, the objective function, with a slight abuse of notation, can be simplified to
 \begin{equation*} F(I_1,I_2, \ldots, I_K;\, X, O) = \rho_B\left(\sum_{k=1}^K R_k(X)\mathbb{I}_{\{O=k\}} \right) + \rho_S\left(\sum_{k=1}^K I_k(X)\mathbb{I}_{\{O=k\}} \right),\end{equation*}
The minimization problem that solves the ex-ante specified Pareto optimal incident-specific indemnity functions is then given by
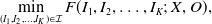 \begin{equation} \min_{(I_1,I_2, \ldots, I_K) \in \mathcal{I}} F(I_1,I_2, \ldots, I_K;\, X, O),\end{equation}
where, with Id being the identity function, the solution space
 \begin{equation*}\mathcal{I}\,:\!= \{(I_1,I_2, \ldots, I_K)\, : \,0 \le I_k \le \mathrm{Id},\;I_k \text{ and } R_k \text{ are non-decreasing},\;\forall k\in\mathcal{K}\}\end{equation*}
adheres to two fundamental principles in insurance – (1) the buyer is compensated partially or fully for a loss, but cannot make a profit from the compensation and (2) the ex-post moral hazard that a falsely larger claim is made to reduce the buyer’s deductible or the seller’s indemnity payout should be avoided.
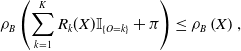
Finally, the ex-ante specified Pareto optimal policy premium is given by the rationality constraints of the buyer and seller:
 \begin{equation*}\rho_B\left(\sum_{k=1}^K R_k(X)\mathbb{I}_{\{O=k\}}+ \pi \right)\leq\rho_B\left(X\right),\end{equation*}
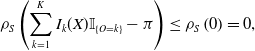 \begin{equation*}\rho_S\left(\sum_{k=1}^K I_k(X)\mathbb{I}_{\{O=k\}}- \pi \right)\leq\rho_S\left(0\right)=0,\end{equation*}
in which the right-hand side of the inequalities is the risk measures on both parties’ pre-transfer risk positions. By the translational invariance of their risk measures, these can be simplified as
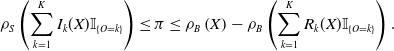 \begin{equation}\rho_S\left(\sum_{k=1}^K I_k(X)\mathbb{I}_{\{O=k\}}\right)\leq\pi\leq\rho_B\left(X\right)-\rho_B\left(\sum_{k=1}^K R_k(X)\mathbb{I}_{\{O=k\}}\right).\end{equation}
in which the incident-specific indemnity and retained functions are Pareto optimal solved in (2.1). Thus, at the Pareto optimality, the policy premium is not disentangled from the respective risks taken by the buyer and the seller. Varying the Pareto optimal policy premium choice within this interval traces the entire Pareto frontier. Note that in this paper, the premium is derived from an economic perspective; in the insurance practice, an insurer could charge a premium based on an actuarial price.
Therefore, in the remainder of this study, the main focus is on the design of incident-specific indemnity functions.
2.2. Optimal indemnities with Value-at-Risk preferences
The choice of risk measures, $\rho_B$
and
$\rho_B$
and $\rho_S$
, depends on the buyer and the seller’s own risk management appetites. A practical choice that satisfies the translational invariance is value-at-risk (VaR), which is a standard risk measure for the capital requirement in the Basel II/III framework for the international banking system (see Basel Committee on Banking Supervision 2011) and the Solvency II framework for UK/European-based insurance companies (see European Union 2009). In this paper, we mainly study the case when both the buyer and the seller adopt VaR as their risk measures, which is noted as VaR-VaR; the cases with risk measures given by Tail Value-at-Risk (TVaR) shall also be discussed. The VaR is defined as follows:
$\rho_S$
, depends on the buyer and the seller’s own risk management appetites. A practical choice that satisfies the translational invariance is value-at-risk (VaR), which is a standard risk measure for the capital requirement in the Basel II/III framework for the international banking system (see Basel Committee on Banking Supervision 2011) and the Solvency II framework for UK/European-based insurance companies (see European Union 2009). In this paper, we mainly study the case when both the buyer and the seller adopt VaR as their risk measures, which is noted as VaR-VaR; the cases with risk measures given by Tail Value-at-Risk (TVaR) shall also be discussed. The VaR is defined as follows:
 \begin{equation} \text{VaR}_\gamma(Y) = \inf\{y \in \mathbb{R}\,:\, \mathbb{P}(Y \le y) \ge \gamma\},\end{equation}
where Y is a random variable and $\gamma \in (0,1)$
is the risk tolerance level.
$\gamma \in (0,1)$
is the risk tolerance level.
With the VaR risk preferences, Asimit et al. (Reference Asimit, Boonen, Chi and Chong2021) showed that the indemnity functions in the sub-solution space $\mathcal{I}\setminus \mathcal{I}_1$
are at least suboptimal for Problem (2.1), where
$\mathcal{I}\setminus \mathcal{I}_1$
are at least suboptimal for Problem (2.1), where
 \begin{equation}\begin{aligned} \mathcal{I}_1\,:\!= \{(I_1,I_2, \ldots, I_K) \in \mathcal{I}\,:&\; I_k(X) = (X-d_k)_+ \text{ or } I_k(X)= X-(X-d_k)_+, \\ &\;d_k \in [0, \mathrm{ess\,sup}(X)], \text{ for each } k\in\mathcal{K} \},\end{aligned}\end{equation}
and $\mathrm{ess\,sup}(X)$
is the essential supremum of X under the probability measure
$\mathrm{ess\,sup}(X)$
is the essential supremum of X under the probability measure $\mathbb{P}$
. This implies that, for each incident-specific coverage, either a deductible or a policy limit, denoted by
$\mathbb{P}$
. This implies that, for each incident-specific coverage, either a deductible or a policy limit, denoted by $d_k$
, should be implemented. Within the solution space in (2.4), solving the infinite-dimensional Problem (2.1) is thus reduced to solving the following finite-dimensional, but combinatorial, minimization problem:
$d_k$
, should be implemented. Within the solution space in (2.4), solving the infinite-dimensional Problem (2.1) is thus reduced to solving the following finite-dimensional, but combinatorial, minimization problem:
 \begin{equation} \min_{\substack{\boldsymbol{d} \in \mathbb{R}_+^K, \\ \boldsymbol{\theta} \in \{0,1\}^K}} F(\boldsymbol{d}, \boldsymbol{\theta};\, X, O) = \min_{\substack{\boldsymbol{d} \in \mathbb{R}_+^K, \\ \boldsymbol{\theta} \in \{0,1\}^K}} \left[\text{VaR}_{\alpha}\left(L_S(\boldsymbol{d}, \boldsymbol{\theta};\, X, O)\right) + \text{VaR}_{\beta}\left(L_B(\boldsymbol{d}, \boldsymbol{\theta};\, X, O)\right)\right],\end{equation}
where
-
• $\boldsymbol{\theta} = (\theta_1,\theta_2, \ldots, \theta_K)$
, and for each
$k\in\mathcal{K}$
,
$\theta_k \in \left\{0,1\right\}$
is the choice between a limit or a deductible being implemented. Here, we set
$\theta_k = 0$
if an incident-specific limit is placed, and
$\theta_k = 1$
if a deductible is implemented instead;
$\boldsymbol{\theta} = (\theta_1,\theta_2, \ldots, \theta_K)$
, and for each
$k\in\mathcal{K}$
,
$\theta_k \in \left\{0,1\right\}$
is the choice between a limit or a deductible being implemented. Here, we set
$\theta_k = 0$
if an incident-specific limit is placed, and
$\theta_k = 1$
if a deductible is implemented instead; -
•
$\boldsymbol{d} = (d_1,d_2, \ldots, d_K)$
are the amounts of incident-specific limits or deductibles, depending on which of the two is imposed on the coverage for each incident type; -
•
$\alpha$
and
$\beta$
are choices of risk tolerance levels of the seller and the buyer, respectively; -
•
(2.6)and
\begin{equation} L_S(\boldsymbol{d}, \boldsymbol{\theta};\, X, O) = \sum_{k = 1}^K\Big(\theta_k\left(X-d_k\right)_+ + (1-\theta_k)\left(X - \left(X-d_k\right)_+\right)\Big)\mathbb{I}_{\{O=k\}}, \end{equation}
(2.7)are the seller’s and the buyer’s loss random variables, respectively, after agreeing with an insurance contract.
\begin{equation} {L_B(\boldsymbol{d}, \boldsymbol{\theta};\, X, O) = \sum_{k=1}^K\Big((1-\theta_k)\left(X-d_k\right)_+ + \theta_k\left(X - \left(X-d_k\right)_+\right)\Big)\mathbb{I}_{\{O=k\}}},\end{equation}


To solve Problem (2.5) for Pareto optimal $\boldsymbol{\theta}$
and
$\boldsymbol{\theta}$
and $\boldsymbol{d}$
, the probability distributions of
$\boldsymbol{d}$
, the probability distributions of $L_S$
and
$L_S$
and $L_B$
in (2.6) and (2.7) are necessary model inputs to calculate the VaRs in the objective objective function; these are discussed in Section 3. Though Problem (2.5) is of finite-dimensional in
$L_B$
in (2.6) and (2.7) are necessary model inputs to calculate the VaRs in the objective objective function; these are discussed in Section 3. Though Problem (2.5) is of finite-dimensional in $\boldsymbol{d}$
, it is also of combinatorial type such that the number of combinations in
$\boldsymbol{d}$
, it is also of combinatorial type such that the number of combinations in $\boldsymbol{\theta}$
grows exponentially in K, making the minimization problem not mathematically tractable; see the number of cases to consider in of cases to consider in Proposition 3.1 of Asimit et al. (Reference Asimit, Boonen, Chi and Chong2021) which seeks explicit optimal indemnities even if
$\boldsymbol{\theta}$
grows exponentially in K, making the minimization problem not mathematically tractable; see the number of cases to consider in of cases to consider in Proposition 3.1 of Asimit et al. (Reference Asimit, Boonen, Chi and Chong2021) which seeks explicit optimal indemnities even if $K=2$
. Section 4 discusses a numerical method and its algorithm to solve the combinatorial optimization problem.
$K=2$
. Section 4 discusses a numerical method and its algorithm to solve the combinatorial optimization problem.
2.3. Optimal indemnities with Tail Value-at-Risk preferences
It is well known that the VaR is not sub-additive,Footnote 3 which explains much of its criticism. Indeed, the Basel III and Solvency II frameworks put advocate on the TVaR, which is sub-additive. The TVaR is defined as follows:
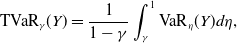 \begin{equation*} \text{TVaR}_\gamma(Y) = \frac{1}{1-\gamma}\int_{\gamma}^{1}\text{VaR}_\eta(Y)d\eta,\end{equation*}
where Y is a random variable and $\gamma \in (0,1)$
is the risk tolerance level.
$\gamma \in (0,1)$
is the risk tolerance level.
When both the buyer and the seller adopt TVaR as their risk measures, which is denoted as TVaR-TVaR, Problem (2.1) is rather trivial in that its optimal solution would assign the full risk in all indemnity environments to either the buyer or the seller. As a matter of fact, this even holds true if their parametric risk measures $\rho_B$
and
$\rho_B$
and $\rho_S$
(i) are translation invariant and sub-additive, (ii) are of the same type of risk measures which only differ by their parameters, and (iii) are non-decreasing in their parameters. These hold for the TVaR with different risk tolerance levels. To show this, suppose that the seller’s risk measure
$\rho_S$
(i) are translation invariant and sub-additive, (ii) are of the same type of risk measures which only differ by their parameters, and (iii) are non-decreasing in their parameters. These hold for the TVaR with different risk tolerance levels. To show this, suppose that the seller’s risk measure $\rho_S$
is parametrized by
$\rho_S$
is parametrized by $\alpha$
and is denoted as
$\alpha$
and is denoted as $\rho_{\alpha}$
, while the buyer’s risk measure
$\rho_{\alpha}$
, while the buyer’s risk measure $\rho_B$
is parametrized by
$\rho_B$
is parametrized by $\beta$
and is denoted as
$\beta$
and is denoted as $\rho_{\beta}$
; assume that
$\rho_{\beta}$
; assume that $\beta\leq\alpha$
. In the case of the TVaRs,
$\beta\leq\alpha$
. In the case of the TVaRs, $\alpha$
and
$\alpha$
and $\beta$
are their respective risk tolerance levels. Then indeed, for any
$\beta$
are their respective risk tolerance levels. Then indeed, for any $(I_1,I_2, \ldots, I_K) \in \mathcal{I}$
,
$(I_1,I_2, \ldots, I_K) \in \mathcal{I}$
,
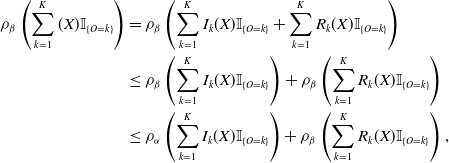 \begin{align*}\rho_\beta\left(\sum_{k=1}^K (X)\mathbb{I}_{\{O=k\}}\right)=&\;\rho_\beta\left(\sum_{k=1}^K I_k(X)\mathbb{I}_{\{O=k\}} + \sum_{k=1}^K R_k(X)\mathbb{I}_{\{O=k\}}\right)\\\leq&\; \rho_\beta\left(\sum_{k=1}^K I_k(X)\mathbb{I}_{\{O=k\}}\right) + \rho_\beta\left(\sum_{k=1}^K R_k(X)\mathbb{I}_{\{O=k\}}\right)\\\leq&\; \rho_\alpha\left(\sum_{k=1}^K I_k(X)\mathbb{I}_{\{O=k\}}\right) + \rho_\beta\left(\sum_{k=1}^K R_k(X)\mathbb{I}_{\{O=k\}}\right),\end{align*}
where the first equality is by definition, the first inequality is due to the sub-additivity of $\rho_B$
, and the second inequality is by the monotonicity in the risk measure’s parameter. Therefore, in the case that
$\rho_B$
, and the second inequality is by the monotonicity in the risk measure’s parameter. Therefore, in the case that $\beta\leq\alpha$
, the optimal solution of Problem (2.1) is no coverage for any indemnity environment, that is
$\beta\leq\alpha$
, the optimal solution of Problem (2.1) is no coverage for any indemnity environment, that is $I_k\equiv 0$
, for all
$I_k\equiv 0$
, for all $k\in\mathcal{K}$
; in the case that
$k\in\mathcal{K}$
; in the case that $\alpha\leq\beta$
, with similar arguments, the optimal solution of Problem (2.1) is of full coverage in all indemnity environments that
$\alpha\leq\beta$
, with similar arguments, the optimal solution of Problem (2.1) is of full coverage in all indemnity environments that $I_k\equiv\text{Id}$
, for all
$I_k\equiv\text{Id}$
, for all $k\in\mathcal{K}$
. Hence, it is not interesting to study the case when the translation invariant risk measures
$k\in\mathcal{K}$
. Hence, it is not interesting to study the case when the translation invariant risk measures $\rho_B$
and
$\rho_B$
and $\rho_S$
are both sub-additive, and in particular the TVaR-TVaR case.
$\rho_S$
are both sub-additive, and in particular the TVaR-TVaR case.
This is actually in line with Dhaene et al. (Reference Dhaene, Laeven, Vanduffel, Darkiewicz and Goovaerts2008), which finds that if the risk measure used for capital requirements is too sub-additive, a merged portfolio would have a lower capital requirement than the total capital requirement for standalone portfolios. This results in a greater shortfall, that is, the actual loss minus the required capital, for the combined portfolio. In our study, since the risk measure is used as a direct representation of the magnitude of risk instead of a capital requirement, the sub-additivity encourages the merging of risk.
Nevertheless, if the buyer adopts the VaR as the risk measure, and the seller adopts the TVaR as the risk measure, or vice versa, Problem (2.1) could be nontrivial. Without loss of generality, we consider the case when the seller adopts the $\text{TVaR}_{\alpha}$
risk preference, while the buyer adopts the
$\text{TVaR}_{\alpha}$
risk preference, while the buyer adopts the $\text{VaR}_{\beta}$
risk preference. Following the same proof as of Theorem 4.1 in Asimit et al. (Reference Asimit, Boonen, Chi and Chong2021), one can show that Problem (2.1) is reduced to solving the following finite-dimensional, but combinatorial, minimization problem:
$\text{VaR}_{\beta}$
risk preference. Following the same proof as of Theorem 4.1 in Asimit et al. (Reference Asimit, Boonen, Chi and Chong2021), one can show that Problem (2.1) is reduced to solving the following finite-dimensional, but combinatorial, minimization problem:
 \begin{equation} \min_{\substack{\boldsymbol{d}_1, \boldsymbol{d}_2 \in \mathbb{R}_+^K, \\ \boldsymbol{\theta} \in \{0,1\}^K}} \left[\text{TVaR}_{\alpha}\left(\underline L_S(\boldsymbol{d}_1, \boldsymbol{d}_2, \boldsymbol{\theta};\, X, O)\right) + \text{VaR}_{\beta}\left(\underline L_B(\boldsymbol{d}_1, \boldsymbol{d}_2, \boldsymbol{\theta};\, X, O)\right)\right],\end{equation}
where $\boldsymbol{d}_1 = \left(d_1^{(1)},d_2^{(1)},\ldots,d_K^{(1)}\right)$
, and
$\boldsymbol{d}_1 = \left(d_1^{(1)},d_2^{(1)},\ldots,d_K^{(1)}\right)$
, and $ \boldsymbol{d}_2 = \left(d_1^{(2)},d_2^{(2)},\ldots,d_K^{(2)}\right)$
. Correspondingly,
$ \boldsymbol{d}_2 = \left(d_1^{(2)},d_2^{(2)},\ldots,d_K^{(2)}\right)$
. Correspondingly,
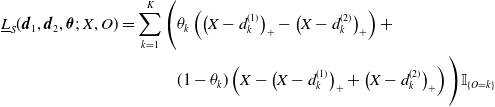 \begin{align*}\begin{aligned}\underline L_S(\boldsymbol{d}_1, \boldsymbol{d}_2, \boldsymbol{\theta}; \,X, O) = \sum_{k = 1}^K\Bigg(&\theta_k\left( \left(X-d^{(1)}_k\right)_+ - \left(X-d^{(2)}_k\right)_+\right) + \\&(1-\theta_k)\left(X - \left(X-d^{(1)}_k\right)_+ + \left(X-d^{(2)}_k\right)_+\right)\Bigg)\mathbb{I}_{\{O=k\}}\end{aligned}\end{align*}
and
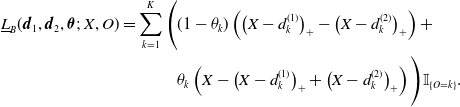 \begin{align*}\begin{aligned}\underline L_B(\boldsymbol{d}_1, \boldsymbol{d}_2, \boldsymbol{\theta};\, X, O) = \sum_{k = 1}^K\Bigg(&(1-\theta_k)\left( \left(X-d^{(1)}_k\right)_+ - \left(X-d^{(2)}_k\right)_+\right) + \\&\theta_k\left(X - \left(X-d^{(1)}_k\right)_+ + \left(X-d^{(2)}_k\right)_+\right)\Bigg)\mathbb{I}_{\{O=k\}}.\end{aligned}\end{align*}
That is, if $\theta_k = 1$
,
$\theta_k = 1$
, $d_k^{(1)}$
represents the deductible specific to incident type k, and
$d_k^{(1)}$
represents the deductible specific to incident type k, and $d_k^{(2)}$
represents the corresponding limit, and the seller covers the loss between
$d_k^{(2)}$
represents the corresponding limit, and the seller covers the loss between $d_k^{(1)}$
and
$d_k^{(1)}$
and $d_k^{(2)}$
. If
$d_k^{(2)}$
. If $\theta_k = 0$
, the buyer is responsible for the loss between
$\theta_k = 0$
, the buyer is responsible for the loss between $d_k^{(1)}$
and
$d_k^{(1)}$
and $d_k^{(2)}$
while the seller will cover the remaining loss. All other symbols are defined in the same way as in Problem (2.5).
$d_k^{(2)}$
while the seller will cover the remaining loss. All other symbols are defined in the same way as in Problem (2.5).
With this setup, the solution can still be trivial if $\beta \le \alpha$
, which makes it optimal for the buyer to take all the risk, and therefore, no insurance is purchased. Nontrivial risk sharing will occur if
$\beta \le \alpha$
, which makes it optimal for the buyer to take all the risk, and therefore, no insurance is purchased. Nontrivial risk sharing will occur if $\beta \gt \alpha$
. To see this, for risk levels
$\beta \gt \alpha$
. To see this, for risk levels $\alpha$
and
$\alpha$
and $\beta$
that satisfy
$\beta$
that satisfy $0 \le \beta \le \alpha \le 1$
and risk measures
$0 \le \beta \le \alpha \le 1$
and risk measures $\rho_S$
and
$\rho_S$
and $\rho_B$
being
$\rho_B$
being $\mathrm{TVaR}_\alpha$
and
$\mathrm{TVaR}_\alpha$
and $\mathrm{VaR}_\beta$
, respectively, we can show the following relationship,
$\mathrm{VaR}_\beta$
, respectively, we can show the following relationship,
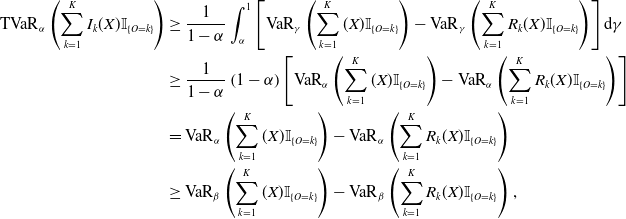
 \begin{equation}\mathrm{VaR}_\beta\left(\sum_{k=1}^K (X)\mathbb{I}_{\{O=k\}}\right) \le \mathrm{TVaR}_\alpha\left(\sum_{k=1}^K I_k(X)\mathbb{I}_{\{O=k\}}\right) + \mathrm{VaR}_\beta\left(\sum_{k=1}^K R_k(X)\mathbb{I}_{\{O=k\}}\right).\end{equation}
To begin with, the subadditivity of TVaR suggests the inequality as follows:
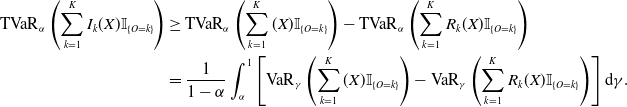 \begin{equation} \begin{aligned}\mathrm{TVaR}_\alpha\left(\sum_{k=1}^K I_k(X)\mathbb{I}_{\{O=k\}}\right) &\ge \mathrm{TVaR}_\alpha\left(\sum_{k=1}^K (X)\mathbb{I}_{\{O=k\}}\right) - \mathrm{TVaR}_\alpha\left(\sum_{k=1}^K R_k(X)\mathbb{I}_{\{O=k\}}\right)\\ &= \frac{1}{1-\alpha}\int_\alpha^1 \left[\mathrm{VaR}_\gamma\left(\sum_{k=1}^K (X)\mathbb{I}_{\{O=k\}}\right) - \mathrm{VaR}_\gamma\left(\sum_{k=1}^K R_k(X)\mathbb{I}_{\{O=k\}}\right)\right] \mathrm{d}\gamma. \end{aligned}\end{equation}
Next, we show that the integrand is increasing in $\gamma$
. Since the indemnity function
$\gamma$
. Since the indemnity function $I_k(\cdot)$
is nondecreasing, for any
$I_k(\cdot)$
is nondecreasing, for any $x \le x'$
,
$x \le x'$
,
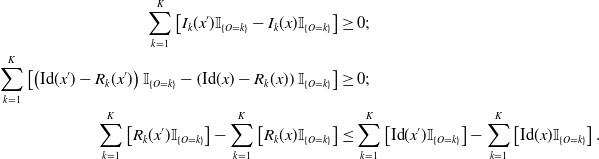 \begin{equation*} \begin{aligned} \sum_{k = 1}^K \left[I_{k}(x')\mathbb{I}_{\{O=k\}} - I_{k}(x)\mathbb{I}_{\{O=k\}}\right] &\ge 0; \\ \sum_{k = 1}^K \left[\left(\mathrm{Id}(x') -R_k(x')\right)\mathbb{I}_{\{O=k\}} - \left(\mathrm{Id}(x) -R_k(x)\right)\mathbb{I}_{\{O=k\}}\right] & \ge 0; \\ \sum_{k=1}^K \left[R_k(x')\mathbb{I}_{\{O =k\}} \right] - \sum_{k=1}^K \left[R_k(x)\mathbb{I}_{\{O =k\}} \right] &\le \sum_{k=1}^K \left[\mathrm{Id}(x')\mathbb{I}_{\{O =k\}} \right] - \sum_{k=1}^K \left[\mathrm{Id}(x)\mathbb{I}_{\{O =k\}} \right]. \end{aligned}\end{equation*}
With this result, according to Theorem 3.B.5. in Shaked and Shanthikumar (Reference Shaked and Shanthikumar2007), the dispersive order of the retained loss random variable and the total loss random variable is as follows:
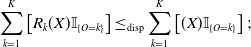 \begin{equation} \sum_{k=1}^K \left[R_k(X)\mathbb{I}_{\{O =k\}} \right] \le_{\mathrm{disp}} \sum_{k=1}^K \left[(X)\mathbb{I}_{\{O =k\}} \right];\end{equation}
that is, $\sum_{k=1}^K \left[R_k(X)\mathbb{I}_{\{O =k\}} \right]$
is smaller than
$\sum_{k=1}^K \left[R_k(X)\mathbb{I}_{\{O =k\}} \right]$
is smaller than $\sum_{k=1}^K \left[(X)\mathbb{I}_{\{O =k\}} \right]$
in dispersive order. By the definition of dispersive order,
$\sum_{k=1}^K \left[(X)\mathbb{I}_{\{O =k\}} \right]$
in dispersive order. By the definition of dispersive order, $\left[\mathrm{VaR}_\gamma\left(\sum_{k=1}^K X\mathbb{I}_{\{O=k\}}\right) - \mathrm{VaR}_\gamma\left(\sum_{k=1}^K R_k(X)\mathbb{I}_{\{O=k\}}\right)\right]$
is increasing in
$\left[\mathrm{VaR}_\gamma\left(\sum_{k=1}^K X\mathbb{I}_{\{O=k\}}\right) - \mathrm{VaR}_\gamma\left(\sum_{k=1}^K R_k(X)\mathbb{I}_{\{O=k\}}\right)\right]$
is increasing in $\gamma$
. Therefore, the inequality in Equation (2.10) can further proceed as follows to obtain the inequality in Equation (2.9),
$\gamma$
. Therefore, the inequality in Equation (2.10) can further proceed as follows to obtain the inequality in Equation (2.9),
 \begin{equation*}\begin{aligned}\mathrm{TVaR}_\alpha\left(\sum_{k=1}^K I_k(X)\mathbb{I}_{\{O=k\}}\right) &\geq \frac{1}{1-\alpha}\int_\alpha^1 \left[\mathrm{VaR}_\gamma\left(\sum_{k=1}^K (X)\mathbb{I}_{\{O=k\}}\right) - \mathrm{VaR}_\gamma\left(\sum_{k=1}^K R_k(X)\mathbb{I}_{\{O=k\}}\right)\right] \mathrm{d}\gamma \\&\geq \frac{1}{1-\alpha}\left(1-\alpha\right)\left[\mathrm{VaR}_\alpha\left(\sum_{k=1}^K (X)\mathbb{I}_{\{O=k\}}\right) - \mathrm{VaR}_\alpha\left(\sum_{k=1}^K R_k(X)\mathbb{I}_{\{O=k\}}\right)\right]\\&= \mathrm{VaR}_\alpha\left(\sum_{k=1}^K (X)\mathbb{I}_{\{O=k\}}\right) - \mathrm{VaR}_\alpha\left(\sum_{k=1}^K R_k(X)\mathbb{I}_{\{O=k\}}\right) \\&\ge \mathrm{VaR}_\beta\left(\sum_{k=1}^K (X)\mathbb{I}_{\{O=k\}}\right) - \mathrm{VaR}_\beta\left(\sum_{k=1}^K R_k(X)\mathbb{I}_{\{O=k\}}\right),\end{aligned}\end{equation*}
where the last inequality is the results of that $\alpha \geq \beta$
and the dispersive order of the retained loss and the total loss.
$\alpha \geq \beta$
and the dispersive order of the retained loss and the total loss.
While the majority of the rest of this paper will focus on the VaR-VaR preferences, some numerical results associated with the TVaR-VaR preferences corresponding to a nontrivial case will also be given in Section 4.3.
3. Model inputs
The distributions of the seller’s and the buyer’s loss random variables in (2.6) and (2.7) belong to the mixture class. Therefore, model inputs to solve Problem (2.5) are (i) the index set $\mathcal{K}$
of insurable cyber incident types; (ii) the probabilities,
$\mathcal{K}$
of insurable cyber incident types; (ii) the probabilities, $\boldsymbol{p} = (p_1, p_2, \ldots, p_K)$
, of an incident falling into an individual category, where
$\boldsymbol{p} = (p_1, p_2, \ldots, p_K)$
, of an incident falling into an individual category, where $p_k = {\mathbb{P}(O=k)}$
, for
$p_k = {\mathbb{P}(O=k)}$
, for $k\in\mathcal{K}$
(note that, due to the mutual exclusivity of incident types,
$k\in\mathcal{K}$
(note that, due to the mutual exclusivity of incident types, $\sum_{k=1}^K p_k = 1$
); and (iii) the incident-specific severity of the ground-up loss
$\sum_{k=1}^K p_k = 1$
); and (iii) the incident-specific severity of the ground-up loss $(X)\mathbb{I}_{\{O=k\}}$
, for
$(X)\mathbb{I}_{\{O=k\}}$
, for $k\in\mathcal{K}$
.
$k\in\mathcal{K}$
.
A dataset from Advisen consisting of historical cyber incidents is used to obtain the inputs to determine the loss random variables. In the dataset, there are 103,061 historical cyber incidents. Its earliest observation dates back to 1987, and the latest observation was recorded in September 2018. This dataset has 125 explanatory variables coded for each incident, which can generally be categorized into four groups as follows: (i) nature of the incident, (ii) victim company information, (iii) consequences of the incident, and (iv) information from any associated lawsuits. With the information on incident types and loss amounts, we can build statistical models to predict the probability vector $\boldsymbol{p}$
and the conditional severity distribution of
$\boldsymbol{p}$
and the conditional severity distribution of $(X)\mathbb{I}_{\{O=k\}}$
, for
$(X)\mathbb{I}_{\{O=k\}}$
, for $k\in\mathcal{K}$
. The data and models shall be further elaborated on in the following subsections.
$k\in\mathcal{K}$
. The data and models shall be further elaborated on in the following subsections.
3.1. Types of cyber incident
This paper focuses on the cyber incidents that took place in the US, which represent close to 80% of all observations. Based on the country information provided for each incident in the dataset, we extract a sample of all US-based incidents, and the sample size is 84,938.
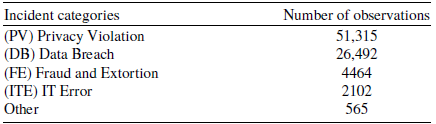
The response variable is the cyber incident type. The different incident types are the following: (1) cyber extortion, (2) data – malicious breach, (3) data – physically lost or stolen, (4) data – unintentional disclosure, (5) denial of service (DDOS)/system disruption, (6) digital breach/identity thief, (7) identity – fraudulent use/account access, (8) industry controls and operations, (9) IT – configuration/implementation errors, (10) IT – processing errors, (11) network/website disruption, (12) phishing, spoofing, social engineering, (13) privacy – unauthorized contact or disclosure, (14) privacy – unauthorized data collection, and (15) skimming, physical tampering. Similar to Kesan and Zhang (Reference Kesan and Zhang2020b), in this paper, these 15 categories are grouped into four types, which are (1) data breach, (2) fraud and extortion, (3) IT error, and (4) privacy violation (PV). The following provides a brief description of each type of cyber incident classified and, together with the “other” level, Table 1 shows the number of observations for each type of cyber incident classified. Abbreviations in parentheses will occasionally be adopted throughout this paper for clear exposition.
-
• Privacy violation (PV) incidents occur when companies collect or disclose individuals’ sensitive information, such as personally identifiable information and financial information, without receiving consent from those individuals.
-
• Data breaches (DB) are incidents in which data storage devices are breached, causing a possible leakage of confidential information. These incidents can be caused by either hacking activities or the loss of physical devices.
-
• Cyber incidents in the fraud and extortion (FE) category are similar to traditional frauds and extortion events, but take place in cyberspace. Cyber frauds typically have forged digital identity involved, such as phishing attacks, and commonly in cyber extortion events, information, and information systems are held hostage by intruders for financial gain.
-
• In IT error (ITE) events, there is no malicious intent involved. They are caused by incorrectly configured or operating IT systems.
Number of historical cyber incidents in each category.
3.2. Incident type occurrence probabilities
Company-specific information is useful when estimating the occurrence probabilities of different incident types. For example, it is reasonable to assume that technology companies with lots of customer data are more likely to experience DB than manufacturing companies, whereas manufacturers with complex industrial control systems are more prone to IT errors that cause disruptions than technology companies. Therefore, we use company characteristics such as industry as predictors for the occurrence probabilities. In this subsection, we present several predictive models that we experimented with for this purpose and make comparisons among them. This approach is similar to insurance rate making, which determines insurance premiums based on the risk characteristics of the insurance buyers.
Selected explanatory variables
Among all explanatory variables available in this dataset, we desire manageable and meaningful explanatory variables, and therefore the variable selection process incorporates the following considerations.
-
• The values of some variables can only be observed after the occurrence of an incident, at which point the type of incident is already known. For example, the settlement cost of a lawsuit associated with an incident is not observable when the incident occurs, and thus this cost has no impact on the type of the incident. Such variables are ruled out from the models.
-
• Categorical explanatory variables that have a large number of levels and are downstream in the hierarchy, if any, are removed. For example, among the explanatory variables that represent the geographical information of a company, the one that contains city information is removed, but the one with state information is kept. Likewise, explanatory variables that are more granular industry classification codes, such as Standard Industrial Classification (SIC) codes with more than 2 digits, are removed. This helps reduce the dimensionality of the explanatory variable space when categorical explanatory variables need to be dummified in the modeling process.
-
• For each of the remaining categorical explanatory variables, categories that have too few observations are combined. For example, for the explanatory variable STATE, which has the state information of the victim company, all states that are associated with fewer than 1000 observations are combined into one category, named “Other”. This procedure helps mitigate the possible problem that those small categories become absent in training set after the train-test split. Moreover, with fewer categories, the dimensionality of the sample is more manageable after the categorical explanatory variables are dummified.
-
• Auxiliary information, such as the IDs of companies and incidents, provides no predictive power and thus is removed.
As a result, there are 8 explanatory variables remaining. Table 2 shows the summary statistics of all these explanatory variables; their descriptions are provided in Appendix A.
Summary statistics of explanatory variables. For each categorical explanatory variable, information is displayed for at most four categories with the most number of observations. Other levels are used for modeling, but are truncated in this table for ease of reading.
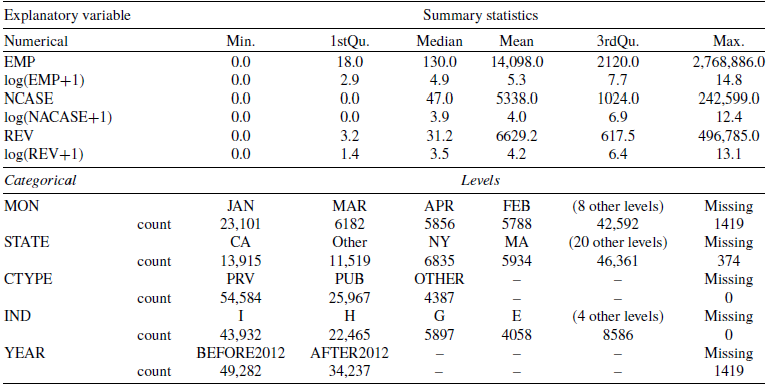
To provide an overview, the processed and cleaned sample contains 84,938 observations of cyber incidents, with the cyber incident type as the multi-class categorical response variable, and 8 explanatory variables, of which 3 are numerical, and 5 are categorical. For categorical explanatory variables, since many of them, such as state and industry, have more than two levels and are nonordinal, they are numerically coded by dummification. In addition, the three numerical explanatory variables are highly right skewed, as suggested by their summary statistics, which are expected to have a negative impact on the performance of some linear models that will be tested. Therefore, each of the numerical explanatory variables is log-transformed. For testing and comparing the performance of different models, 30% of all observations are selected at random and used as the holdout sample, while the remaining 70% are for training classifiers.
Multi-class classification
Predicting which type an incident falls into once it occurs is essentially a multi-class classification problem. In this study, we explored several commonly used classification models, including decision trees, random forests, gradient-boosted trees, linear discriminant analysis, multinomial logistic regression, and multilayer perceptron. In the end, we build a stacking classifier on top of these models for any possible performance gains. Because all these methods are well established and documented in a broad volume of literature, we shall only provide brief and mostly qualitative overviews of them in Appendix B and focus instead on their performance and prediction results.
Model comparisons
Table 1 suggests that the four incident categories are unbalanced, and a large part of them are within the types of data breach and privacy violation types. In this circumstance, several metrics, as summarized in Grandini et al. (Reference Grandini, Bagli and Visani2020), could be used to evaluate model performance. In this paper, we shall report the balanced accuracy of each model as a proxy of its performance. The balanced accuracy score is defined as follows:
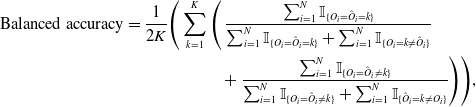 \begin{equation}\begin{aligned}\text{Balanced accuracy} = \frac{1}{2K}\Bigg(\sum_{k=1}^K \Bigg(&\; \frac{\sum_{i=1}^N \mathbb{I}_{\{O_i = \hat{O}_i = k\}}}{\sum_{i=1}^N \mathbb{I}_{\{O_i = \hat{O}_i = k\}} + \sum_{i=1}^N \mathbb{I}_{\{O_i = k \ne \hat{O}_i\}}} \\ & + \frac{\sum_{i=1}^N \mathbb{I}_{\{O_i = \hat{O}_i \ne k\}}}{\sum_{i=1}^N \mathbb{I}_{\{O_i = \hat{O}_i \ne k\}} + \sum_{i=1}^N \mathbb{I}_{\{\hat{O}_i = k \ne O_i\}}}\Bigg) \Bigg),\end{aligned}\end{equation}
where
-
• N is the size of the test set;
-
•
$O_i$
and
$\hat{O}_i$
are the observed and the predicted occurring incident types of record i, respectively, for
$i = 1,2,\ldots, N$
.


The one-versus-all metric evaluates the model performance by comparing the predictions in one class against those in the combination of all other classes. Specifically, for each $k\in\mathcal{K}$
,
$k\in\mathcal{K}$
, $\sum_{i=1}^N \mathbb{I}_{\{O_i = \hat{O}_i = k\}}$
is the number of true positives with respect to incident type k,
$\sum_{i=1}^N \mathbb{I}_{\{O_i = \hat{O}_i = k\}}$
is the number of true positives with respect to incident type k, $\sum_{i=1}^N \mathbb{I}_{\{O_i = k \ne \hat{O}_i\}}$
is the false-negative count, and
$\sum_{i=1}^N \mathbb{I}_{\{O_i = k \ne \hat{O}_i\}}$
is the false-negative count, and $\sum_{i=1}^N \mathbb{I}_{\{O_i = \hat{O}_i \ne k\}}$
and
$\sum_{i=1}^N \mathbb{I}_{\{O_i = \hat{O}_i \ne k\}}$
and $\sum_{i=1}^N \mathbb{I}_{\{\hat{O}_i = k \ne O_i\}}$
correspond to true negatives and false positives, respectively. Therefore,
$\sum_{i=1}^N \mathbb{I}_{\{\hat{O}_i = k \ne O_i\}}$
correspond to true negatives and false positives, respectively. Therefore, $\frac{1}{2}\Bigg( \frac{\sum_{i=1}^N \mathbb{I}_{\{O_i = \hat{O}_i = k\}}}{\sum_{i=1}^N \mathbb{I}_{\{O_i = \hat{O}_i = k\}} + \sum_{i=1}^N \mathbb{I}_{\{O_i = k \ne \hat{O}_i\}}} + \frac{\sum_{i=1}^N \mathbb{I}_{\{O_i = \hat{O}_i \ne k\}}}{\sum_{i=1}^N \mathbb{I}_{\{O_i = \hat{O}_i \ne k\}} + \sum_{i=1}^N \mathbb{I}_{\{\hat{O}_i = k \ne O_i\}}}\Bigg)$
represents the kth class-specific balanced accuracy, and Equation (3.1) represents the average of these balanced accuracy values across all classes.
$\frac{1}{2}\Bigg( \frac{\sum_{i=1}^N \mathbb{I}_{\{O_i = \hat{O}_i = k\}}}{\sum_{i=1}^N \mathbb{I}_{\{O_i = \hat{O}_i = k\}} + \sum_{i=1}^N \mathbb{I}_{\{O_i = k \ne \hat{O}_i\}}} + \frac{\sum_{i=1}^N \mathbb{I}_{\{O_i = \hat{O}_i \ne k\}}}{\sum_{i=1}^N \mathbb{I}_{\{O_i = \hat{O}_i \ne k\}} + \sum_{i=1}^N \mathbb{I}_{\{\hat{O}_i = k \ne O_i\}}}\Bigg)$
represents the kth class-specific balanced accuracy, and Equation (3.1) represents the average of these balanced accuracy values across all classes.
After all the classifiers are tuned and trained, their performance in terms of the balanced accuracy of the predictions in the test set (holdout sample) is presented in Table 3. The table shows the by-class balanced accuracy of each classifier as well as the average across all classes, and the best score is highlighted in each class or among all averages.
Comparison of classification models.
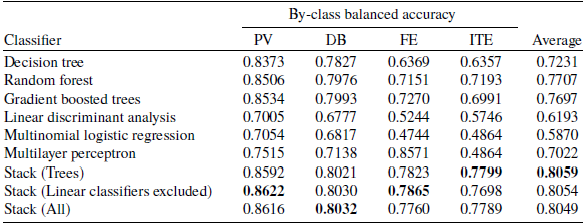
To summarize the performance comparison among different models, it is easy to observe that stacking models overall outperform their individual base classifiers. The best by-class accuracy scores and the best average accuracy score are all achieved by stacking models. Second, the distinction between the three stacking models is small. This suggests that the inclusion of classifiers other than tree-based models does not substantially improve the model performance. In addition, the by-class accuracy scores and the average balanced accuracy score attained by stacking models are generally close to 80%, which is a reasonably large proportion. Based on these three observations, the stacking classifier built on top of the three tree-based classifiers is adopted to predict incident-type occurrence probabilities.
The numerical results, in terms of the predicted probabilities of the four incident types given different sets of company and incident characteristics, are presented in Table 11 of Section 5.
3.3. Incident-specific loss severity
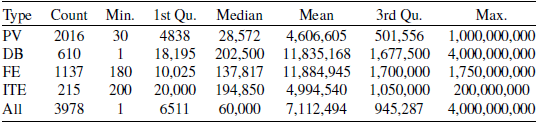
After predicting the occurrence probability of individual incident type, the next step is to model the loss severity conditioning on a given incident type. Therefore, another useful attribute of the dataset is the loss information for each incident. Excluding observations that belong to the “other” category, among all 84,373 incidents that belong to one of the 4 cyber incident categories, there are 3978 observations with known losses. The summary statistics of those losses are shown in Table 4.
Summary statistics of losses by incident type.
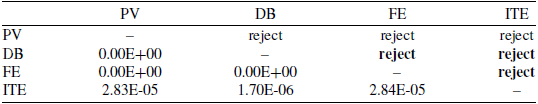
Prior to fitting any reasonable distributions to each conditional loss, it is essential to realize that the conditional loss distributions could be significantly different among cyber incident types. Table 5 shows the pairwise two-sample Kolmogorov–Smirnov (KS) tests on empirical loss distributions among various incident types. The numbers below the diagonal are the p-values of these KS tests. Based on the significance level $0.05$
, a p-value lower than this level suggests that the null hypothesis, that the two empirical samples being compared are from the same underlying distribution, should be rejected. Due to symmetry, the statistical decisions are noted above the diagonal. The result shows that the difference among the conditional losses of the four incident types is statistically significant, and hence there is the necessity of individually modeling each incident type’s loss severity, justifying the incident-specific insurance coverage.
$0.05$
, a p-value lower than this level suggests that the null hypothesis, that the two empirical samples being compared are from the same underlying distribution, should be rejected. Due to symmetry, the statistical decisions are noted above the diagonal. The result shows that the difference among the conditional losses of the four incident types is statistically significant, and hence there is the necessity of individually modeling each incident type’s loss severity, justifying the incident-specific insurance coverage.
Pairwise comparison between empirical distributions of different incident types using pairwise two-sample Kolmogorov–Smirnov test.
In addition, to show that the loss severity distributions are mainly conditional on incident types but not on additional explanatory variables, we performed an ANOVA test with two linear regression models. One is a full model with total loss as the response variable, and with incident type, as well as all explanatory variables summarized in Table 2. The other model is a simple linear regression, and it has the total loss as the response variable, but has incident type as its only explanatory variable. The ANOVA test result, presented in Table 6, shows that the p-value of the test, $0.1447$
, is higher than any common choices of significance level, for example,
$0.1447$
, is higher than any common choices of significance level, for example, $0.05$
,
$0.05$
, $0.01$
, etc. Therefore, we can conclude that the additional explanatory variables in Table 2 for the full model contribute little to the explanation of the variance in losses. This lack of explanatory power could be an artifact of the limited data size, which makes it infeasible to build company-specific severity models, but this situation can potentially be improved by a growing number of cyber incident records.
$0.01$
, etc. Therefore, we can conclude that the additional explanatory variables in Table 2 for the full model contribute little to the explanation of the variance in losses. This lack of explanatory power could be an artifact of the limited data size, which makes it infeasible to build company-specific severity models, but this situation can potentially be improved by a growing number of cyber incident records.
ANOVA test between the full model and the model with only incident type as its explanatory variable.
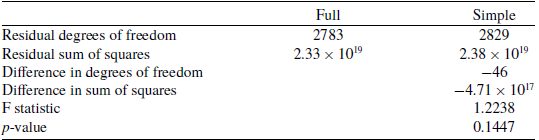
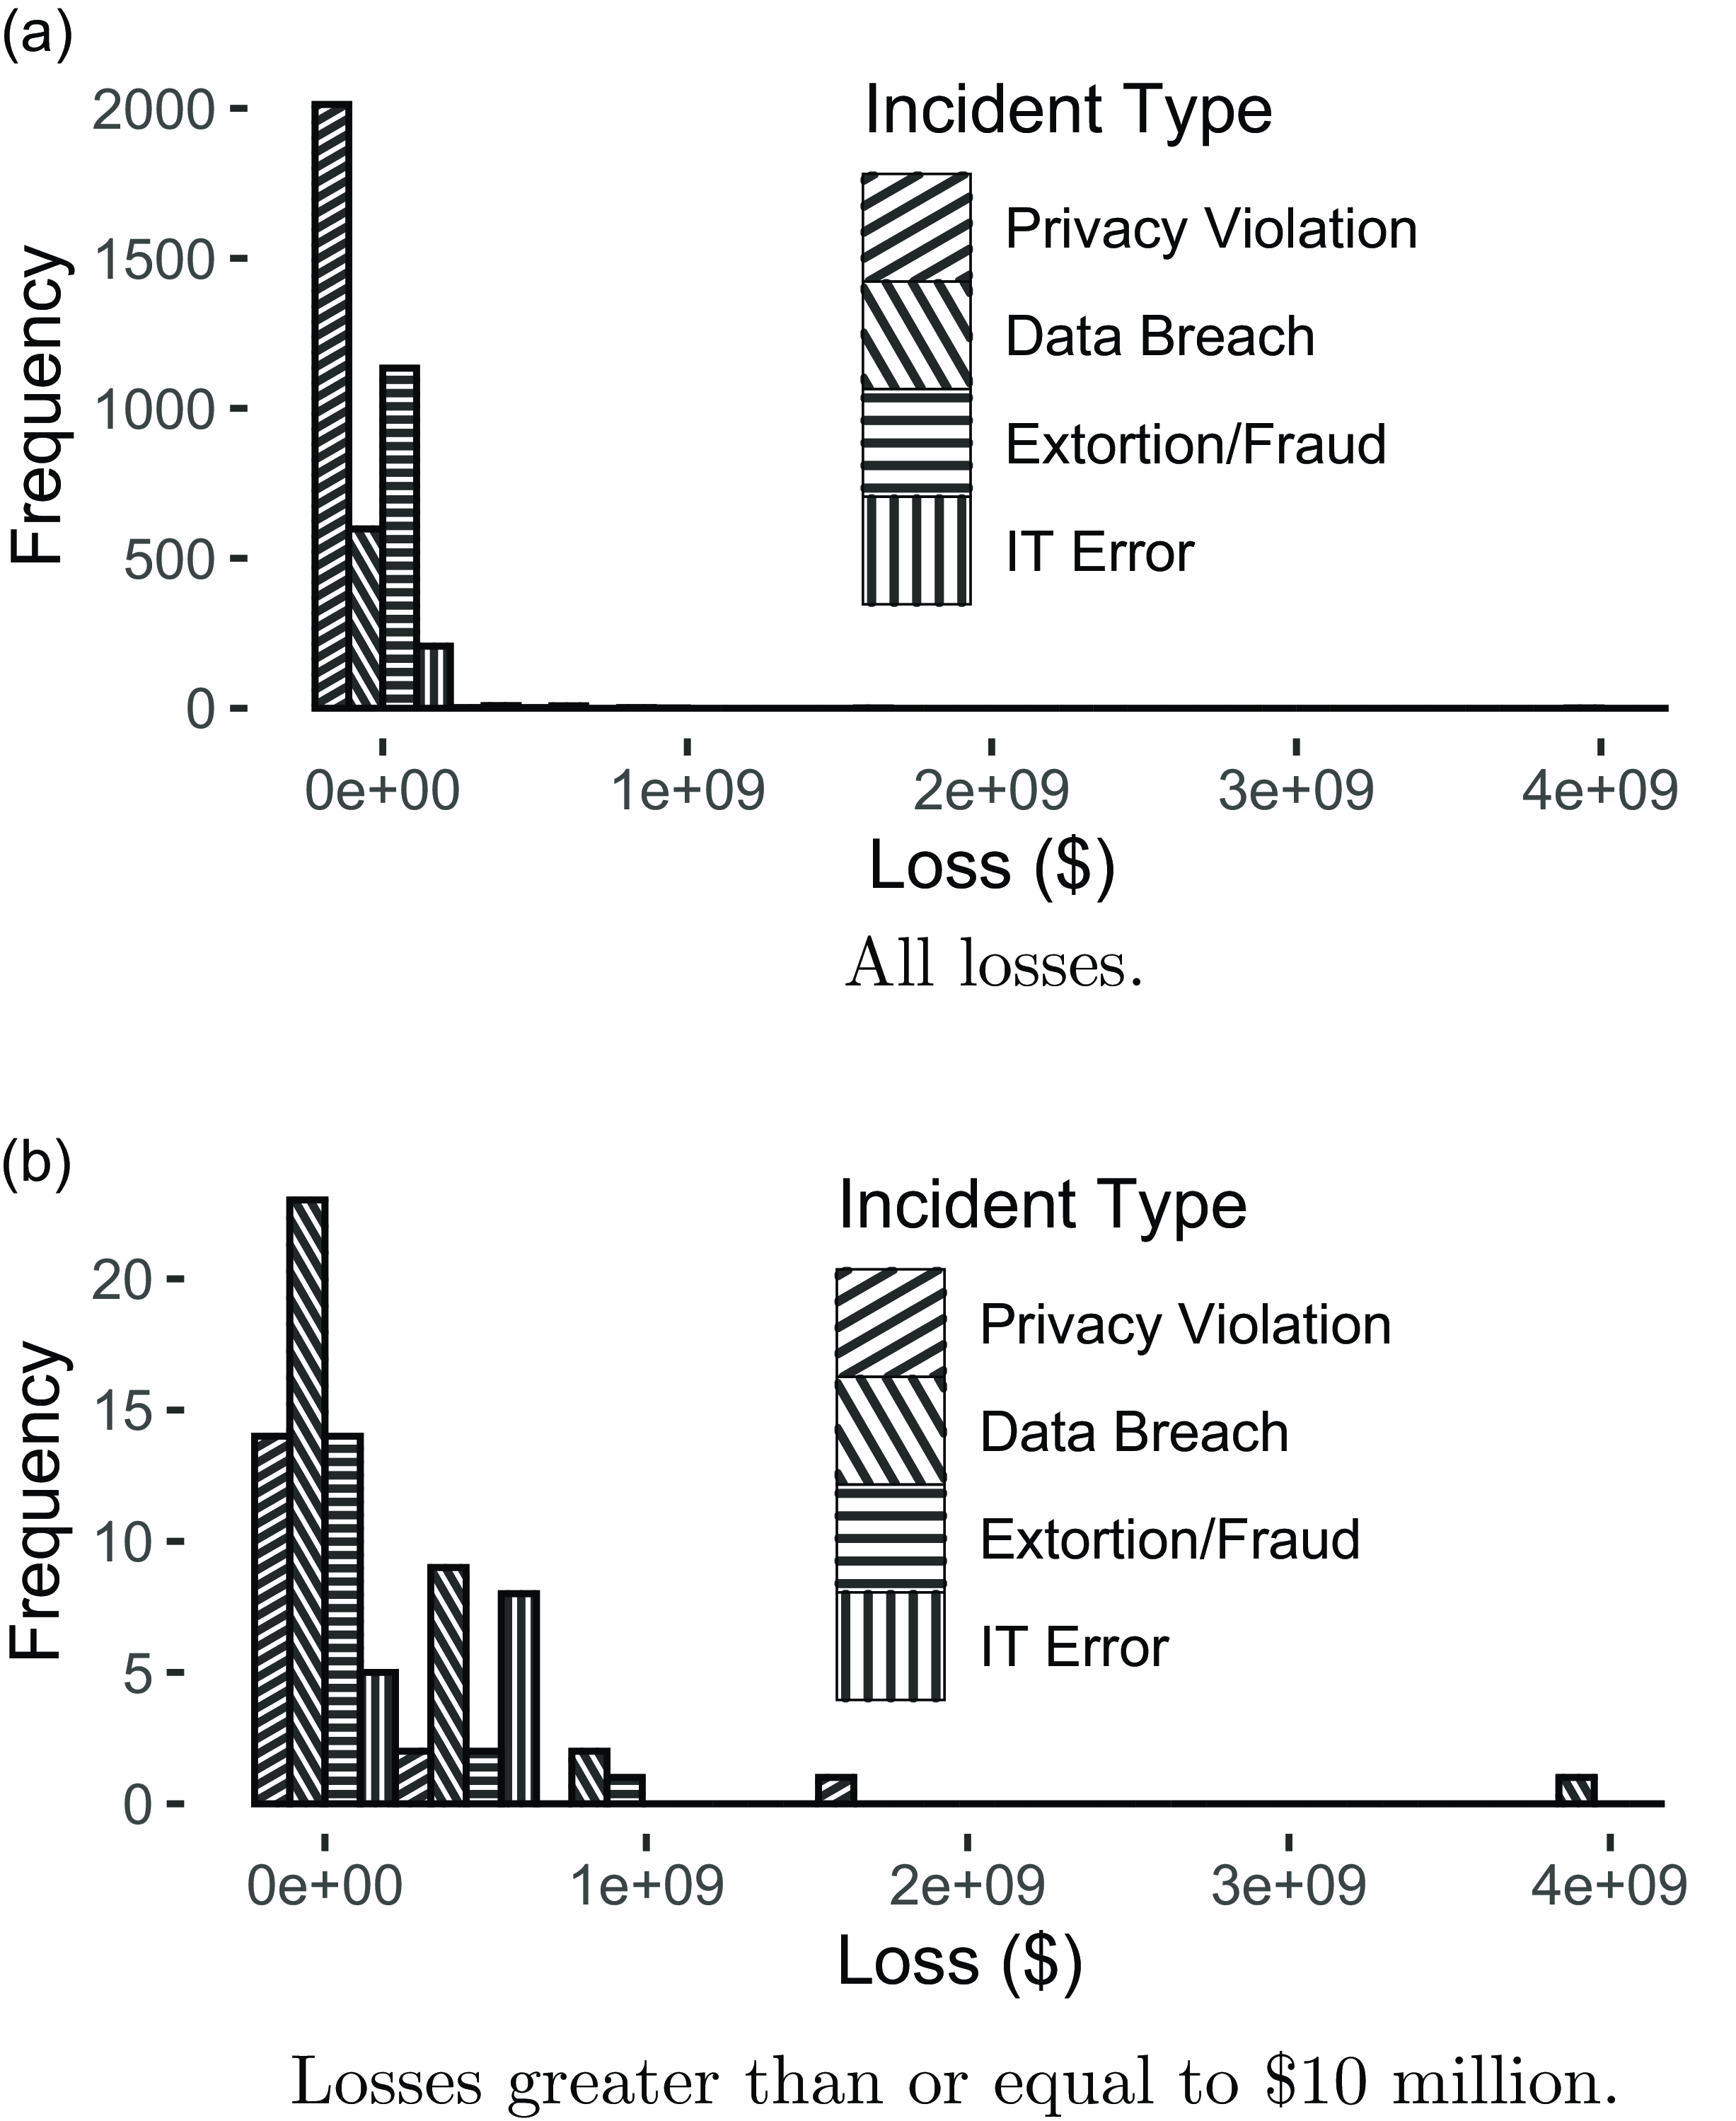
Figure 2 shows that the majority of the cases realize moderately small losses, and a small number of cases realize substantial losses, indicating that the conditional loss distributions of all incident types are likely to be right skewed. Therefore, we explore well-known distributions that could capture such a skewness, namely log normal, exponential, gamma, and Weibull, for each cyber incident type.
The parameters of each distribution are fitted using the maximum likelihood estimation method. All fitted distributions for the same cyber incident type are then compared based on their Akaike information criterion (AIC), which is defined as
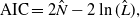 \begin{equation*}\text{AIC} = 2\hat{N} - 2\ln(\hat{L}),\end{equation*}
where $\hat{N}$
is the number of parameters to be estimated, and
$\hat{N}$
is the number of parameters to be estimated, and $\hat{L}$
is the maximum likelihood of the fitted model; a model with a smaller AIC value is better. Table 7 summarizes the best-fitted loss distributions for all cyber incident types. A comparison of the AICs of different fitted distributions is presented in Table D1 of Appendix D.1. The distribution fitting results suggest that it is most appropriate to treat losses of different incident types as log-normal random variables with different log-mean and log-standard-deviation parameters, as given in Table 7.
$\hat{L}$
is the maximum likelihood of the fitted model; a model with a smaller AIC value is better. Table 7 summarizes the best-fitted loss distributions for all cyber incident types. A comparison of the AICs of different fitted distributions is presented in Table D1 of Appendix D.1. The distribution fitting results suggest that it is most appropriate to treat losses of different incident types as log-normal random variables with different log-mean and log-standard-deviation parameters, as given in Table 7.
3.4. Section summary
Thus far, all the necessary model inputs for solving Problem (2.5) are obtained based on a dataset of historical cyber incidents. A brief recapitulation of the key findings in this section is as follows:
-
• In this study, the incident-specific cyber insurance policy would provide coverage for four types of incidents, including privacy violation, data breach, cyber fraud and extortion, and IT errors, that is,
$K=4$
. -
• The occurrence probabilities of individual incident types are specific to each company and incident, and the probability vector
$\boldsymbol{p} = (p_1, p_2, \ldots, p_K)$
is obtained by feeding the selected company and incident features into a trained stacking classifier. This classifier achieves a balanced accuracy score of around 80%, as defined in Equation (3.1), for each incident type, which is superior to all other predictive models surveyed (see Table 3). -
• Incident-specific losses are statistically significant to be different in terms of severity. Additional explanatory variables, apart from the incident type, do not seem crucial for modeling the loss severity. Log-normal distributions provide the best fit for all conditional loss severity with the estimated parameters presented in Table 7.


This section demonstrates the feasibility of obtaining the model inputs necessary to solve Problem (2.5) from real-world data. With approximately 80% balanced accuracy scores associated with predictions of incident types and well-fitted condition loss severity distributions, they are expected to be practical and reliable to proceed to the next step.
Best fitted loss distribution of each incident type.
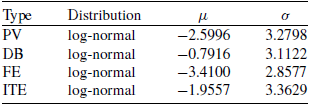
Histogram of losses of different incident types.
4. Solution by cross-entropy method
As discussed before, even with the necessary model inputs to solve Problem (2.5), despite the finite-dimensional minimization problem, it is also combinatorial and, therefore, cannot be solved analytically to derive the Pareto optimal $\boldsymbol{\theta}$
and
$\boldsymbol{\theta}$
and $\boldsymbol{d}$
, which are denoted as
$\boldsymbol{d}$
, which are denoted as $\boldsymbol{\theta}^*$
and
$\boldsymbol{\theta}^*$
and $\boldsymbol{d}^*$
. In this paper, we resort to the cross-entropy method (CEM) proposed in Rubinstein (Reference Rubinstein1999, Reference Rubinstein2001). The following subsection provides a brief review of the CEM adopting our own minimization problem in (2.5).
$\boldsymbol{d}^*$
. In this paper, we resort to the cross-entropy method (CEM) proposed in Rubinstein (Reference Rubinstein1999, Reference Rubinstein2001). The following subsection provides a brief review of the CEM adopting our own minimization problem in (2.5).
4.1. Brief review of cross-entropy method
To simplify the notations, let $\mathbf{z}=\left(\boldsymbol{d}, \boldsymbol{\theta}\right)\in\mathcal{Z}=\mathbb{R}_+^4\times\left\{0,1\right\}^4$
, and simply write the objective function in Problem (2.5) as
$\mathbf{z}=\left(\boldsymbol{d}, \boldsymbol{\theta}\right)\in\mathcal{Z}=\mathbb{R}_+^4\times\left\{0,1\right\}^4$
, and simply write the objective function in Problem (2.5) as $F\left(\mathbf{z}\right)$
(keeping in mind that it depends on the (conditional) distributions of X and O which are model inputs from Section 3). Thus, Problem (2.5) is
$F\left(\mathbf{z}\right)$
(keeping in mind that it depends on the (conditional) distributions of X and O which are model inputs from Section 3). Thus, Problem (2.5) is $\min_{\mathbf{z}\in\mathcal{Z}}F\left(\mathbf{z}\right)$
, with
$\min_{\mathbf{z}\in\mathcal{Z}}F\left(\mathbf{z}\right)$
, with $\mathbf{z}^*\in\mathcal{Z}$
being denoted as its optimal solution.
$\mathbf{z}^*\in\mathcal{Z}$
being denoted as its optimal solution.
The CEM is a numerical method to solve Problem (2.5) by adopting a probabilistic approach, solving the approximation counterpart of $\mathbf{z}^*$
as follows: for any
$\mathbf{z}^*$
as follows: for any $\tau$
being larger but close enough to
$\tau$
being larger but close enough to $F\left(\mathbf{z}^*\right)$
, solve an
$F\left(\mathbf{z}^*\right)$
, solve an $\mathbf{u}^*\left(\tau\right)\in\mathcal{U}$
which maximizes
$\mathbf{u}^*\left(\tau\right)\in\mathcal{U}$
which maximizes $\mathbb{P}\left(F\left(\mathbf{Z}\right)\leq\tau;\,\mathbf{u}\right)$
, where
$\mathbb{P}\left(F\left(\mathbf{Z}\right)\leq\tau;\,\mathbf{u}\right)$
, where $\mathbf{Z}$
follows a distribution with a parametric density function
$\mathbf{Z}$
follows a distribution with a parametric density function $f\left(\mathbf{z};\,\mathbf{u}\right)$
, for
$f\left(\mathbf{z};\,\mathbf{u}\right)$
, for $\mathbf{z}\in\mathcal{Z}$
and
$\mathbf{z}\in\mathcal{Z}$
and $\mathbf{u}\in\mathcal{U}$
, and
$\mathbf{u}\in\mathcal{U}$
, and $\mathcal{U}$
is the parameter set for the distributions of
$\mathcal{U}$
is the parameter set for the distributions of $\mathbf{Z}$
under consideration. Without knowing
$\mathbf{Z}$
under consideration. Without knowing $\mathbf{z}^*$
, the level
$\mathbf{z}^*$
, the level $\tau$
in this approximation counterpart could not be chosen appropriately. The CEM then proposes a two-phase approach to construct a sequence
$\tau$
in this approximation counterpart could not be chosen appropriately. The CEM then proposes a two-phase approach to construct a sequence $\left\{\left(\hat{\tau}_t,\hat{\mathbf{u}}_t\right)\right\}_{t=1}^{\infty}$
such that it will converge to an
$\left\{\left(\hat{\tau}_t,\hat{\mathbf{u}}_t\right)\right\}_{t=1}^{\infty}$
such that it will converge to an $\left(\hat{\tau},\hat{\mathbf{u}}\right)$
, where
$\left(\hat{\tau},\hat{\mathbf{u}}\right)$
, where $\left(\hat{\tau},\hat{\mathbf{u}}\right)$
is close to
$\left(\hat{\tau},\hat{\mathbf{u}}\right)$
is close to $\left(F\left(\mathbf{z}^*\right),\mathbf{u}^*\right)$
, and thus serves as an approximation for the unknown
$\left(F\left(\mathbf{z}^*\right),\mathbf{u}^*\right)$
, and thus serves as an approximation for the unknown $\left(F\left(\mathbf{z}^*\right),\mathbf{u}^*\right)$
, and where
$\left(F\left(\mathbf{z}^*\right),\mathbf{u}^*\right)$
, and where $\mathbf{u}^*\in\mathcal{U}$
such that
$\mathbf{u}^*\in\mathcal{U}$
such that $f\left(\cdot;\,\mathbf{u}^*\right)$
is the corresponding Dirac density of the Dirac delta distribution
$f\left(\cdot;\,\mathbf{u}^*\right)$
is the corresponding Dirac density of the Dirac delta distribution $\delta_{\mathbf{z}^*}$
.
$\delta_{\mathbf{z}^*}$
.
The main steps of the two-phase construction are as follows. Initialize an $\hat{\mathbf{u}}_0\in\mathcal{U}$
, and let t iterate through
$\hat{\mathbf{u}}_0\in\mathcal{U}$
, and let t iterate through $1,2,\ldots$
with
$1,2,\ldots$
with $\left(\hat{\tau}_t,\hat{\mathbf{u}}_t\right)$
being updated in each iteration. The
$\left(\hat{\tau}_t,\hat{\mathbf{u}}_t\right)$
being updated in each iteration. The $\hat{\tau}_t$
, for
$\hat{\tau}_t$
, for $t=1,2,\ldots$
, is defined as the
$t=1,2,\ldots$
, is defined as the $\varrho$
-th quantile of the sample drawn from the distribution
$\varrho$
-th quantile of the sample drawn from the distribution $f\left(\cdot;\,\hat{\mathbf{u}}_{t-1}\right)$
, where
$f\left(\cdot;\,\hat{\mathbf{u}}_{t-1}\right)$
, where $\varrho\in\left(0,1\right)$
is close to 0 but is moderately small and uniform for all
$\varrho\in\left(0,1\right)$
is close to 0 but is moderately small and uniform for all $t=1,2,\ldots$
; in turn, the
$t=1,2,\ldots$
; in turn, the $\hat{\mathbf{u}}_t$
, for
$\hat{\mathbf{u}}_t$
, for $t=1,2,\ldots$
, is defined as the maximizer of the following problem:
$t=1,2,\ldots$
, is defined as the maximizer of the following problem:
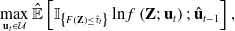 \begin{equation}\max_{\mathbf{u}_t\in\mathcal{U}}\hat{\mathbb{E}}\left[\mathbb{I}_{\left\{F\left(\mathbf{Z}\right)\leq\hat{\tau}_t\right\}}\ln f\left(\mathbf{Z};\,\mathbf{u}_t\right);\,\hat{\mathbf{u}}_{t-1}\right],\end{equation}
where $\hat{\mathbb{E}}\left[\cdot;\,\hat{\mathbf{u}}_{t-1}\right]$
represents the estimated mean of the same sample drawn from the distribution
$\hat{\mathbb{E}}\left[\cdot;\,\hat{\mathbf{u}}_{t-1}\right]$
represents the estimated mean of the same sample drawn from the distribution $f\left(\cdot;\,\hat{\mathbf{u}}_{t-1}\right)$
. This two-phase update repeats itself until the estimated variance of the next sample drawn from the updated distribution
$f\left(\cdot;\,\hat{\mathbf{u}}_{t-1}\right)$
. This two-phase update repeats itself until the estimated variance of the next sample drawn from the updated distribution $f\left(\cdot;\,\hat{\mathbf{u}}_{t}\right)$
is small enough and the
$f\left(\cdot;\,\hat{\mathbf{u}}_{t}\right)$
is small enough and the $\hat{\tau}_t$
does not change from those in the last few update steps (see Benham et al., Reference Benham, Duan, Kroese and Liquet2017). Therefore, the main idea of the construction is to first estimate an unknown level
$\hat{\tau}_t$
does not change from those in the last few update steps (see Benham et al., Reference Benham, Duan, Kroese and Liquet2017). Therefore, the main idea of the construction is to first estimate an unknown level $\hat{\tau}_t$
being larger but close enough to
$\hat{\tau}_t$
being larger but close enough to $F\left(\mathbf{z}^*\right)$
as it is the
$F\left(\mathbf{z}^*\right)$
as it is the $\varrho$
-th sample quantile with
$\varrho$
-th sample quantile with $\varrho$
being close to 0 using the parameter
$\varrho$
being close to 0 using the parameter $\hat{\mathbf{u}}_{t-1}$
, and second, to estimate a parameter
$\hat{\mathbf{u}}_{t-1}$
, and second, to estimate a parameter $\hat{\mathbf{u}}_t$
such that the event
$\hat{\mathbf{u}}_t$
such that the event $\left\{F\left(\mathbf{Z}\right)\leq\hat{\tau}_t\right\}$
with
$\left\{F\left(\mathbf{Z}\right)\leq\hat{\tau}_t\right\}$
with $\mathbf{Z}\sim f\left(\cdot;\,\hat{\mathbf{u}}_{t}\right)$
is much more likely to happen, compared to the case that
$\mathbf{Z}\sim f\left(\cdot;\,\hat{\mathbf{u}}_{t}\right)$
is much more likely to happen, compared to the case that $\mathbf{Z}\sim f\left(\cdot;\,\hat{\mathbf{u}}_{t-1}\right)$
when its likelihood is given by a moderately small
$\mathbf{Z}\sim f\left(\cdot;\,\hat{\mathbf{u}}_{t-1}\right)$
when its likelihood is given by a moderately small $\varrho$
, so to sequentially maximize
$\varrho$
, so to sequentially maximize $\mathbb{P}\left(F\left(\mathbf{Z}\right)\leq\hat{\tau}_t;\,\mathbf{u}_{t}\right)$
. In the second phase, the estimated parameter
$\mathbb{P}\left(F\left(\mathbf{Z}\right)\leq\hat{\tau}_t;\,\mathbf{u}_{t}\right)$
. In the second phase, the estimated parameter $\hat{\mathbf{u}}_t$
is to minimize the cross-entropy between the unknown optimal density, for importance sampling, and a reference density in the same parametric family; this is equivalent to maximizing (4.1).
$\hat{\mathbf{u}}_t$
is to minimize the cross-entropy between the unknown optimal density, for importance sampling, and a reference density in the same parametric family; this is equivalent to maximizing (4.1).
Note that in solving (4.1), only the observations in the sample drawn from the distribution $f\left(\cdot;\,\hat{\mathbf{u}}_{t-1}\right)$
satisfying the event condition,
$f\left(\cdot;\,\hat{\mathbf{u}}_{t-1}\right)$
satisfying the event condition, $F\left(\mathbf{Z}\right)\leq\hat{\tau}_t$
, are useful to calculate its objective; this motivates the introduction of an elite sample consisting of observations in the original sample satisfying the condition. Algorithm 1 provides the pseudo-code of the CEM.
$F\left(\mathbf{Z}\right)\leq\hat{\tau}_t$
, are useful to calculate its objective; this motivates the introduction of an elite sample consisting of observations in the original sample satisfying the condition. Algorithm 1 provides the pseudo-code of the CEM.
Cross-Entropy Method
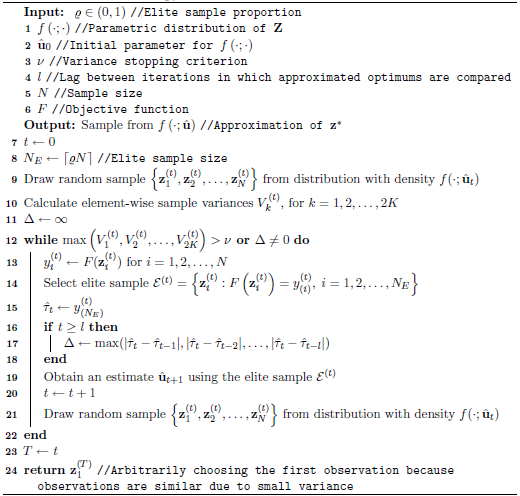
4.2. Implementation considerations and results
The actual implementation of this optimization problem consists of two parts, including computing the objective function and implementing the CEM.
The objective function is the sum of the VaRs of both parties. As suggested by Equations (2.6) and (2.7), the distribution of either the buyer’s or the seller’s loss random variable is a mixture of distributions of incident-specific losses, and the mixture distribution has no closed-form quantile function that returns the VaR of concern easily. Therefore, relying on the mixture distribution function, we adopted a lookup approach to numerically find a point that satisfies Equation (2.3) on a fine grid. In this study, risk tolerance levels of the seller and the buyer are set at $\alpha=0.95$
and
$\alpha=0.95$
and $\beta=0.9$
, respectively.
$\beta=0.9$
, respectively.
Although the CEM has a guaranteed asymptotic convergence (see, for example, Rubinstein, Reference Rubinstein2002; Margolin, Reference Margolin2005), the number of iterations needed to meet the stopping criteria is uncertain because of the randomness introduced during the sampling processes. Therefore, a common approach to addressing this issue in algorithm implementation is adding additional stopping rules to ensure that the running time of optimization tasks is manageable. Typical rules may include enforcing a maximum number of iterations and assuming convergence if the value of the objective function has not experienced a large enough improvement for a predefined number of iterations. These rules, along with the randomness in sampling, cause the algorithm in our implementation to not always converge timely and not always stop at the same value. As suggested by Benham et al. (Reference Benham, Duan, Kroese and Liquet2017), the optimization process shall be repeated several times for quality investigation and assurance. Hence, for each set of incident probabilities predicted based on certain company and incident characteristics, we ran 50 trials of the CEM to solve the optimization with different random seeds, while holding other specifications constant (see Appendix C). Results from all trials are stored for further analysis.
Table 9 shows the results of five out of those 50 trials. Trial 5 converged to an “optimum” larger than that achieved by Trial 1, suggesting that the algorithm could possibly stop at a non-optimal point. This highlights the necessity of multiple trials. Another observation is that, although most of the trials reach a converging state after a few numbers of iterations (see, e.g., Trials 1, 4, and 5), there exist initial random states that cause the program to fail to meet the convergence criteria when the preset maximum number of iterations is reached, for example, Trials 2 and 3. Unless reducing the maximum number of iterations at the risk of more non-convergent trials, the great gap between numbers of iterations needed by different trials brings the challenge that even in a multiprocessing environment, congestion occurs when computational resources are occupied by those long-running trials, making solving the optimization problem with repeating trials time consuming.
Descriptive statistics on the number of seconds (s) spent on finding the optimal insurance design using the CEM.
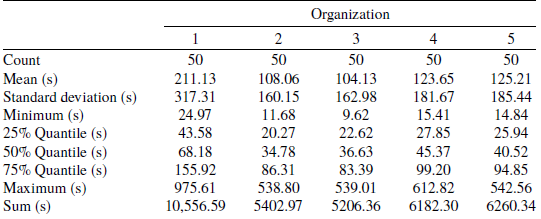
Results of five trials of CEM with the same set of predicted incident probabilities.
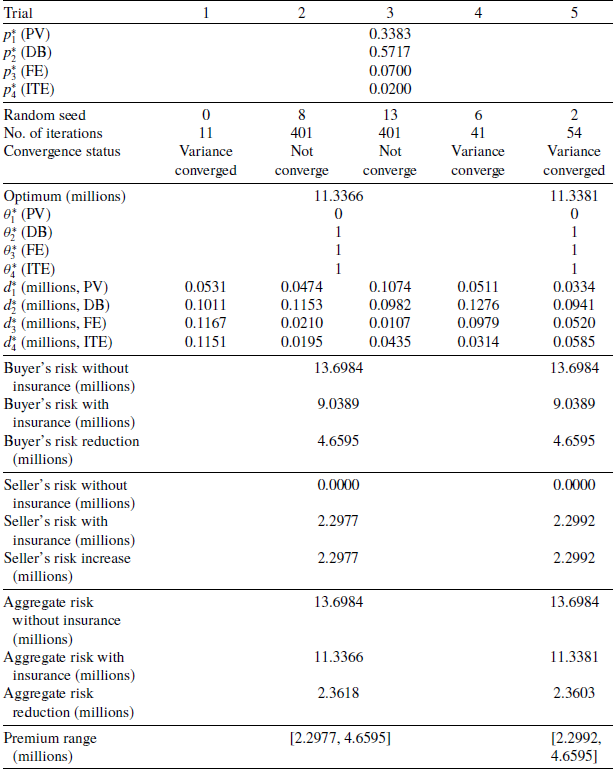
Table 8 shows the amount of time spent on finding optimal insurance designs for 5 individual organizations using the CEM. The computation is done on 4 IBM POWER9 CPU cores. For each company, it takes around 2 min to complete each trial. Given that we ran 50 trials for each company, the running time generally could easily exceed an hour.
Other than the long running time problem, the solution to the minimization problem in Equation (2.5) is not unique, as presented in Asimit et al. (Reference Asimit, Boonen, Chi and Chong2021) for the case of two incident types. The value of each element of $\boldsymbol{d}^*$
could lie in some intervals, composed of points that result in the same minimum. Table 9 shows that although both Trial 1 and 4 reached the converging state and attained the same minimum, their solutions,
$\boldsymbol{d}^*$
could lie in some intervals, composed of points that result in the same minimum. Table 9 shows that although both Trial 1 and 4 reached the converging state and attained the same minimum, their solutions, $\boldsymbol{d}^*$
in particular, differ. Nevertheless, the results provide common ground for insurers and policyholders in designing an incident-specific cyber insurance contract. As shown in Table 9, based on the company’s own characteristics and the risk preferences of the company and the insurer, both parties should agree that in comprehensive cyber insurance covering PV, DB, FE, and ITE, a policy limit should be implemented for PV, whereas deductibles should be applied to other incident-specific coverages, since
$\boldsymbol{d}^*$
in particular, differ. Nevertheless, the results provide common ground for insurers and policyholders in designing an incident-specific cyber insurance contract. As shown in Table 9, based on the company’s own characteristics and the risk preferences of the company and the insurer, both parties should agree that in comprehensive cyber insurance covering PV, DB, FE, and ITE, a policy limit should be implemented for PV, whereas deductibles should be applied to other incident-specific coverages, since $\boldsymbol{\theta}^*=\left(0,1,1,1\right)$
. While holding the risk of both parties unchanged, deductible, and limit amounts can be negotiated for other possible considerations, one of which is discussed in the next section.
$\boldsymbol{\theta}^*=\left(0,1,1,1\right)$
. While holding the risk of both parties unchanged, deductible, and limit amounts can be negotiated for other possible considerations, one of which is discussed in the next section.
Despite the computational challenges and nonunique solutions, the benefit of such an incident-specific insurance contract is readily seen from the comparison between the risks taken by both parties with and without insurance. In the following, refer to Trials 1–4. If the company chooses not to buy an incident-specific policy specified in Table 9, it will take the risk of $13.6984 million. If it chooses to get covered, the appropriate amount of premium $\pi$
(in millions) paid by the buyer should satisfy
$\pi$
(in millions) paid by the buyer should satisfy $\$2.2977 \le \pi \le \$4.6595$
according to Inequality (2.2) and that will yield a risk reduction of $4.6595 million, which is always greater than the paid premium. From the insurer’s perspective, the insurance contract will bring a risk of $2.2977 million, but that will be fully compensated by the collected premium. As a result, both parties are mutually benefited in their own objectives; their aggregate risk is reduced by $2.3618 million, from $13.6984 million to $11.3366 million, which could be effective if the premium is agreed to be lower than the reduced aggregate risk in its range; that is,
$\$2.2977 \le \pi \le \$4.6595$
according to Inequality (2.2) and that will yield a risk reduction of $4.6595 million, which is always greater than the paid premium. From the insurer’s perspective, the insurance contract will bring a risk of $2.2977 million, but that will be fully compensated by the collected premium. As a result, both parties are mutually benefited in their own objectives; their aggregate risk is reduced by $2.3618 million, from $13.6984 million to $11.3366 million, which could be effective if the premium is agreed to be lower than the reduced aggregate risk in its range; that is, $\$2.2977 \le \pi \le \$2.3618 \le \$4.6595$
(in millions). Again, note that the premium discussed in this paper is derived economically and could be actuarially priced in the insurance practice.
$\$2.2977 \le \pi \le \$2.3618 \le \$4.6595$
(in millions). Again, note that the premium discussed in this paper is derived economically and could be actuarially priced in the insurance practice.
4.3. Results under TVaR-VaR preferences
Table 10 shows the results of optimal risk sharing between the insurance seller and buyer under TVaR-VaR preferences, as described in Section 2.3. The results are compared to the optimum attained under the VaR-VaR preferences as shown in Table 9 with the same set of model inputs except for the risk levels. As mentioned in Section 2.3, when the VaR-preference party has a lower risk level than the TVaR-preference party, the VaR-preference party will take all the risks. Therefore, to demonstrate a nontrivial case, the buyer’s risk level is raised to $\beta = 0.99$
, the seller’s risk level is set to
$\beta = 0.99$
, the seller’s risk level is set to $\alpha = 0.80$
, and the aggregate risk is shared between the buyer and the seller.
$\alpha = 0.80$
, and the aggregate risk is shared between the buyer and the seller.
Comparisons between the risk-sharing results of different choices of risk measures.
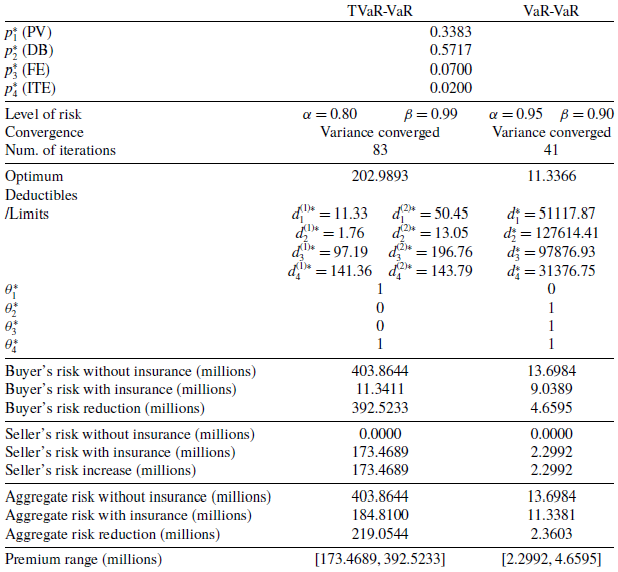
5. Function approximation
In Section 4.2, two computational challenges are discussed in the implementation of the optimization algorithm, including the numerical evaluation of quantiles of loss random variables and random states that lead to non-convergent trials. Both challenges induce a long running time and could make this policy design less practical in the production environment. To speed up the computation process, we make use of function approximation to find a target function, which establishes a more direct mapping between incident properties, including their occurrence probabilities and severities, and the parameters of the eventual indemnity functions in the incident-specific policy. Note that in this study, the distribution parameters of the incident severities are fixed and only the probabilities vary depending on company characteristics; therefore, speaking more precisely, the mapping is only between incident probabilities and indemnity function parameters.
In this section, we distinguish between true solutions, which are obtained by using CEM to approximately solve Problem (2.5), and fitted solutions, which are obtained through function approximation. By using fitted solutions to approximate true solutions, such that the fitted solutions result in the same optimum in Problem (2.5) as the true solutions, the end goal is that once a company’s characteristics are fed into the trained stacking classifier built in Section 2, the corresponding probability vector can be used as inputs of the approximate function to generate the parameters of the optimal incident-specific cyber insurance, that is, $\boldsymbol{\hat{\theta}}$
and
$\boldsymbol{\hat{\theta}}$
and $\hat{\boldsymbol{d}}$
.
$\hat{\boldsymbol{d}}$
.
5.1. Sample selection
Provided that the true solutions to Problem (2.5) are nonunique, as shown in Section 4, the mapping between $\boldsymbol{p}$
and
$\boldsymbol{p}$
and $\left(\boldsymbol{\theta}^*,\boldsymbol{d}^*\right)$
is one-to-many. This could potentially lead to a lack of fit and suboptimal fitted solutions. The suboptimality is a result of the fact that the true solutions of individual
$\left(\boldsymbol{\theta}^*,\boldsymbol{d}^*\right)$
is one-to-many. This could potentially lead to a lack of fit and suboptimal fitted solutions. The suboptimality is a result of the fact that the true solutions of individual $d^*_k$
, for
$d^*_k$
, for $k = 1,\ldots, K$
, are on disjoint intervals on the real line (see Asimit et al. Reference Asimit, Boonen, Chi and Chong2021), but the function approximation process can can easily disregard that premise if, with respect to the same set of probabilities, the divergence between the fitted solution and all true solutions, for example, mean squared error or mean absolute error, is to be minimized because the fitted value could plausibly be outside the intervals where the true solutions reside in.
$k = 1,\ldots, K$
, are on disjoint intervals on the real line (see Asimit et al. Reference Asimit, Boonen, Chi and Chong2021), but the function approximation process can can easily disregard that premise if, with respect to the same set of probabilities, the divergence between the fitted solution and all true solutions, for example, mean squared error or mean absolute error, is to be minimized because the fitted value could plausibly be outside the intervals where the true solutions reside in.
Therefore, instead of looking for a fitted solution with the smallest average deviation from all true solutions, it is more guaranteed to find an optimal fitted solution close to one of the true solutions. In this study, to identify a unique true solution, we choose the one that minimizes the seller’s expected loss among nonunique true solutions. That is, the solution selected for function approximation is, therefore, ${\arg \min}_{(\boldsymbol{d}, \boldsymbol{\theta}) \in \mathcal{S}} \mathbb{E}L_s(\boldsymbol{d}, \boldsymbol{\theta};\, X, O) $
, where
${\arg \min}_{(\boldsymbol{d}, \boldsymbol{\theta}) \in \mathcal{S}} \mathbb{E}L_s(\boldsymbol{d}, \boldsymbol{\theta};\, X, O) $
, where $\mathcal{S}$
is the set of Pareto optimal
$\mathcal{S}$
is the set of Pareto optimal $\left(\boldsymbol{\theta}^*,\boldsymbol{d}^*\right)$
computed by the CEM. This strategy serves as an illustration of how a unique true solution can be chosen based on additional preferences, while in practice, alternative preferences can be used to compare among the nonunique solutions to Problem (2.5) and choose the best one.
$\left(\boldsymbol{\theta}^*,\boldsymbol{d}^*\right)$
computed by the CEM. This strategy serves as an illustration of how a unique true solution can be chosen based on additional preferences, while in practice, alternative preferences can be used to compare among the nonunique solutions to Problem (2.5) and choose the best one.
5.2. Function approximation procedure
Because $\boldsymbol{d}$
depends on
$\boldsymbol{d}$
depends on $\boldsymbol{\theta}$
, the function approximation follows a two-step process. The relationship between probabilities
$\boldsymbol{\theta}$
, the function approximation follows a two-step process. The relationship between probabilities $\boldsymbol{p}$
and the types of indemnities
$\boldsymbol{p}$
and the types of indemnities $\boldsymbol{\theta}$
is first approximated, for which
$\boldsymbol{\theta}$
is first approximated, for which $\boldsymbol{p}$
are seen as are seen as features, and
$\boldsymbol{p}$
are seen as are seen as features, and $\boldsymbol{\theta}$
are seen as labels. Because each
$\boldsymbol{\theta}$
are seen as labels. Because each $\theta_k$
, for
$\theta_k$
, for $k = 1,\ldots, K$
, takes the value of either 0 or 1 and is not mutually exclusive, predicting
$k = 1,\ldots, K$
, takes the value of either 0 or 1 and is not mutually exclusive, predicting $\boldsymbol{\theta}$
is a multi-label classification problem. Then, multi-label classification problem. Then, conditioning on
$\boldsymbol{\theta}$
is a multi-label classification problem. Then, multi-label classification problem. Then, conditioning on $\boldsymbol{\theta}$
, the mapping the mapping between probabilities
$\boldsymbol{\theta}$
, the mapping the mapping between probabilities $\boldsymbol{p}$
and the amounts of incident-specific deductibles or limits
$\boldsymbol{p}$
and the amounts of incident-specific deductibles or limits $\boldsymbol{d}$
shall be limits
$\boldsymbol{d}$
shall be limits $\boldsymbol{d}$
shall be approximated, and this is a multi-output regression problem. Because there are
$\boldsymbol{d}$
shall be approximated, and this is a multi-output regression problem. Because there are $2^K$
distinct values of
$2^K$
distinct values of $\boldsymbol{\theta}$
, the number of regression models to build is
$\boldsymbol{\theta}$
, the number of regression models to build is $2^K$
. The target function to be approximated then consists of both the classification model and the conditional regression models.
$2^K$
. The target function to be approximated then consists of both the classification model and the conditional regression models.
Let $G \colon (0,1)^K \rightarrow \{0,1\}^K$
be the classifier and
$G \colon (0,1)^K \rightarrow \{0,1\}^K$
be the classifier and $H_{\boldsymbol{\theta}} \colon (0,1)^K \rightarrow \mathbb{R}_+^K$
be the conditional regression models depending on
$H_{\boldsymbol{\theta}} \colon (0,1)^K \rightarrow \mathbb{R}_+^K$
be the conditional regression models depending on $\boldsymbol{\theta}$
. In addition, the sample created in Section Section 5.1 is split into a training set
$\boldsymbol{\theta}$
. In addition, the sample created in Section Section 5.1 is split into a training set $\{(\boldsymbol{p}_s;\,\boldsymbol{\theta}^*_s, \boldsymbol{d}^*_s)\}_{s=1}^{S_1}$
and a test set
$\{(\boldsymbol{p}_s;\,\boldsymbol{\theta}^*_s, \boldsymbol{d}^*_s)\}_{s=1}^{S_1}$
and a test set $\{(\boldsymbol{p}_{S_1+s};\,\boldsymbol{\theta}^*_{S_1+s}, \boldsymbol{d}^*_{S_1+s})\}_{s=1}^{S_2}$
, where
$\{(\boldsymbol{p}_{S_1+s};\,\boldsymbol{\theta}^*_{S_1+s}, \boldsymbol{d}^*_{S_1+s})\}_{s=1}^{S_2}$
, where $S_1$
and
$S_1$
and $S_2$
are the sizes of the two sets, respectively. The function approximation procedure can be summarized in Algorithm 2.
$S_2$
are the sizes of the two sets, respectively. The function approximation procedure can be summarized in Algorithm 2.
Function Approximation: Model training and testing
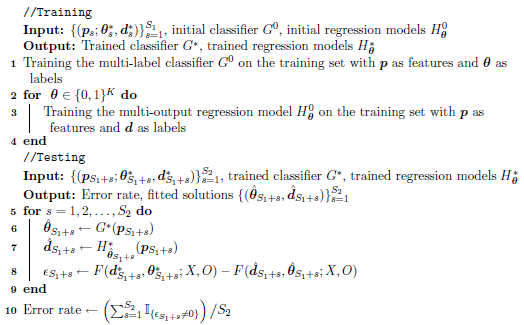
For the evaluation of the fitted solutions produced on the test set, error is defined as the difference between the values of the objective function in Problem (2.5) when true solutions and fitted solutions are provided, respectively, that is, ${\epsilon_s = F(\boldsymbol{d}^*_s, \boldsymbol{\theta}^*_s;\, X, O) - F(\hat{\boldsymbol{d}}_s, \boldsymbol{\hat{\theta}}_s;\, X, O)}$
. The
${\epsilon_s = F(\boldsymbol{d}^*_s, \boldsymbol{\theta}^*_s;\, X, O) - F(\hat{\boldsymbol{d}}_s, \boldsymbol{\hat{\theta}}_s;\, X, O)}$
. The $\boldsymbol{\hat{\theta}}_s;\, X, O)$
. The error rate is used as a performance measure of the target function, which represents the ratio of predictions made on the test set resulting in the same optimums as true solutions.
$\boldsymbol{\hat{\theta}}_s;\, X, O)$
. The error rate is used as a performance measure of the target function, which represents the ratio of predictions made on the test set resulting in the same optimums as true solutions.
5.3. Numerical results
For each distinct set of probabilities $\boldsymbol{p}$
, 50 corresponding true solutions are computed using the CEM, each of which has a different random state, and then among them, a unique true solution, which minimizes the seller’s expected loss, is selected for the sample in function approximation.
$\boldsymbol{p}$
, 50 corresponding true solutions are computed using the CEM, each of which has a different random state, and then among them, a unique true solution, which minimizes the seller’s expected loss, is selected for the sample in function approximation.
The computation of individual optimization tasks with specifications as shown in Appendix C is parallelized on 96 CPU cores. During each 24-h wall-clock time, the average number of unique true solutions that can be generated is around 790. This computationally intense process highlights the necessity of the use of function approximation in practice. For both the classification and regression tasks, we build tree-based models using the LightGBM framework (see Ke et al. Reference Ke, Meng, Finley, Wang, Chen, Ma, Ye and Liu2017), with a training set of size 2201. Table 11 shows the fitted solutions of five organizations, provided their organizational characteristics.
This table summarizes multiple aspects of the workflow proposed in this paper. First, there are indeed different optimal incident-specific insurance designs for organizations of distinct characteristics. The presented organizations vary in litigation history, size, ownership, location, and industry. These characteristics can be used as rating factors in the underwriting process, and the insurer should be able to conveniently collect these pieces of information on the insurance buyer. This result validates the practice of coverage being designed in an incident-specific manner.
Comparisons between exact solutions solved by the CEM and fitted solutions by function approximation.
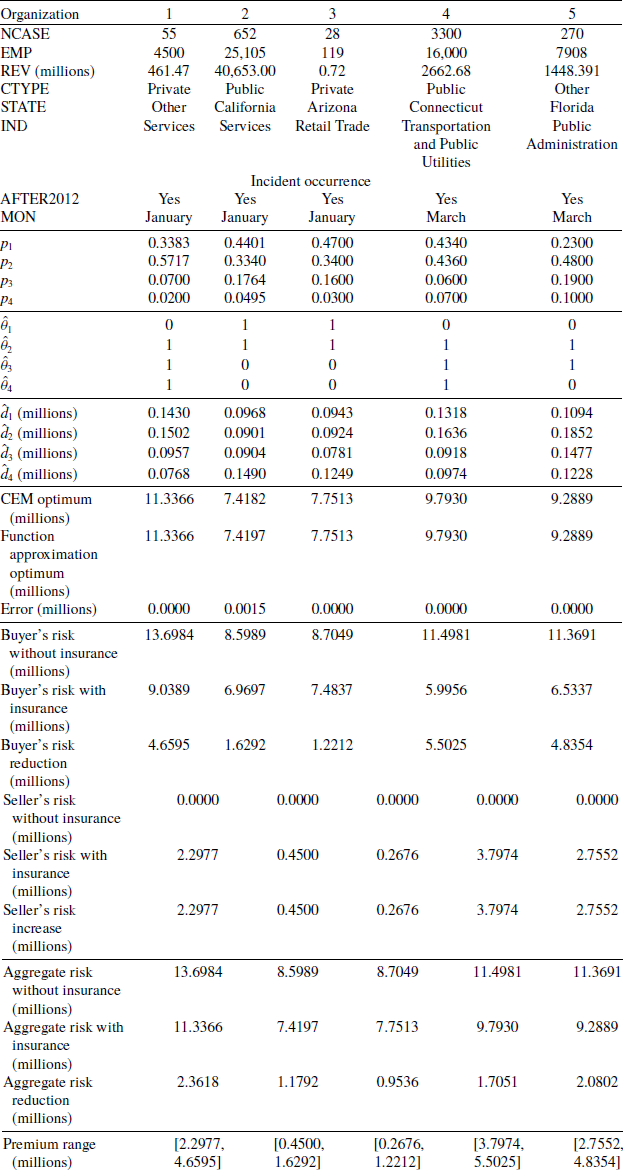
Second, similar to the results shown in Table 9 of Subsection 4.2, Table 11 demonstrates how both the insured and the insurer can mutually benefit from an incident-specific cyber policy. Indeed, Organization 1 is the same organization used to derive the results in Table 9, and the numbers regarding risks with and without insurance and the premium range are identical in both tables. We shall relegate readers to Subsection 4.2 for a detailed account of the policy being mutually beneficial to both parties. In addition, the same conclusion can be drawn from the other four organizations presented in Table 11, suggesting that the proposed incident-specific policy can offer such a benefit to organizations of different characteristics. However, Table 11 shows that the effectiveness of aggregate cyber risk reduction does not always hold. A risk-sharing arrangement that satisfies the inequalities in Equation (2.2), and thus ensures that the risk-sharing is rational, can be ineffective. Specifically, the scenario where no rational premium can be effective happens when the indemnity functions satisfy that
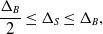 \begin{equation*} \frac{\Delta_B}{2} \leq \Delta_S \leq \Delta_B,\end{equation*}
where $\Delta_B = \rho_B\left(X\right)-\rho_B\left(\sum_{k=1}^K R_k(X)\mathbb{I}_{\{O=k\}}\right)$
and
$\Delta_B = \rho_B\left(X\right)-\rho_B\left(\sum_{k=1}^K R_k(X)\mathbb{I}_{\{O=k\}}\right)$
and $\Delta_S = \rho_S\left(\sum_{k=1}^K I_k(X)\mathbb{I}_{\{O=k\}}\right)$
represent the buyer’s reduction in risk and the seller’s risk increase by the risk sharing, respectively. Indeed, while the premiums to be charged for Organizations 1, 2, and 3 could be lower than their respective aggregate cyber risk reductions, the premiums to be charged for Organizations 4 and 5 must be larger than their respective aggregate risk reductions.
$\Delta_S = \rho_S\left(\sum_{k=1}^K I_k(X)\mathbb{I}_{\{O=k\}}\right)$
represent the buyer’s reduction in risk and the seller’s risk increase by the risk sharing, respectively. Indeed, while the premiums to be charged for Organizations 1, 2, and 3 could be lower than their respective aggregate cyber risk reductions, the premiums to be charged for Organizations 4 and 5 must be larger than their respective aggregate risk reductions.
Lastly, in most cases, the target function can produce solutions that yield exactly the same optimum as the true solutions generated by the CEM. A small percentage of the fitted solutions are non-optimal; see, for example, Organization 2. This problem can potentially be mitigated by employing a larger training set to train the target function. Overall, an error rate of $0.22$
on the test set of size 790 is attained. That is, 78% of the fitted solutions result in the same optimal risks as those given by the true solutions. The slight compromise in accuracy leads to high computational efficiency. For a test set of size 5, the time needed for computing the fitted solutions is approximately
$0.22$
on the test set of size 790 is attained. That is, 78% of the fitted solutions result in the same optimal risks as those given by the true solutions. The slight compromise in accuracy leads to high computational efficiency. For a test set of size 5, the time needed for computing the fitted solutions is approximately $0.068$
s. The running time here and the running time of the CEM presented in Table 8 are measured on the same hardware. Compared to the aforementioned CEM, which may take hours to solve the problem, the usage of function approximation makes it much more feasible to generate policy specifications on the fly in the production environment.
$0.068$
s. The running time here and the running time of the CEM presented in Table 8 are measured on the same hardware. Compared to the aforementioned CEM, which may take hours to solve the problem, the usage of function approximation makes it much more feasible to generate policy specifications on the fly in the production environment.
6. Conclusions and future directions
In this paper, we proposed a workflow for the design of incident-specific cyber insurance. It consists of three key components, including the estimation of model inputs using public and proprietary data in the underwriting process, the Pareto optimal objective based on the insured’s and the insurer’s preference orderings by their risk measures, and solvers for the optimization problem. The cases in which both parties have VaR preferences, the buyer uses VaR, and the seller has a TVaR preference, are discussed. Using real cyber incident data, we showed how this workflow generates incident-specific policies that lower the total risk taken by the insured and the insurer. We also demonstrated that the proposed workflow can be time efficient with the help of function approximation if there is a time constraint on the delivery of results.
The implications of this work for cyber insurers and policyholders can be summarized as follows. First, the proposed workflow aims to design cyber insurance in a collaborative environment, which aligns with the market practice that many cyber insurance providers also offer services that improve the policyholder’s security posture and, at the same time, reduce the insurer’s exposure. With the consensus on the assessment of the risk, the workflow lowers the insurance buyer’s risk and the aggregate risk of both the buyer and the seller, and compensates the insurer with a sufficiently high premium rate. Second, the workflow provides the insurance buyer with a pragmatic way to determine incident-specific coverage, thus simplifying the decision-making process. It also makes the existing incident-specific design of cyber insurance actuarially justified. Lastly, this work addresses the computational challenges that may arise in the implementation of the proposed methods, allowing insurers to provide quick quotes and coverage.
Despite the time efficiency of using an approximated target function, one limitation is that the optimum is not always attained by the fitted solutions generated by the target function. Therefore, the benefits and risks of using this approach should be weighed in practice. Another limitation of this study is that, because of the scarcity of data on cyber incident losses, it is not feasible to model company-specific loss distributions for individual incident types, and therefore we only considered how incident type realizations are related to company characteristics, regardless of the relationship between those characteristics and the potential cyber losses. This issue could possibly be resolved in future studies if a better quality cyber loss dataset is available. Lastly, this study assumes that indemnity functions are specific only to cyber incident types, or equivalently perils. In practice, deductibles and limits could also be placed on more granular levels like covered assets, such as hardware, data, or business income; see, for example, Chong et al. (Reference Chong, Feng, Hu and Zhang2022). Depending on the use case, the proposed workflow can easily be adopted for policies that offer coverages at a more granular level.
Acknowledgments
Wing Fung Chong, Daniël Linders, and Linfeng Zhang are supported by a 2018 Ignacio Hernando de Larramendi Research Grant from the Fundación MAPFRE. Wing Fung Chong, Daniël Linders, Zhiyu Quan, and Linfeng Zhang are supported by a Centers of Actuarial Excellence (CAE) Research Grant (2019–2021) from the Society of Actuaries (SOA). Any opinions, findings, conclusions, or recommendations expressed in this material are those of the authors and do not necessarily reflect the views of the Fundación MAPFRE and the SOA.
Appendix
Appendix A. Explanatory Variables and Their Descriptions
All explanatory variables and their descriptions.
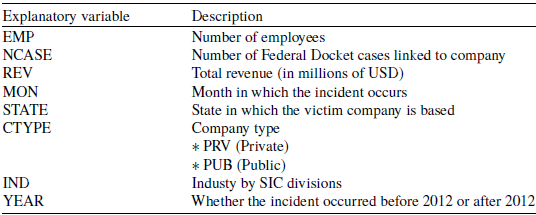
Appendix B. Classification Models
Decision tree A decision tree (DT) splits the dataset based on the values of explanatory variables and attempts to partition the dataset into homogeneous subsets. Each split of a parent node is performed with the goal of reducing the Gini impurity of data in child nodes. Decision tree is known to have a tendency to overfit, which means that it can fit the training data well by growing a complex tree with granular partitions, but its performance can suffer when making predictions on new data. To mitigate this issue, three hyperparameters, including the maximum depth of the tree, the minimum number of samples required in each leaf, and the complexity parameter of the tree pruning process, are tuned by grid search with fivefold cross validations to improve the out-of-sample prediction performance of the built tree. The hyperparameter tuning process of all other classification methods mentioned in this paper is performed in the same way.
Random forest Random forest (RF) is an ensemble model that employs multiple classification trees, of which each is built based on a bootstrapped sample of the training set and a randomly selected subset of all explanatory variables. In the end, the probabilistic predictions made by all trees are averaged to give a final prediction. The randomness introduced by bootstrapping and randomly selected explanatory variables help reduce the variance of the model, thus mitigating the overfitting issue of a single classification tree, as discussed previously. Hyperparameters including the number of trees to build and the size of the subset of explanatory variables are tuned for performance improvement in this study.
Gradient boosted trees Gradient boosted trees is another type of ensemble model based on decision trees. Instead of growing trees independently and then aggregating the results, the boosted method iteratively improves the performance of the previous tree-based classifier by updating it with a new tree that fits the residual. The updating process is a linear combination of the old classifier and the newly built tree, in which the coefficients minimize a certain loss function of the true values and the predicted values. Hyperparameters, including the learning rate, which governs how much each new tree contribute to the final classifier, and the total number of trees to build are tuned.
Linear discriminant analysis Linear discriminant analysis (LDA) solves an optimization problem, for which a transformation matrix is solved such that after the transformation, the ratio between the total between-class variance of data points measured in an Euclidean space and the total within-class variance is maximized. That is, data points in the same class are made as close to each other as possible, whereas data points belonging to different classes are separated to the greatest extent. The advantage of this method over the three tree-based models introduced earlier is that there is an analytical solution to the transformation matrix, and thus the training time is minimal. The drawback, however, is that it imposes relatively strict assumptions on the data, such as multivariate normality, independence, and non-collinearity, which can rarely be fully satisfied by empirical data, and in that case, the performance can suffer. Given that our sample contains many dummy variables, the assumptions are largely violated. Nevertheless, this method is tested and compared with other models.
Multinomial logistic regression For multi-class problems, multinomial logistic regression (MLR) is a generalization of its binary counterpart. Let K denote the number of classes and for each class $k=1,2,\ldots,K$
, the probability
$k=1,2,\ldots,K$
, the probability $p_k$
of an observation with features vector
$p_k$
of an observation with features vector $\boldsymbol{x}$
belonging to that class is modeled as follows:
$\boldsymbol{x}$
belonging to that class is modeled as follows:
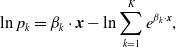 \begin{align*}\ln p_k = \beta_k \cdot \boldsymbol{x} - \ln \sum_{k=1}^K e^{\beta_k \cdot \boldsymbol{x}},\end{align*}
where $\beta_k$
is the coefficient learned from the training set to minimize the cross-entropy loss function, and the term
$\beta_k$
is the coefficient learned from the training set to minimize the cross-entropy loss function, and the term $\ln \sum_{k=1}^K e^{\beta_k \cdot \boldsymbol{x}}$
is a normalizing factor that ensures
$\ln \sum_{k=1}^K e^{\beta_k \cdot \boldsymbol{x}}$
is a normalizing factor that ensures $\sum_{k=1}^K p_k=1$
. Equivalently,
$\sum_{k=1}^K p_k=1$
. Equivalently,
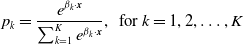 \begin{align*}p_k = \frac{e^{\beta_k\cdot\boldsymbol{x}}}{\sum_{k=1}^K e^{\beta_k \cdot \boldsymbol{x}}},\; \text{ for } k = 1,2,\ldots,K\end{align*}
which is the softmax function of $\beta_k \cdot \boldsymbol{x}$
.
$\beta_k \cdot \boldsymbol{x}$
.
Multilayer perceptron Multinomial logistic regression can be viewed as a single-layer perceptron without hidden layers, of which the activation function in the output layer is softmax, as introduced earlier. Thus, it would be interesting to compare multinomial logistic regression to multilayer perceptron (MLP) models with additional hidden layers. Hidden layers enable the model to learn nonlinear relationships, and thus might provide a better fitting. For experiment purposes, an MLP classifier with two hidden layers and ten neurons in each hidden layer is trained.
Stacking classifier Lastly, stacking classifiers are built based on the results output by the different algorithms mentioned above. The motivation is that classifiers of different kinds are likely to produce errors in different ways, and thus combining their results with proper weights may result in reduced errors, as suggested in Merz (Reference Merz1999). To stack the base classifiers as introduced previously, their probabilistic predictions are collected and used as new features for building meta-classifiers on top of all individual models. The choice of the meta-classifier in this study is random forest. To see how different sets of base classifiers can affect the performance of the meta-classifier, three stacking classifiers are compared. The first uses only tree-based base classifiers, including decision trees, random forests, and gradient-boosted trees. The second stacking classifier excludes the two linear methods, which are linear discriminant analysis and multinomial logistic regression. The third stacking classifier includes all models mentioned previously as base classifiers.
Appendix C. Optimization Parameters
Seller’s and buyer’s risk levels and CEM specifications.
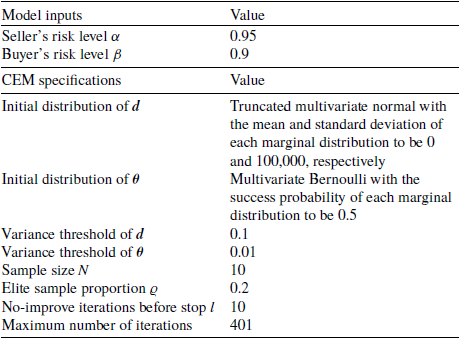
Appendix D. Severity Distribution Fitting Results
D.1. Comparison of AICs of fitted distributions
AICs of distributions fitted to incident-specific losses. For each incident type, the log-normal distribution has the lowest value among all fitted distributions.
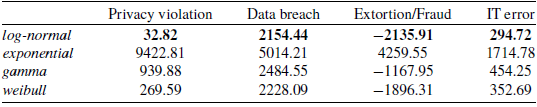


 Open access