


Introduction
Authoritarian regimes are renowned for their use of repression. Virtually all autocracies routinely restrict civil liberties and use outright violence to crush opponents, intimidate potential challengers, or discipline the population at large (Wintrobe, Reference Wintrobe1998; Svolik, Reference Svolik2012; Davenport, Reference Davenport2007c). Studies show that repression is effective for upholding political control in general (Escribà-Folch, Reference Escribà-Folch2013; Young, Reference Young2019) and particularly for dealing with immediate threats such as popular protests by increasing risk perceptions and thus the costs of mobilization (Frantz and Kendall-Taylor, Reference Frantz and Kendall-Taylor2014; Bellin, Reference Bellin2012; Rasler, Reference Rasler1996).
However, scholars have also demonstrated that the repression of protesters – particularly non-violent ones – comes with the risk of backfiring (Lichbach, Reference Lichbach1987; Francisco, Reference Francisco1995; Hess and Martin, Reference Hess and Martin2006; Francisco, Reference Francisco2004; Sharp, Reference Sharp2012 [1993]). Most scholars of the dissent–repression nexus assume that the repression of protesters is costly as it is said to undermine further public support for the regime’s actions, which in turn may spur renewed mobilization and radicalization (Ritter, Reference Ritter2014; Poe et al., Reference Poe, Tate, Keith and Lanier2000; Young, Reference Young2013; Chenoweth et al., Reference Chenoweth, Perkoski and Kang2017: 1958; Earl, Reference Earl2011; Earl and Soule, Reference Earl and Soule2010; Opp and Roehl, Reference Opp and Roehl1990: 523–5; DeNardo, Reference DeNardo1985: 191–2; LeBas and Young, Reference LeBas and Young2024). Recent experimental evidence largely corroborates this (Dahlum et al., Reference Dahlum, Pinckney and Wig2023; Aytaç et al., Reference Aytaç, Schiumerini and Stokes2018).
This study seeks to qualify the assumption that authoritarian repression necessarily comes with high public legitimacy costs, understood as reductions in support for and/or acceptance of a regime and its leader. In line with newer studies showing that repression effects are not uniform across individuals but can vary based on political and ideological orientations (LeBas and Young, Reference LeBas and Young2024; Esberg, Reference Esberg2021,Reference Esberg2018; Curtice, Reference Curtice2021; Curtice and Behlendorf, Reference Curtice and Behlendorf2021), gender (Naunov, Reference Naunov2025), ethnic identity (Manekin and Mitts, Reference Manekin and Mitts2022), socio-economic characteristics (Gutiérrez-Romero and LeBas, Reference Gutiérrez-Romero and LeBas2020), and even psychological dispositions (Young, Reference Young2020), we propose that popular (dis)approval of repression of protesters, and changes in support for the regime and the leader following from it, is also conditional on the relationship between the observer and the repressed. That is, it matters greatly not only who the target of repression is but also whom we are asking and how they generally feel about the target group.
Most citizens hold pre-existing beliefs about different socio-political groups in society, and such varying tolerance towards different groups shapes the public’s reaction to the use of authoritarian repression. From research on democracies, we know that the degree of sympathy, in turn, affects general tolerance levels towards members of different groups (Stouffer, Reference Stouffer1955; Sullivan et al., Reference Sullivan, Piereson and Marcus1982) as well as support for the protection of their civil rights (Lawrence, Reference Lawrence1976; Chambers et al., Reference Chambers, Schlenker and Collisson2013; Crawford and Pilanski, Reference Crawford and Pilanski2014; Wetherell et al., Reference Wetherell, Brandt and Reyna2013; Manekin and Mitts, Reference Manekin and Mitts2022). Recent research in authoritarian contexts also indicates that citizens under certain circumstances expect and may even demand repression of certain individuals, such as opposition activists (Esberg, Reference Esberg2021,Reference Esberg2018), terrorists (Hou and Quek, Reference Hou and Quek2019), corrupt officials (Tsai, Reference Tsai2021), and even feminists (Naunov, Reference Naunov2025). Building on these studies, we suggest that pre-existing perceptions of other groups, more generally, have important consequences for how people in autocracies evaluate repressive acts against such groups and also for how they perceive the regime and its leader and, thus, can help us better understand the consequences of authoritarian coercion when employed, for instance, in response to protests. Moreover, we offer the first systematic experimental test of this proposition.
More specifically, we expect that when bystanders observe the repression of liked groups, they disapprove of such actions and subsequently sanction the country’s leadership by decreasing support levels. However, when coercion affects groups they dislike, we propose that they find it more acceptable and, therefore, increase their support for the regime and the ruler. In fact, we anticipate that not repressing a group can come at a cost, as those who dislike the group find the country’s leadership too lenient and hence decrease their support. We argue that this should hold for regime supporters and opponents alike, although absolute approval levels may differ as regime supporters generally back authorities more strongly at the outset. That is, we hold that there is a group-determined acceptance rate for repression in any autocracy. For dictators, who can manipulate perceptions of various groups through their control of the media (Arnon et al., Reference Arnon, Edwards and Li2023; Williamson and Malik, Reference Williamson and Malik2019; Pop-Eleches and Way, Reference Pop-Eleches and Way2023), repression can thus be a potent strategy not only for quashing dissent but also sometimes for boosting public approval. Targeting groups that regime supporters dislike can allow a regime to consolidate backing among its core base (Esberg, Reference Esberg2018,Reference Esberg2020), or if groups are more broadly disfavored, appeal to non-partisans and even more moderate opposition-minded individuals. In short, when deciding when and how to repress, dictators may consider not only the risk of backlash but also the benefits of adhering to social demands for punishment (Tsai, Reference Tsai2021) by engaging in what could be termed ‘performative repressive’ acts.
We test this argument in a pre-registered survey experiment on a representative sample of 3,569 respondents in authoritarian Russia conducted between February and March 2021. First, we pre-evaluate respondents’ sympathy levels towards different socio-political groups within Russia. Next, the experiment exposes all respondents to a fictional non-violent protest event in Moscow but randomly varies the identity of the protest group and the regime’s response to the demonstration event. Finally, we ask respondents to assess the regime’s response and their approval of the Russian president, Vladimir Putin. This setup allows us to causally examine whether and how much intergroup relations between bystanders and repression targets condition the relationship between authoritarian coercion and popular support levels. Moreover, the fielding of the experiment coincided with actual violent repression of mass protests by supporters of the main opposition politician in Russia at that time, Alexei Navalny, which further enhanced the realism of the experimental vignettes. At the same time, as the experiment also examines several other potential protester groups, it is ensured that the results are not simply an artifact of the ongoing repression in the streets and that we can in fact draw causal conclusions from it.
Overall, we find consistent support for our main proposition. State repression of liked groups is generally deemed unacceptable, but the more respondents dislike the protesting group, the more they approve of government repression of it and disapprove of inaction towards it. And the more widespread the lack of sympathy towards the protesting group, the more broadly the repression is accepted. In the Russian context, this is particularly the case for protester groups that divide the electorate, such as Alexei Navalny supporters, LGBT groups, and Russian nationalists. Repressing these groups rarely backfires for the Russian regime. Approximately a third of respondents approve of repressing these groups, a third remain indifferent to the repression, and only a third disapprove of such acts. In short, two-thirds of the Russian population either do not care about or outright approve of violent repression of peaceful protests by these frequent protester groups. For regime supporters, the numbers are even higher, as close to half of such respondents support repression and only fifteen to twenty per cent disapprove of it. We thus find support for a much more nuanced understanding of public reactions to repressing peaceful protests than hitherto acknowledged in the literature in general and in studies on Russia in particular.
More worryingly, we also find that approval of Putin is largely unaffected by the regime’s repression decisions. While a pattern similar to that of repression acceptance conditional on group sympathy exists, the effects are much smaller across regime supporters and non-supporters alike. That is, for the Russian autocrat, the legitimacy costs associated with repressing peaceful protesters are generally negligible, and we even find, albeit marginal, support for the proposition that Putin may even benefit from repressing certain groups disliked by his core electorate.
These results have broader implications. First, they help us better understand why Russia’s president, Vladimir Putin, frequently employs violent repression of peaceful protests, seemingly without incurring significant legitimacy costs or other backfire effects. Our results show that, at least before the Ukraine War, Putin’s hard-handed approach towards his main political opponents, such as supporters of the main opposition leader, Alexei Navalny, was in fact rewarded by his core electorate and also largely accepted by more passive segments of the Russian voter population. Thus, for Putin, the repression of groups with alternative political views is not particularly costly in terms of public legitimacy. Some voters in Russia will even disapprove of the authorities and the president for not repressing these groups. Thus, in relation to these political groups, the Russian president can use coercion to burnish his image as a strongman and maybe even garner additional legitimacy among those most supportive of a punishment regime. As long as Putin is not challenged by protests whose participants cut across different groups in Russian society, he will likely continue to resort to coercion without taking any significant risks.
Second, our results might also explain why dictators generally move so forcefully against non-threatening fringe groups, such as Pussy Riot in Russia (Sharafutdinova, Reference Sharafutdinova2014), and smaller ethnic or religious minorities, as exemplified by the Burmese military’s oppression of the Muslim Rohingya minority (Barany, Reference Barany2021) or the Chinese Communist Party’s persecution of the Falun Gong movement (Keith and Lin, Reference Keith and Lin2003). One plausible reason seems to be that, in the aggregate, these actions are broadly accepted and thus have a positive impact on popular approval – that is, a majority group, or a particularly important group for the regime, favors such repression and will credit the country’s leadership for carrying it out. Although a particular group might not necessarily pose any notable danger to autocratic stability, they can serve as valuable scapegoats and victims of repression to boost regime approval among core supporters (Esberg, Reference Esberg2020,Reference Esberg2018) and beyond. Just as so-called spin-dictators (Guriev and Treisman Reference Guriev and Treisman2022) or informational autocrats (Guriev and Treisman, Reference Guriev and Treisman2019) engage in performative acts to simulate the responsiveness of democratic leaders in order to boost their popular standing, so can authoritarian leaders engage in ‘performative repression’, carefully applying coercion to those groups where they sense or know that the population is more likely to reward them for doing so.
Finally, and on a more general level, we provide the first systematic experimental evidence showing that repression is not necessarily as costly as it is often assumed to be in the broader literature on authoritarianism (Svolik, Reference Svolik2012: 182–3; Davenport, Reference Davenport2007a; Gartner and Regan, Reference Gartner and Regan1996; Wintrobe, Reference Wintrobe1998) and in the dissent-repression literature in particular (Hess and Martin, Reference Hess and Martin2006; Francisco, Reference Francisco2004; Nepstad, Reference Nepstad2013; Martin, Reference Martin2007; Beissinger, Reference Beissinger2002; Aytaç et al., Reference Aytaç, Schiumerini and Stokes2018). Our results indicate that this is only the case when repression targets groups that enjoy widespread sympathy in the population or those that, at least, do not invoke negative feelings among a substantial subset. The everyday repression of disliked or moderately tolerated groups is far from costly, and ‘performative repression’ may even sometimes help dictators boost their legitimacy and thus strengthen their hold on power.
Protests and Repression in Autocracies
Since the end of the Cold War, the occurrence of non-violent mass protests has spread throughout the world, rapidly becoming the most frequently used method of popular resistance (Chenoweth and Stephan, Reference Chenoweth and Stephan2011; Schock, Reference Schock2005) – even in authoritarian regimes (Kendall–Taylor and Frantz, Reference Kendall–Taylor and Frantz2014; Celestino and Gleditsch, Reference Celestino and Gleditsch2013; Dunne, Reference Dunne2020; Gleditsch et al., Reference Gleditsch, Radean and Olar2023). Studies also show that mass protests are indeed a potent threat to the survival of autocrats (Celestino and Gleditsch, Reference Celestino and Gleditsch2013; Ulfelder, Reference Ulfelder2005; Gleditsch et al., Reference Gleditsch, Radean and Olar2023), and the recent downfalls of long-time rulers such as Omar al-Bashir in Sudan (Hassan and Kodouda, Reference Hassan and Kodouda2019), Abdelaziz Bouteflika in Algeria (Volpi, Reference Volpi2020), and Sheikh Hasina (Chowdhury, Reference Chowdhury2025) in Bangladesh testify to this.
Autocrats often respond to such non-violent protests in accordance with Davenport’s ‘law of coercive responsiveness’ (Reference Davenport2007b: 7) – that is, they turn to repression (Chenoweth et al., Reference Chenoweth, Perkoski and Kang2017) in an attempt to deter their challengers (Feierabend and Feierabend, Reference Feierabend and Feierabend1966). Using violence is indeed effective, at least in the short run, as it instills fear and apathy among protesters and bystanders and thus dampens overall dissent participation (Young, Reference Young2019; Rasler, Reference Rasler1996; Earl, Reference Earl2011).
However, research also shows that a substantial increase in the use of violence can itself trigger mass protests (Chenoweth and Ulfelder, Reference Chenoweth and Ulfelder2017), and responding to ongoing demonstrations with violence may also anger and embolden active protesters and even bring passive supporters into the streets (Hess and Martin, Reference Hess and Martin2006; Francisco, Reference Francisco2004; Nepstad, Reference Nepstad2013; Martin, Reference Martin2007; Aytaç et al., Reference Aytaç, Schiumerini and Stokes2018; LeBas and Young, Reference LeBas and Young2024; Young, Reference Young2020; Dahlum et al., Reference Dahlum, Pinckney and Wig2023).
The assumption in studies on the unintended consequences of coercion is that the repression of peaceful protesters is considered illegitimate among citizens at large (Josua, Reference Josua2021). Overt coercion against non-aggressive protesters is considered unjust and is said to trigger ‘micro-mobilization processes’ among targets and observers (Opp and Roehl, Reference Opp and Roehl1990: 526; Hess and Martin, Reference Hess and Martin2006). Indiscriminate violence is argued to generate widespread antipathy towards authorities, and maybe even disgust and ‘moral repulsion’ (DeNardo, Reference DeNardo1985: 192), and the repression of a peaceful demonstration is thought to make active dissenters even more committed and bystanders more willing to sympathize with and support the cause of the protest movement (Ritter, Reference Ritter2014; Poe et al., Reference Poe, Tate, Keith and Lanier2000; Young, Reference Young2013; Chenoweth et al., Reference Chenoweth, Perkoski and Kang2017: 1958; Earl, Reference Earl2011; Earl and Soule, Reference Earl and Soule2010). Thus, governments and leaders that apply repression against non-violent protesters are likely to incur legitimacy costs in that disapproval of such responses may lead to reductions in approval for and/or acceptance of a regime and its leader.Footnote 1 New experimental studies largely support this (Aytaç et al., Reference Aytaç, Schiumerini and Stokes2018; Dahlum et al., Reference Dahlum, Pinckney and Wig2023; Lupu and Wallace, Reference Lupu and Wallace2019), and a few recent studies have even found that this also extends to regime supporters (Gutiérrez-Romero and LeBas, Reference Gutiérrez-Romero and LeBas2020; LeBas and Young, Reference LeBas and Young2024).
However, recent literature indicates that the repression of peaceful protesters is not necessarily unpopular with those observing it. People are more accepting of coercive actions when the regime frames non-violent protesters as threatening or as distinct out-groups (Edwards and Arnon, Reference Edwards and Arnon2021; Williamson and Malik, Reference Williamson and Malik2019; Arnon et al., Reference Arnon, Edwards and Li2023; Pop-Eleches and Way, Reference Pop-Eleches and Way2023). Likewise, supporters of an authoritarian regime generally condemn repression less than regime opponents (Curtice and Behlendorf, Reference Curtice and Behlendorf2021; Curtice, Reference Curtice2021; Williamson and Malik, Reference Williamson and Malik2019), and Esberg’s observational studies of political killings (2018) and censorship (2020) in Chile under Pinochet indicate that regime supporters may even sometimes approve of and expect it if targets are deemed deserving of punishment. Tsai (Reference Tsai2021) similarly argues that observers may view some instances of targeted coercion against wrongdoers such as corrupt officials not as unjust but as necessary to affirm and protect social values and uphold retributive justice, and Naunov (Reference Naunov2025) shows that groups such as patriarchy-defiant feminists are deemed by observers to be more immoral and thus more worthy of repression.
In this paper, we follow this line of recent studies and seek to further qualify the assumptions connected to authoritarian repression costs. Building on a long research tradition of social–psychological studies conducted in democracies, we argue that, more generally, intergroup relations – and not just those between regime supporters and opponents – are another key to understanding public approval of authoritarian repression.
Sympathy/Antipathy Towards Protester Groups and Public Approval of Repression
Humans often engage in stereotypic thinking. They see others as members of real or perceived groups with specific attributes, characteristics, and behaviors (Hilton and Von Hippel, Reference Hilton and Von Hippel1996). When stereotypic thinking operates, individual differences between ‘others’ are glossed over through cognitive short-cutting, known as representativeness heuristics (Kahneman and Tversky, Reference Kahneman and Tversky1972). Moreover, it makes individuals perceive groups differently as positive and negative perceptions are systematically reinforced through attribution bias (Chatman and Von Hippel, Reference Chatman and Von Hippel2001).
We know that such thinking also has political consequences. Individuals’ sympathy for a group affects general tolerance towards members of that group (Stouffer, Reference Stouffer1955; Sullivan et al., Reference Sullivan, Piereson and Marcus1982). This, in turn, affects the extent to which individuals are willing to accept restrictions on the civil liberties of such groups – for example, their right to demonstrate (Manekin and Mitts, Reference Manekin and Mitts2022; Lawrence, Reference Lawrence1976) or their freedom of speech (Lindner and Nosek Reference Lindner and Nosek2009; Chambers, et al., Reference Chambers, Schlenker and Collisson2013; Crawford and Pilanski, Reference Crawford and Pilanski2014; Wetherell, et al., Reference Wetherell, Brandt and Reyna2013). Following this logic, we have good reasons to expect bystanders in autocracies to evaluate protest events differently depending on how they perceive the group targeted with repression.
On this basis, we mainly expect individuals to express concern about breaching democratic and moral ideals such as freedom of speech and freedom of assembly when repression targets protester groups they like. In contrast, when confronted with repression of disliked groups, they should either disregard democratic considerations entirely or behave as conditional democrats (Graham and Svolik, Reference Graham and Svolik2020; Svolik, Reference Svolik2019) and simply place more emphasis on other concerns, be it the upholding of other social values or avoiding the policies promoted by the protester group. One such other concern, we suggest, is the upholding of law and order (Lupu and Wallace, Reference Lupu and Wallace2019). Mass protests are disruptive events per definition (Klein and Regan, Reference Klein and Regan2018). They disturb public order and threaten stability, and when authoritarian rulers try to delegitimize protest events, they frequently emphasize this very aspect by depicting protesters as ‘thugs’, ‘criminals’, or ‘fifth columns’ seeking to subvert the existing order (Williamson and Malik, Reference Williamson and Malik2019; Pop-Eleches and Way, Reference Pop-Eleches and Way2023; Arnon et al., Reference Arnon, Edwards and Li2023). However, we find it most likely that this negative aspect of demonstration events is accentuated by bystanders only when they dislike the protesting group and see its members as generally more threatening.
Observable Implications
We propose two main hypotheses. The first hypothesis is less controversial but has not been tested in an authoritarian setting. Generally, we argue that people have more sympathy with groups they can relate to and identify with. They feel greater solidarity with such group members, see them as less threatening, and typically engage in attribution bias processes to ex-post justify their behavior (Chatman and Von Hippel, Reference Chatman and Von Hippel2001; Edwards and Arnon, Reference Edwards and Arnon2021). Consequently, when bystanders see authorities quash protests led by groups they sympathize with, we expect them to disapprove and decrease their support for the incumbent as the primary decision-maker of the regime.
Hypothesis 1: When the regime represses a protest group, bystanders who like the group will disapprove of the government’s action and the regime leader compared to a scenario where protests are allowed to continue.
However, few groups (if any) enjoy uniform high levels of sympathy among different bystanders. Many protesting groups are even widely despised, or at least disliked by many. As an image reversed of the above, we should expect that individuals who see disliked groups protesting will feel less connected to their cause, see them as more threatening, and feel less empathy towards them (Chatman and Von Hippel, Reference Chatman and Von Hippel2001). Bystanders who dislike a protesting group will not only be more prone to accepting curtailments of the demonstrators’ civil rights (Manekin and Mitts, Reference Manekin and Mitts2022; Lawrence, Reference Lawrence1976), but also be more accepting of authorities coming down hard on them, perhaps even inflicting physical harm (Edwards and Arnon, Reference Edwards and Arnon2021).
Therefore, our second hypothesis states that repression of a particular group is more acceptable to those bystanders who dislike the group. Consequently, coercion does not negatively affect support for the regime and the ruler. People who dislike the protesting group may think that the demonstrators deserve to be repressed (Bandura, Reference Bandura1999; Kelman and Hamilton, Reference Kelman and Hamilton1989; Opotow, Reference Opotow1990) and thus increase their support for the regime and the ruler when coercion is applied. This also means that not repressing a disliked group can come at a cost, as bystanders find the country’s leadership too lenient and therefore disapprove of such inaction and decrease their support accordingly. Thus, autocrats may have an incentive to respond to an often unarticulated demand for repression against particular groups, engaging in what can be termed ‘performative repression’, where the primary purpose is not only to eliminate distinct regime threats and dissuade future challenges by setting an example (Davenport, Reference Davenport2007a), but also to boost their standing among core constituencies or broader groups of the population (Esberg, Reference Esberg2018,Reference Esberg2020; Tsai, Reference Tsai2021).
Hypothesis 2: When the regime represses a protest group, bystanders who dislike the group will approve of the government’s action and the regime leader compared to a scenario where protests are allowed to continue.
Research Design
These arguments were tested in a pre-registered survey experiment, administered through YouGov, on a representative sample by gender, age, and geography of 3,569 respondents in Russia between 12 February and 11 March 2021. While the main analysis is carried out without any weighting, the main results are replicated using weights (see Appendix SI E3).
Ethical Concerns
The experiment and data collection process were approved by and registered at the Data Protection Unit at the authors’ university. By presenting our project to this institutional review board, our survey data collection was subject to an array of restrictions and guidelines monitored by the board. In addition, we thoroughly discussed the survey wording and sensitivity issues with YouGov and our Russian survey partners before, during, and after the data collection process. We paid particular attention to ensuring participants’ consent throughout the entire survey. Respondents could freely choose not to answer any question or opt out of the survey at any time without losing their rewards. Finally, at the end of the survey, respondents received thorough debriefing information. We formulated the debrief in a manner that was easy to understand by relying on everyday Russian language to ensure that all respondents understood that the vignette information they received was fictitious. In the Online Appendix (see Appendix SI C), we discuss these and additional ethical issues in more detail.
The Russian Context
Russia in early 2021 is a good setting for testing our proposed argument. First of all, a better understanding of the protest potential in Putin’s Russia, one of the most dominant authoritarian powers in the world, is, of course, important in its own right, particularly in light of Russia’s war against Ukraine and the possible destabilization of the Putin regime that may follow from it.
Second, Russia can be considered a personalist, electoral authoritarian regime (Reuter, Reference Reuter2013; Reuter and Szakonyi, Reference Reuter and Szakonyi2019; Treisman 2018), and even a fairly typical one in today’s world. On the one hand, President Vladimir Putin is a very powerful autocrat constrained neither by party nor military officials, relying instead on a narrow circle of trusted associates who are personally tied to him (Baturo and Elkink, Reference Baturo and Elkink2021; Shevtsova, Reference Shevtsova2015). On the other hand, Putin is not omnipotent in the sense that Muammar Gadaffi of Libya or Saddam Hussein of Iraq were (Greene and Robertson, Reference Greene and Robertson2019), nor does he have the same kind of personality cult developed around him (Frye, Reference Frye2022); and, at least around the time the survey was fielded, Russia under Putin was not overly repressive in comparison to these more extreme examples (Frye et al., Reference Frye, Gehlbach, Marquardt and Reuter2023). In that sense, Putin’s Russia compares to the many other personalist regimes in existence today, which is now the dominant form of autocracy in the world (Frantz et al., Reference Frantz, Kendall-Taylor, Wright and Xu2020; Kendall-Taylor et al., Reference Kendall-Taylor, Frantz and Wright2017).
Third, during the most recent ten to fifteen years of Putin’s rulership, popular protests, in particular in the form of marches or demonstrations, have become more and more common (Robertson, Reference Robertson2013; Lankina and Tertytchnaya, Reference Lankina and Tertytchnaya2020; Tertytchnaya, Reference Tertytchnaya2023). Occasionally, we have seen very large and geographically widespread mobilizations, such as the ‘Bolotnaya protests’ following the 2011 parliamentary elections (Tertytchnaya and Lankina, Reference Tertytchnaya and Lankina2020; Frye and Borisova, Reference Frye and Borisova2019). However, political protests have most frequently been of a smaller size and more localized. Although the Putin regime was not hyper-repressive before the Ukraine War (Frye et al., Reference Frye, Gehlbach, Marquardt and Reuter2023), authorities still repressed around thirty per cent of all protests during the period 2007–16 (Lankina and Tertytchnaya, Reference Lankina and Tertytchnaya2020: 28). Moreover, by coincidence, the fielding of the survey coincided with crackdowns on large-scale demonstrations across Russia as the main opposition figure at that time, Alexei Navalny, returned from his exile in Germany. Repression of popular protests can thus be considered ‘normal’ in the Russian context around the time when we fielded the survey, allowing us to test respondents’ support for oppression with realistic vignettes (Tertytchnaya, Reference Tertytchnaya2023).
Fourth, protesting groups in Russia also vary considerably. In recent decades, different political parties and organizations, civil society organizations, and socio-economic and identity groups have engaged in protests (Robertson, Reference Robertson2013; Lankina and Tertytchnaya, Reference Lankina and Tertytchnaya2020; Crowley and Olimpieva, Reference Crowley and Olimpieva2018). This allows us to manipulate the protester group in the experiment in realistic ways and thus investigate whether respondents’ support for the oppression of protesters varies with the identity of the protesting group and the respondents’ sympathy towards it. As elaborated below, we use five types of protester groups in the experiment: Navalny supporters, communists, nationalists, LGBT supporters, and coal miners. All five groups have frequently organized non-violent protests in Russia, and they represent protest groups that mobilize for both issue-specific reasons (coal miners and LGBT groups) and more general political orientations (Navalny supporters, communists, and nationalists). Moreover, each group can be considered distinct in that they rarely protest together and only sometimes for similar causes. For example, protests by communists mostly center around leftist issues, such as social policies (Armstrong et al., Reference Armstrong, Reuter and Robertson2020), and coal miners stage demonstrations connected to specific labor market issues, such as wage arrears (Solovenko and Kust, Reference Solovenko and Kust2015; Crowley and Olimpieva, Reference Crowley and Olimpieva2018). Nationalists comprise a more mixed group, but they typically rally around issues connected to the supremacy of Russian ethnicity and visions for expanding Russian territory into parts of other countries that they consider to belong to the Russian nation (Laruelle, Reference Laruelle2017). Navalny supporters stress issues regarding corruption, repression, and the lack of democracy more generally (Dollbaum, Reference Dollbaum2020; Tertytchnaya, Reference Tertytchnaya2023),Footnote 2 while LGBT supporters protest for improved sexual minority rights and protection from harassment specifically (Buyantueva, Reference Buyantueva2022).
Last, and most importantly, these protester groups are expected to vary in how the Russian population perceives them. Two of the five groups likely do not generate strong sympathy–antipathy divides in the Russian population. One is the communists, a non-extremist leftist group that many Russians think of in positive terms (White, Reference White2010), linking communism to social welfare, empire nostalgia, and pride and patriotism over Soviet victory in World War II (Greene and Robertson, Reference Greene and Robertson2019: 102), and that only a minority are likely to outright despise. The other is the group of coal miners, whose strikes and protests, particularly in the 1990s, were broadly perceived as the common man rising against socio-economic crisis and political misrule (Solovenko and Kust, Reference Solovenko and Kust2015).
However, the other three groups may make for more polarizing perceptions. Navalny supporters are considered to represent the most potent anti-regime forces in today’s Russia and are thus likely to invoke very different feelings in regime supporters and regime non-supporters (Dollbaum, Reference Dollbaum2020: 198; Tertytchnaya, Reference Tertytchnaya2023). Likewise with LGBT supporters. During the last ten to fifteen years, the Russian regime has feverishly promoted traditional values, demonizing and openly harassing LGBT people (Wilkinson, Reference Wilkinson2014; Greene and Robertson, Reference Greene and Robertson2019: 35–7), and according to surveys (Buyantueva, Reference Buyantueva2022) and anthropological studies (Morris and Garibyan, Reference Morris and Garibyan2021), a large majority of the Russian population holds very strong negative feelings towards LGBT groups. In recent years, the Putin regime has more openly engaged in what we in this paper term ‘performative repression’ against this group. For instance, in the months leading up to the March 2024 presidential elections, several Russians with connections to the LGBT community were fined and imprisoned merely for displaying in public LGBT symbols such as rainbow coloured earrings.Footnote 3 These cases of repression were well covered in mainstream regime-controlled media and openly discussed by Russian politicians, including the Kremlin spokesperson Dimitry Peskov,Footnote 4 most likely serving the purpose of mobilizing the electorate in favor of the regime.
Lastly, the group of nationalists, representing opinions on the far right of the political spectrum, is also likely to polarize respondents as some Russians are appalled by their views, while others find them appealing. At least until the 2022 Ukraine invasion (Krishnarajan and Tolstrup, Reference Krishnarajan and Tolstrup2023), the Putin regime tried to carefully balance these differing views in the electorate, frequently tapping into nationalist issues and discourses while at the same time distancing itself from the group’s most extreme views (Greene and Robertson, Reference Greene and Robertson2019).
Treatment Conditions
The experiment randomly exposes respondents to a fictional event, presented in a detailed yet concise vignette in which a particular group of citizens participates in a large, non-violent protest in Moscow, which is where the majority of protests typically occur (Robertson, Reference Robertson2013; Lankina and Tertytchnaya, Reference Lankina and Tertytchnaya2020). The protesters demonstrate peacefully, but their actions incur a small cost for ordinary Russians by causing a traffic jam. This realistic scenario not only imitates typical descriptions and phrases often used by newspaper articles in Russia, it also specifies the disruption costs (Klein and Regan, Reference Klein and Regan2018) of the protests to avoid any potential biases stemming from respondents’ own perceptions about the likely existence and magnitude of such costs (for a more elaborate discussion of this issue, see the discussion below).
The main treatment is the government’s reaction to the protests. A regime may respond to protests both rhetorically and with actions. Rhetorically, governments may ignore demonstrations (Bishara, Reference Bishara2015), portray them in conciliatory terms, or outright scold and derogate their participants (Pop-Eleches and Way, Reference Pop-Eleches and Way2023; Arnon et al., Reference Arnon, Edwards and Li2023). In terms of actions, a regime can choose between allowing the protests and giving concessions, allowing the protests but not accommodating demands, and repressing them (Klein and Regan, Reference Klein and Regan2018). In this study, we focus on government actions only. As respondents are deliberately not informed of the different protester groups’ demands, we only vary between two responses. Either respondents are informed that the government orders the police to allow the protests to continue without interfering (see the left panel in Table 1) or violently repress them (see the right panel in Table 1). In the latter scenario, the government’s order results in mass arrests of ‘more than 300 protesters’ and forty-two protesters being ‘hospitalized with serious injuries’.
Treatment vignettes

It is important to note that neither of these conditions constitutes a pure control condition, as both allowing and repressing protests are active decisions by the regime. This is equivalent to the real-world autocratic setting in Russia, where the government is the central arbiter of whether to grant or curtail civil liberties during protests, even if local authorities (here, the mayor of Moscow) may be in charge of handling such matters on a day-to-day basis. Note also that our respondents are specifically informed that protests were allowed, which in an authoritarian setting may signal some weak accommodation on behalf of the government, albeit still explicitly short of offering outright concessions. We did this to make sure that respondents understand that it is indeed the central government that is responsible for the decision to allow the protests, and thus also that it is ‘to blame’ for not responding coercively.
The main moderating variable is the respondent’s sympathy towards the protesting group. We measured group sympathy in the following way. In the vignette, the protesting group is randomly assigned to be one of the five groups explained above: supporters of Alexei Navalny, LGBT groups, Russian nationalists, communists, or Russian coal mine workers (see the example with supporters of Alexei Navalny in Table 1).
Before reading the vignette, respondents declared their views regarding each of these five potential protester groups, yielding a five-point sympathy score ranging from 0 to 4 for each group. By combining these two variables, we recover the value for our moderating variable. For example, imagine a given respondent has rated supporters of Alexei Navalny at 4 (‘Like very much’) and Russian nationalists at 0 (‘Dislike very much’) on the sympathy scale. If this respondent is exposed to a vignette in which the protester group is supporters of Alexei Navalny, then the moderating variable takes the value 4 for this particular respondent. If the respondent had instead been exposed to a vignette with Russian nationalists, the moderating variable would have taken the value 0.
Figure 1 presents sympathy distributions for each potential protester group. As expected, sympathy levels vary nicely across the five different groups. Russian nationalists and LGBT groups are the two groups perceived least favorably, while the group of coal mine workers enjoys the widest sympathy. For the two most potent political opposition forces in Russia – supporters of Alexei Navalny and the communists – the picture is more complex: sympathy indications are distributed across the entire spectrum, although more respondents clearly express stronger antipathy to Navalny supporters in comparison to communists. Moreover, as shown in the appendix, the sympathy distributions across the various protester groups (except for Navalny supporters) look similar for regime supporters and non-supporters.
Public sympathy for each potential protester group.
Note: Frequency distributions of respondents’ answers to ‘How much do you like or dislike the following groups in Russia?’ Answer categories: (0) Dislike very much; (1) Dislike somewhat; (2) Neither like nor dislike; (3) Like somewhat; (4) Like very much.

Outcome Questions
After reading the vignette, respondents are asked to assess on a five-point scale ranging from 0 to 4 whether they approve of the government’s response to the protest and of the way Vladimir Putin is handling his job as president. That is, we want to know whether ordinary Russians blame central authorities and the dictator himself for how protests are dealt with (Beazer and Reuter, Reference Beazer and Reuter2019). After all, it is the attribution of blame to this level, and not to local authorities, that usually drives regime-changing mobilizations (Chenoweth and Stephan, Reference Chenoweth and Stephan2011). In most models, we focus on respondents’ approval of the government’s response. At the end of the main empirical analysis, we address effects on the views of Vladimir Putin’s job approval.
Asking respondents about the government’s and the leader’s performance in a repressive autocracy such as Russia can induce social desirability bias (Kuran, Reference Kuran1997; Gonzalez-Ocantos et al., Reference Gonzalez-Ocantos, De Jonge, Meléndez, Osorio and Nickerson2012). That is, there is a potential risk that respondents will not declare their genuine opinions out of fear of repercussions (Young, Reference Young2019). Yet research on Russia generally concludes that respondents, at least before the war on Ukraine, feel comfortable expressing negative views regarding the regime (Frye et al., Reference Frye, Gehlbach, Marquardt and Reuter2017; Greene and Robertson, Reference Greene and Robertson2019; Frye et al., Reference Frye, Gehlbach, Marquardt and Reuter2023).
Seemingly, this is also what we observe in the distribution of answers to the two outcome questions in Figure 2. Overall, many respondents revealed disapproval of the government’s handling of the event, and many voiced overall disapproval of Putin. In fact, for the repression treatment, people are almost equally likely to declare their disapproval of the authorities as they are to express their approval, which suggests that respondents trust and respond well to our repeated reassurances of anonymity throughout the survey (see Shen & Truex 2021). Note also that, on average, more Russians disapprove of protests being repressed than protests being allowed, though the dominant response for both scenarios is an agnostic one – neither approving nor disapproving. While different distributions might have been attained using alternative methods for exploring sensitive issues, such as endorsements or list experiments (Kramon and Weghorst, Reference Kramon and Weghorst2019; Blair et al., Reference Blair, Imai and Lyall2014), we feel confident that our experimental strategy still yields valid results.
Distributions of public approval.
Note: Frequency distributions of respondents’ answers to ‘Do you approve or disapprove of the way authorities responded to the protest?’ and ‘In general, do you approve or disapprove of the way Vladimir Putin is handling his job as president?’ Answer categories: (0) Strongly disapprove; (1) Somewhat disapprove; (2) Neither approve nor disapprove; (3) Somewhat approve; (4) Strongly approve.

Estimation Method
The main estimation strategy consists of a series of OLS models and takes the following general form:
 $${{\rm{A}}_{\rm{i}}} = {\rm{\beta }}{{\rm{R}}_{\rm{i}}} + {\rm{\delta }}{{\rm{S}}_{\rm{i}}} + {\rm{\varphi }}\left( {{{\rm{R}}_{\rm{i}}}{{\rm{S}}_{\rm{i}}}} \right) + {{\rm{\varepsilon }}_{\rm{i}}}$$
for i = 1, …, n respondents.
The dependent variable, ${{\rm{A}}_{\rm{i}}}$
, is approval of the government’s handling of the protests (substituted for approval of President Putin in subsequent models).
${{\rm{A}}_{\rm{i}}}$
, is approval of the government’s handling of the protests (substituted for approval of President Putin in subsequent models). $ {\rm R}_{{\rm i}} $
represents the main treatment variable, the government’s response to the protests, and
$ {\rm R}_{{\rm i}} $
represents the main treatment variable, the government’s response to the protests, and ${\rm S}_{{\rm i}} $
constitutes a given respondent’s sympathy for the randomly selected protest group in the vignette. Most importantly, the product term of the two variables,
${\rm S}_{{\rm i}} $
constitutes a given respondent’s sympathy for the randomly selected protest group in the vignette. Most importantly, the product term of the two variables, $ {\rm R}_{{\rm i}}{\rm S}_{{\rm i}} $
, denotes how the effect of the government’s reaction changes across various levels of sympathy for the protest group.
$ {\rm R}_{{\rm i}}{\rm S}_{{\rm i}} $
, denotes how the effect of the government’s reaction changes across various levels of sympathy for the protest group. $ {\rm \epsilon} _{{\rm i}} $
is the error term, and all models use robust standard errors. In what follows, all results are presented graphically to increase readability (see Appendix SI D for regression tables).
$ {\rm \epsilon} _{{\rm i}} $
is the error term, and all models use robust standard errors. In what follows, all results are presented graphically to increase readability (see Appendix SI D for regression tables).
All results are presented for the entire sample of respondents. Yet to show varying effects across core regime supporters and non-supporters, all results are also disaggregated across respondents from both sides. Regime supporters are those who voted for the party in power, United Russia, in the last Duma election. Regime non-supporters are citizens who voted for either the Communist Party of the Russian Federation, The Liberal-Democratic Party of Russia, Patriots of Russia, Yabloko, Progress Party/Russia of the Future, A Just Russia, Party of Growth, or The Party of Popular Freedom PARNAS.Footnote 5
Though these parties include both the ‘systemic’ and ‘non-systemic’ opposition and not all are therefore in direct opposition to United Russia, we characterize their voters as ‘non-supporters’ of the Putin regime, given that they do not directly support Putin’s party.
Main Results
Figure 3 presents the estimated approval of the government’s reaction to the protests for the two treatment conditions – allowing protests (blue circles) and repressing protests (red squares) – across levels of sympathy for the protesting group. The results generally show that violent repression does come at a cost. When ordinary citizens are confronted with repression of groups to which they are sympathetic, they markedly disapprove of the government’s handling of the event. This is further evidenced in Figure 4, which shows the actual distributions of approval/disapproval of government repression across various levels of sympathy for the randomly exposed protester group. When liked protester groups are repressed by the government, fifty-five to fifty-six per cent disapprove of the government’s handling of the protests. These results thus lend strong support to Hypothesis 1.
Public approval of government reactions across levels of sympathy.
Note: The first and third rows present estimated values of approval of the government’s reaction to the protests for the two treatment conditions – allowing protests (blue circles) and repressing protests (red squares) – across levels of sympathy for the protesting group. The first row presents results for linear estimations given by Equation (1) above; the third row presents non-linear results (categorical specifications of $ {\rm S}_{{\rm i}} $
). The associated marginal effects are presented in black circles below each graph (second and fourth rows). The first column presents results for the entire sample, the second column presents results among regime supporters only, and the third column shows results for regime non-supporters only. Histograms show the distribution of sympathies towards the randomly chosen protester group to which respondents are exposed.
$ {\rm S}_{{\rm i}} $
). The associated marginal effects are presented in black circles below each graph (second and fourth rows). The first column presents results for the entire sample, the second column presents results among regime supporters only, and the third column shows results for regime non-supporters only. Histograms show the distribution of sympathies towards the randomly chosen protester group to which respondents are exposed.

Public approval and disapproval of repression across levels of sympathy.
Note: Charts of the estimated distributions of support for repression across respondents’ level of sympathy for the randomly exposed protest group. Results are shown for all respondents (left column), regime supporters (middle column), and regime non-supporters (right column). Green equals approval of repression (somewhat approve or strongly approve); gray equals indifferent (neither approve nor disapprove); and red equals disapproval of repression (strongly disapprove or somewhat disapprove).

However, and even more importantly, the results also reveal that the effects of government repression on public approval are highly conditional on sympathy for the protest group. For the full sample, we observe that when citizens are confronted with violent repression of a group they strongly dislike (0 on the sympathy score), they become more approving of the government’s response. That is, bystanders are less likely to approve of the government’s reaction if peaceful protests are allowed to continue, and they are more likely to approve of the response when protests are violently repressed. These results are not simply an artifact of the linear specifications. As is evident from the third and fourth rows of graphs in Figure 3, the results are very similar when we relax the linear assumptions.
As is evident in Figure 4, a whopping sixty-one per cent approve of the government’s repression, and a further eighteen per cent are indifferent, resulting in acceptance of repression among an estimated seventy-nine per cent of the Russian population. This is a substantial increase in public approval compared to the scenario of liked groups protesting, indicating that many ordinary citizens simply accept violent repression of groups they strongly dislike. Moreover, the Russian government is seemingly also free to violently repress groups that are somewhat disliked (1 on the sympathy score). Here, the difference is indistinguishable from zero, meaning citizens do not disapprove when such groups are violently repressed. Indeed, as Figure 4 demonstrates, an estimated sixty-nine per cent either approve of (thirty-six per cent) or are indifferent to (thirty-three per cent) the repression. Even when citizens neither like nor dislike the repressed group, an estimated sixty-one per cent either approve of (twenty per cent) or are indifferent to (forty-one per cent) the repression. These results further suggest that the impact of repression is indeed conditional on sympathy for protester groups.
In addition, the positive approval effects of repression are notably larger among the segment of society that already supports the regime. Among this constituency, repressing a strongly disliked group increases approval up to as high as seventy-two per cent, with an additional fourteen per cent being indifferent. Repression of a somewhat disliked group also generates popular approval dividends, and a clampdown on a group that bystanders neither like nor dislike only comes with a minor cost in approval ratings (twenty-one per cent disapproving of the repression), albeit much smaller than what we see in the plot for the entire population.
Even for those who did not support the regime party at the last election, the pattern is the same. The less sympathy observers hold towards the protesting group, the more they are ready to accept repression, and the less they approve of allowing protests. Thus, altogether, our results also lend strong support to Hypothesis 2. An important difference, however, is that the point where the blue and red lines cross in Figure 3 – what we can term the ‘repression–dissent equilibrium’ – moves further to the left for this latter group, meaning that regime non-supporters are generally less inclined to accept repression in comparison to core regime supporters. Yet, as evidenced in Figure 4, even among regime non-supporters, only a minority disapprove of disliked and somewhat disliked groups being repressed by the government.Footnote 6
Overall, the results corroborate the two hypotheses. Repressing societal groups in Russia induces approval by citizens who dislike the repressed group and disapproval by citizens who like the group.
Heterogeneous Effects Across Protester Groups
Figure 5 divides the sample into the five protester groups and presents split-sample results across each randomized protester group for all respondents (left), regime supporters (middle), and regime non-supporters (right). For groups that divide Russian citizens – notably, Navalny supporters, LGBT groups, and nationalists – the results again demonstrate that public approval of repressing highly and moderately disliked groups is higher compared to that of allowing protests (for core regime supporters), but that the repression–dissent equilibrium moves further to the left for regime non-supporters, who no longer approve of repression more than of allowing protests when the targeted group is only moderately disliked. For groups that generally enjoy high popularity (such as coal mine workers) or groups towards which people are mostly indifferent (such as communists), the effect of repressing disliked groups does not seem to induce positive approval effects. This is most likely explained by the fact that very few people dislike these groups, which in turn yields inefficient and imprecise estimations for lower levels of sympathy.
Split-sample analyses across protester groups.
Note: Split-sample results across each randomized protester group for all respondents, regime supporters, and regime non-supporters. Graphs present estimated values of approval of the government reaction to the protests for the two treatment conditions – allowing protests (blue circles) and repressing protests (red squares) – across levels of sympathy for the protesting group. Histograms show the distribution of sympathies towards the randomly chosen protester group to which respondents are exposed.

Figure 6 presents the estimated distributions of support for repression across protest groups among all respondents (left), regime supporters (middle), and regime non-supporters (right). Again, as is evident from the left column of Figure 6, repressing protester groups rarely produces strong backfire effects among the Russian public. For groups that divide the Russian population – such as Navalny supporters, LGBT groups, and Russian nationalists – approximately one-third approve of repression, one-third disapprove, and one-third is indifferent. That is, repressing such groups leads to a public backlash among only a third of the population, whereas two-thirds either do not care or outright approve of the repression. For generally popular groups in Russia (such as coal mine workers) or those that most Russians neither like nor dislike (such as communists), the conclusion is somewhat different. Here, just below half of the population disapproves of repression, demonstrating that repressing such groups has higher costs for the regime. Still, even for these broadly non-controversial groups, a small majority of Russians either approve of or remain indifferent to repression. This suggests that if need be, the Russian regime can even repress these groups without fearing that most of the population will turn against it.
Estimated support for repression in the Russian population across protester groups.
Note: Charts of the estimated distributions of support for repression across protest groups among all respondents (left column), regime supporters (middle column), and regime non-supporters (right column). Green equals approval of repression (somewhat approve or strongly approve); gray equals indifferent (neither approve nor disapprove); and red equals disapproval of repression (strongly disapprove or somewhat disapprove).

The middle column of Figure 6 shows the distributions among regime supporters only. It demonstrates that repression is a highly potent instrument to increase approval among core supporters of the regime. Only a minor proportion of regime supporters disapprove of repression, even when coercion targets more popular groups. Instead, even in such scenarios, most regime supporters either approve of or remain indifferent to violent repression. This provides evidence that the Putin regime can violently repress peaceful protests without much backlash from its core supporters.
The right column of Figure 6 presents the estimated distributions for all regime non-supporting respondents. The figures clearly show that repression triggers more negative reactions for this group of respondents. For most protester groups, around half of regime non-supporters disapprove of repression, while for the LGBT group, the number is only one-third. However, even here, around half of the respondents (and two out of three in the case of LGBT groups) reveal acceptance of or indifference to repression.
Repression and Leader Approval
In our two hypotheses, we proposed that sympathy levels toward the protester group condition acceptance of the regime’s response to protests and the general approval of the regime leader, who is typically perceived as the ultimate decision-maker in authoritarian regimes.
Figure 7 presents the estimated approval of Putin for the two treatment conditions – allowing protests (blue circles) and repressing protests (red squares) – across levels of sympathy for the protesting group. The figures clearly show that applying violent coercion against peaceful protesters results in only minor, albeit significant, decreases in the president’s popularity, and only in cases where the protesting groups enjoy strong or moderate sympathy among bystanders, and only among those respondents who do not belong to the core base of the regime. Thus, a key takeaway is that the Russian regime’s use of coercion does not produce substantial legitimacy costs for President Putin. Note also that repression sometimes even produces popularity dividends as regime supporters increase their approval of the incumbent significantly when disliked groups are repressed, although again, the changes are marginal. Thus, we find the contours of a pattern similar to what we observed in our first analysis, but the differences are much smaller. For this outcome, our two hypotheses are thus more weakly corroborated. Below, we discuss possible explanations for these somewhat diverging results.
Public approval and disapproval of President Putin across levels of sympathy.
Note: The first and third rows present estimated values of approval of President Putin for the two treatment conditions – allowing protests (blue circles) and repressing protests (red squares) – across levels of sympathy for the protesting group. The first row presents results for linear estimations given by Equation (1) above; the third row presents non-linear results (categorical specifications of $ {\rm S}_{{\rm i}} $
). The associated marginal effects are presented in black circles below each graph. The first column presents results for the entire sample, the second column presents results among regime supporters only, and the third column shows results for regime non-supporters only. Histograms show the distribution of sympathies towards the randomly chosen protester group to which respondents are exposed.
$ {\rm S}_{{\rm i}} $
). The associated marginal effects are presented in black circles below each graph. The first column presents results for the entire sample, the second column presents results among regime supporters only, and the third column shows results for regime non-supporters only. Histograms show the distribution of sympathies towards the randomly chosen protester group to which respondents are exposed.

Discussion
How do our results compare with existing research? First of all, we partly confirm studies that argue that repression can indeed be costly (Ritter, Reference Ritter2014; Poe et al., Reference Poe, Tate, Keith and Lanier2000; Young, Reference Young2013; Chenoweth et al., Reference Chenoweth, Perkoski and Kang2017: 1958; Earl, Reference Earl2011; Earl and Soule, Reference Earl and Soule2010; Opp and Roehl, Reference Opp and Roehl1990: 523–5; DeNardo, Reference DeNardo1985: 191–2; LeBas and Young, Reference LeBas and Young2024). However, we also show that one of the crucial assumptions in the repression–dissent literature – namely, the mechanism that state coercion produces a backlash in the form of legitimacy costs and eventually increased opposition – needs qualification. While we do not analyze respondents’ willingness to partake in protests, our experiment shows that repression per se cannot be assumed to be a costly tool for dictators. Bystanders do not automatically sanction the regime’s decision to use coercion, nor do they automatically punish the leader, and on this basis, we should also not expect them to be more likely to join ongoing protests. Rather, based on our Russian survey experiment, we show that bystanders’ evaluations of repression are conditional on the emotional relationship between the bystander and the repressed group, as has also been found in democratic contexts (Manekin and Mitts, Reference Manekin and Mitts2022). Depending on the degree to which different bystanders sympathize with particular protest groups, repression can indeed be considered costly (in relation to those who like the protest group), but it may also prove costless (in relation to those who do not hold strong feelings towards the protest group) or even enhance support (in relation to those who dislike the protest group).
Second, for the latter type of (albeit non-typical) bystanders, we surprisingly show that it is not the act of repressing but the act of not repressing that is sanctioned and eventually becomes costly for the ruler. This indicates that autocrats may face incentives to use repression beyond what is usually pointed to in research, namely applying coercion to eliminate manifest threats or to deter would-be challengers (Escribà-Folch, Reference Escribà-Folch2013; Davenport, Reference Davenport2007a). In addition, repression may also have a performative character in the sense that dictators apply it as signals or concessions to groups among the population whose attention and support they want to attract. And if this is right, we should expect authoritarian leaders to be more devoted to delivering on performative repression when they feel a stronger need to tie particular groups to the regime, such as during elections or economic crises, or when unpopular policy reforms are being implemented. Thus, we strongly urge future research to analyze cross-temporal patterns of coercion against particular, disliked groups within dictatorships. Using fine-grained observational data on repressed groups and regime-controlled media reporting on such activities, it might be possible to detect when performative repression is more likely to be applied and sought to be attenuated by the regime.
Third, in this way, our findings are also in line with recent studies that argue that the existence and size of legitimacy costs connected to applying repression are conditional on a number of bystander characteristics. Most studies, however, highlight respondents’ party identification (LeBas and Young, Reference LeBas and Young2024; Esberg, Reference Esberg2021,Reference Esberg2018; Curtice, Reference Curtice2021; Curtice and Behlendorf, Reference Curtice and Behlendorf2021) and show that backlash effects, in the form of decreases in the acceptance and/or approval of the regime and its leader, are generally larger for regime opponents. However, it is not clear from the existing research whether backlash effects among regime supporters are just smaller (Gutiérrez-Romero and LeBas, Reference Gutiérrez-Romero and LeBas2020; LeBas and Young, Reference LeBas and Young2024), whether they exist at all (Curtice, Reference Curtice2021; Curtice and Behlendorf, Reference Curtice and Behlendorf2021), or whether repression rather generates positive externalities among those who back the regime (Esberg, Reference Esberg2020,Reference Esberg2018; Tsai, Reference Tsai2021). We find that the general picture of regime supporters in Russia is that they are supportive of or remain indifferent towards the use of repression, but, importantly, that their response to coercion – like for regime non-supporters – is also conditional on their sympathy towards the groups targeted, and thus in line with a recent finding on feminists by Naunov (Reference Naunov2025). Thus, it may be that the inconsistent findings in the existing literature concerning backlash effects among regime supporters may be explained by the fact that targets of repression in different studies enjoy different levels of sympathy among regime supporters.
Fourth, while we show that both repression and non-repression can generate costs among our Russian respondents in the form of disapproval of the government’s response, we also, surprisingly, find that such costs do not seem to affect the approval of the regime’s incumbent. If we assume that the approval levels of the regime leader are roughly equivalent to general regime support levels, we can conclude that another important assumption in the repression–dissent mechanism chain does not hold up in our Russian case. That is, bystanders’ approval of the leader is only marginally affected by the regime’s repression decisions; even if observers disapprove of the use of coercion against protesters, this rarely translates into increases in disapproval of the incumbent, which in turn makes it less likely that we will see repression leading to increased anti-regime mobilization and opposition as argued in the repression–dissent research (Ritter, Reference Ritter2014; Poe et al., Reference Poe, Tate, Keith and Lanier2000; Young, Reference Young2013; Chenoweth et al., Reference Chenoweth, Perkoski and Kang2017: 1958; Earl, Reference Earl2011; Earl and Soule, Reference Earl and Soule2010; Opp and Roehl, Reference Opp and Roehl1990: 523–5; DeNardo, Reference DeNardo1985: 191–2; LeBas and Young, Reference LeBas and Young2024).
One explanation for this unexpected finding is that Russians, even though it was explicitly stated in the vignette that police took orders from the national government, do not blame Putin himself for how authorities respond to local protests. Unfortunately, our experiment does not allow us to test whether blame is attributed instead to local executives (here, the Mayor of Moscow), state officials on the ground (here, the Moscow police), or particular ministers. However, irrespective of the reason, our results show that Putin effectively deflects responsibility for unpopular policies (Beazer and Reuter, Reference Beazer and Reuter2019).
Another explanation is that repression of protesters is so common in contemporary Russia that respondents do not consider our vignettes as new information and thus do not update their beliefs about the leader and the regime. That is, it could be that both regime supporters and non-supporters expect authorities to clamp down on demonstrations, and therefore the regime’s repressiveness is already ‘factored in’ to their assessments of the regime. However, if this is the case, we should expect scenarios where the regime does not repress to reveal new information to our respondents. Indeed, a recent natural experiment in Russia shows that opposition voters, who were surprised by the fact that authorities did not crack down on protests, subsequently increased their trust in the government (Frye and Borisova, Reference Frye and Borisova2019). However, we do not find similar patterns. Neither regime supporters nor non-supporters seem to change their perception of the regime leader much, irrespective of whether they receive information about the regime being lenient or coercive.
Alternatively, a plausible explanation for the group of regime supporters is that they act as ‘conditional democrats’, prioritizing partisan gains over respect for the freedom of expression and assembly (Graham and Svolik, Reference Graham and Svolik2020; Svolik, Reference Svolik2019). A recent experimental study supports such an interpretation, as it shows that while United Russia supporters do not approve of election fraud and update their perceptions of the legitimacy of elections when treated with fraud information, they do not sanction Putin himself (Aarslew, Reference Aarslew2024). We find very similar patterns in our experiment.
The appendix presents further evidence that ordinary Russians across political orientations may indeed behave as conditional democrats. Through a causal mediation analysis, we examined the mechanisms between the government’s response to the protests and public approval of the reaction across different levels of bystander sympathy with the protester group. We show that in the case of low-sympathy protester groups, Russians accept repression because they think it helps uphold law and order in their country, even as they understand that repressing a non-violent protester group violates principles of individual freedom and civil rights. Only for liked groups does the ‘freedom and rights’ mechanism kick in. That is, Russians seemingly only support the freedom of expression and assembly for those protester groups they like, while for those they dislike, they instead accentuate the costs that protests generate in the form of threatening law and order.
Lastly, it may be that some proportion of Russians are wary of not endorsing the President in a context of popular mobilization. Though our design cannot determine the extent to which this is the case, we feel confident that the majority of respondents in our survey are not afraid to speak their mind on these issues, as many do disapprove of the government’s handling of the event, and many voice overall disapproval of Putin. However, some degree of preference falsification cannot be ruled out, and we therefore encourage future studies to apply methods such as endorsement and list experiments (Kramon and Weghorst, Reference Kramon and Weghorst2019; Blair et al., Reference Blair, Imai and Lyall2014) tailored to measure and thus account for such potential biases. This would be particularly important were this experiment to be replicated in post-2022 Russia, after which protests have become less common and the regime has turned more repressive and much less tolerant of dissenting views.Footnote 7
Generalizability
Having discussed how our findings compare to existing research, we now turn to another important question: to what degree are our results generalizable? One potential issue concerns the country in which we fielded the survey. Russia is a personalist, electoral authoritarian regime (Reuter, Reference Reuter2013; Reuter and Szakonyi, Reference Reuter and Szakonyi2019; Treisman 2018). In recent years, this regime type has become the dominant form of autocracy in the world (Frantz et al., Reference Frantz, Kendall-Taylor, Wright and Xu2020; Kendall-Taylor et al., Reference Kendall-Taylor, Frantz and Wright2017), which means that our findings may indeed also be valid in many other dictatorships today. However, we think they may travel even further. There is nothing in the logic of our argument that should lead us to think that it will not also apply to other types of autocracy, be it party regimes, military dictatorships, or monarchies (Geddes, Reference Geddes1999; Geddes et al., Reference Geddes, Wright and Frantz2014), and maybe even to troubled democracies such as Hungary under Victor Orban. Likewise, research shows that there is no reason to believe that ordinary Russians hold unique personality traits or have extreme values (Allik et al., Reference Allik, Realo, Mõttus, Pullmann, Trifonova, McCrae, Yurina, Shebanets, Fadina and Tikhonova2011) that would caution us against inferring our findings on Russians to other populations.
That said, where Russia does stand out is regarding the popularity of the Russian president. As we discussed above, we find that Putin’s approval ratings are largely unaffected by decisions to use repression. Putin has long been a very dominant but also quite popular figure in Russian politics (Frye et al., Reference Frye, Gehlbach, Marquardt and Reuter2017; Frye et al., Reference Frye, Gehlbach, Marquardt and Reuter2023), meaning that respondents likely have strong prior opinions regarding the incumbent. Moreover, they are used to seeing repression carried out by authorities, and may even consider it to be ‘business as usual’. It could thus be hypothesized that in less repressive contexts and in regimes where incumbents have been in power for a shorter period of time, it may still be that disapproval of repression activities translates into less approval of the regime, while for long-lasting rulers of repressive regimes like Putin, it simply takes more to move bystanders’ perception of the regime – be it more large-scale repression or simply more brutality. That is, what serves as a triggering event for backlash against repression may differ greatly across different regime contexts. We strongly urge scholars to investigate these issues further.
Another issue concerns the characteristics of the protest event that we depict in our survey. One might object that the fact that the demonstrations cause a traffic jam in the city center makes respondents more likely to approve of coercion and stress the importance of the principle of upholding law and order. Still, the disruption cost is relatively small and, from a democratic viewpoint, does not justify the harsh repression response of authorities that we depict in the vignette (300 arrested and forty-two hospitalized with serious injuries). More importantly, it is far from an unrealistic scenario, and it is precisely such disturbances that regime-controlled media are likely to highlight in autocracies in an attempt to discredit protesters (Arnon et al., Reference Arnon, Edwards and Li2023). While we cannot know what the results would have looked like if we did not specify the disruption costs caused by the protests, the findings from our causal mediation analysis seem to indicate that respondents lend more weight to such costs when assessing repression of disliked groups, but whether this happens as a result of an ex-post justification process or because they are truly concerned with this issue is difficult to tell. An experimental setup that varies both the ‘likedness’ of the protester group and the disruption costs associated with the protest could help disentangle these different mechanisms.
Finally, our survey experiment analyzes a ‘clean’ repression effect in the sense that we abstract away from regime propaganda effects. In most autocracies, regimes will also respond to protests rhetorically, using regime-controlled media to frame protest events negatively, highlighting disruption costs and emphasizing that protesters often represent disliked, violent, and dangerous groups (Edwards and Arnon, Reference Edwards and Arnon2021; Williamson and Malik, Reference Williamson and Malik2019; Arnon et al., Reference Arnon, Edwards and Li2023; Pop-Eleches and Way, Reference Pop-Eleches and Way2023), which in turn is known to affect bystanders’ perceptions of the protester groups and thus their willingness to support a coercive response. Likewise, we should note that our survey varies protester groups, but that all are co-ethnics. In many autocracies, including Russia, ethnic diversity is high, interethnic relations are deeply conflictual, and intergroup animosity is likely even higher (Cederman et al., Reference Cederman, Wimmer and Min2010). In light of these two aspects, our experimental setup can be considered a conservative test of repression backlash effects, meaning that we should expect autocrats who control public media to have even more leeway when it comes to repressing groups who do not enjoy strong widespread sympathy in society, and perhaps even more so in contexts where the targets of repression are ethnic minority groups.
Future Protests in Russia?
Non-violent popular mobilization does indeed have the capacity to topple incumbent autocrats (Celestino and Gleditsch, Reference Celestino and Gleditsch2013; Ulfelder, Reference Ulfelder2005; Gleditsch et al., Reference Gleditsch, Radean and Olar2023). Based on our survey experiment, we cannot say whether or when non-violent protests will occur in Russia, but we can say something about the circumstances under which the regime may risk incurring legitimacy costs from repressing them.
The general, and disheartening, takeaway from our study is that Putin can repress demonstrations without taking any significant risks. At the least, this seems to have been the case prior to the 2022 Russian invasion of Ukraine. Our results on Navalny supporters indicate that the Russian regime is well-positioned to deal with potential protests if they are led by the traditional liberal opposition. A clear majority in both the general population and among regime supporters specifically would outright support or tacitly accept the repression of such protests. And though the likelihood of backfire may increase somewhat for the regime in cases where nationalists or communists spearhead mass mobilizations, the risk, it seems, is still manageable. While between a third and a half of respondents in our survey state that they would disapprove of repression against such groups, many Russians still support or accept it, and they generally do not sanction the incumbent for such actions.
Following the non-violent protest literature, the most dangerous situation for the Putin regime would be popular mobilizations with broader, cross-group participation (Chenoweth and Stephan, Reference Chenoweth and Stephan2011), as it is usually diverse coalitions of protester groups that bring down dictators (Nepstad, Reference Nepstad2011; Granovetter, Reference Granovetter1973; Thurber, Reference Thurber2019). Our study potentially provides the experimental micro-evidence for why this is the case. With more groups involved in protests, more bystanders will have someone to sympathize with, and the group-related animosity that we find drives acceptance of repression could therefore become less dominant, in turn increasing the likelihood that regime repression triggers a backlash among the broader population.
However, we should stress that our experiment cannot tell us what will happen if both liked and disliked groups appear together in a protest event. That is, we cannot be sure that disapproval effects connected to the repression of liked groups will crowd out approval effects related to the repression of disliked groups. And even if this were so, at the time of writing, a broad coalition of liberals, nationalists, and communists seems to be an unrealistic scenario in Russia (Armstrong et al., Reference Armstrong, Reuter and Robertson2020); nor do we see signs that potent civil society groups that cross different segments of Russian society are in the making. The Putin regime is not immune to revolution or a game-changing popular backlash, but, at least for now, it seems well-positioned to deal with dissenters the way autocrats have done for centuries: stifling protest with brute repression.
Supplementary material
The supplementary material for this article can be found at https://doi.org/10.1017/S0007123425100999.
Data availability statement
Replication data for this article can be found in Harvard Dataverse at: https://doi.org/10.7910/DVN/XEEGIR.
Acknowledgments
We thank the editor and the three anonymous reviewers at BJPS, the members of the International Relations section of the Department of Political Science at Aarhus University, the participants at the Methods of Authoritarian Domination panel at APSA (Montreal 2022), and participants at the Authoritarian Politics panel at DPSA (Vejle 2021) for valuable feedback.
Financial support
This research was funded by Innovationsfonden (P-number: 1013137702) and the Department of Political Science at Aarhus University.
Competing interests
All authors declare that they have no competing interests.
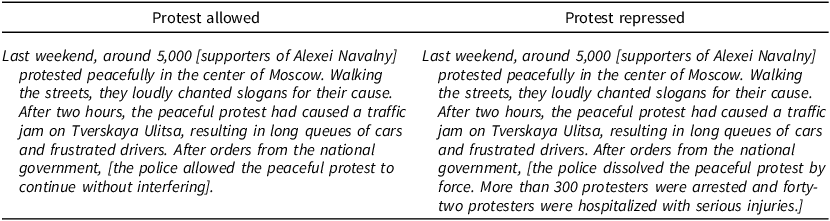
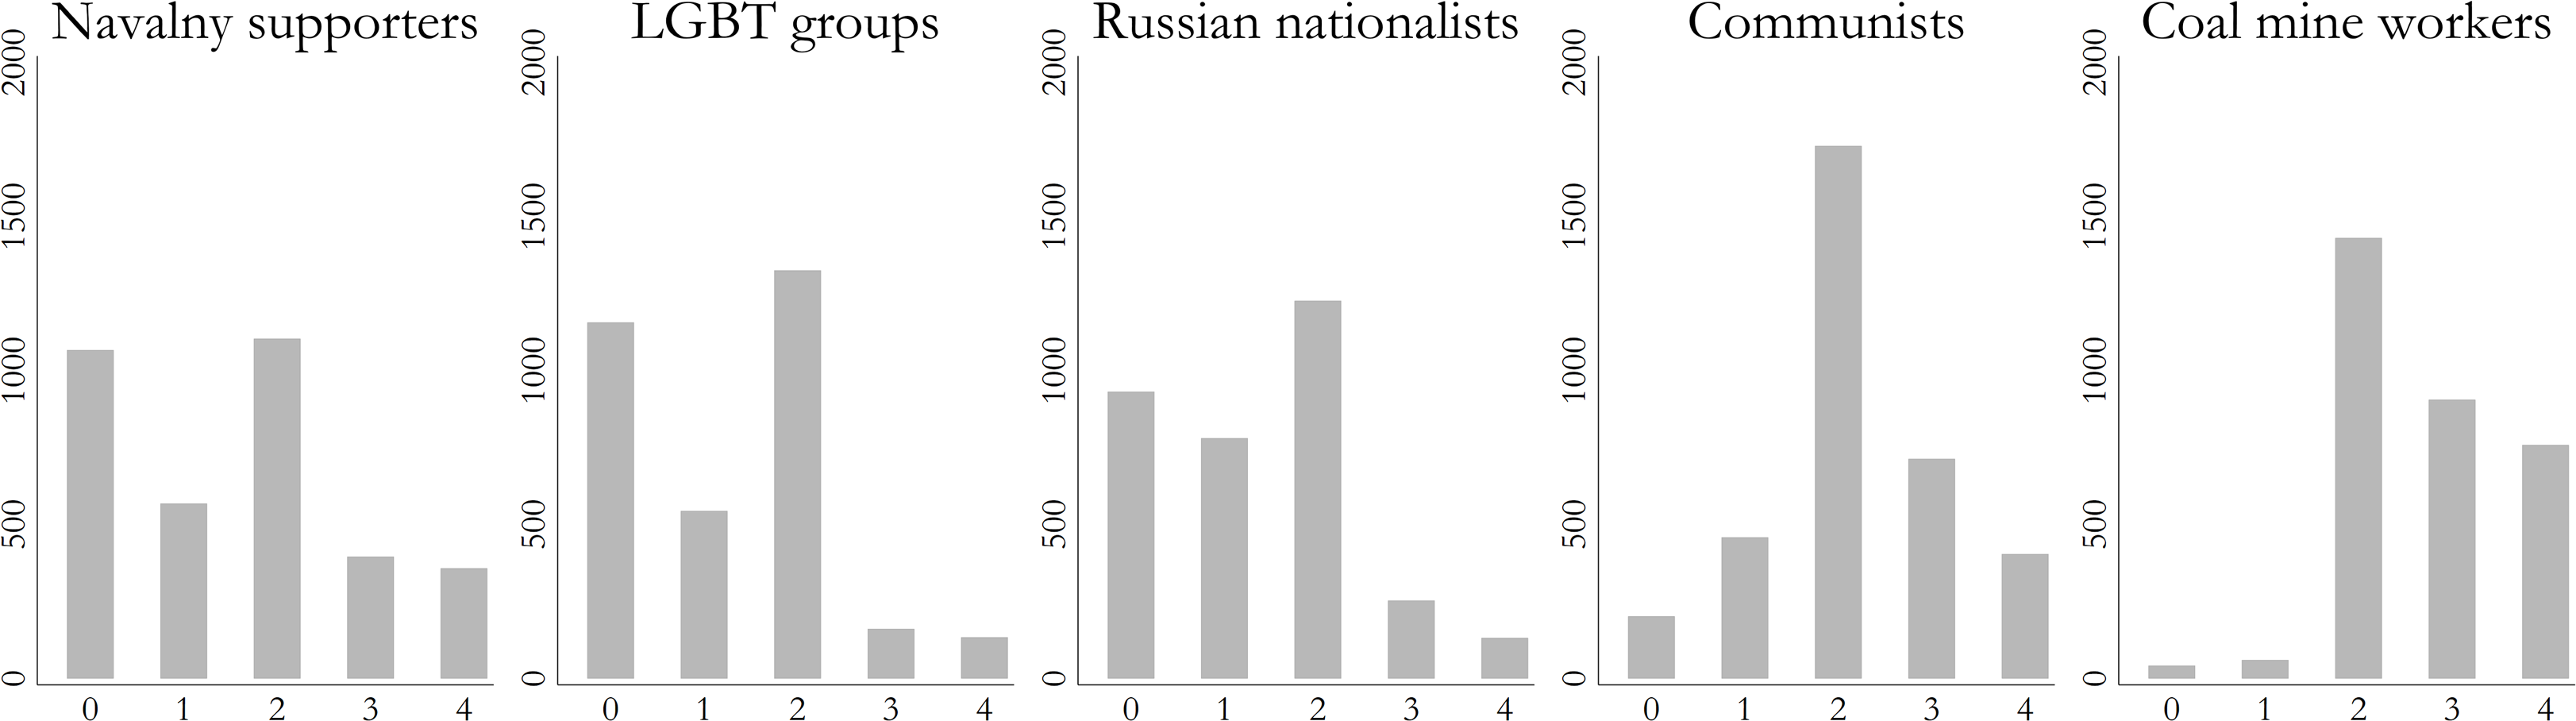
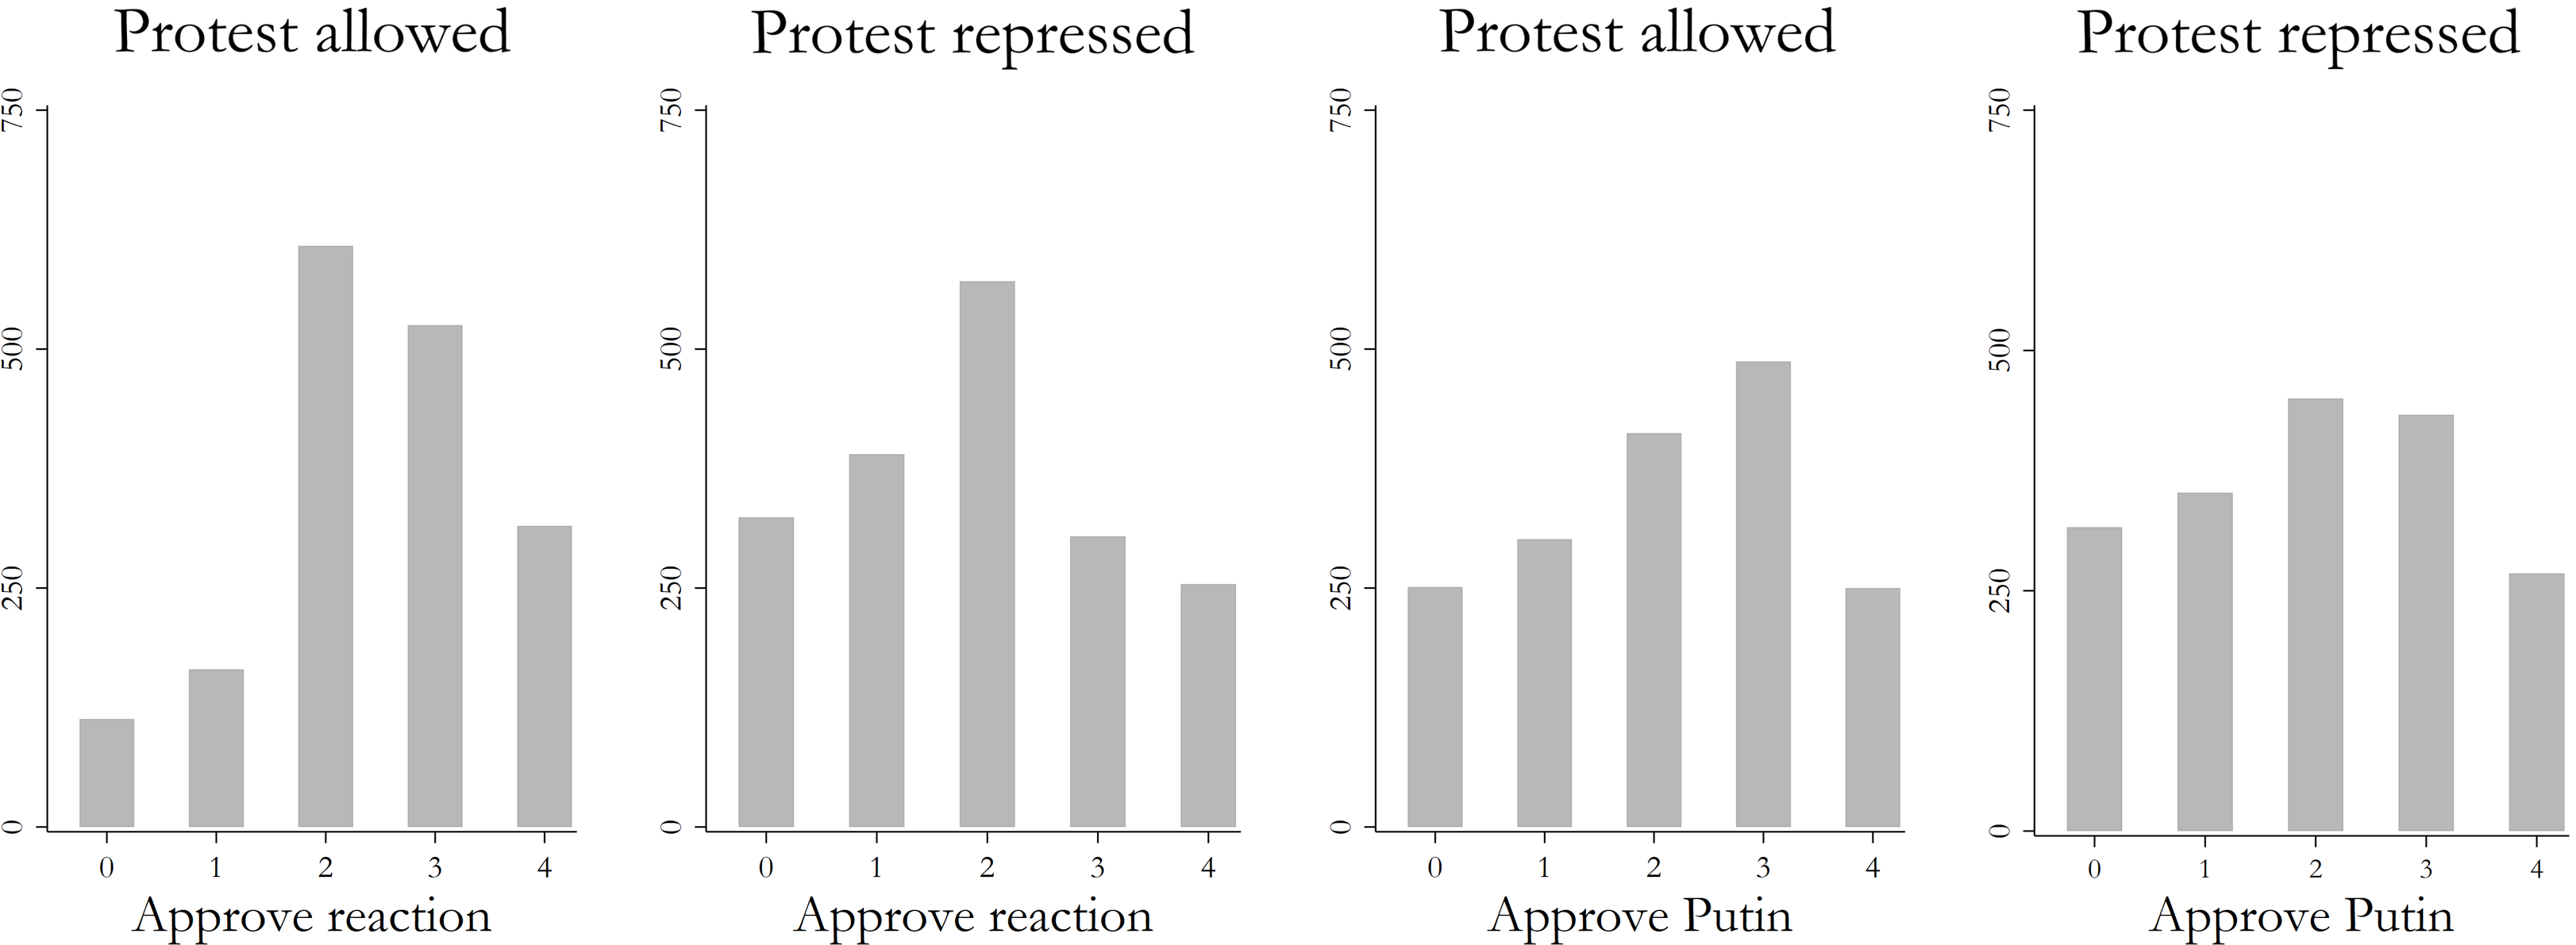
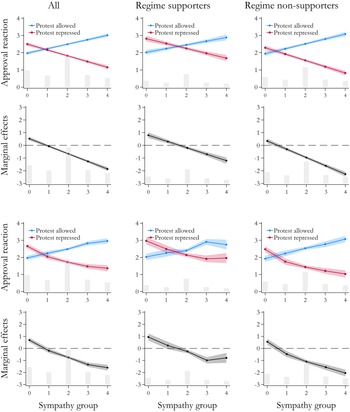

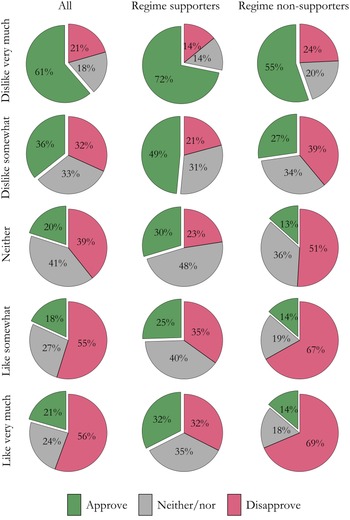
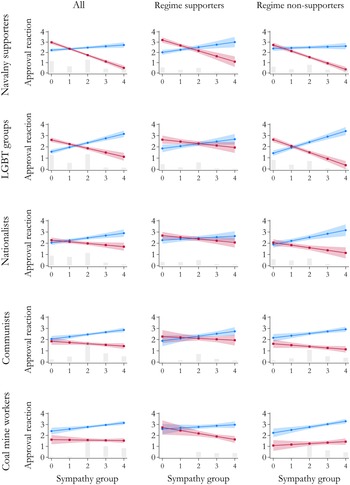
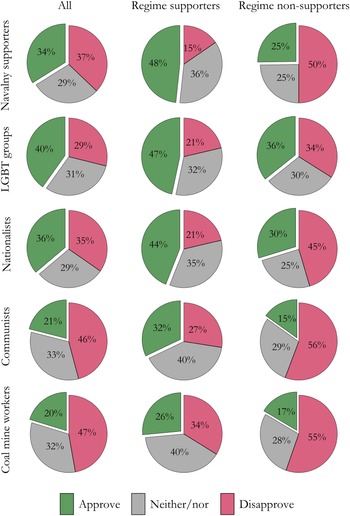


 Open access