


Introduction
Early changes in biomarkers probably occur some days before bloodstream infection (BSI) is diagnosed. This issue has not been fully addressed in previous clinically based studies, in particular in community-acquired (CA) infections [Reference Luyt1–Reference Póvoa4]. The assessment of biomarker kinetics before BSI diagnosis could provide knowledge on the basic understanding of underlying mechanisms of infection as well as improving the usefulness of biomarker kinetics in the clinical decision-making process.
Hospital-acquired infections frequently occur in patients with other non-infectious conditions that are associated with increased biomarker levels, e.g. previous surgery or IV lines. As CA infections occur in a previously healthier population, without those major inflammatory stimuli, they make a better model for studying biomarker kinetics before infection diagnosis.
An additional problem is the definite diagnosis of infection. Frequently, we are unable to obtain the microbiological documentation of an infection. This is particularly true in CA infections, e.g. due to previous antibiotics prescriptions and difficulty in obtaining good quality samples for microbiology, in particular in lower respiratory tract infections in patients without tracheal intubation. However, CA-BSI is a well-defined clinical entity based on clear and globally accepted clinical and microbiological diagnostic criteria [Reference Garner5].
The Danish Observational Registry of Infectious Syndromes (DORIS) is a population-based research database comprising CA-BSI patients as well as their data before the reference BSI episode, namely biochemistry and microbiological data [Reference Gradel6].
Consequently, the DORIS database enabled us to overcome the above-mentioned limitations of a CA infection definite diagnosis. In the present study, we aimed at evaluating the kinetics of C-reactive protein (CRP) and plasma albumin (PA) in the 30 days before the CA-BSI episode.
Methods
Setting
The Danish national health system is tax financed, covering both primary and hospital care. All residents have a unique civil registration number used for all health contacts and linkages between health administrative registries [Reference Schmidt, Pedersen and Sørensen7]. The admission of all residents with acute illnesses from a well-defined geographical region to a hospital prompted a population-based study based on data from registries and the medical records in the DORIS research database [Reference Gradel6]. The study was approved by the Danish Data Protection Agency (record no. 2013-41-2579). Approval by an ethics committee or consent from participants is not required for registry-based research in Denmark.
Initial study cohort
The study cohort has been described in detail elsewhere [Reference Gradel6]. In brief, it comprised all adults (>14 year) residing in the Funen County with the first episode of CA-BSI, in the period 2000–2008, a total of N = 2785 patients.
A CA-BSI was defined as BSI occurring <3 days after hospital admission and without inpatient contact in the preceding seven days. We had all the CA-BSI patients' hospital recorded CRP and PA measurements from 2000 through 2008 [Reference Gradel8]. Unrealistically low levels of PA (<11 g/l) were excluded. The CRP values below the limit of detection (<10 mg/l, N = 452 (14.5%)) were randomly allocated to a value in the range 0–9 mg/l, as described elsewhere [Reference Gradel8]. From this cohort we have derived different sub-cohorts based on the occurrence of CRP and/or PA within pre-specified time periods around the date of CA-BSI [Reference Gradel8–Reference Gradel10].
Final study cohort
We included CA-BSI patients with at least one measurement of CRP or PA from day −30 (D–30) through day −1 (D–1) before the day of CA-BSI (D0) and a measurement of the same biomarker at D0 or D1. D0 is defined as the day the blood culture is drawn.
Analyses of CRP and PA levels
All analyses were performed by the Department of Clinical Biochemistry and Pharmacology, Odense University Hospital, with the results recorded in Netlab (Medasys S.A., Littau, Switzerland). CRP was measured by an immunoturbidimetry method on Modular P® (Roche, Mannheim, Germany). PA was also measured on Modular P® by the use of a bromocresol green dye-binding method. All specimen dates refer to the date of drawing blood specimens.
Statistical analysis
CRP levels were not normally distributed whereas PA levels were. Because the results for means and medians were materially the same, we report the mean levels. CRP and PA concentrations were found to change their course prior to D0. This behaviour was modelled as a broken stick where two linear functions were defined on two distinct time-intervals, (D–30,c) and(c, D1) [11]. The intersection of the functions defined c as the point in time in which the concentration course changed and the parameters were determined by a broken stick regression (BSR). Differences in the dynamics of monomicrobial Gram-positive, monomicrobial Gram-negative and polymicrobial CA-BSIs were investigated by estimating distributions of the parameter-differences by a bootstrap algorithm (1000 replications) [Reference Efron and Tibshirani12]. A distribution with a 95%-confidence interval (CI) in which zero was not included would imply significance for the parameter-difference.
We used the program Stata, vs. 14 (StataCorp, College Station, TX, USA) for all analyses.
Results
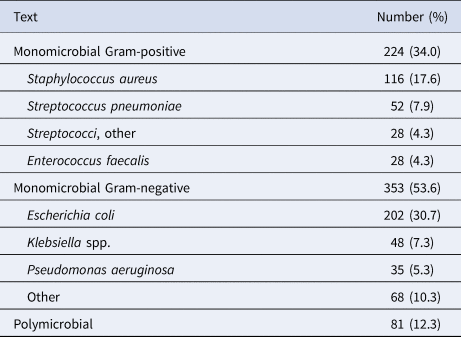
Among 658 patients, 576 fulfilled the criteria of CRP on D–30/−1 and D0/D1, 584 fulfilled this for PA, whereas 502 patients fulfilled this for both CRP and PA. The baseline clinical characteristics at the day of CA-BSI diagnosis are presented in Table 1. The microbiological isolates are shown in Table 2.
Baseline patient characteristics (n = 658)
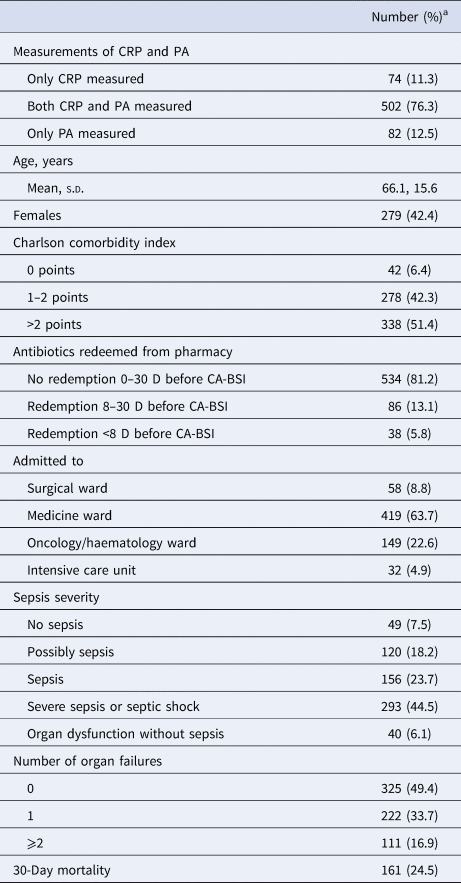
CRP, C-reactive protein; PA, plasma albumin; s.d. standard deviation.
a Except for ‘Age, years’, cf. text.
Microbiological isolates (n = 658)
CRP kinetics before CA-BSI diagnosis
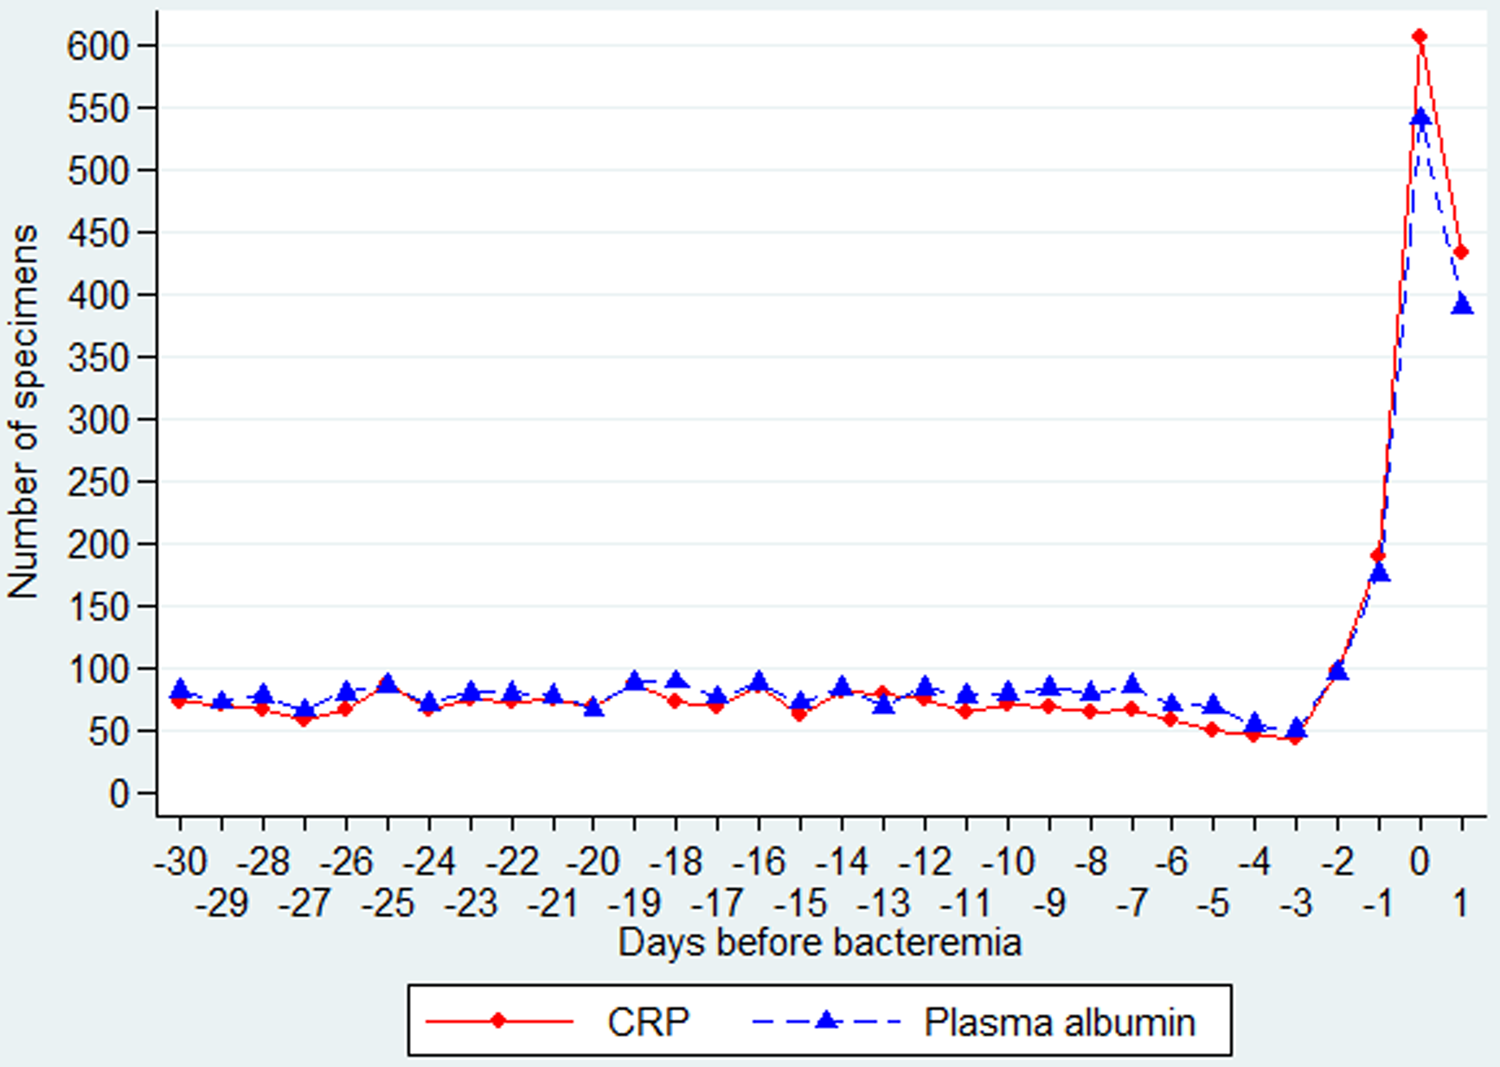
Among the 576 patients, the daily number of measurements was fairly constant until D–3 (range 44–87), increasing to 98 on D–2, 189 on D–1, 607 on D0, with a decline to 434 on D1 (Fig. 1). The CRP values were already elevated (>60 mg/l) in most of the 30 days before CA-BSI (Fig. 2, upper panel).
Daily number of specimens of CRP and PA from day −30 through day 1 (in relation to the day of the CA-BSI).
CRP (upper panel) and PA (lower panel) course from day −30 through the day after CA-BSI. The observed mean values (points) are fitted as two linear functions (lines) which are connected at the point of course change (indicated by an arrow).
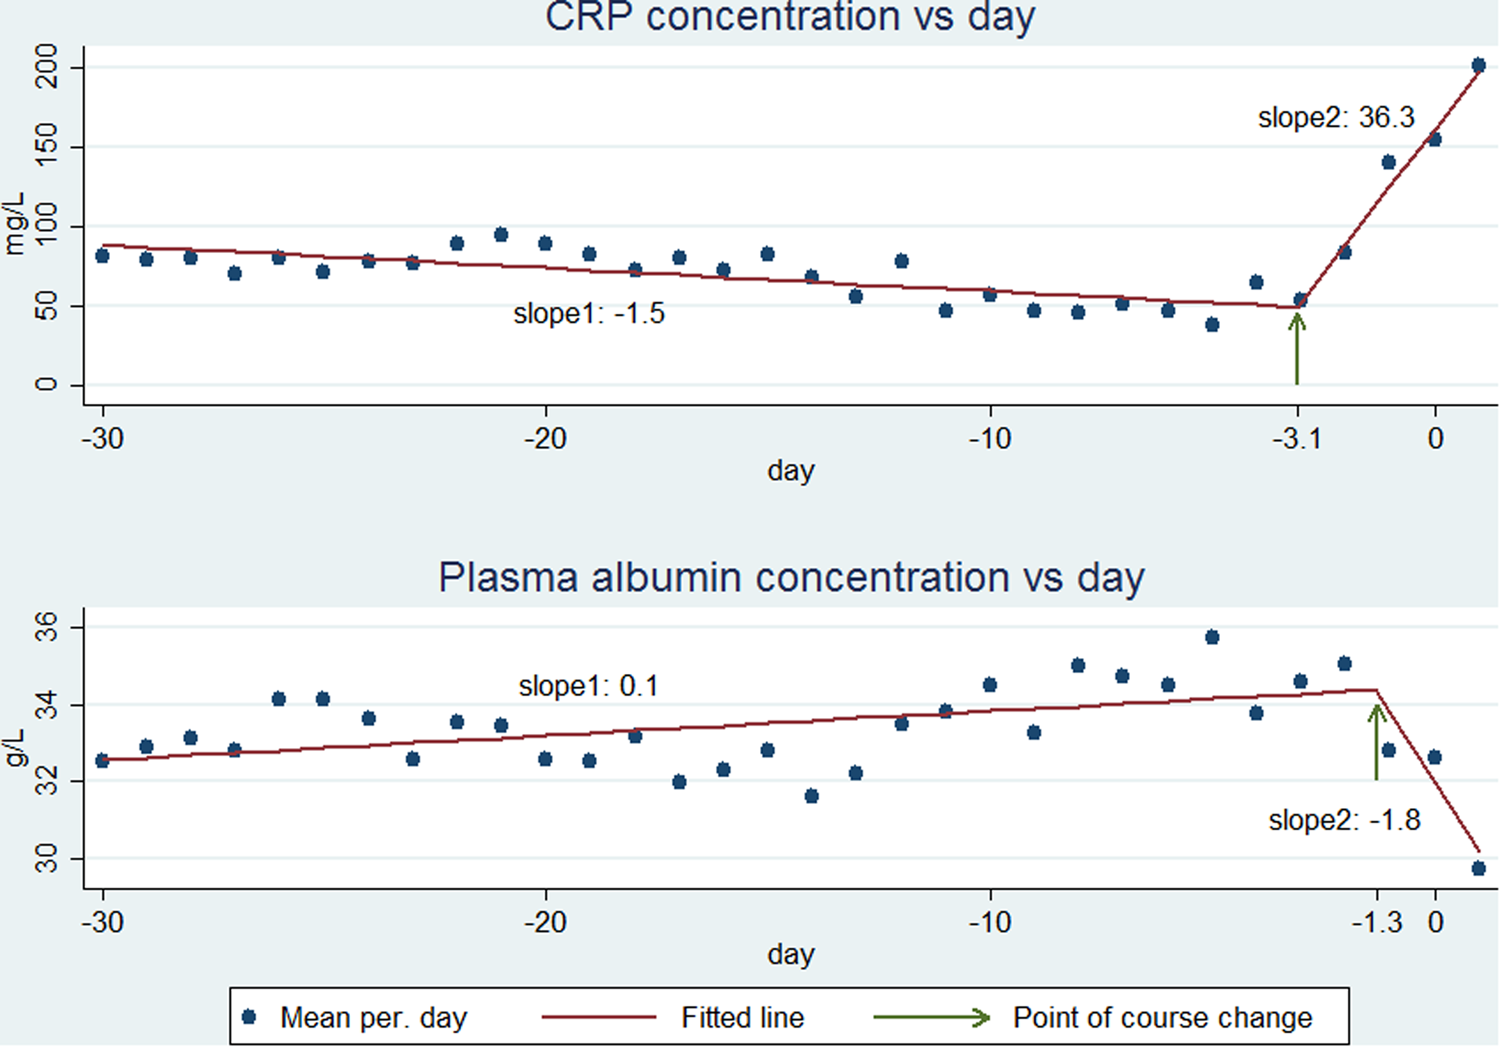
CRP began to increase some days before D0 (Fig. 2, upper panel). The BSR analysis showed that CRP began to increase at day −3.1 (95% CI−3.6 to −2.6) (Fig. 2, upper panel, arrow). The day of CRP change did not differ significantly between monomicrobial Gram-positive (day −2.8, 95% CI −3.7 to −1.9), monomicrobial Gram-negative (day −3.1, 95% CI −3.8 to −2.4) or polymicrobial CA-BSI (day −3.4, 95% CI −4.6 to −2.2) (data not shown). From D–30 to D–4, the CRP kinetics, expressed as a slope (rate of concentration change per day), was −1.5 mg/l/day (95% CI −2.0 to −0.9), whereas the slope was 36.3 mg/l/day (95% CI 31.3–41.4) from D–3 to D1 (Fig. 2, upper panel, slope 1 and slope 2, respectively). In the two time periods, the slopes for monomicrobial Gram-positive, monomicrobial Gram-negative or polymicrobial CA-BSIs were not significantly different (−1.3 (95% CI −2.3 to −0.2), −1.3 (95% CI −2.0 to −0.5) and −2.7 (95% CI −4.2 to −1.2) mg/l/day; 39.7(95% CI 28.6–50.7), 34.0 (95% CI 27.2–40.9) and 40.5 (95% CI 27.3–53.6) mg/l/day).
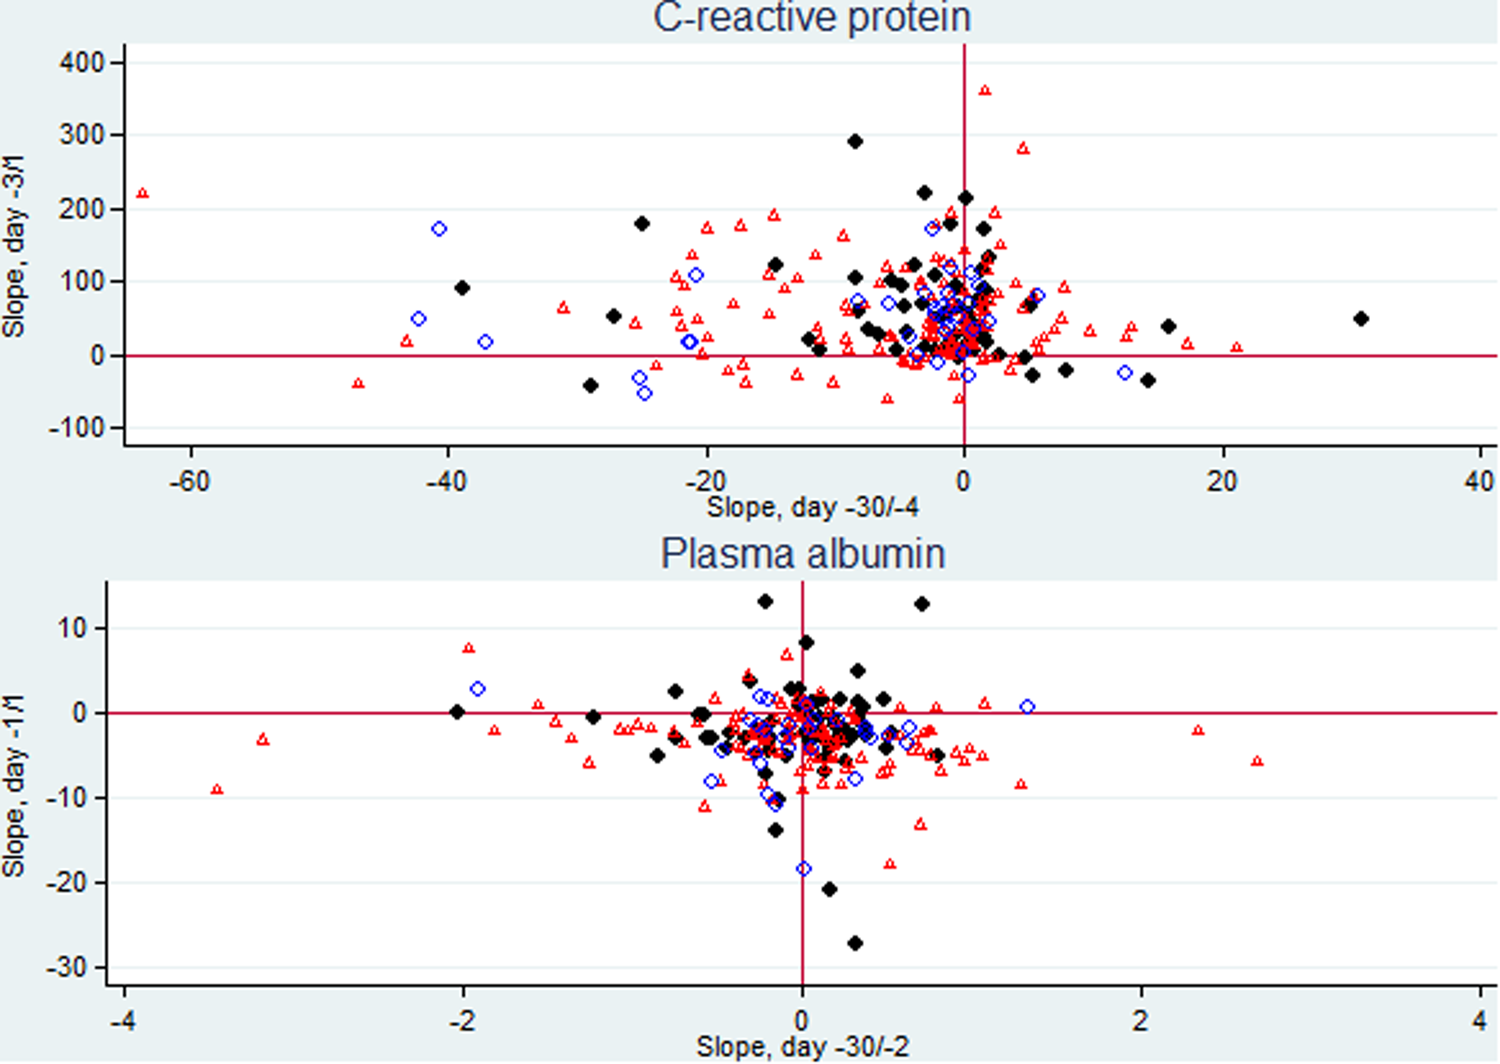
Focusing on the 226 patients having ⩾2 CRP specimens in both periods (data not shown) we assessed their individual CRP kinetics (slopes), from D–30 to D–4 and from D–3 to D1. Most of the patients presented almost no variation or a slight negative slope in the first period followed by a marked increase in the days just before CA-BSI diagnosis in 84.5% of the patients (Fig. 3, upper panel).
Scatter plots of CRP individual slopes from day −30 (D–30) through day −4 and from day −3 through the day after CA BSI (D1) (226 patients) and PA individual slopes from D–30 through day −2 and from day −1 through D1 (210 patients). Patients with monomicrobial Gram-positive CA-BSI are presented as dots, with monomicrobial Gram-negative CA-BSI as triangles, and with polymicrobial CA-BSI as circles.
PA kinetics before CA-BSI diagnosis
Among the 584 patients, the daily number of measurements was fairly constant until D–3 (range 50–89), increasing to 96 on D–2, 176 on D–1, 542 on D0, with a decline to 390 on D1 (Fig. 1).
The PA values were low (<35 g/l, lower limit of the reference range) in most of the 30 days before CA-BSI (Fig. 2, lower panel).
PA began to decrease before D0 (Fig. 2, lower part). The BSR analysis showed that PA began to decrease at day −1.3 (95% CI −2.4 to −0.8) (Fig. 2, lower panel, arrow). For monomicrobial Gram-positive CA-BSIs, the day of change was −0.3 (95% CI−0.8 to 0.2) which was not significantly different from D0. The day of change for monomicrobial Gram-negative −1.1 (95% CI −1.7 to −0.6) and polymicrobial −6.4 (95% CI −11.3 to −1.48) CA-BSIs differed significantly from D0. The days of change for monomicrobial Gram-positive and monomicrobial Gram-negative CA-BSIs were not significantly different, whereas numbers for polymicrobial CA-BSIs were too low for robust computations.
From D–30 to D–2 PA kinetics, expressed as a slope, were 0.1 (95% CI 0.03–0.10) g/l/day whereas from D–1 to D1 the slope changed to −1.8 (95% CI −2.4 to −1.3) g/l/day (Fig. 2, lower panel, slope 1 and slope 2, respectively). In the first time period, the slopes of monomicrobial Gram-positive (−0.003 g/l/day, 95% CI −0.05 to 0.05) and polymicrobial CA-BSIs (0.11 g/l/day, 95% CI −0.01 to 0.22) were not significantly different from zero. The slope of the monomicrobial Gram-negative CA-BSI was 0.09 g/l/day (95% CI 0.05–0.14). In the second time period, the slopes of monomicrobial Gram-positive −2.9 g/l/day (95% CI −4.3 to −1.5) and monomicrobial Gram-negative −2.3 g/l/day (95% CI −3.0 to −1.6) were not significantly different. The slope of the polymicrobial CA-BSI was −0.6 g/l/day (95% CI −1.1 to −0.1).
Focusing on the 210 patients having ⩾2 PA specimens in both periods (data not shown) we assessed the individual PA kinetics (slopes), from D–30 to D–2 and from D–1 to D1. We found that most of the patients presented almost no variation or a minor positive slope during the first period followed by a negative slope in the days before CA-BSI diagnosis in 78.6% of the patients (Fig. 3, lower panel).
Discussion
We found that CRP and PA concentrations began to change inversely some days before diagnosing CA-BSI, CRP increasing by day −3.1 and PA decreasing by day −1.3. The assessment of CRP kinetics clearly showed that before D–3, CRP presented a slight negative slope followed by a sharp and marked increase in the days before CA-BSI diagnosis. PA presented an inverse course in comparison with CRP with a very slight positive slope before D–1 followed by a decrease.
As already pointed out by our group [Reference Gradel8], CRP and PA levels were not within the normal range before the CA-BSI. The elevated CRP concentration, >60 mg/l, is much higher than the <10 mg/l found in healthy Danes [Reference Zacho13, Reference von Stemann14]. The same was true for PA, showing a slight hypoalbuminemia during the study period. High CRP and low PA in patients in whom the physician found an indication to perform blood tests could be a surrogate marker of an underlying condition associated with some levels of chronic inflammation before the development of CA-BSI.
The mechanisms of the host response to infection have been well studied in animal models but such data are difficult to extrapolate to clinical reality. In daily life, patients frequently go to their general practitioner or an emergency department with unspecific clinical complaints which have often lasted for days. These unspecific conditions may later develop into a full-blown clinical picture caused by a well-established infection. As a result, these patients do not present to the emergency departments within a couple of hours of disease course, as is the case of e.g. acute myocardial infarction [Reference Timoteo and Mimoso15].
It is generally difficult to define the beginning of infectious diseases. The DORIS database enabled us to explore the kinetics of CRP and PA before the clinical diagnosis of CA-BSI. Our study clearly showed that in these CA-BSI patients, with blood tests performed in the preceding 30 days, CRP began to increase 3.1 days before the diagnosis and PA began to decline 1.3 days before the diagnosis. Before these two time-points, both biomarkers remained fairly unchanged, which was reflected by the very low slopes. But afterwards, maybe reflecting the initiation of the infectious process and the associated host response, we noticed marked changes in kinetics with a sharp increase in the CRP slope and a decrease in the PA slope. This indicates that the infection is a dynamic process that begins to elicit an inflammatory response before the clinical diagnosis. One could consider that these unspecific clinical manifestations were not severe enough to make the patient seek medical consultation, or, if they did, the symptoms were not severe enough to indicate taking blood cultures or hospital admission. But the initial host response to the infection was already signalled by inverse changes in the CRP and PA slopes.
We could speculate that in patients having a high risk of infectious complications, CRP and PA kinetics, in addition to symptoms/signs (such as fever or tachycardia) suggestive of an infection, could prompt the physician to order further tests (e.g. blood cultures) and possibly prescribe pre-emptive antibiotic therapy [Reference Eggimann, Bille and Marchetti16]. Our results also point to the usefulness of the combined use of CRP and PA.
Our study has several strengths. To our knowledge, apart from two studies in the same cohort [Reference Gradel8, Reference Gradel10], no study has assessed longitudinal measurements of CRP and PA before a CA infection. Secondly, it comprises a large cohort of CA-BSI episodes, which increases the robustness and consistency of our findings. Thirdly, BSIs are infections defined according to well-defined and globally accepted criteria [Reference Trick17]. Finally, our cohort derives from a population-based database.
Our study also has several limitations. Firstly, it is retrospective although the data per se were prospectively collected from registries and medical records. Secondly, the number of specimen dates per patient before D0 varied (from 1 to 26) and the measurement of CRP/PA depended on the physician's assessment and the patient's clinical complaints. However, our study's main focus was patterns related to longitudinal data. A recent study comprising 2418 of the initial larger cohort of 2785 patients [Reference Gradel6] showed that these patterns were materially the same regardless of the numbers of specimens [Reference Gradel10], which facilitates the extrapolation of results between patient groups having different numbers of specimens in the different time periods around CA-BSI. Thirdly, we had not enough clinical data to interpret whether the abnormal CRP and PA levels before the day of slope change could reflect an underlying disease causing some degree of chronic inflammation. We speculate that CA-BSI patients with no blood tests before D0 would be healthier, and consequently would have lower CRP and higher PA. Our group has also found that this latter group had 50% lower 30-day mortality [Reference Gradel10]. Fourthly, the D0 was influenced by two variables that cannot be controlled in studies on CA-BSI, one is the patient's own decision to attend an emergency department and the other is the physician's own decision to collect blood cultures. Fifthly, we had no data on nutrition. However, for the larger CA-BSI cohort we found a high negative correlation (R = −0.47, P < 0.0001) between 61 583 paired CRP and PA specimens, clearly indicating hypoalbuminemia as a marker of an underlying chronic inflammation [Reference Gradel8]. This is also in accordance with several reviews [Reference Gatta, Verardo and Bolognesi18, Reference Fuhrman19]. Sixthly, our definition of CA differed from the more generally accepted definition of healthcare-associated infection [Reference Friedman20] as many of our patients had a hospital contact in the 30 days before their CA-BSI episode [Reference Gradel21]. However, this probably has little impact on biomarker kinetics before CA-BSI [Reference Gradel10].
In conclusion, biomarker levels began to change some days before the CA-BSI diagnosis. For these patients, a sudden increase in the CRP followed shortly thereafter by a PA decrease could signal a high risk of CA-BSI.
Financial support
This research received no specific grant from any funding agency, commercial or not-for-profit sectors.
Conflict of interest
None.
Author contribution
OSG, PP and KOG conceived the study and design, and participated in data analysis and drafted the manuscript. BM, PJV, CD, TGJ, HJK and ATL supervised the data analysis, drafted the manuscript and takes responsibility for archiving the data. All authors read and approved the final manuscript.


 Open access