

Comparative politics scholars have long been interested in the question of whether targeted government programs increase electoral support for the incumbent. Since the 1990s, governments in more than 50 countries have enacted social assistance programs designed to lift low-income households out of poverty and kickstart economic development (Araújo, Reference Araújo2021; Kogan, Reference Kogan2021). The defining feature of these programs is that they are ‘programmatic’, meaning they are subject to rules that are formalized, transparent (in the sense of being made public), and not manipulable by incumbents (Stokes et al., Reference Stokes, Dunning, Nazareno and Brusco2013). For scholars, the enactment of these policies has offered an opportunity to examine what is now known as the ‘programmatic incumbent support hypothesis’ (PISH) (Diaz-Cayeros et al., Reference Diaz-Cayeros, Estevez, Magaloni, Dominguez, Lawson and Moreno2009; De La O, Reference De La and Ana2013; Zucco, Reference Zucco2013; Layton and Smith, Reference Layton and Smith2015; Imai et al., Reference Imai, King and Rivera2019). The PISH posits that the enactment of a programmatic policy increases electoral support for the incumbent among policy beneficiaries. Why? Beneficiaries may be engaging in ‘ordinary pocketbook voting’ (rewarding incumbents for improving their livelihoods), inferring pro-redistribution policy preferences or competence on the part of the incumbent, or wanting to help an incumbent who helped them. What is notable about this work, however, is its lack of consensus: in some cases, researchers found support for the PISH (Manacorda et al., Reference Manacorda, Miguel and Vigorito2011; Pop-Eleches and Pop-Eleches, Reference Pop-Eleches and Pop-Eleches2012), but in others, they found no support (and occasionally, evidence of the opposite) (Blattman et al., Reference Blattman, Emeriau and Fiala2018; De Kadt and Lieberman, Reference De Kadt and Lieberman2020).
We make the case that studies of the PISH have failed to consider a mediating variable that we think influences how programmatic policies impact electoral support for the incumbent. The typical study proceeds by choosing a programmatic policy and leveraging features of its implementation to examine whether policy beneficiaries return more votes for the incumbent than policy non-beneficiaries. But incumbent politicians are not passive bystanders in elections. They actively try to persuade voters to vote for them, and one tool they harness to this end is the strategic distribution of non-programmatic (or discretionary) goods. In developed countries, non-programmatic goods typically consist of pork-barrel spending, while in developing settings, pork is combined with clientelistic goods targeted at the individual. We explain why an incumbent facing re-election in a district in which some voters receive a programmatic policy and others do not might have reason to change the way she allocates the non-programmatic goods at her disposal. Depending on how she thinks the programmatic policy will influence voting behavior, she may distribute more (or less) non-programmatic goods to beneficiaries than to non-beneficiaries. If so, then it is no longer appropriate to attribute any observed differences in voting behavior across the two groups to the effects of the policy alone; rather, these differences likely reflect the compound effect of the policy and the extra non-programmatic goods.
To examine this conjecture, we turn to the case of Japan. We select a single programmatic policy (a snow subsidy) and leverage features of its implementation that make it plausibly exogenous. We examine the policy's impact on two outcomes: electoral support for the incumbent and the distribution of non-programmatic goods. Like other studies, we find that the voting behavior of beneficiaries and non-beneficiaries is statistically indistinguishable, suggesting that the policy does not increase support for the incumbent. However, in line with our conjecture, we find that there is a systematic difference in how the incumbent allocates non-programmatic goods: the policy resulted in more non-programmatic goods being delivered to the beneficiaries of the programmatic policy relative to otherwise-similar non-beneficiaries.
For comparative politics scholars, the fact that beneficiaries and non-beneficiaries of a programmatic policy differ on two dimensions, the characteristics qualifying them for the policy and the amount of non-programmatic goods they receive, suggests that programmatic policies might be causing incumbents to alter other aspects of their behavior, which also have consequences for election outcomes. If so, then any study that does not take this possibility into account may be inaccurately estimating the effects of its programmatic policy of interest by only focusing on its total effects. We specify the conditions under which incumbents will be most able to offset any anticipated impacts of a programmatic policy on voting behavior by adjusting the allocation of non-programmatic goods. This helps us see which settings are most vulnerable to this omission. We urge researchers in those settings to put the collection of data on non-programmatic goods front and center in their research designs. With regard to the question of why beneficiaries of a programmatic policy receive more non-programmatic goods than non-beneficiaries, we offer several mechanisms that could bring about this equilibrium. We suggest future work subject these mechanisms to rigorous scrutiny.
1. The electoral impact of programmatic policies
One of the main tasks of government is crafting and implementing policies that redistribute benefits to different segments of the population. Stokes et al. (Reference Stokes, Dunning, Nazareno and Brusco2013: 7) provides a typology that distinguishes government policies on the basis of their modes of distribution. One is a programmatic policy. This is a policy whose distribution is subject to formalized, transparent, and non-manipulable rules, which define who is eligible to receive the policy and why. In most industrialized democracies, the programmatic policy is the mainstay of parties' election campaigns. Parties fight elections by crafting programmatic policies aimed at broad swaths of voters, such as the unemployed, white-collar workers, parents, or the elderly, and promise that if elected, they will enact those policies. Critically, what underpins an electoral strategy based on programmatic policies is the hope that these policies prove attractive enough to entice their would-be beneficiaries to turn out and vote for the party in the next election (Kitschelt and Wilkinson, Reference Kitschelt and Wilkinson2007).
Current scholarly interest in the impact of programmatic policies on voting behavior stems from their adoption in developing countries. One of the earliest examples of such policies is Mexico's large-scale social assistance program, Progresa, which was introduced by President Ernesto Zedillo in 1997. The program established a cash transfer that low-income households could receive on the condition that they complied with requirements such as sending their children to school and health clinics for regular checkups (Diaz-Cayeros et al., Reference Diaz-Cayeros, Estevez, Magaloni, Dominguez, Lawson and Moreno2009: 231). The use of objective criteria to determine eligibility for these policies represented a significant departure from previous social assistance programs provided in Mexico. Early studies documented huge effects of Progresa on child health and nutrition, caloric intake, and living standards (De La O, Reference De La and Ana2015).
Galvanized by these results, governments of other middle- and low-income countries adopted similar programs, often with financial assistance from organizations such as the World Bank, Inter-American Development Bank, and Asian Development Bank. Like Progresa, the majority of these programs were conditional cash transfers (CCTs): payments that low-income households could receive on the condition they met objective, non-manipulable, and publicly available criteria (Manacorda et al., Reference Manacorda, Miguel and Vigorito2011; Labonne, Reference Labonne2013; Linos, Reference Linos2013; Zucco, Reference Zucco2013; Tobias et al., Reference Tobias, Sumarto and Moody2014; Layton and Smith, Reference Layton and Smith2015; Conover et al., Reference Conover, Zarate, Camacho and Baez2018; Araújo, Reference Araújo2021). By 2014, more than 50 countries had CCTs (World Bank, 2014). Other (non-CCT) programmatic policies adopted in this period include grants to start small businesses in Uganda (Blattman et al., Reference Blattman, Emeriau and Fiala2018), vouchers for the purchase of a computer in Romania (Pop-Eleches and Pop-Eleches, Reference Pop-Eleches and Pop-Eleches2012), and universal health care in Mexico (Imai et al., Reference Imai, King and Rivera2019).
The use of objective and non-manipulable criteria to determine eligibility for these policies, as well as features of their implementation, provided political scientists with unusually good opportunities to study their effect on a host of election outcomes. Researchers studied whether policy beneficiaries rewarded the parties that had enacted the policy or the parties in government at the time of an election, whether any such electoral rewards trickled down to elections at lower levels of government, how fast any such rewards decayed over time, and how the policy's enactment influenced the voting behavior of non-beneficiaries, among other questions (Bechtel and Hainmueller, Reference Bechtel and Hainmueller2011; Labonne, Reference Labonne2013; Linos, Reference Linos2013; Zucco, Reference Zucco2013; Tobias et al., Reference Tobias, Sumarto and Moody2014; Correa and Cheibub, Reference Correa and Cheibub2016; Conover et al., Reference Conover, Zarate, Camacho and Baez2018; Kogan, Reference Kogan2021).
1.1 The puzzle: contradictory findings
To date, there have been more than 50 studies of what has been dubbed the ‘programmatic incumbent support hypothesis’ (PISH), which predicts that programmatic policies that improve voter livelihood lead to more positive evaluations of the government among beneficiaries, which translate into more votes in elections (Araújo, Reference Araújo2021; Kogan, Reference Kogan2021).Footnote 1 Almost all studies analyze a single programmatic policy and leverage features of its implementation to estimate its impact on voting behavior, especially electoral support for incumbent politicians and/or parties. Because every programmatic policy is different, and every country is different, any expectations of similar conclusions are perhaps misguided. That said, the lack of consensus about the effects of these policies is striking.
On one side are studies that find support for the PISH. For example, Manacorda et al. (Reference Manacorda, Miguel and Vigorito2011) studied the effects of a large-scale anti-poverty program in Uruguay, in which benefits were allocated to households whose scores fell below a given threshold. Surveying households in the vicinity of the threshold, the researchers found a discontinuous increase at the cutoff in reported feelings of satisfaction with the government. Similarly, Pop-Eleches and Pop-Eleches (Reference Pop-Eleches and Pop-Eleches2012) studied a program in Romania that awarded a computer voucher to families with school-age children whose household income lay below a certain cutoff. Leveraging the fact that the list of winning and losing households was made public, along with information about their incomes, the authors selected a random sample of near-winners and near-losers and surveyed their willingness to turn out and vote for the incumbent.Footnote 2 The authors found a discontinuous increase at the cutoff in these outcomes. Other studies providing empirical support for the PISH focused on Brazil's CCT, Bolsa Familia (Zucco, Reference Zucco2013), the Food Stamp Program in the United States (Kogan, Reference Kogan2021), and survey data on ‘monthly assistance’ in Latin America (Layton and Smith, Reference Layton and Smith2015).
On the other side are studies that find no support for the PISH. Imai et al. (Reference Imai, King and Rivera2019) studied Seguro Popular de Salud (SPS), a program established by the Mexican government that extended health care to approximately 50 million Mexican citizens. Researchers worked with the government to divide the country into thousands of geographically defined ‘health clusters,’ and randomly assigned a program to construct new hospitals and health clinics to some clusters. Analyzing the 2006 Mexican presidential election, the researchers found that assignment to SPS did not result in higher vote shares for the incumbent.Footnote 3 Blattman et al. (Reference Blattman, Emeriau and Fiala2018) studied a World Bank-funded program in Uganda, the Youth Opportunities Program, which used a lottery to award cash grants for independent trades to groups of poor and unemployed young adults. Four years after the program's implementation, the researchers surveyed winners and losers and found effects in the opposite direction: winners were more likely to support the opposition.
1.2 The (possible) interference of non-programmatic goods
In this section, we point to a variable whose potential effects have not been adequately theorized, but which research in other areas of comparative politics lead us to believe might influence the relationship between programmatic policies and votes for the incumbent. This is the non-programmatic goods incumbents have access to by virtue of being in control of government resources. We explain what these goods are and why we think their distribution may be confounding attempts to estimate the impact of programmatic policies. We make the case that careful theorizing as to the effects of these goods (or rather, incumbents' access to these goods), and the collection of data to measure their distribution, could go a long way toward making sense of the inconsistent results discussed above.
Non-programmatic goods are government policies whose distribution is not subject to formalized, transparent, and non-manipulable rules that determine eligibility. Stokes et al. (Reference Stokes, Dunning, Nazareno and Brusco2013) distinguishes two categories of these.Footnote 4 One is grants, subsidies, and other transfers that governments channel toward groups of voters, geographically defined or otherwise. Because incumbents retain discretion over the allocation of these goods, they are often distributed under an explicitly partisan logic, in some cases to a party's core supporters, and in other cases, to its swing voters. These goods, which can be delivered before or after elections, are called ‘partisan bias,’ or simply, ‘pork-barrel politics’ (Golden and Min, Reference Golden and Min2013). The second category of non-programmatic good is the clientelistic good. Clientelistic goods are distributed to individuals on the condition that the individual vote for the incumbent and withdrawn as soon as it becomes obvious the person did not or will not (Kitschelt and Wilkinson, Reference Kitschelt and Wilkinson2007; Stokes, Reference Stokes and Schaffer2007; Hicken, Reference Hicken2011; Weitz-Shapiro, Reference Weitz-Shapiro2014). Unlike pork-barrel projects, the distribution of a clientelistic good is contingent upon how someone votes.Footnote 5 Its purpose is to ‘buy’ a vote.
How might non-programmatic goods interfere with tests of the PISH? The large literature on pork-barreling, together with a similarly large literature on clientelism, provides ample evidence that in many democracies, both developed and developing, incumbents make use of non-programmatic goods to influence the number of votes they receive in the next election. Consider an incumbent member of the ruling party who is facing an upcoming election. Let us imagine that since the last election, a group of her voters has become eligible for a programmatic policy enacted by her party. Those voters are now receiving benefits under the policy. Because the policy is programmatic, beneficiaries know that they will continue to receive those benefits irrespective of who they vote for.Footnote 6 In this situation, we posit that the incumbent is likely to engage in a set of calculations as to how the programmatic policy is likely to influence voting behavior. On the basis of those calculations, we think it likely that the incumbent will adjust her use of non-programmatic goods.
More specifically, if the incumbent thinks the policy will increase the number of votes she receives from policy beneficiaries (Manacorda et al., Reference Manacorda, Miguel and Vigorito2011; Pop-Eleches and Pop-Eleches, Reference Pop-Eleches and Pop-Eleches2012), she may reduce the amount of non-programmatic goods directed at beneficiaries (those goods are no longer needed), while not changing the amount directed at non-beneficiaries. Alternatively, she may reduce the amount distributed to beneficiaries and increase the amount distributed to non-beneficiaries (to make sure their electoral support for her does not decline, given that they missed out on the programmatic policy).
By contrast, the incumbent might calculate that the programmatic policy will decrease the number of votes she receives from beneficiaries. In a political system where non-programmatic goods feature prominently, voters may be accustomed to having to sing for their supper; meaning use their votes for the incumbent to obtain material benefits. Under these circumstances, a programmatic policy might have the effect of untethering policy beneficiaries from the incumbent, enabling them to vote according to their policy, partisan, or valence preferences. Blattman et al. (Reference Blattman, Emeriau and Fiala2018) venture that this logic can explain why recipients of the programmatic policy they studied ended up being less likely to support the incumbent.
Relatedly, De Kadt and Lieberman (Reference De Kadt and Lieberman2020) studied the effects of improvements in basic services such as water, sewerage, and refuse collection on support for the incumbent African National Congress (ANC) in South Africa. Saito (Reference Saito2010) studied the effects of receiving large-scale infrastructure such as airports and bullet trains on votes for the incumbent Liberal Democratic Party (LDP) in Japan. Like Blattman et al. (Reference Blattman, Emeriau and Fiala2018), both studies documented declines in support for the incumbent after receiving these goods. Although neither basic services nor infrastructure fit the definition of a programmatic policy, both these studies are relevant because they attributed the declines in support they observed to a similar logic. To the extent an incumbent anticipates that her support is likely to decline among beneficiaries, she may decide to increase the volume of non-programmatic goods directed at these voters, to keep them interested in voting for her.
Although which scenario is more plausible will likely depend on context-specific factors, what all of these scenarios have in common is that the presence of a programmatic policy results in changes to the distribution of non-programmatic goods. Whereas the amount of non-programmatic goods received by beneficiaries and non-beneficiaries may not have been systematically different prior to the enactment of the policy, its enactment could kick off a reallocation of the types of resources politicians have discretion over, such that one group ends up with systematically more than the other. If so, it would mean that policy beneficiaries and non-beneficiaries differ on a second dimension, the amount of non-programmatic goods they receive. If this is the case, then it is no longer safe to assume that any observed differences in these two groups' voting behavior are caused by the policy alone. Rather, researchers should operate under the assumption that they are caused by the compound effect of both the programmatic policy and the non-programmatic goods.
To our knowledge, only one study of the PISH has entertained the possibility that incumbents respond to the advent of a programmatic policy by adjusting the distribution of non-programmatic goods (Labonne, Reference Labonne2013). This study focused on the effect of a government-enacted CCT on incumbent vote shares in the 2010 municipal elections in the Philippines. Leveraging variation across villages in whether households were eligible to receive the CCT, the author found no statistically discernible difference in incumbent vote share between eligible and ineligible villages in the same municipality. He did find a statistically discernible difference in the expected direction (eligible villages returned higher vote shares than ineligible villages) only after limiting the analysis to municipalities that received small amounts of other government transfers. On this basis, he reasoned that when municipalities receive other sources of government money, mayors can redistribute those transfers to the ineligible villages. This, in turn, has the effect of bringing up their vote shares to a level indistinguishable to that of eligible villages. Because the government transfers he examined, the Internal Revenue Allocation, are distributed to municipalities (not to villages within municipalities), he was unable to subject this intriguing conjecture to further analysis. Thus, we do not have conclusive evidence that these extra government transfers were, in fact, being sent to ineligible villages (as he posits), or to eligible villages, or under an entirely different logic.
As far as we can tell, no subsequent study has subjected the core idea here – that incumbents use non-programmatic goods to offset an anticipated effect of the programmatic policy – to further theorizing or analysis. We do not think the lack of attention to this possibility is warranted. In industrialized democracies, the literature furnishes plenty of examples of incumbents adjusting year-to-year allocations of pork-barrel spending with a view to enhancing their re-election prospects (Stein and Bickers, Reference Stein and Bickers1994; Dixit and Londregan, Reference Dixit and Londregan1996; Dahlberg and Johansson, Reference Dahlberg and Johansson2002; Golden and Picci, Reference Golden and Picci2008; Tavitz, Reference Tavitz2009; Catalinac et al., Reference Catalinac, Bueno de Mesquita and Smith2019; Spáč, Reference Spáč2021). To the extent that beneficiaries of a programmatic policy are concentrated in particular geographic regions, it is plausible that incumbents could increase or decrease the amount of pork-barreling in those regions. In developing democracies, too, clientelism scholars document a vast array of material goods that flow from incumbent to voters at the time of elections, which can range from ‘cash to cookware to corrugated metal’ (Hicken, Reference Hicken2011: 291). This is in addition to any pork-barreling that occurs (Harris and Posner, Reference Harris and Posner2018). The networks of brokers used to detect whose votes can be bought and for how much would presumably also be able to detect changes in the wake of a programmatic policy and relay that information upward (e.g., Brierley and Nathan, Reference Brierley and Nathan2021).
The lack of attention to incumbent politicians' responses to a programmatic policy is curious in light of the fact that some scholars have advanced the possibility that programmatic policies could hasten the demise of clientelism (Blattman et al., Reference Blattman, Emeriau and Fiala2018; Frey, Reference Frey2019; Larreguy et al., Reference Larreguy, Marshall and TruccoN.D.). The causal chain imagined by these scholars goes something like this: because people who receive a programmatic policy know that they will receive the policy regardless of who they vote for, evidence that they vote for the incumbent in larger numbers is evidence they are considering non-clientelistic factors when casting their votes. This means that the programmatic policy has broken the clientelistic exchange by giving beneficiaries the room to evaluate the incumbent on an alternative, non-clientelistic dimension. If programmatic policies have the potential to transform voter calculus in this manner, then one policy implication would be to enact more programmatic policies in clientelistic settings. Our discussion above suggests that such a conclusion might be warranted, but only after scholars have verified that policy beneficiaries are not receiving systematically larger allocations of non-programmatic goods. If they are, then their increased tendency to vote for the incumbent likely reflects the compound effect of both the programmatic policy and the extra non-programmatic goods. This would leave the policy's impact on clientelism, and the corresponding policy fix, much less clear.
In what follows, we subject this conjecture, that programmatic policies bring about a change in the allocation of non-programmatic goods, to rigorous empirical analysis. Like other studies, we choose a single programmatic policy (a snow subsidy) enacted in a single country (Japan) and leverage features of its implementation to identify its effects.
2. Case of Japan
To examine whether voters who receive a programmatic policy receive systematically more or less non-programmatic goods than voters who do not, we turn to Japan. Japan is an excellent case for us for at least two reasons. One, the Japanese government enacts policies that qualify as programmatic, meaning their distribution is subject to a set of formalized, publicly available, and non-manipulable rules. Two, the Japanese government has been controlled by a single party for 63 of the past 67 years and a central component of this party's electoral strategy has been the judicious distribution of non-programmatic goods. The non-programmatic goods scholars know the most about are of the partisan bias/pork-barrel type, meaning they consist of discretionary spending on local communities. Our empirical strategy, described below, relies on the fact that both the programmatic policy we study and the non-programmatic goods are bestowed on the same geographic unit (the municipality). This creates a setting in which we can compare the amounts of non-programmatic goods received by municipalities that are eligible for the programmatic policy and otherwise-similar, ineligible municipalities.
First, we describe our programmatic policy of interest. In 1962, the Special Measures Act Concerning Countermeasures for Heavy Snowfall Areas (Gosetsu Chitai Taisaku Tokubetsu Sochi Ho in Japanese, henceforth called the ‘Snow Act’) was enacted. Originating as a private member bill bearing the signatories of 101 Members of the House of Representatives (HoR), the Snow Act was one of a number of laws passed in the early 1960s that established government support for areas of Japan that were considered disadvantaged. Historically, heavy snowfall had presented a major obstacle to industrial development and the improvement of living standards in Japan's snowiest regions. It hindered economic activity, paralyzed traffic, isolated communities, and facilitated depopulation. The Snow Act aimed to minimize this damage.
To this end, it established four main benefits for municipalities designated as ‘heavy snowfall municipalities.’Footnote 7 First, these municipalities would qualify for extra central government money to cover the costs of maintaining roads, buildings and heating systems and providing education, medical infrastructure, and public livelihood assistance. This extra money would be paid through a formula-decided government transfer called the Local Allocation Tax (LAT). Second, when constructing roads or school buildings in revenue-sharing arrangements with an upper-tier government, a larger share of the cost would be shouldered by the latter. Third, these municipalities were permitted to issue special local bonds to finance measures to deal with snow, such as widening roads, investing in snow removal equipment such as snowplows or snow-melters, and implementing disaster-prevention measures. Fourth, their residents were granted special tax benefits, including reduced car, income, and property taxes, as well as home renovation assistance.Footnote 8
The Snow Act and related ordinances stipulated that a municipality could be designated a ‘heavy-snowfall municipality’ if more than two-thirds of its geographic area qualifies as a ‘heavy-snowfall area,’ in which the height of accumulated snow over the preceding 30-year period exceeded 5,000 cm (164 feet) per year.Footnote 9 The ‘height of accumulated snow’ is given by calculating the average height of accumulated snow on a given day of the year, adding this to the average height of accumulated snow on the next day, and so on, for all the days in which the municipality had accumulated snowfall. Intuitively, if 50 cm of snow fell on the first day of winter and remained piled up for the next 100 days without any new snow falling, this municipality would have experienced 5,000 cm of accumulated snow that year. Figure 1 presents a map of Japan. The shaded area consists of municipalities qualifying as ‘heavy-snowfall,’ which tend to be concentrated in the northwest. As of 1980, when our study begins, approximately 30% of Japanese municipalities had received this designation. Together, these municipalities make up approximately 50% of land in Japan.
The shaded areas depict areas that, as of 2016, had been designated ‘heavy-snowfall’ areas under the rules of the 1962 Snow Act.

The snow subsidy qualifies as programmatic. The rules governing eligibility are formalized and publicly available on the government's website, along with a list of municipalities that have qualified.Footnote 10 For reasons we explain below, we focus on the 1980–2005 period. During this period, the only time the list of designated municipalities changed was when a municipality ceased to exist due to a merger with a neighboring municipality. In these cases, the municipality disappeared from the list of designated municipalities (because it no longer existed). In the vast majority of cases, its designation was transferred to the new (merged) municipality.Footnote 11 Almost every merger took place between 2001 and 2005, when the number of municipalities was reduced from approximately 3,300 to approximately 1,800 (Horiuchi et al., Reference Horiuchi, Saito and Yamada2015). The fact that there were no changes to the list of designated municipalities between 1980 and 2000, and the changes that occurred subsequently were due to municipal mergers provides indirect evidence that incumbent members of the ruling party were not manipulating eligibility.Footnote 12
Next, we describe the non-programmatic goods. The LDP has been in control of government since 1955, with the exception of 10 months between 1993 and 1994 and 3 years between 2009 and 2012. A voluminous literature documents the single-minded focus of LDP politicians on securing pork-barrel projects for their districts (Curtis, Reference Curtis1971; Ramseyer and Rosenbluth, Reference Ramseyer and Rosenbluth1993; Horiuchi and Saito, Reference Horiuchi and Saito2003; Hirano, Reference Hirano2006; Scheiner, Reference Scheiner2006; Krauss and Pekkanen, Reference Krauss and Pekkanen2010; Naoi, Reference Naoi2015; Christensen and Selway, Reference Christensen and Selway2017; McMichael, Reference McMichael2018; Catalinac et al., Reference Catalinac, Bueno de Mesquita and Smith2019). One driver of this was the electoral system used to select Members of the HoR. The system was single-non-transferable-vote in multi-member districts. Under this system, majority-seeking parties had to run more than one candidate in most districts, which meant that individual LDP politicians were pitted against each other (Ramseyer and Rosenbluth, Reference Ramseyer and Rosenbluth1993). Numerous studies explain why intraparty competition tends to increase pork-barreling (Carey and Shugart, Reference Carey and Shugart1995; Golden and Picci, Reference Golden and Picci2008; Martin, Reference Martin2011). In 1994, the system was changed to mixed-member majoritarian, which eliminated intraparty competition. LDP politicians ratcheted down their emphasis on pork-barreling in favor of programmatic goods (Catalinac, Reference Catalinac2016). However, the party also began distributing pork under a different logic (funneling it toward supporters who complied with a vote-trading strategy designed to help the party win more seats) (Catalinac and Motolinia, Reference Catalinac and Motolinia2021).
A second driver of pork-barreling in Japan is the structure of fiscal relations between the central and local governments. According to Mochida (Reference Mochida, Muramatsu, Kume and Iqbal2001: 85), ‘the main features of the Japanese system are centralized tax administration, decentralized provision of public services, and dependence of local government on intergovernmental transfers.’ Whereas approximately 60% of taxes are collected by the central government, most services are provided by local governments. Every year, the central government redistributes approximately 45% of its tax-generated revenue to local governments to help pay for services such as road construction, health care, sewerage, clean drinking water, and waste disposal. Because municipalities face restrictions on the taxes they are permitted to levy and on their ability to borrow, central government transfers constitute an average of 33% of their annual income (Fukui and Fukai, Reference Fukui and Fukai1996; Scheiner, Reference Scheiner2006; Saito, Reference Saito2010). For the average municipality, about half of this comes from the formula-derived transfer mentioned above (LAT), while the other half comes from a pool of discretionary funds called ‘national treasury disbursements’ (NTD). Municipalities apply for NTD for the purpose of funding projects and bureaucrats are charged with deciding which projects to fund. Scheiner (Reference Scheiner2006) argues that dependence on the central government made local politicians susceptible to being pulled into clientelistic exchanges with their LDP HoR incumbents, in which they traded vote-mobilization efforts for help securing pork-barrel projects. Saito (Reference Saito2010) argued that LDP HoR incumbents used NTD to buy votes. He found that HoR electoral districts with more HoR incumbents per voter and more local politicians, respectively, received larger NTD allocations.
A third driver of pork-barreling in Japan is the way votes are counted in elections. Catalinac et al. (Reference Catalinac, Bueno de Mesquita and Smith2019) reasoned that municipalities' dependence on the central government for transfers, combined with the fact that votes are counted at the level of the municipality, virtually all municipalities are contained within a single electoral district,Footnote 13 and the LDP (almost) always wins, meant that LDP HoR incumbents would have been well-positioned to make the distribution of NTD contingent on how well the municipality had ‘performed’ in the most recent HoR election. Their analyses, conducted on HoR elections held between 1980 and 2000, show that a municipality's post-election NTD allocation was a function of the share of eligible voters in the municipality who had cast their votes for winning LDP candidates. Municipalities whose vote shares compared favorably to others in the same district received more NTD, while municipalities whose vote shares compared less favorably received less. Observationally, then, this study found that NTD flows to core supporters within districts, but those core supporters have to demonstrate their fealty in every election to continue receiving it.
To summarize, NTD is not allocated according to formalized, publicly available, and non-manipulable rules. Evidence suggests that it is distributed to municipalities with a view to enhancing the electoral prospects of LDP politicians. Thus, it is non-programmatic. Our programmatic policy of interest, on the other hand, is also bestowed on municipalities, but on the basis of a factor (historical levels of snowfall) that is plausibly exogenous, meaning difficult for municipalities to manipulate. A challenge when estimating the impact of any programmatic policy is that there are usually strong incentives for potential beneficiaries whose characteristics almost qualify them for the policy to manipulate their reporting of those characteristics to help them qualify. We think it would be difficult for municipalities whose (historical levels of) snowfall almost qualified them to manipulate those records. Contrast this to another programmatic policy, the Special Measures Act for the Promotion of Depopulated Regions (1970). In this case, eligibility is based on annual rates of population decline, share of elderly residents, and fiscal strength. Recent work implies that the reporting of these statistics can be manipulated (e.g., Fukumoto and Horiuchi, Reference Fukumoto and Horiuchi2011; McMichael, Reference McMichael2017). The fact that assignment to the treatment is plausibly exogenous is a major advantage of our research design.
3. Empirical strategy
One advantage of selecting the snow subsidy is that municipalities qualify for it on the basis of a characteristic that is plausibly exogenous to voting behavior. Another advantage is more subtle, yet also related to our desire to minimize the impact of confounding variables. In Japan, numerous studies show that both of our dependent variables, electoral support for the incumbent and the allocation of non-programmatic goods, vary systematically by electoral district.Footnote 14 The fact that some districts return higher levels of support or receive larger allocations of non-programmatic goods means that we must perform a strictly within-district comparison, meaning that we must compare subsidy-eligible municipalities to their subsidy-ineligible counterparts in the same electoral district. The fact that snowfall determines eligibility for the policy and many areas of Japan experience heavy snowfall means that we have a relatively large number of municipalities that qualify for the policy. This means that we are studying a policy with consequences for a relatively large number of Japanese people, on the one hand, but even more importantly, it means that we have enough within-district variation in subsidy eligibility to implement a within-district research design.Footnote 15 In the nine HoR elections held between 1980 and 2005, between 11 and 19% of the total number of electoral districts in each election were ‘mixed,’ meaning that beneficiary municipalities co-existed with non-beneficiary municipalities.Footnote 16 By leveraging variation in subsidy eligibility within electoral districts, accomplished with the use of district-year fixed effects, our design enables us to minimize the effects of potential confounding variables at the district-level.
As Figure 1 shows, municipalities eligible for the snow subsidy tend to be clumped together in the northwest. This creates a clearly visible border separating beneficiary municipalities from non-beneficiary municipalities. This feature of snowfall in Japan allows us to go one step beyond a research design grounded in the comparison of subsidy-eligible and subsidy-ineligible municipalities in the same district to implement a geographic regression discontinuity (GRD) design (Keele and Titiunik, Reference Keele and Titiunik2015, Reference Keele and Titiunik2016). This allows us to limit the comparison further, from all subsidy-eligible and subsidy-ineligible municipalities in the same electoral district to geographically proximate subsidy-eligible and subsidy-ineligible municipalities in the same electoral district. This design allows us to further minimize the possibility that confounding variables can explain any observed differences across municipalities that do and do not receive the snow subsidy.
To elaborate, the premise of a GRD design is that when a border is (arguably) exogenously drawn, researchers can, providing certain conditions are met, treat units that are close to but on opposite sides of the border as identical on all dimensions, apart from the fact that some are in the ‘treated’ zone, while others are in the ‘control’ zone. Once researchers have verified that these conditions are met, the design makes it possible to attribute any observed difference in outcome of interest across units on either side of the border to the causal effect of being ‘treated’ (in our case, receiving the snow subsidy). What are these conditions? A GRD design yields valid causal estimates of a treatment when (1) the border is not associated with other discontinuities in unit-level characteristics; (2) actors have not manipulated the assignment of the treatment since the law's enactment; and (3) there is no ‘compound treatment’ (which occurs when the border is synonymous with other boundaries).
Are these conditions met in our setting? First, online Appendix C checks for discontinuities in eight municipality-level characteristics at the border.Footnote 17 We find a discontinuity only in area size: beneficiary municipalities immediately proximate to the border are slightly larger than their same-district, non-beneficiary counterparts. This means we must exercise caution in interpreting our estimates of the treatment as causal, but we run all the analyses below with and without a control for area size and find similar results. Second, the criteria governing subsidy eligibility makes it unlikely that sorting occurred. Online Appendix D reports the results of a McCrary (Reference McCrary2008) sorting test, which shows no evidence of self-sorting. Third, technically speaking, in our case the border does not determine treatment; rather, it is an artifact of the geographic location of the municipalities qualifying for the subsidy and thus, of historical levels of snowfall. However, the fact that it is drawn around municipalities means that it is not synonymous with a single municipality, nor with any other administrative or political entity. We are not aware of anything that could occur along this border that could constitute a compound treatment.
To summarize, the fact that eligibility for our programmatic policy is determined by a factor that is plausibly exogenous, adequate variation in treatment status exists within electoral districts, and it is possible to compare municipalities in the same electoral district that are geographically proximate to one another but vary in their treatment status enables us to implement a research design that minimizes the potential effects of confounding variables.Footnote 18
In more detail, our two outcomes of interest are levels of electoral support for the LDP and NTD allocations, which are both measured at the level of the municipality. While the Snow Act was enacted in 1962, data on NTD allocations are not available until 1977 (Saito, Reference Saito2010). We focus on the 1980–2005 period because data on all our variables is available. As a result, our analyses capture the equilibrium effect of the programmatic policy in the long run. We build a comprehensive dataset comprising voting behavior in the nine HoR elections held during this time, annual NTD allocations, snow subsidy eligibility, and other features of the 3,300+ municipalities that existed. Because the snow subsidy encompasses different types of benefits, converting these benefits into a monetary amount for each municipality-year is difficult, if not impossible. Thus, we do not exploit variation in the amounts of snow subsidy received by beneficiaries (the intensity of the treatment), but variation in eligibility for the treatment across municipalities. For data on voting behavior, NTD allocations, and other features of municipalities, we use the replication data for Catalinac et al. (Reference Catalinac, Bueno de Mesquita and Smith2019), supplemented for the post-2000 period with the raw data from JED-M and Nikkei NEEDs (Mizusaki, Reference Mizusaki2014). For data on municipalities' eligibility for the snow subsidy, geographical location, and altitude, we use data from Japan's National Land Numerical Information Service and Geospatial Information Authority.Footnote 19
To implement a GRD design in our setting, we take the universe of municipality-years in mixed districts and calculate the distance between their centroids and the nearest location on the border. Then we set a very narrow bandwidth of distance to the border and restrict our observations to the municipality-years that fall within this range. With this sample, we estimate a local linear regression:

where the unit of analysis is municipality m in district-year dt. We examine two outcomes, which are measured in municipality m in district dt. α dt denotes fixed effects by district-year. D mdt is the running variable, a one-dimensional distance between the centroid of municipality m and its nearest point on the border (beneficiary municipalities receive positive values and non-beneficiary municipalities receive negative ones).Footnote 20 f( ⋅ ) represents a polynomial function of distance to the border estimated separately for the municipalities on both sides. Snow Subsidymdt is a dummy variable that takes a value of 1 if the municipality receives the subsidy and 0 otherwise. τ captures the local average treatment effect (LATE) of the snow subsidy at the threshold (border). Following standard practice, observations are weighted by their distance to the border using triangular kernel weighting and standard errors are clustered on municipality. We use a range of bandwidths between ±4,000 and ±15,000 (in meters) to select observations and report the LATE estimated with all of these bandwidths.Footnote 21
4. Main results
To preview our main findings, we first show that the snow subsidy has no statistically discernible impact on the LDP's vote share at the geographical threshold. This is inconsistent with the PISH. Next, we examine how the snow subsidy impacts the allocation of non-programmatic goods. Here, we find that the snow subsidy has a statistically significant, positive impact on the amount of NTD at the threshold. This means that policy beneficiaries receive more non-programmatic goods than otherwise-similar non-beneficiaries in the same electoral district.
4.1 The impact of the snow subsidy on LDP vote share
We begin with the examination of the PISH. In this analysis, the outcome is LDP Vote Share, the proportion of total votes cast for LDP candidates in the municipality. Because districts were multi-member (electing between two and six winners) prior to 1994 and single-member after 1994, they typically saw between two and four LDP candidates prior to 1994 and one after. This is the operationalization of electoral support for the incumbent used in most studies on the PISH.
Figure 2 summarizes the LATE of Snow Subsidy on LDP Vote Share estimated on the nine HoR elections, 1980–2005. On the x-axis, we vary the bandwidths of the local linear regression from ±4,000 to ±15,000. The y-axis displays the coefficient on Snow Subsidy and corresponding 90 and 95% confidence intervals. The number of observations changes from 1,221 at the most narrow bandwidth, which equates to an average of 5.5 municipalities per district-year, to 3,802 at the widest bandwidth shown, which equates to an average of 17 municipalities per district-year. Even at the widest bandwidth, then, we are only including 53% of the municipalities in mixed districts.
Receiving the snow subsidy results in no statistically significant difference in LDP Vote Share for municipalities in mixed districts, 1980–2005.
Note: This figure depicts the coefficient estimates on Snow Subsidy obtained from local linear regressions of LDP Vote Share on beneficiary status when the bandwidth is changed from ±4,000 to ±15,000. Shaded areas indicate 90%/95% confidence intervals.

In Figure 2, the LATE of Snow Subsidy consistently shows a negative and statistically insignificant sign across the entire range of bandwidths. This means that there is no difference in LDP vote share at the geographical threshold. Therefore, we do not have strong evidence that the snow subsidy boosts electoral support for the incumbent party. This result is at odds with the PISH.Footnote 22
4.2 The impact of the snow subsidy on NTD
Next, we analyze how the presence of a programmatic policy influences the allocation of non-programmatic goods. In this analysis, our outcome of interest is Post-Election Per Capita Transfers, or the logarithm of per capita NTD received by municipalities in the fiscal years following the same nine HoR elections, 1980–2005. We use the amount received after elections because NTD is withheld until after municipalities' ‘performance’ in the election is discerned (Catalinac et al., Reference Catalinac, Bueno de Mesquita and Smith2019).
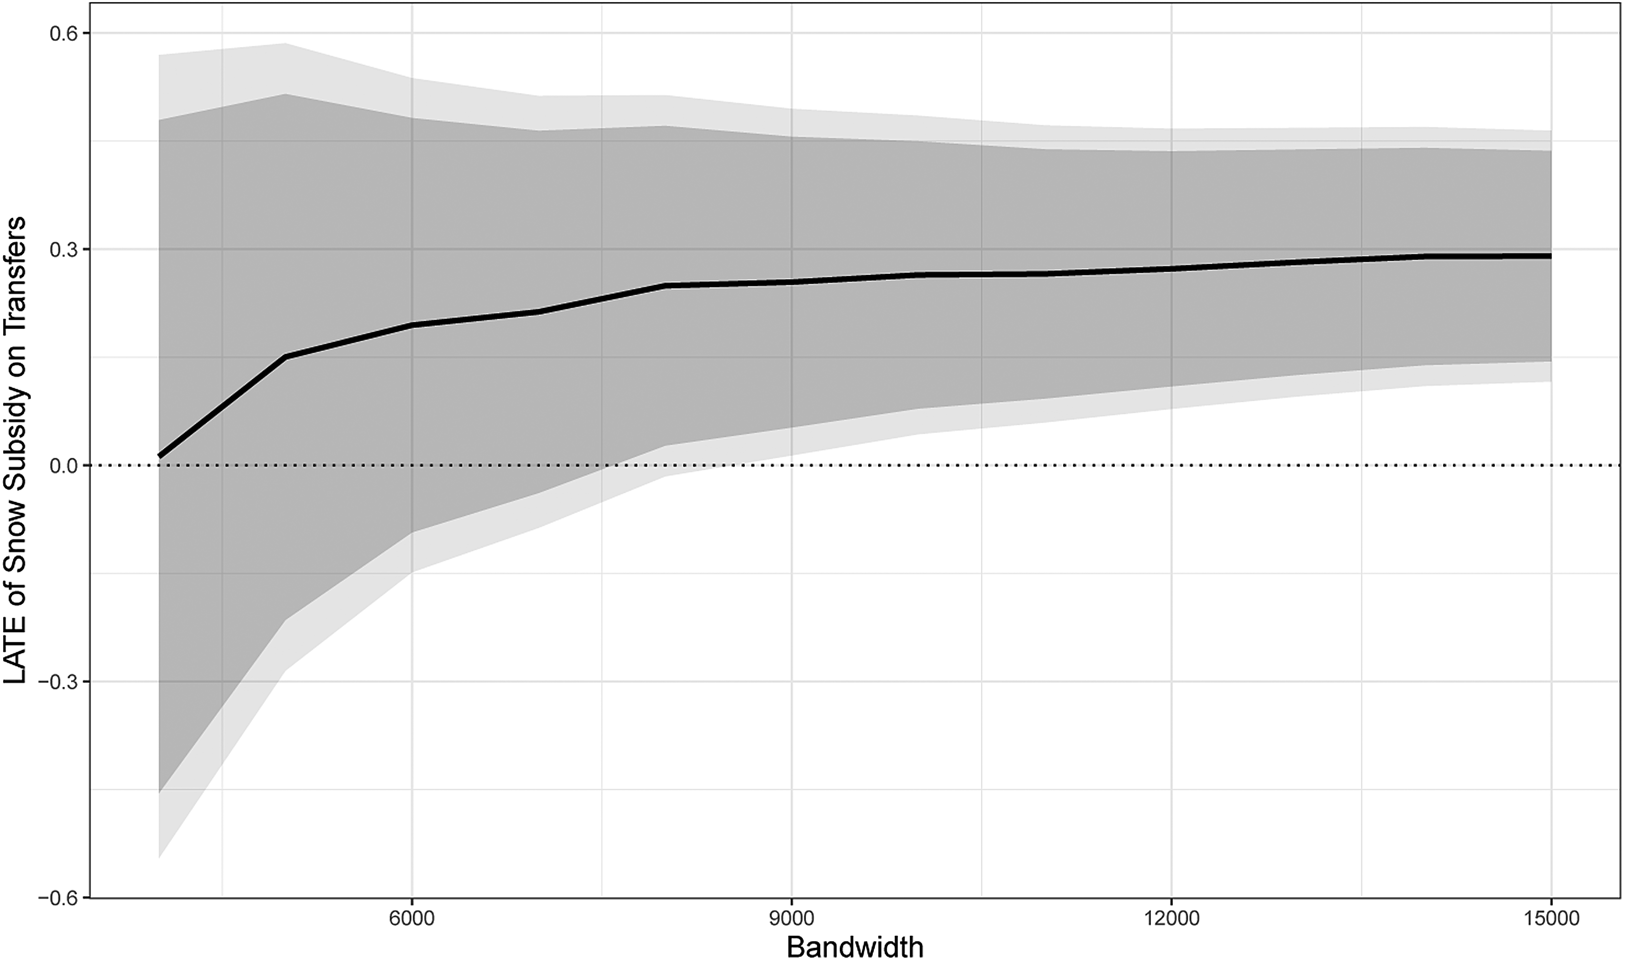
Figure 3 depicts the LATE of Snow Subsidy on Post-Election Per Capita Transfers. The bandwidths used are the same as those in Figure 2. We see that at narrower bandwidths, the effect of Snow Subsidy is positive but imprecisely estimated. This is because at these ranges, we do not have a sufficient number of observations on both sides of the border in many district-years. However, once we widen the bandwidths to include more observations (bandwidth ≥9, 000), the positive effect of Snow Subsidy becomes statistically significant.Footnote 23 The estimated effect of the snow subsidy is roughly 0.23, which means that beneficiary municipalities near the geographical border receive a per capita NTD allocation that is 25.9% (exp(0.23) = 1.259) larger than their otherwise-similar, same-district non-beneficiary counterparts.
Receiving the snow subsidy results in larger per capita NTD allocations after elections for municipalities in mixed districts, 1980–2005.
Note: This figure depicts the coefficient estimates on Snow Subsidy obtained from local linear regressions of Post-Election Per Capita Transfers on beneficiary status when the bandwidth is changed from ±4,000 to ±15,000. Shaded areas indicate 90%/95% confidence intervals.
In sum, our results show that beneficiary municipalities do not exhibit more electoral support for their LDP incumbent than otherwise-similar non-beneficiary municipalities in the same electoral district. Hence, our case reveals no support for the PISH. In contrast, our intuition that the two sets of municipalities would receive systematically different amounts of non-programmatic goods is borne out in the analysis. Beneficiary municipalities receive systematically larger per capita NTD allocations than their otherwise-similar, same-district, non-beneficiary counterparts. The fact that beneficiary municipalities receive both the programmatic policy and the extra NTD, yet do not deliver more electoral support for the incumbent, is difficult to reconcile with the PISH.Footnote 24
5. Potential explanations
Why are beneficiaries of the programmatic policy receiving more non-programmatic goods than non-beneficiaries, despite exhibiting no differences in electoral support? We explore three potential mechanisms. One is that receiving the snow subsidy reduces the willingness of beneficiaries to vote for the incumbent, which leads the incumbent to try to offset this reduced willingness with extra non-programmatic goods. Another is that the snow subsidy does not meet the needs of beneficiaries, prompting the incumbent to make up the difference with non-programmatic goods. A third is that differences in lobbying capacity explain why beneficiaries receive more non-programmatic goods.
5.1 Programmatic policies reduce willingness to vote for the incumbent
First, we can use insights from three studies that found that their policies of interest led to declines in electoral support for the incumbent (Saito, Reference Saito2010; Blattman et al., Reference Blattman, Emeriau and Fiala2018; De Kadt and Lieberman, Reference De Kadt and Lieberman2020). The causal pathway imagined by these scholars is that receiving these policies increases beneficiaries' satisfaction with the incumbent, which reduces their incentives to maintain support for the incumbent in elections.Footnote 25 It follows that if programmatic policies do have this effect, incumbents might be anticipating this decline and, to the extent that they are able, using non-programmatic goods to try to offset it. This may be why we observe beneficiary municipalities receiving more non-programmatic goods than non-beneficiary municipalities, even though the amount of support they deliver to the incumbent is the same.
It is difficult to subject this mechanism to rigorous empirical scrutiny without data on (1) levels of satisfaction with the incumbent among beneficiaries and otherwise-similar non-beneficiaries; and (2) data on why LDP politicians in mixed districts deliver more non-programmatic goods to beneficiary municipalities, even when they do not receive higher vote shares from them. In lieu of such data, we present evidence for the first part of the causal pathway imagined by these scholars: that the programmatic policy increases voter satisfaction with the incumbent and reduces their incentives to maintain support for the incumbent. However, we emphasize that a more complete examination of this mechanism is necessary. We urge future researchers to subject it to greater scrutiny.
For this evidence, we turn to the Nationwide Survey of Neighborhood Associations (Pekkanen et al., Reference Pekkanen, Tsujinaka and Yamamoto2014). Conducted between 2006 and 2007, this survey aimed to understand the function of Japan's neighborhood associations (henceforth ‘NHAs’). NHAs are informal, voluntary groupings organized at the level of the neighborhood. They provide social services, mediate interactions between residents, bureaucrats, and politicians, and mobilize voters during election campaigns (Pekkanen, Reference Pekkanen, Read and Pekkanen2009).Footnote 26 Of the 18,404 NHA heads who responded to the survey, approximately 3,000 were located in our 32 mixed districts, spanning 53 beneficiary municipalities and 106 non-beneficiary municipalities therein. While NHA heads are not the same as ordinary voters, this is the only survey data we could find that allows us to compare the attitudes of voters in beneficiary and non-beneficiary municipalities in mixed districts.
Two questions are of particular interest to us. One asks NHA heads how much they trust national-level institutions, including the central government and national politicians.Footnote 27 The question is ‘When announcing the NHA's requests and opinions, how much can you trust the following institutions?’ A five-point scale was offered, in which ‘1’ was ‘very trustworthy’ and ‘5’ was ‘not at all.’ We reversed the original scale, such that higher numbers reflect greater trust. Another question asks NHA heads ‘What type of activities does your NHA conduct?’ In the question, one of the items was ‘Assisting [and recommending] a particular candidate in election campaigns’ and NHA heads were presented with a binary ‘Yes’ or ‘No’ choice.
Using these outcomes, we estimate three multilevel linear models using the universe of observation in mixed districts.Footnote 28 All models include NHA- and municipality-level controls, random effects by municipality (as NHAs are nested within municipalities), and fixed effects for electoral district (to limit the comparison to beneficiary and non-beneficiary municipalities in the same district). As controls, we use the number of member households at the NHA level and the same time-varying municipality-level characteristics that we check for discontinuities on in the GRD design, with the exception of population, which we replace with the finer-grained measure of household size at the NHA level.
Table 1 displays the results of these regressions. In all three models, our independent variable of interest is Snow Subsidy. In models 1 and 2, the dependent variable is Trust in the Central Government and Trust in National Politicians, respectively. The coefficients on Snow Subsidy are positive and significant in both models, showing that NHA heads in beneficiary municipalities exhibit greater trust in the central government and national politicians than NHA heads in non-beneficiary municipalities in the same district. This suggests that voters in municipalities that receive the snow subsidy may hold more positive views of the central government and national politicians than their counterparts in non-beneficiary municipalities. While holding more positive views does not necessarily mean that these voters are more satisfied, we would be unlikely to observe this positive relationship if they were more dissatisfied than their same-district non-beneficiary counterparts.
NHA heads in beneficiary municipalities exhibit higher levels of trust in the central government and national politicians (models 1 and 2) and are less willing to get involved in election campaigns on behalf of a particular candidate (model 3) than NHA heads in same-district non-beneficiary municipalities
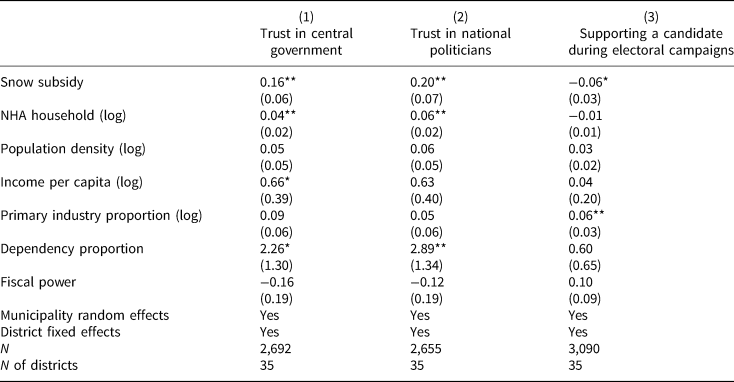
Note: *P < 0.10; **P < 0.05. NHA, neighborhood association. Observations are NHA heads in mixed districts who responded to the survey. The model is estimated with a linear model with random effects by municipality and fixed effects by district.
In model 3, the dependent variable is the number of ‘Yes’ responses to the phrase ‘Assisting [and recommending] a particular candidate in election campaigns.’ Here, the coefficient on Snow Subsidy is negative and marginally significant (P = 0.079). This means that NHA heads in beneficiary municipalities are less likely to report getting involved in election campaigns on behalf of a particular candidate relative to their counterparts in non-beneficiary municipalities in the same district. While this question does not ask about LDP candidates specifically, it is indirect evidence that receiving the snow subsidy has reduced the willingness of voters to help a candidate from the LDP or another party in elections.
We also found anecdotal evidence in newspapers that lends credibility to the possibility that the snow subsidy has increased beneficiaries' satisfaction with the incumbent, thereby reducing their incentives to maintain support for her. In one article, the president of a rice-growing company in a beneficiary municipality described feeling less compelled to vote for his LDP incumbent because his community now had ‘a bullet train, a highway, and underground pipes with nozzles that can melt snow’ (shosetsu paipu) (Asahi Shinbun, 2000). In another, the head of a construction company in a beneficiary municipality explained that construction companies depended on LDP politicians getting elected and funneling public works contracts their way, but it was becoming harder and harder to convince the area's residents to vote for LDP politicians. He said that residents used to understand the value of politicians who could build the roads needed to ensure that the region was not cut off from the rest of Japan due to heavy snowfall, but snow melters had solved this problem, reducing residents' enthusiasm for the LDP (Asahi Shinbun, 2001).
Of course, any inferences that can be drawn from an unrepresentative sample of newspaper articles are limited. All in all, however, both the survey data and anecdotal evidence point to the possibility that the snow subsidy might have increased beneficiaries' satisfaction with the incumbent, lowering their incentives to maintain support for the incumbent in elections. If LDP politicians expect lower vote shares among beneficiaries of the subsidy, it follows that they may want to deliver a greater amount of non-programmatic goods to beneficiaries.
5.2 Program beneficiaries have greater need
Another potential explanation for our main findings is that beneficiary municipalities receive more non-programmatic goods than otherwise-similar non-beneficiary municipalities simply because they have greater need. Despite its stated aim, the snow subsidy may not be sufficient to meet the needs of heavy-snowfall municipalities, and NTD may be used to make up the shortfall.
A perfect way to test this possibility would be to quantify how much extra need the snow subsidy fails to meet in beneficiary municipalities and assess whether the amount of NTD the municipality received is enough to cover it. But given this is implausible, what we can do is an indirect test of this hypothesis: if the snow subsidy is failing to meet the needs of the beneficiary municipalities in our sample, then it is reasonable to expect that it would also be failing to meet the needs of beneficiary municipalities outside our sample (in other parts of Japan). To the extent that the dummy for Snow Subsidy is simply capturing differences in remaining needs between the two types of municipalities (and not the effects of programmatic benefits), we should expect that beneficiary municipalities outside of mixed districts also receive larger per capita NTD allocations than their non-beneficiary counterparts.
To examine this, we regress Post-Election Per Capita Transfers on Snow Subsidy for all municipalities outside of mixed districts. In this specification, we cannot use district-year fixed effects because there is no within-district variation in beneficiary status (districts are comprised only of beneficiary or non-beneficiary municipalities). However, it is still important to control for district-level features that influence Post-Election Per Capita Transfers. Our specification therefore includes year fixed effects, district-year random effects, and time-varying municipality- and district-level controls.Footnote 29 Standard errors are clustered on the municipality.
Table 2 presents the results. The coefficient on Snow Subsidy is negative and statistically significant, the opposite of what we observe in the above analysis. This means that outside of mixed districts, beneficiary municipalities tend to receive smaller per capita NTD allocations than non-beneficiary municipalities. This casts doubt on the possibility that beneficiary municipalities in mixed districts receive larger NTD allocations because of differences in needs. It is only in districts with a specific configuration of municipalities (i.e., the coexistence of beneficiaries and non-beneficiaries) that program beneficiaries receive more transfers than non-beneficiaries.
The negative, statistically significant coefficient on snow subsidy shows that outside of mixed districts, beneficiary municipalities receive smaller per capita NTD allocations than their non-beneficiary counterparts

Note: *P < 0.10; **P < 0.05. The model is estimated with a multilevel linear model with random effects by district-year and fixed effects by election.
5.3 Program beneficiaries have advantages in lobbying
A third potential explanation for our main findings is that beneficiary municipalities receive more non-programmatic goods than otherwise-similar non-beneficiary municipalities because of organizational advantages in lobbying. One of the Snow Act's goals is to ‘promote cooperation among residents and volunteer activities’ in beneficiary municipalities. It is possible that the snow subsidy endows beneficiary municipalities with advantages in the process through which NTD allocations are applied for and received. The central government shrouds this in mystery, but we know that municipalities put together proposals for projects and solicit the help of LDP Diet members in lobbying government bureaucrats. If beneficiary municipalities have greater access to government figures (both at the local and national levels), enhanced lobbying skills, or greater social capital, this could explain why they are more successful in getting their projects funded (Saito, Reference Saito2010).
To examine this possibility, we return to the NHA data. We analyze seven questions that probe the NHA's access to, influence on, and relationship with local government.Footnote 30 Specifically, five asked about the means used to ensure resident interests are reflected in policymaking, another asked about the degree to which the NHA feels it can monitor local government, and the seventh asked about the extent to which the NHA can influence local government policies. It is reasonable to expect that if beneficiary municipalities are endowed with superior connections to government officials or lobbying ability, this would be reflected in answers to these questions. We run a multilevel model with NHA- and municipality-level controls, random effects by municipality, and fixed effects for electoral district, as described in Table 1.
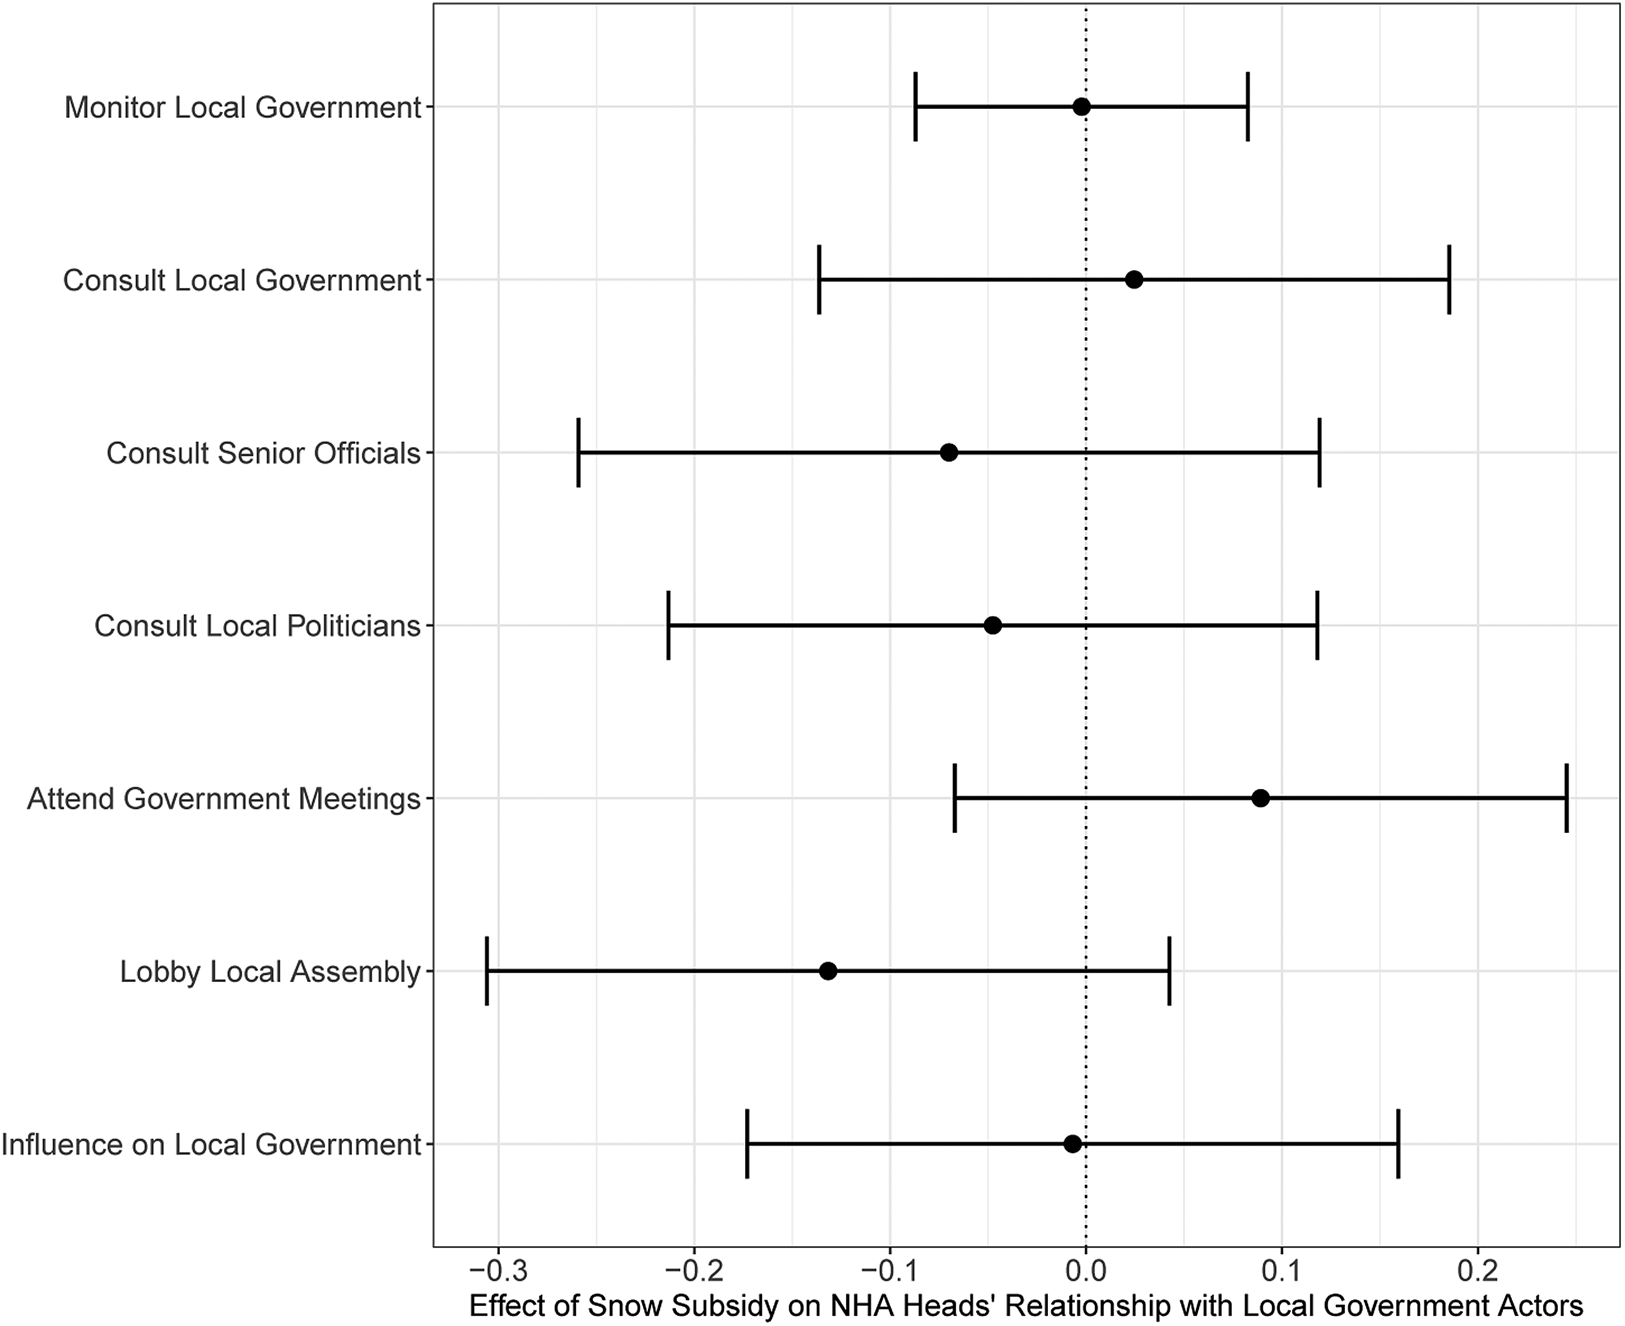
Figure 4 presents the effect of Snow Subsidy on NHA heads' responses to these questions.Footnote 31 In all seven models, the estimate of Snow Subsidy is not statistically distinguishable from 0. Hence, NHA heads in beneficiary municipalities seem no different from their counterparts in same-district non-beneficiary municipalities in terms of their perceptions of their lobbying capacity. On this basis, we think it unlikely that an explanation based on beneficiaries' organizational ability could account for the positive effect of the snow subsidy on the amount of NTD.
There are no statistically discernible differences in answers to questions probing NHA heads' relationship with local government actors between beneficiary and non-beneficiary municipalities in the same district.
Note: This figure depicts coefficient estimates from regressions of NHA heads' responses to seven questions as a function of Snow Subsidy using a multilevel linear model with random effects by municipality and fixed effects by district. Horizontal bars indicate 95% confidence intervals.
6. Conclusion
Literature on the electoral effects of programmatic policies tends to treat incumbents as passive bystanders, who sit back and watch as the effects of these policies unfold in their electorates. This enables researchers to attribute any observed differences in electoral support for the incumbent between policy beneficiaries and non-beneficiaries to the impact of the policy. While it might make sense to do so in some settings, we have made the case that it does not make sense in settings where incumbents have access to non-programmatic goods and use those goods to influence election results. In these settings, which characterize many developed and developing democracies, we suggest that incumbents have incentives to anticipate how a given programmatic policy is likely to change the voting calculus of beneficiaries and respond to this by adapting their allocation of non-programmatic goods. It follows that policy beneficiaries could end up with systematically more or less non-programmatic goods than their non-beneficiary counterparts, which would confound attempts to estimate the causal impact of these policies.
To evaluate this conjecture, we turned to Japan, where municipalities receive annual allotments of non-programmatic goods and differ in eligibility for a programmatic policy on the basis of historical levels of snowfall. Our results show that the amount of non-programmatic goods incumbents deliver to municipalities receiving the programmatic policy differs systematically from the amount delivered to municipalities not receiving the policy. More specifically, beneficiary municipalities receive more non-programmatic goods than otherwise-similar non-beneficiary municipalities. It is worth reiterating that our research design enables us to have a high degree of confidence in these results. We consider evidence for several different mechanisms. Our evidence suggests that incumbents may be anticipating that the programmatic policy will decrease support for them among beneficiaries and seeking to retain their support by funneling more non-programmatic goods their way.
For comparative politics scholars, the main takeaway is that any study of the PISH that does not consider the possibility that incumbents are behaving in this manner may be inaccurately estimating the effects of their programmatic policy of interest. Incumbents will have greater leeway to adjust their electoral strategies when they have greater access to non-programmatic goods and greater ability to target them at policy beneficiaries. In settings in which the programmatic policy is bestowed on individuals and the non-programmatic goods incumbents have access to are targetable at groups, the incumbent may not be able to adjust her allocation of non-programmatic goods. In contrast, in settings in which both the programmatic policy and the non-programmatic goods are bestowed on individuals (a setting that characterizes many developing democracies) or on groups (like Japan), incumbents may be freer to engage in this type of strategic behavior. Access to non-programmatic goods and/or the ability to target those goods effectively likely varies among incumbents from the same party at different levels of government. This could help explain why the same programmatic policy is found to have different ‘effects’ on votes for incumbents at one level of government relative to another (e.g., Zucco, Reference Zucco2013; Tobias et al., Reference Tobias, Sumarto and Moody2014).
Going forward, we urge comparativists interested in the effects of programmatic policies to consider the possibility that incumbents are engaging in this type of strategic behavior. First, we need to know how, exactly, incumbents view the effects of these policies. If incumbents expect these policies to reduce the willingness of beneficiaries to support them, then what strategies are available? Under what conditions will incumbents making this calculation respond the way they did in Japan (by delivering more non-programmatic goods to beneficiaries)? These questions will require the selection of cases where it is possible to collect data on elite perceptions of the policy, elite behavior, and voter calculations.
For scholars of Japanese politics, a fruitful avenue for future research is to investigate the effects of other programmatic policies in Japan. As examples, we can point to the Remote Islands Development Act (1953), the Special Measures Act for the Promotion and Development of the Amami Islands (1954), the Mountain Villages Development Act (1965), the Act of Special Measures for Promoting Depopulated Regions (1970), and the Peninsular Areas Development Act (1985), all of which aim to redress regional discrepancies in development (Saito, Reference Saito2010; Naoi, Reference Naoi2015). Helpfully, detailed geo-coded data on the beneficiaries of these policies are available for scholarly use. These policies have received relatively little attention by Japanese politics scholars, but future work could harness them to ascertain whether the effects we found occurred in the wake of their enactment, too. If so, their analyses could help clarify the help clarify the mechanism driving this effect.
Supplementary material
The supplementary material for this article can be found at https://doi.org/10.1017/S1468109922000378 and https://dataverse.harvard.edu/dataset.xhtml?persistentId=doi:10.7910/DVN/FZW7DB.
Acknowledgement
We thank Joan Barceló, Muhammet Bas, Nisha Bellinger, Bruce Bueno de Mesquita, Jack Blumenau, Christina Davis, Kentaro Fukumoto, Alexandra Hartman, Yusaku Horiuchi, Andy Harris, Kosuke Imai, Markus Kollberg, Ko Maeda, Lucia Motolinia, Megumi Naoi, Yoko Okuyama, Yoshikuni Ono, Mark Ramseyer, Frances Rosenbluth, Alastair Smith, Daniel M. Smith, Susan C. Stokes, Jeffrey Timmons, Hikaru Yamagishi, participants of the NEWJP conference at Dartmouth College (26–27 August 2019) and the Political Economy Workshop at Norwegian Business School (22–24 May 2022), and the faculty of New York University Abu Dhabi (5 February 2020) and University College London (11–24–2021) for helpful suggestions. We also thank Yutaka Tsujinaka and Choe Jae Young for generously sharing data.


 Open access

