


1 Introduction
What determines individuals’ preferences for redistribution is an issue that has been, and still is, largely debated. One obvious candidate is the self-interest of individuals, and indeed surveys suggest that preferences for redistribution are negatively correlated with individuals’ current or future expected incomes (Reference Ohtake and TomiokaOhtake & Tomioka, 2004; Reference Alesina and La FerraraAlesina & La Ferrara, 2005; Reference Ravallion and LokshinRavallion & Lokshin, 2000). However, various other factors might be at stake too. In addition to reward maximization, individuals might support a redistributive policy that favors their fellow group members, as shown in laboratory studies of redistribution games (Reference Charness, Rigotti and RustichiniCharness, Rigotti & Rustichini, 2007; Reference Klor and ShayoKlor & Shayo, 2010; Reference Lei and VeselyLei & Vesely, 2010; Reference Aguiar, Becker and MillerAguiar, Becker & Miller, 2013). Such favoritism would lead poorer individuals to support more redistribution, which would be beneficial to other individuals with similar wealth levels. Another factor that could explain redistribution preferences is inequality aversion (Reference Loewenstein, Thompson and BazermanLoewenstein, Thompson & Bazerman, 1989; Reference Fehr and SchmidtFehr & Schmidt, 1999). Across individuals, fairness ideals may vary from strict egalitarianism to libertarian laissez-faire without any redistribution through social-liberal principle where inequality is acceptable when it reflects individual responsibility (Reference Cappelen, Hole, Sørensen and TungoddenCappelen, Hole, Sørensen & Tungodden, 2007). Subjects are willing to sacrifice some of their payoff to reduce inequalities among others (e.g., Durante, Putterman &van der Weele, 2014), but they may also accept inequalities when doing so leads to an increase in overall earnings under a tradeoff between equality and efficiency (Reference Amiel and CowellAmiel & Cowell, 1999; Fisman, Kariv, Markovitz, 2007; Reference Müller and RenesMüller & Renes, 2020).
Yet another factor of interest regarding redistribution choices is the belief held by individuals about the determinants of economic success. Indeed, if redistribution should take accountability into account, and compensate for bad luck (e.g., difficult weather conditions) but not for the lack of effort (Reference DworkinDworkin, 1981; Reference RoemerRoemer, 1993; Reference KonowKonow, 1996; Reference FleurbaeyFleurbaey, 2008), then holding different beliefs about the role of luck or effort in a particular situation would produce different attitudes towards redistribution (Reference Bono, Chanel, Lu, Luchini, Teschl and TrannoyBono et al., 2009; Reference Alesina, Glaeser and SacerdoteAlesina, Glaeser & Sacerdote, 2001). Experimental studies have confirmed that participants select higher redistribution levels in situations where they know that accountability is reduced, because fluctuations in earnings or in risk were introduced by experimenters and could not be controlled by agents (e.g., Krawczyk, 2010; Akbas, Ariely & Yuksel, 2019).
Importantly, such beliefs about the role of luck or effort can be subject to a self-serving bias (Reference Miller and RossMiller & Ross, 1975; Reference BradleyBradley, 1978), by which individuals would attribute their successes to their own effort, and their failures to bad external circumstances (for a review see Mezulis, et al., 2004). Thus, even when their success is actually due to chance, successful individuals may underestimate the importance of luck, leading them to support less redistribution. This effect of individuals’ success on beliefs and redistribution preferences has been nicely illustrated in a recent laboratory experiment by Deffains, Espinosa and Thöni (2016) (hereafter DET2016; see also Reference Cassar and KleinCassar & Klein, 2019 for similar results). In this experiment, participants were told that scores would depend partly on performance in a real effort task and partly on a random process. They were then informed about whether they scored above or below the median (which in fact was fully determined by the random process). Crucially, “overachievers” (i.e., participants who scored above the median) indicated that scores mainly reflected internal factors such as effort, whereas “underachievers” (i.e., below the median) emphasized the role of external factors. Overachievers also redistributed less than underachievers in a disinterested dictator game.
Based on these results, DET2016 offered that “the self-serving bias can contribute to the polarization of the views on redistributions”. However, while the changes in beliefs and redistribution following the status manipulation are compelling, the specific mechanisms underlying these effects are not fully understood. One natural interpretation of these results is that the difference in redistribution between overachievers and underachievers was due to their adoption of different beliefs about the role of luck and effort in the task. Specifically, as a result of a self-serving bias, underachievers would emphasize the role of luck in the task whereas overachievers would emphasize effort. If one assumes that participants’ redistribution is based on an accountability principle, then this difference in beliefs would lead underachievers to support higher levels of redistribution than overachievers. The idea that people engage themselves in self-serving beliefs to justify their lack of altruism is popular in the economic literature (Reference Di Tella, Perez-Truglia, Babino and SigmanDi Tella et al., 2015; Reference Gino, Norton and WeberGino, Norton and Weber, 2016; Reference Ging-Jehli, Schneider and WeberGing-Jehli, Schneider & Weber, 2020) and the empirical results reported by Deffains, Espinosa & Thöni (2016) seem to be a nice example of this possibility.
How could self-serving beliefs account for the the effect of status on redistribution? One possibility is that participants adapt their ideals of fairness to themselves. In other words, rather than keeping constant their principle of justice, participants might adopt a different principle for redistribution depending on whether they are now overachievers or underachievers. Past studies have shown that even when individual contributions are precisely known (and therefore beliefs are not at stake) what individuals deem fair in terms of redistribution may also be subject to a self-serving bias (e.g., Reference Messick and SentisMessick & Sentis, 1979; Reference Wade-Benzoni, Tenbrunsel and BazermanWade-Benzoni, Tenbrunsel & Bazerman, 1996; Reference Diekmann, Samuels, Ross and BazermanDiekmann et al., 1997). In the dictator game, when contributions are known, redistributions can align with an accountability principle, an egalitarian principle, or a libertarian principle, depending on the best interest of the dictator (see e.g., Rodriguez-Lara & Moreno-Garrido, 2012; Reference UbedaUbeda, 2014).
Another possible explanation is that redistribution choices are affected by an in-group bias, by which individuals tend to favor their fellow group members when making redistribution choices (Reference Charness, Rigotti and RustichiniCharness, Rigotti and Rustichini, 2007; Reference Klor and ShayoKlor & Shayo, 2010; Reference Lei and VeselyLei & Vesely, 2010; Reference Aguiar, Becker and MillerAguiar, Becker & Miller, 2013). Note that even the simple experience of success or failure in an experimental task is sufficient to generate a sense of group membership (e.g., Reference Cassar and KleinCassar & Klein, 2019). In the present case, favoritism towards one’s own group would lead overachievers to redistribute less (so as to preserve the high payoff of other overachievers) and underachievers to redistribute more (so as to increase the payoffs of other underachievers). This suggests that in-group favoritism could be an alternative mechanism to explain the difference in redistribution between overachievers and underachievers.
The experimental paradigm of DET2016 is interesting because it places participants in a situation of uncertainty about the determinants of income inequalities that is a common feature of real life. Thus, identifying more precisely the underlying mechanisms will allow for a better understanding of the polarization of views on redistribution. A priori, the three different mechanisms introduced are not mutually exclusive, and can operate simultaneously.
In the present study, our goal is to clarify the mechanisms by which an exogenous (experimenter determined) change in socio-economic status would affect participants’ redistribution behavior. To do so, we conducted an experiment made of two parts (Figure 1). In the first part, we replicated the design of DET2016, to measure beliefs about the task and redistribution choices in a disinterested dictator game, following an exogenous allocation to an overachiever or underachiever status. To anticipate our results, in we did replicate the main finding of DET2016: the status manipulation by which participants were told that they overperformed or underperformed relative to others affected their redistribution choices in dictator games.
Summary of the experimental procedure.

Our study also included new measures in the second part of the experiment, to evaluate how redistribution choices might depend on in-group favoritism and on attitudes towards inequalities. When examining our other measures, we found that overachievers and underachievers adopted different attitudes towards egalitarian vs. incentivized schemes, changing their justice principles in a self-serving manner. Crucially, this self-serving adjustment of justice principles was correlated with redistribution choices, independently of the status manipulation effect, thus supporting an interpretation in terms of mediation. We also found that in-group favoritism existed in our data and was also correlated with redistribution choices, even after the effect of status was subtracted from both measures. In sum, we could find support for two mechanisms that may subtend the effect of status on redistribution choices.Footnote 1
2 Methods
2.1 Participants
The experiment was conducted on 160 participants in total (in 8 sessions of 20), who were recruited through the Laboratory of Experimental Economics research pool in Paris (LEEP). The sample was composed of 82 males and 78 females, with an average age of 24 years old. Each session lasted approximately 45 minutes and the participants earned on average 13.5 euros. As detailed below, 16 participants (2 in each session) were chosen as targets for the disinterested dictator game, and did not produce redistribution choices, so they were not included in our analyses. As a result, 144 participants were included, with 72 overachievers and 72 underachievers.
A power analysis indicated that at least 64 participants were needed in each group, to detect with a power of 80% and an error rate of 5% an effect size of .5 in the comparison of overachievers and underachievers in a two-tailed t-test.
2.2 Procedure
The interface was programmed with the z-Tree software (Reference FischbacherFischbacher, 2007). The same code as used in DET2016 was used, with their permission, for the first part of the experiment. New code was created specifically for the second part of the experiment.
2.3 Part 1: replication of DET2016
Production task:
In the production task participants had to count the 1’s in sequences of 0’s and 1’s. They had to analyze correctly as many sequences as possible, within 10 minutes. Sequence length was between 4 and 15 items. There were two conditions of difficulty. In the difficult condition, participants faced 25 sequences on each page, with more long sequences and less short sequences. In the easy condition, participants faced 20 sequences on each page, with more short sequences. In the difficult condition, all sequences provided the same reward, whereas in the easy condition, shorter sequences were rewarded more, increasing the chances to obtain more tokens in that condition. Participants knew that they were randomly assigned to either an “easy” or a “difficult” task, but they did not know which one. Participants in both conditions could theoretically earn the same maximum amount of tokens, however the task difficulty manipulation made it much more difficult to obtain a high amount of tokens. In practice and as expected, participants assigned to the easy condition all became “overachievers” (with a score above the median) while participants assigned to the difficult condition all became “underachievers” (below the median). Once the task was completed, participants learned their position relative to the median, i.e., their status.
Fatalism:
Participants answered 6 questions asking how likely their earnings were due to luck (external factors, 3 questions) and to their effort (internal factors, 3 questions). Questions are presented in the Supplement, section 4. (As noted in footnote 1, we do not report data from these items.)
Redistribution:
Participants then engaged in the disinterested dictator game. In each session, two individuals with earnings differing by 20 tokens (or as close as possible to 20) were chosen as targets, and the other participants could reallocate money from the richest to the poorest of these two targets. These participants had no gain or loss from their own decisions, but one of their redistribution choices was implemented (and thus affected the earnings of two others) at the end of the study. Our measure of redistribution R was defined as the fraction of the amount transferred to the poorest, relative to the initial difference between the two targets. For example, R=0 would correspond to a libertarian solution (no redistribution), and R=.5 would correspond to the egalitarian solution (fifty-fifty split of the earnings between the two targets).
2.4 Part 2: Additional measures
In-group favoritism:
We evaluated favoritism towards one’s own group (overachiever or underachiever) via hypothetical redistribution choices, in which participants knew the status of the two targets. The initial difference in earnings between the two targets was again as close as possible to 20 tokens. Three conditions were tested in a random order: one redistribution choice between two underachievers, one between two overachievers, and one from an overachiever to an underachiever. Our measure of in-group favoritism is defined as the average redistribution (again, measured as the fraction of the redistributed tokens to the initial difference) observed when the two targets have the same status, minus the redistribution observed when the two targets have different statuses. If participants favored targets of their own group, this measure should take negative values for underachievers and positive values for overachievers.
Robustness of redistribution:
To evaluate whether the effect of status on redistribution choices in the first part changed under incentives, we used two dictator games, where participants could reallocate tokens between themselves and another randomly selected participant who earned 20 tokens more, or 20 tokens less than the participant. Participants thus played against a poorer and against a richer other participant, in a random order. Redistribution choices were robust to incentives: as detailed in the Supplement, Section 1, the effect of status on redistribution was also found in the incentivized version of the dictator game.
Beliefs about task difficulty and performance:
We then evaluated participants’ beliefs about whether they were assigned to the easy condition given their status, and their beliefs about whether they would perform better than the median of other participants with the same difficulty level. Both questions were presented as a binary choice followed by a confidence level on a rating scale from 50% to 100%. To evaluate whether participants’ responses were affected by social image, we followed the procedure of Reference Andreoni and SanchezAndreoni and Sanchez (2014) and elicited these beliefs once without incentives, and then again with incentives. As detailed in the Supplement, Section 2, we found no difference between stated and incentivized beliefs. The incentivized elicitation used the matching probability method (Reference Hollard, Massoni and VergnaudHollard, Massoni & Vergnaud, 2016) detailed in Supplement, Sections 4.2 and 4.3. This elicitation method is a classic BDM procedure (Reference Becker, DeGroot and MarschakBecker, DeGroot & Marschak, 1964) that is theoretically neutral with respect to risk attitudes (Reference KarniKarni, 2009).Footnote 2
Attitude towards redistribution 1:
We then evaluated participants’ attitude towards 3 redistribution schemes, using hypothetical scenarios (as in Konow, 2001; see the Supplement, section 4.4 for the presentation). In these scenarios, two individuals are on a desert island with only bananas to eat, which they can get through effort (climbing up the tree) or luck (picking the fallen ones). At the end of each day, they keep their own bananas (libertarian scheme), or they share them equally (egalitarian scheme), or they share equally the ones obtained through luck and keep for themselves the ones obtained through effort (social-liberal scheme). Each participant responded to 5 scenarios differing in the number of bananas obtained through luck or effort for the two individuals (see the Supplement, Section 5 for the values used in each scenario). For each scenario, participants could see the initial numbers as well as the outcomes of the 3 sharing schemes, and they had to rate these outcomes on a fairness scale from 1 (totally unfair) to 7 (totally fair). The average rating over the 5 scenarios was considered as a measure for each scheme.
Attitude towards redistribution 2:
Participants were asked to rate on a 10-point scale whether in society, income should be more egalitarian, or if individual efforts should rather be promoted. This measure of a preference for incentivized income was taken from an opinion survey conducted by the French Ministry of Social Affairs and Health (“Baromètre d’opinion de la DREES”, see question 1 in the Supplement, section 4.5). Finally, participants were asked if the decisions they took in this experiment were representative of the decisions they would take in everyday life.
2.5 Payment
At the end of the experiment, the computer chose randomly if the participant would be paid according to the real effort task (with a probability of 1/3), or according to the revealed beliefs task, on their belief about being in the easy condition (with probability 1/3) or on their belief about being better than others in their condition (with probability 1/3). If the real task, the disinterested dictator game or one of the 2 interested dictator games was randomly drawn and implemented, and the final payoff reflected the participants’ performance plus or minus the transfer imposed by the dictator. If the latter, payment was determined based on a BDM mechanism, detailed in the Supplement 4.2 and 4.3. The exchange rate was 5 tokens for 1 euros.
2.6 Analyses
We analyzed our data using the statistical software R (R Core Team, 2020), using mostly Student tests and Pearson correlations (in these cases, using Wilcoxon tests and Spearman correlations led to identical results). Tests were two-tailed.
3 Results
3.1 Overview
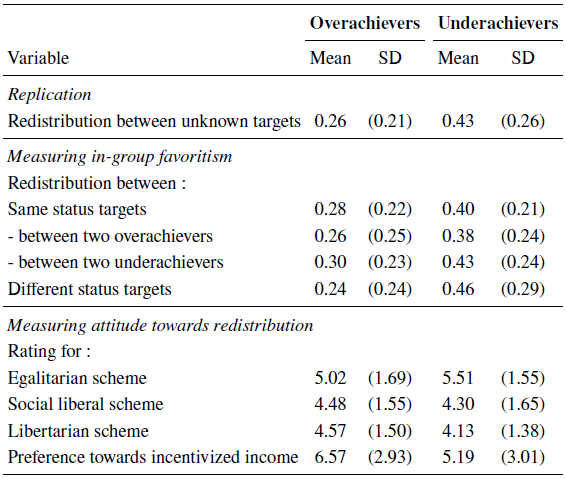
This section is organized as follows. We first report the replication of the original findings of DET2016, that manipulating status between participants (i.e., identifying them as overachievers vs. underachievers) affects redistribution choices. Then, we evaluate our introduced measures of favoritism towards one’s own group, and of attitudes towards redistribution schemes, to test whether these other factors could also explain the changes in redistribution with status. The different variables involved are presented in Table 1, aggregated for overachievers and underachievers separately.
3.2 Replicating the effect of status on redistribution choices
Evaluating the effect of the status manipulation (Table 1), we found that underachievers redistributed more than overachievers in the disinterested dictator game (t(135.784) = −4.122, p < .001). The manipulation of status successfully replicated the main finding of DET2016.
3.3 Can in-group favoritism explain redistribution choices?
One factor that may play a role in the status manipulation is the sense of belonging to a group it could induce, which may in turn affect redistribution choices. This was investigated by letting participants know the status of the targets, in additional dictator games. The targets could be two overachievers, two underachievers, or one of each status.
We focused first on the cases where the targets had the same status, and conducted an ANOVA on redistribution choices with participant’s status (overachiever vs. underachiever) and targets’ status (both overachievers vs. both underachievers) as within-participant factors.
Redistribution was affected not only by the participant’s status (F(1,142) = 11.48, p<.001) but also by the targets’ status (F(1,142) = 5.94, p = .016). Specifically, underachievers redistributed more than overachievers, as was also found when statuses were unknown, but redistribution was also higher between two underachievers than between two overachievers (see Table 1). This additional effect suggests that inequalities in earnings matter less to an external observer when it affects two rich individuals than when it affects two poor individuals. This observation corresponds to the “principles of diminishing transfers” in the perception of inequalities (Reference KolmKolm, 1976). Given that no interaction between these two factors was found (F(1,142) = 0.20, p = .655), in our next analysis we took the average of the two ‘same-status’ cases.
In-group favoritism should enhance the difference between overachievers and underachievers when targets have different statuses, relative to the ‘same-status’ case. This is because in the ‘different status’ case, participants are given an opportunity to redistribute wealth from an overachiever target to an underachiever target, so in-group favoritism would push underachievers to redistribute more (which would benefit their fellow underachiever) and overachievers to redistribute less. By contrast, in the ‘same status’ case, redistribution towards the poorer is not associated with an in-group bias, as both targets are in the same group. This was the case on average across participants (see Table 1), and an ANOVA predicting redistribution choices from participant’s status (overachiever vs. underachiever) and targets’ status (same vs. different) indeed indicated a significant interaction between the two factors (F(1,142) = 5.72, p = 0.018), in addition to the main effect of participants’ status ( (F(1,142) = 24.79, p<.001). In other words, when participants were explicitly informed about the statuses of the two targets, their redistribution choices exhibit some in-group favoritism: they were particularly prone to redistribute when they themselves were underachievers and when the redistribution would benefit another underachiever at the expense of an overachiever (the .46 in Table 1, for “Different status targets”).
This analysis suggests that in-group favoritism may have played a role also when the groups of the two targets were unknown (but could be implicitly inferred from the observed wealth inequality), as in the original game. To evaluate this possibility, we calculated an individual score of in-group favoritism, as the redistribution in the ‘different status’ case minus in the ‘same status’ case, for each participant. This score was positive for underachievers and negative for overachievers, and across the cohort it was correlated with redistribution choices in the disinterested dictator game (r = 0.23, p = .006). However, this correlation was not merely driven by the status manipulation. Indeed, after subtracting the effect of status for both variables (again, by looking at the residuals in the regression of redistribution or in-group favoritism against status), the correlation in the residuals (see Figure 2) was still significant (r = 0.18, p = .034). A mediation analysis indicated that 9.5% of the total effect of status was mediated by in-group favoritism (p = .050).
In-group favoritism and redistribution. The favoritism score is evaluated in disinterested dictator games where the status of the two targets is known to the participant playing the dictator. The residuals of favoritism and redistribution (after taking the effect of status) are plotted against each other. Each dot is a participant (N=144). The blue line and confidence intervals indicate the regression of the redistribution residual against the residual for in-group favoritism score.

3.4 Can attitude towards redistribution explain redistribution choices?
Our paradigm also included measures of participants’ attitudes towards redistribution, as we anticipated that the status manipulation may affect fairness ratings about redistribution schemes. First, we asked participants to rate how fair redistributions were, which were based on an egalitarian, a social-liberal, or a libertarian scheme. An ANOVA on these ratings indicated no effect of status (F(1,142) = .12, p = .73), but a main effect of scheme (F(2,284) = 13.91, p<.001) and an interaction between participant’s status and the type of scheme (F(2,284) = 3.02, p = .050). When examining both groups in separate ANOVAs, we found a large variation of ratings between schemes for underachievers (F(2,142) = 15.10, p<.001), with higher ratings to the egalitarian scheme and lower ratings to the social-liberal and libertarian schemes (see Table 1), which was much reduced for overachievers, becoming statistically non-significant (F(2,142) = 2.11, p = .125).
Second, we asked participants to rate their opinion regarding egalitarian vs. incentivized incomes, using an item from an official survey (see Methods). Here again, overachievers endorsed more “individual incentives” whereas underachievers endorsed more “egalitarian incomes” (“preference towards incentivized income” in Table 1), resulting in a significant effect of status (t(141.897) = 2.78, p = .006). Besides, this opinion measure was correlated positively with the ratings of social-liberal (r = .22, p = .008) and libertarian (r = .36, p<.001) schemes, and negatively with ratings of the egalitarian scheme (r = −.40, p<.001), as expected. In sum, manipulating status affected attitude towards redistribution. These findings echo those of DET2016 who report that in a redistribution demand game, the social-liberal scheme receives more support from overachievers whereas the egalitarian scheme receives more support from underachievers.
We then examined whether this attitude change might have driven the redistribution choices in the disinterested dictator game. The preference for “incentivized incomes” in the survey question was indeed correlated negatively with redistributions (r = −.30, p = .001). This correlation remained even when the effect of status was subtracted from both variables (r = −.24, p = .003), as illustrated on Figure 3. A mediation analysis further estimated that 16.1% of the total effect of status was mediated by the change in attitudes, as measured by this opinion question (p = .007). Using the difference in ratings between libertarian and egalitarian schemes as a measure of attitude (instead of the survey question) yielded equivalent results in these analyses.
Preference for incentives and redistribution. The “incentives preference” score corresponds to the participant’s answer to an opinion survey question pitting preferences towards egalitarian incomes (lower values) against preferences towards incentivized incomes (higher values). The residuals of this incentives preference measure and of the redistribution (after taking the effect of status) are plotted against each other. Each dot is a participant (N=144). The blue line and confidence intervals indicate the regression of the redistribution residual against the residual for the incentives preference score.

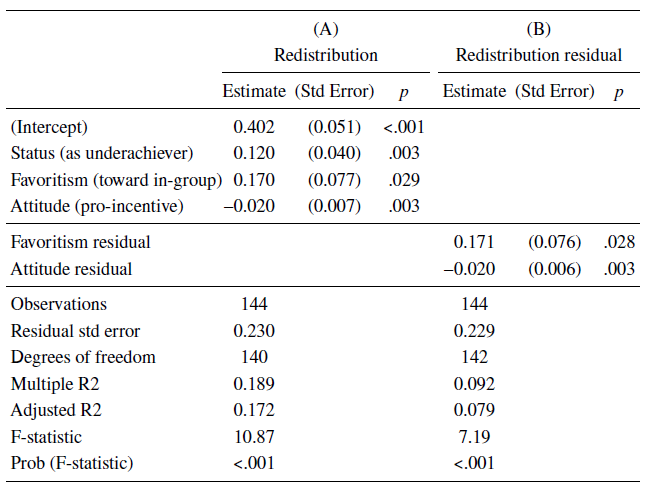
3.5 A combined analysis of redistribution causes
Our previous analyses indicated that redistribution choices in the dictator game could be explained by in-group favoritism and by attitudes towards incentivized vs. egalitarian incomes. Our final analysis aimed at evaluating whether these measures may explain separate shares of the variance. First, we note that the correlation between these two predictors was essentially zero (−.04). We then included the two measures, together with the status effect, in a linear regression to predict redistribution. This analysis indicated that status, attitude, and in-group favoritism were significant predictors of redistribution behavior in this regression (Table 2A). Furthermore, to ensure that these results were not misestimated due to the effect of status on the other variables, we conducted an additional regression on the residuals, after the main effect of status was subtracted from each variable. This regression on these residuals confirmed the previous results (Table 2B).Footnote 3
4 Discussion
In a recent study, Deffains, Espinosa and Thöni (2016) emphasized that a self-serving bias by which individuals may take credit for positive events and attribute negative events to bad luck, could explain the link between economic status and support for redistribution. However, they provided only indirect evidence in support of this claim. Indeed, they found that an exogenous manipulation of economic status affects both redistribution choices and beliefs about the role of effort vs. luck (i.e., fatalism) in the task, but the link between these two effects was not documented. Here, we replicated the effect of the manipulation on support of redistribution. We also examined another possible determinant of redistribution support: in-group favoritism or self-serving adjustment of justice principles. Our data offered clear evidence in favor of these two mechanisms.
We must remain cautious regarding the relation (or lack thereof) between fatalism and redistribution. Our attempts to measure fatalism were indirect, possibly unreliable, and possibly invalid, as we discuss in footnotes 1 and 3. Clearly the role of fatalism merits further research. We thus focus here on the positive findings that the status manipulation may have affected redistribution via group favoritism and via self-serving justice principles.
Indeed, besides self-serving beliefs, we also evaluated two additional mechanisms that might play a role in this effect of status on redistribution. One mechanism involved a bias towards one’s own group. Our experimental approach confirmed that in-group favoritism was present in our data (as was also found in e.g., Reference Cassar and KleinCassar & Klein, 2019). Furthermore, by examining more specifically the relation between in-group favoritism and redistribution after accounting for the effect of status, we found that in-group favoritism does contribute to redistribution choices. Note this was the case even though the status of the targets was not made explicit to participants in this redistribution phase – although it could be inferred. This generality of the effect of in-group favoritism is interesting in itself. Indeed, it might suggest that the benefits that can be obtained by building a sense of belonging to a common group (e.g., increased solidarity) might spill over to individuals for which the status is not explicitly stated.
The other candidate mechanism that was investigated involved fairness principles. Specifically, we reasoned that the status manipulation might affect not only beliefs about the task but also fairness principles regarding redistribution and inequalities, which in turn would affect redistribution choices. Critically, we found that ratings of redistribution schemes, which may indicate fairness principles held by individuals (Reference KonowKonow, 2001), and opinion towards incentives as measured in a general survey, were indeed affected by status. This attitude towards economic inequalities partially explained the effect of economic status on redistribution in our data. One possible reason for this distortion in fairness principles could be to align these principles with self-interest so as to reduce cognitive dissonance (Reference KonowKonow, 2000). In other words, fairness principles appear to be subject to self-serving adjustments: when becoming rich, it is convenient to become also more tolerant to inequalities.
These results shed light on a phenomenon that is often overlooked: fairness principles are not cast in stone but can be easily manipulated. This malleability is an important issue for theories and for practical applications of distributive justice. Without a clear consensus in society about the principles of justice and about the causes of inequality, it is likely that the application of distributive justice rules could be a source of conflicts. The observation that fairness principle can be adjusted easily is both good news and bad news. On the one hand, flexibility should allow individuals to engage in a discussion and move towards each other and find common ground. On the other hand, though, it makes this common ground more fragile.
One important issue that we did not address in the present paper is the longevity or reversibility of the effect of status. How fast can participants be led to adopt a new justice principle, and for how long? Of course, these effects may also depend on the specific features of the manipulation of status. Empirically, this could be done by calling again subjects after a few days or weeks to assess the consistency of their redistribution choices and redistribution preferences. Although this was not envisioned when the present study was conducted, it is obviously a question of important practical application for the design of interventions. One may take this issue one step further and speculate on whether the change of justice principles that might follow an economic shock, be it positive or negative such as a period of growth or of unemployment, can be transmitted between generations, as part of Bourdieu’s social reproduction.
Previous research has shown that individuals support for redistributive policies can be changed, through important life events such as unemployement (Reference Barr, Miller and UbedaBarr, Miller & Ubeda, 2016), but also through simple experimental manipulations of status as in the present study.
Understanding the psychological mechanisms underlying such changes is crucial as it will drive the modes of intervention that could be implemented to reconcile individuals’ preferences in society and find a level of redistribution that satisfies the majority of individuals. For example, to debias perception about the source of inequalities, one may display information about the relative importance of luck and effort in the determination of socio-economic status. A recent study implemented this intervention, and found that the effect of status on redistribution can be reduced if participants are informed beforehand about the fully random process regarding status allocation, but not so much if this information is presented after the status (Espinosa, Deffains & Thöni, 2020).
Other interventions could target in-group favoritism or attitudes towards inequalities and redistribution principles. On the one hand, one could aim at making individuals converge on a common principle, possibly by encouraging them to view others as members of their own group, or by asking individuals to imagine what others with a different economic experience might deem fair. Along these lines, one may rely on a thought-experiment manipulation where participants are asked to make a choice while imagining that they are not aware of their own status (i.e. as if they were under a “veil of ignorance”). Such manipulations have been shown to reduce self-serving biases, e.g., regarding the allocation of ventilators to younger and older patients facing COVID-19 (Huang et al., 2021; see also Kriss et al., 2011, for additional evidence on how to reduce self-serving bias through veil of ignorance). On the other hand, one could aim at protecting a consensus within a society, for instance by committing to a shared principle before economic experiences of success or failure may bring individuals apart. Further research would be needed to implement and evaluate such interventions empirically.


 Open access