

Social media summary
The EU's Common Agriculture Policy indicators are not well aligned to deliver the Sustainable Development Goals.
1. Introduction
The 17 United Nations (UN) Sustainable Development Goals (SDGs) (UN, 2015) represent the agreed international agenda for society, economy and the environment (Biermann et al., Reference Biermann, Kanie and Kim2017). However, the SDGs are aspirational with no ‘hard’ obligations for their implementation (Persson et al., Reference Persson, Weitz and Nilsson2016), so their successful achievement depends upon UN Member States and other actors formalizing them in policies, plans and actions within existing administrative and governance settings (e.g., nations, cities, organizations). This requires the SDGs to be regionally and nationally contextualized (UN, 2015) and new or existing policy instruments to be aligned with the goals set out in the SDGs (Lafortune & Schmidt-Traub, Reference Lafortune and Schmidt-Traub2018; Stafford-Smith et al., Reference Stafford-Smith, Griggs, Gaffney, Ullah, Reyers, Kanie and O'Connell2016). Also required are holistic approaches to implementing the SDGs as a system of interacting components rather than as individual goals in isolation, in order to balance trade-offs (Nilsson et al., Reference Nilsson, Griggs and Visbeck2016; Pradhan et al., Reference Pradhan, Costa, Rybski, Lucht and Kropp2017).
The agricultural sector is particularly important for achieving the SDGs because of the many benefits it provides that must be balanced against potential social and environmental harms caused by agriculture (Campbell et al., Reference Campbell, Hansen, Rioux, Twomlow and Wollenberg2018; DeClerck et al., Reference DeClerck, Jones, Attwood, Bossio, Girvetz, Chaplin-Kramer and Zhang2016; Foley et al., Reference Foley, DeFries, Asner, Barford, Bonan, Carpenter and Gibbs2005; Herrero et al., Reference Herrero, Thornton, Gerber and Reid2009; Rasmussen et al., Reference Rasmussen, Coolsaet, Martin, Mertz, Pascual, Corbera and Ryan2018). The Food and Agriculture Organization of the UN (FAO), as well as other scholars, have suggested that agriculture and agricultural policy can and should contribute to all 17 SDGs (Begashaw & Rockström, Reference Begashaw and Rockström2017; FAO, 2017, 2018). However, achieving these ambitious goals will depend upon how policy-makers align existing or new agricultural policies with the SDGs and whether these policies are successfully implemented on the ground.
The Common Agricultural Policy (CAP) is the guiding agricultural policy throughout the European Union (EU) and is a potentially very powerful tool for guiding agriculture's contribution to the SDGs. Spending under the CAP has averaged €54 billion annually since 2006 (ECA, 2018) – constituting 38% of the EU's 2014–2020 budget (Pe'er et al., Reference Pe'er, Lakner, Müller, Passoni, Bontzorlos, Clough and Zinngrebe2017). The policy is divided into Pillar I, focusing on financial support to farming, and Pillar II, focusing on rural development programmes. The majority of CAP spending is through Pillar I, primarily direct support to farmers (almost 70% of total CAP spending in 2017; Pe'er et al., Reference Pe'er, Lakner, Müller, Passoni, Bontzorlos, Clough and Zinngrebe2017) and market measures (around 5% of spending in 2017; Pe'er et al., Reference Pe'er, Lakner, Müller, Passoni, Bontzorlos, Clough and Zinngrebe2017), alongside horizontal aspects (non-financial polices to ensure agricultural practices comply with other EU sectoral policies, such as the Nitrates Directive). About 25% of total CAP spending in 2017 went to rural development through Pillar II (Pe'er et al., Reference Pe'er, Lakner, Müller, Passoni, Bontzorlos, Clough and Zinngrebe2017). The CAP will be reformed after 2020, and the European Commission (EC) has stated that the future CAP “has a pivotal role to ensure the EU will deliver on the SDGs” (EC, 2018b, p. 72).
The questions of whether and how the CAP and other sectoral policies will contribute to the SDGs is of urgent importance for the EU because of its commitment to being a world leader in achieving the SDGs (EESC, 2017). The EC endorsed the SDGs and therefore is obliged to deliver on the goals in line with the EU requirements to respect international agreements under the Treaty on the Functioning of the European Union. A recent report exposing EU policy gaps for the SDGs (Lafortune & Schmidt-Traub, Reference Lafortune and Schmidt-Traub2018) found that the two greatest limitations to the EU SDG monitoring framework are the absence of clear 2030 targets to be met and the lack of measures to address spill-over effects (unintended consequences in other regions or sectors; see also Matthews, Reference Matthews2018). The report also recommended better integration of the SDGs into existing EU policy instruments, as well as closer connections between SDG monitoring and the policy-making process (Lafortune & Schmidt-Traub, Reference Lafortune and Schmidt-Traub2018). A separate fitness check of the CAP (Pe'er et al., Reference Pe'er, Lakner, Müller, Passoni, Bontzorlos, Clough and Zinngrebe2017) revealed limited internal and external coherence of the policy's objectives, as well as a lack of adequate indicators for evaluating the contribution of policy instruments to overall objectives. The fitness check also concluded that the CAP does not address 12 of the 17 SDGs (Pe'er et al., Reference Pe'er, Lakner, Müller, Passoni, Bontzorlos, Clough and Zinngrebe2017, Reference Pe'er, Zinngrebe, Moreira, Sirami, Schindler, Müller and Bonn2019), but this methodology was based on expert opinions rather than transparent, objective evidence.
Here, we quantitatively evaluate how the current CAP aligns with the SDGs in the EU using existing policy indicators (measurable observations of the current status and trend over time of a desired goal; see also Reyers et al., Reference Reyers, Stafford-Smith, Erb, Scholes and Selomane2017; UN, 2018). Indicators are central to the review and follow-up of the SDGs (Persson et al., Reference Persson, Weitz and Nilsson2016). The CAP has a comprehensive monitoring and evaluation framework based on indicators at different policy stages (i.e., stages in the process from describing the policy context, to setting objectives, to implementing actions and assessing results). Yet, the question of whether the CAP's existing monitoring and evaluation framework can assess and guide the policy's contribution to the SDGs remains unanswered. Here, we develop and implement a method to systematically, empirically and transparently assess how a policy aligns with the SDGs in terms of its indicator system, then we apply this method to the CAP across all policy stages. We analyse three guiding indicator sets for the CAP and SDGs, assessing: (1) which SDGs the CAP is currently aligned with; (2) which stages of the CAP policy-making process are currently best positioned to monitor progress towards the SDGs; and (3) how alignment with the SDGs differs between Pillar I and Pillar II of the CAP. Our approach identifies which SDGs are currently well covered and which ones are overlooked by EU agricultural policy indicators. We then discuss how the approach can support future quantification of the trade-offs and synergies within and across sectoral policies in order to support reaching the SDGs in practice.
2. Methods
2.1. Aligning agricultural indicators with the SDGs
We present a method to evaluate how existing indicators for monitoring and evaluating sectoral policies align with the SDGs. The first step is to identify the relevant indicator sets for (1) sustainability and (2) the sector and jurisdiction of interest, in this case agriculture in the EU, as recommended in the UN Development Programme's Rapid Integrated Assessment (UNDP, 2017). In order to study sustainability in the EU, we used the set of 100 EU SDG indicators (Eurostat, 2018b), which translate the global SDGs into a European context and are used by the EU to evaluate regional progress towards the SDGs.
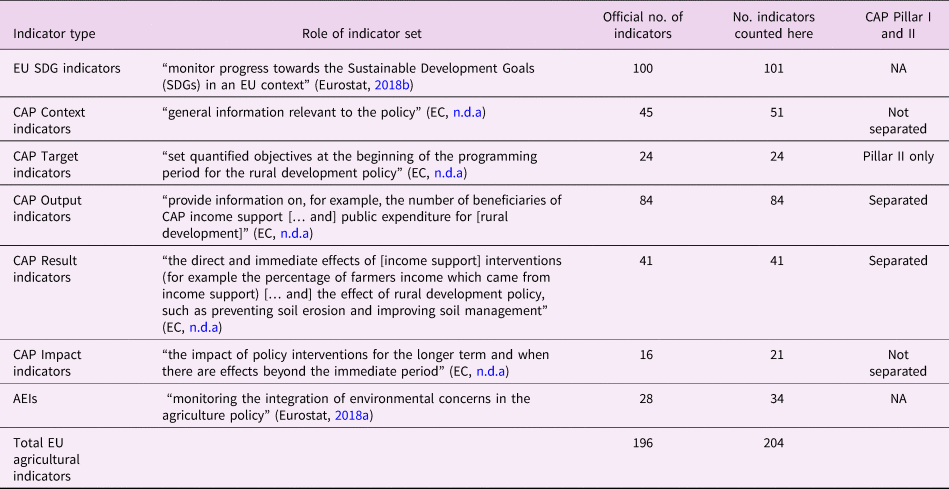
We identified two relevant policy indicator sets for the agricultural sector in the jurisdiction of the EU: (1) the CAP monitoring and evaluation indicators (EC, n.d.a); and (2) the Agri-Environmental Indicators (AEIs) (Eurostat, n.d.). The CAP monitoring and evaluation framework includes five types of indicators: Context, Target, Output, Result and Impact, some of which overlap (please see Supplementary Data File S1 for the full list of indicators). The AEIs represent a sixth type of indicator used in the CAP to address environmental concerns. The number of indicators in each set and their officially stated role are listed in Table 1.
The sustainability (European Union (EU) Sustainable Development Goal (SDG)) and agricultural (Common Agricultural Policy (CAP) and Agri-Environmental Indicators (AEIs)) indicator sets aligned and evaluated in this study.
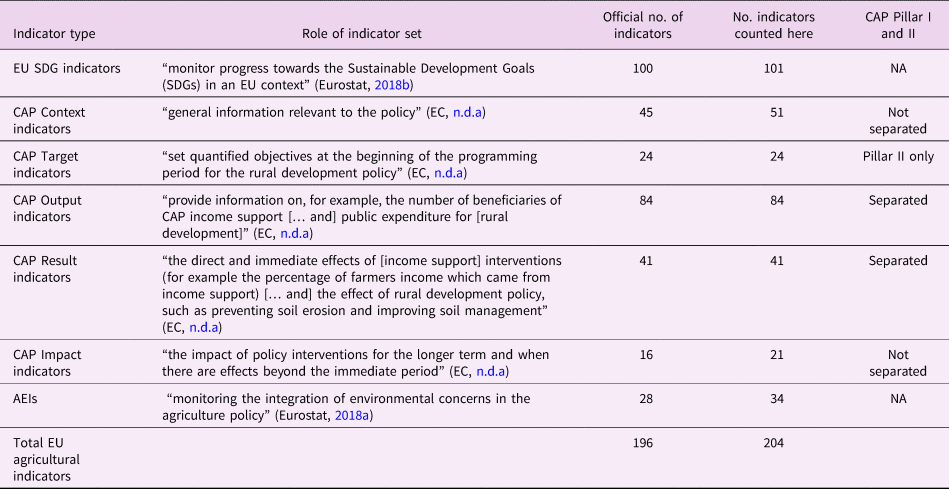
Number of indicators in each set is listed; where ‘indicators counted here’ is greater than the official number of indicators, we have judged their contribution to SDGs to be sufficiently varied to count sub-indicators separately throughout the remainder of the results (e.g., gross nutrient balance is counted as the two sub-indicators gross nitrogen balance and gross phosphorous balance); please see Supplementary Data File S1 for the full indicator list. Some CAP indicators and AEIs occur in multiple indicator sets but are only counted once in the total here. Finally, whether CAP indicator sets are separated for Pillar I and Pillar II of the policy is also shown.
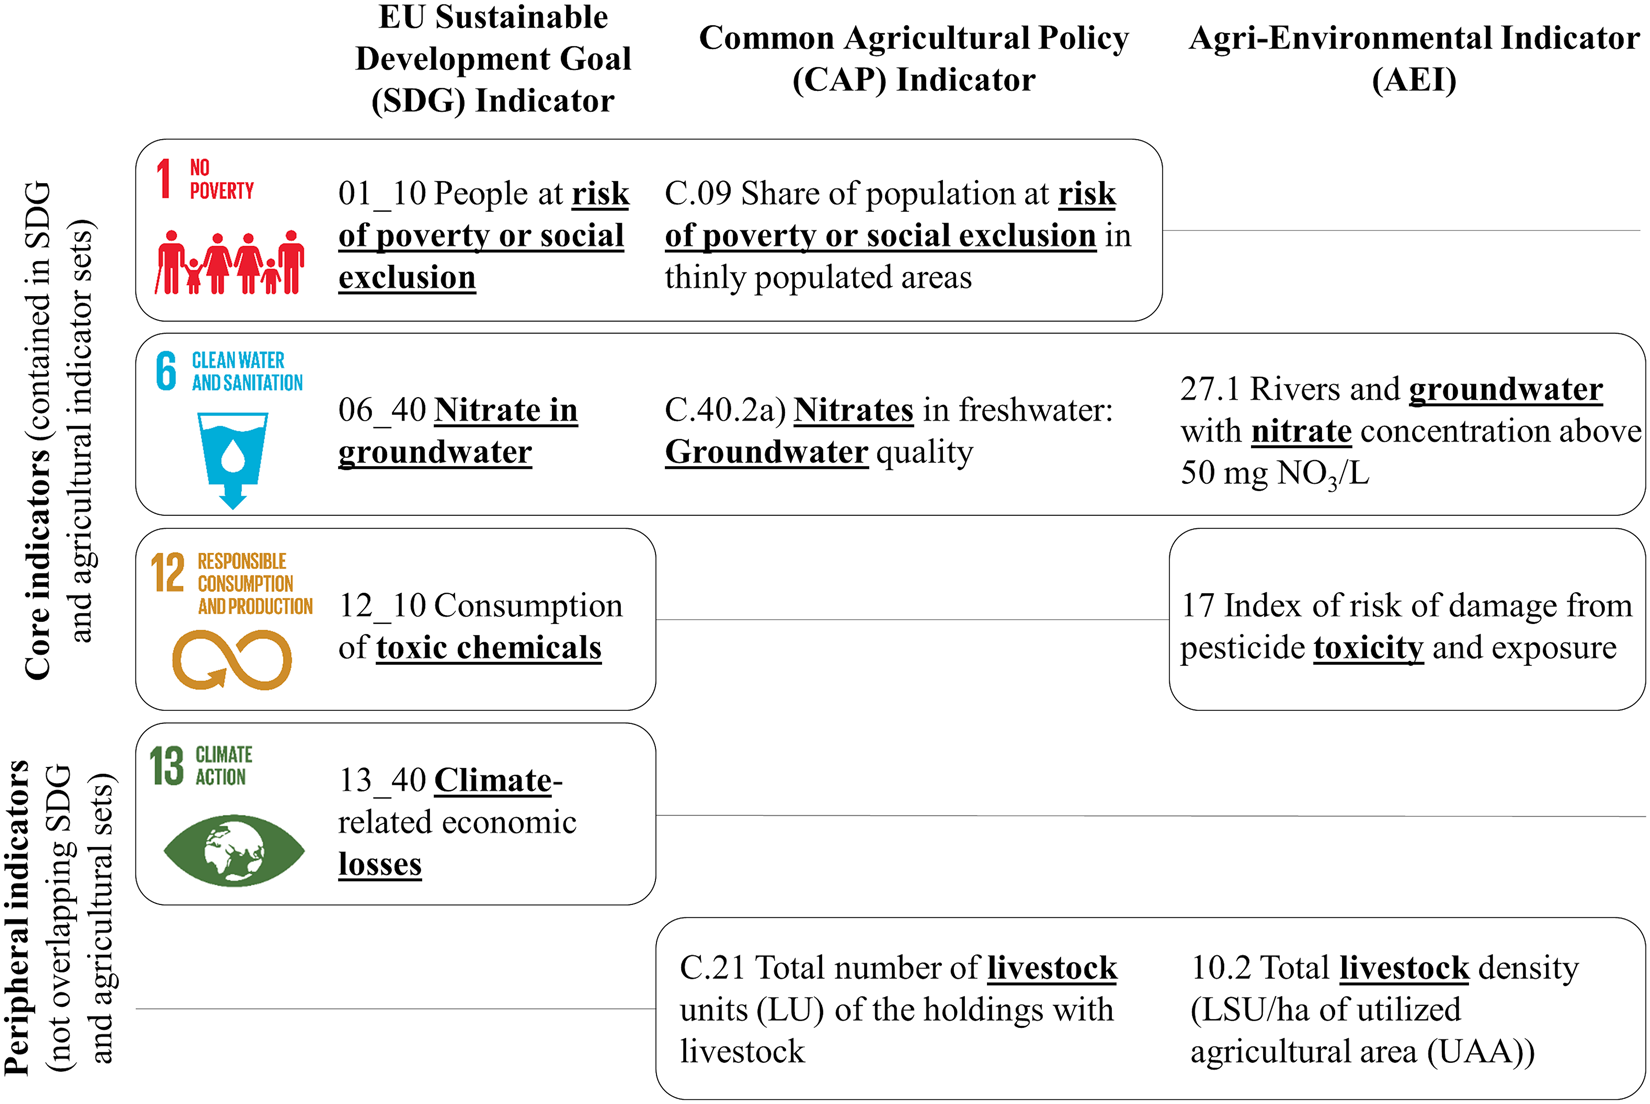
We align existing agricultural policy indicators with SDG indicators based on the wording of each indicator in the official policy document in which it is described. Because indicators are measured, they are generally more precisely defined in policy documents (e.g., ‘life expectancy at birth’) than more general goals (e.g., ‘achieve good health’), which reduces subjectivity in the alignment process. Following May et al. (Reference May, Sapotichne and Workman2006), we use keywords to identify the variable explicitly being measured by each indicator. Indicator sets are deemed to align for a particular indicator if the same keywords appear, indicating that the same variable is being measured in each set (Figure 1). Examples of variables measured by indicators include ‘risk of poverty or social exclusion’, ‘nitrate’, ‘GDP’, ‘population’ and ‘forest area’. We then counted the number of indicators for EU agriculture within each SDG by counting the number of aligned EU SDG indicators within each goal. Often multiple CAP indicators aligned with one EU SDG indicator, in which case the EU SDG indicator was counted as one core indicator for that SDG.
Agricultural indicator sets are aligned with the Sustainable Development Goals (SDGs) based on the system variables (bold, underlined) measured. Indicators are aligned based on keywords in the official documents defining and describing the measurement of each indicator. Examples are shown for Common Agricultural Policy (CAP) context indicators and Agri-Environmental Indicators (AEIs) for three SDGs where indicator sets align (first three rows), one SDG indicator that is not present in agricultural indicators (fourth row) and agricultural indicators that are not aligned with SDGs (final row).
Although policy indicator sets generally lay out the specific variables that are to be measured, their structure and format can require some interpretation. For example, the AEIs have a ‘main indicator’ (e.g., total livestock density) and several ‘supporting indicators’ (e.g., share of major livestock types in the total livestock population and grazing livestock density) for a particular variable (in this example livestock). We used the main indicator for alignment, except when we judged the contribution of supporting or sub-indicators to the SDGs to be sufficiently varied to merit considering it separately. For example, under the indicator ‘gross nutrient balance on agricultural land’, which occurs as some variant in the EU SDG indicators, CAP indicators and AEIs, we counted the sub-indicators of ‘gross nitrogen balance’ and ‘gross phosphorus balance’ separately. This decision was made because these nutrients act very differently in different settings (Conley et al., Reference Conley, Paerl, Howarth, Boesch, Seitzinger, Havens and Likens2009; e.g., if N is reduced to mediate marine eutrophication and phytoplankton blooms but excess P is ignored and causes lake cyanobacterial blooms even under low N availability), resulting in different policy implications. Similarly, sub-indicators of nitrate pollution in surface water (from the two agricultural sets) and in groundwater (from the EU SDG indicators) were treated separately during the alignment. The complete list of all indicators from the EU SDG indicator set, CAP indicator set and AEI set and their alignment is provided in Supplementary Data File S1.
2.2. Monitoring progress towards SDGs across CAP policy-making stages
We used an adaptation of the policy coherence framework of Nilsson et al. (Reference Nilsson, Zamparutti, Petersen, Nykvist, Rudberg and McGuinn2012) to map existing agricultural indicators to SDGs at different stages of the policy-making process (Figure 2), making it possible to identify stages where the CAP does or does not align with the SDGs. By ‘stages’, we mean points along the policy cycle from describing the policy context, through setting objectives, to implementing actions and assessing results (Table 2). We positioned the CAP indicators at different stages of policy-making based on their officially stated purpose (Table 1), regardless of whether they achieve that purpose in practice.
Five stages of the policy process (shown in capital letters) within which we aligned the relevant European Union agricultural indicator sets (shown in italics). Agri-Environmental Indicators are relevant throughout the policy process and are thus shown in the centre. Descriptions of each stage, following the policy coherence framework of Nilsson et al. (Reference Nilsson, Zamparutti, Petersen, Nykvist, Rudberg and McGuinn2012), and examples of indicators are given in Table 2. CAP = Common Agricultural Policy.
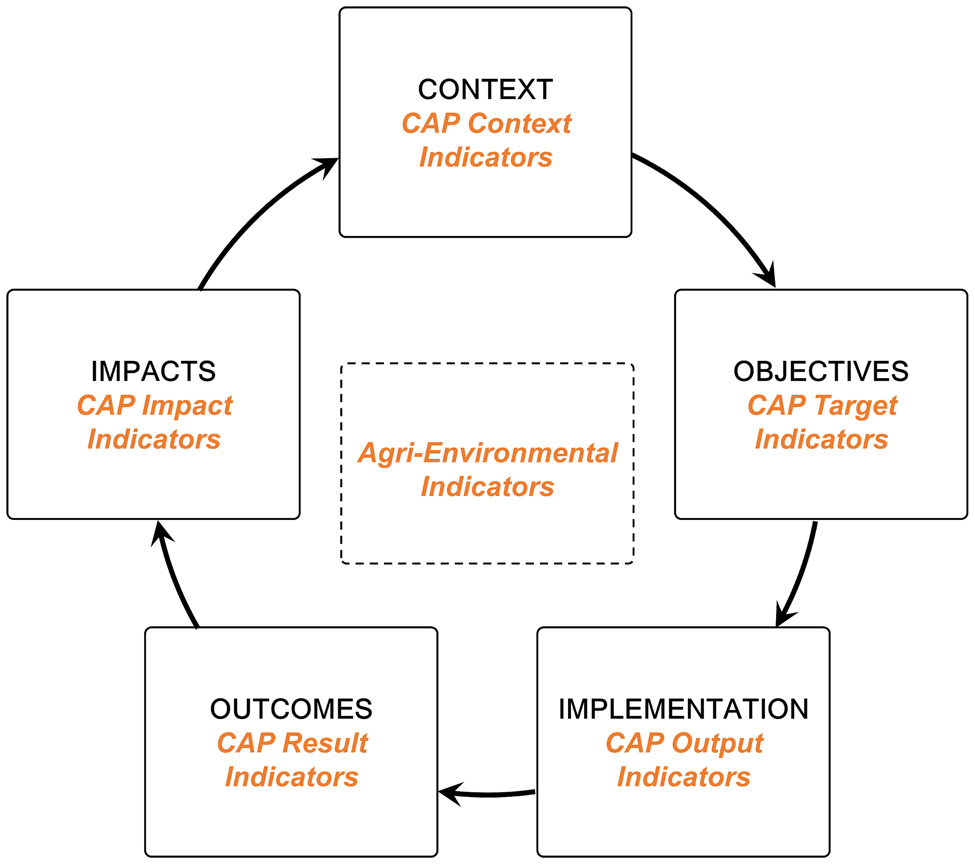
Framework for stages of the policy-making process used to assess which agricultural indicator sets align with the Sustainable Development Goals at particular stages of policy-making.
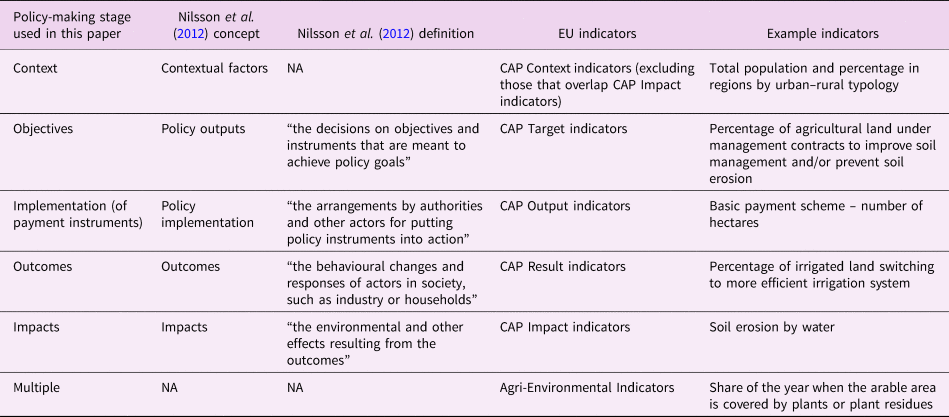
Concepts and definitions for policy stages originate from the policy coherence framework by Nilsson et al. (Reference Nilsson, Zamparutti, Petersen, Nykvist, Rudberg and McGuinn2012). We have aligned the EU CAP indicators used by policy-makers to monitor and assess the CAP to one of each of the five stages, illustrated with examples. Agri-Environmental Indicators are not specified for different stages of the policy-making process and so are kept separate. Please see Supplementary Data File S1 for the full indicator list.
CAP = Common Agricultural Policy; EU = European Union.
We placed the CAP Context and Impact indicators at the beginning and end of (one cycle of) the framework, respectively. Eighteen Context indicators are also Impact indicators (Supplementary Data File S1), which highlights how impacts from past policies influence the context of future policy iterations. The CAP Target indicators are meant to be “used to set quantified objectives at the beginning of the programming period for the rural development policy” (EC, n.d.a; i.e., for Pillar II of the CAP), so we position those in the objectives box (Figure 2 & Table 2). The CAP Output indicators monitor the number of beneficiaries and the amount of expenditure under each of the CAP measures and priority areas corresponding to the implementation of policy instruments. The CAP Result indicators monitor the outcomes of policy implementation through changes in management practices (e.g., the allocation of agricultural land under contract to improve water management). Finally, the AEIs are based on the DPSIR (Driving forces–Pressures–States–Impacts–Responses) framework, falling along several stages of policy-making, but mainly in policy outcomes (e.g., area under conservation or zero tillage) and impacts (e.g., soil erosion). Indicators from each set do not always fit into the same part of the policy-making framework (e.g., some Context indicators are also Impact indicators), but these general alignments reflect the purpose of the indicators and the policy stage definitions of Nilsson et al. (Reference Nilsson, Zamparutti, Petersen, Nykvist, Rudberg and McGuinn2012).
2.3. Assessing indicator alignment with SDGs across the two pillars of the CAP
Different sets of indicators are used for the two pillars of the CAP. In order to determine how CAP direct support, market measures and horizontal aspects (Pillar I) compare to the rural development programme (Pillar II) in terms of alignment with the SDGs, we aligned CAP indicators with the EU SDG indicators separately for Pillar I and Pillar II using the keyword alignment from policy documents approach shown in Figure 1. The CAP Target, Output and Result indicators are defined specifically for each pillar and were analysed in this section, whereas the CAP Context and Impact indicators are defined for the entire CAP and not separated between pillars (see Table 1). Furthermore, Target indicators only exist for Pillar II of the CAP. We did not further disaggregate our analysis into instruments within pillars (e.g., direct support versus market measures in Pillar I).
3. Results
3.1. Alignment of agricultural indicators with the SDGs
By following the process of indicator alignment shown in Figure 1, we found that 29 of the 100 EU SDG indicators were covered by at least one relevant EU agricultural indicator (CAP and/or AEI). We interpret these 29 existing policy indicators as core to the agricultural sector's contribution to the SDGs in the EU (Figure 3); however, the results highlight that over 70% of EU SDG indicators are not covered by current agricultural indicators. Fourteen of the 29 core aligned indicators were environmental (e.g., the farmland bird index, greenhouse gas emissions and soil and water resource indicators), while 15 were socioeconomic (e.g., agricultural income, training of farm managers and employment rates).
Distribution of 29 existing European Union (EU) agricultural policy indicators core to achieving the Sustainable Development Goals (SDGs). Radiating bars in the inner pie represent the number of agricultural indicators (Common Agricultural Policy (CAP) or Agri-Environmental Indicators (AEIs)) aligned with EU SDG indicators; indicator names are summarized in boxes. The inner edge of the outer circle represents the total number of EU SDG indicators within each goal (100 in total; 5 each for SDGs 14 and 17 and 6 each for all others); white space represents EU SDG indicators not aligned with agricultural indicators. Please see Supplementary Data File S1 for the full indicator list, including where multiple CAP indicators align with a single EU SDG indicator.
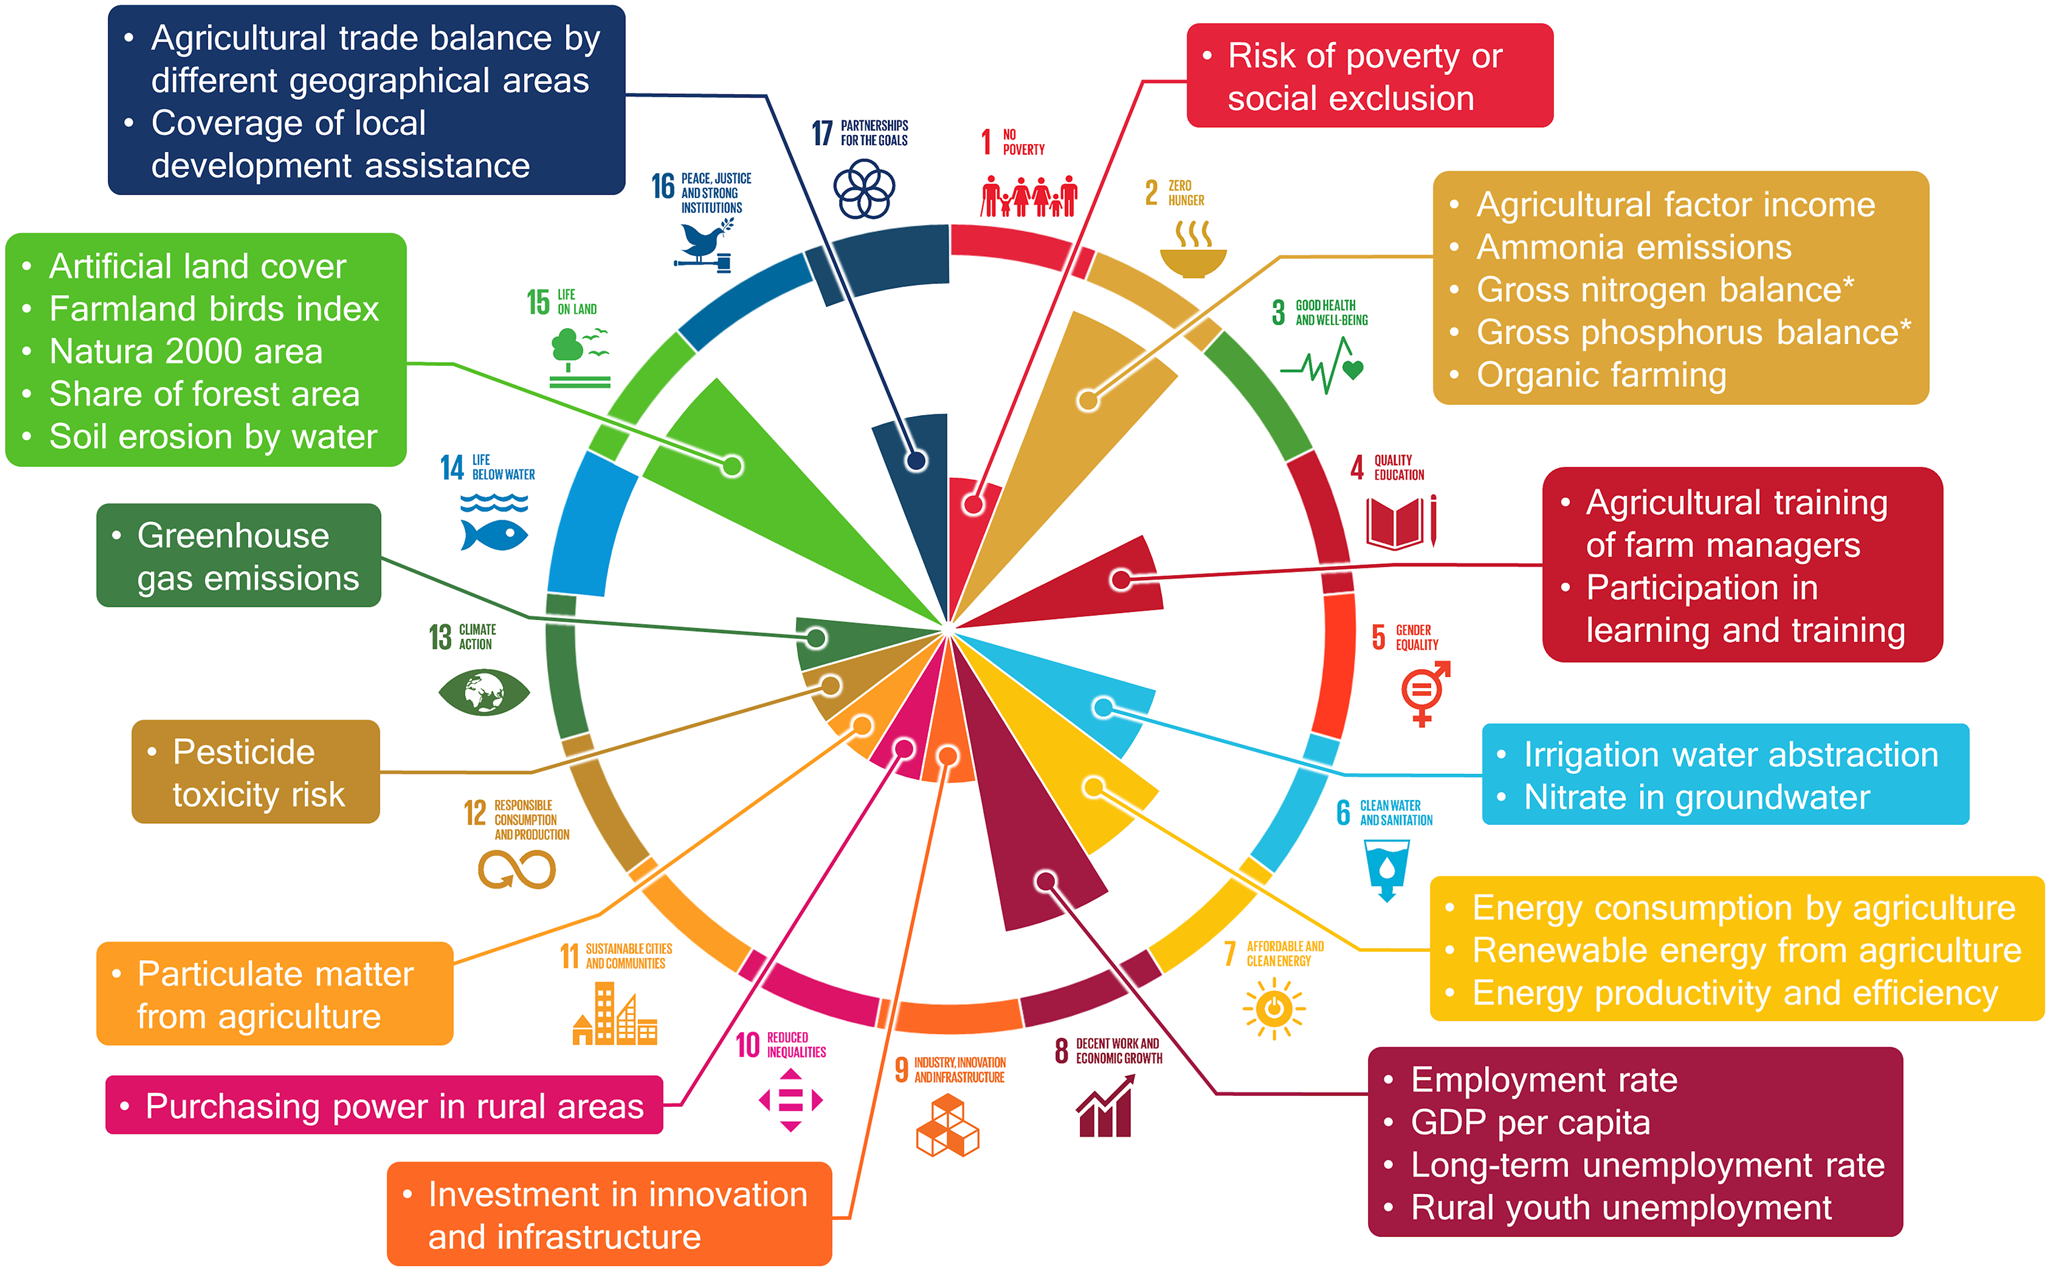
Analysis of the 29 core indicators shows that five relate to zero hunger (SDG 2, which also focuses on sustainable agricultural production) and life on land (SDG 15) and four relate to decent work and economic growth (SDG 8) (Figure 3). We interpret these as the main three SDGs that the CAP monitoring and evaluation framework is currently well positioned to assess. A secondary focus is on energy (SDG 7), which has three core indicators, and education (SDG 4), water (SDG 6) and partnerships (SDG 17), which each have two core indicators (Figure 3). Overall, 13 of the 17 SDGs contain at least one core agricultural indicator in the EU (Figure 3). However, four of the SDGs – health (SDG 3), gender (SDG 5), oceans (SDG 14) and institutions (SDG 16) – are not directly covered by any existing agricultural indicators (Figure 3 & Supplementary Data File S1). Conversely, there are existing EU sustainability indicators that are currently not measured by any of the agricultural indicators, but that appear to be relevant for agriculture, including phosphate in rivers (SDG 6), climate-related economic losses (SDG 13) and (rural) health and well-being (SDG 3) (see Supplementary Data File S1 for the full list of EU SDG indicators).
3.2. Indicator alignment with SDGs across CAP policy-making stages
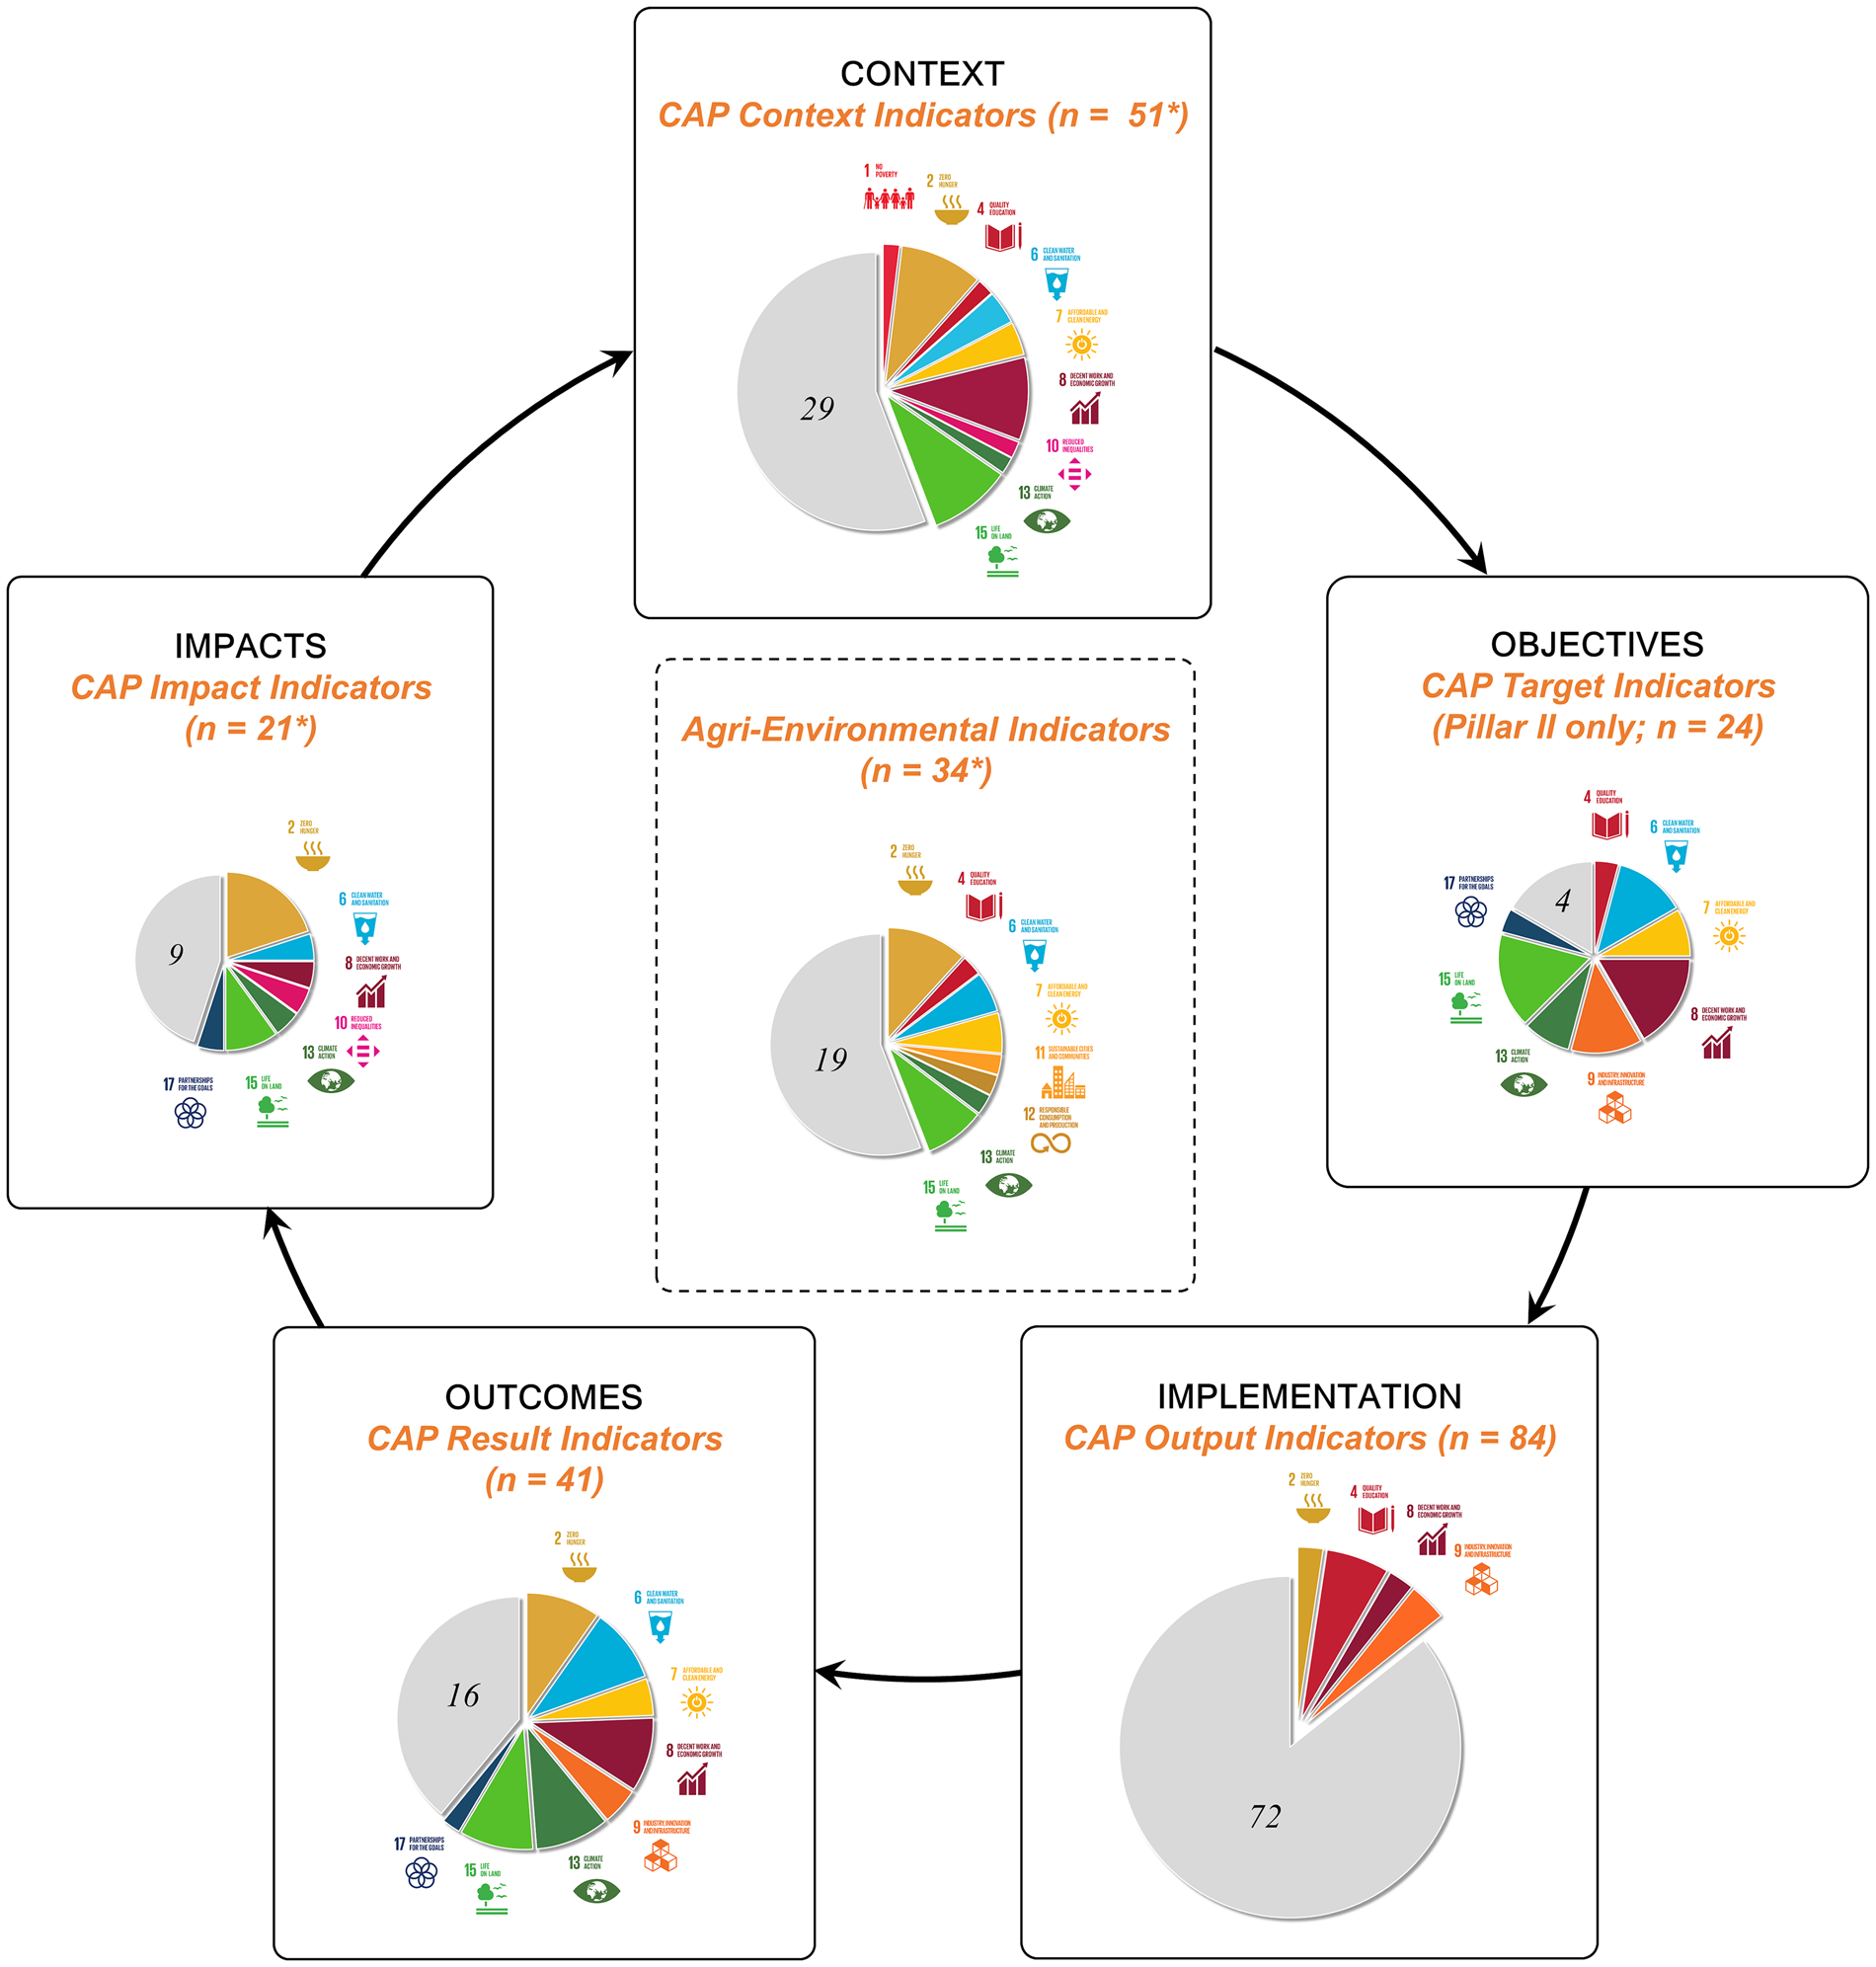
In total, out of 204 unique agricultural indicators (not double counting those in multiple indicator sets), 79 (39%) were aligned with an SDG. We found a wide variation in alignment between CAP indicators and SDGs at different policy stages (Figure 4). This means that the CAP's potential to contribute to the SDGs currently is not optimized across stages and varies greatly between stages from setting objectives to implementing instruments and monitoring outcomes and impacts. At the start of the process, in the context policy stage, specific policy processes are undertaken (such as the post-2020 reform of the CAP) to establish the general goals of the CAP. Here, the CAP Context indicators align with the greatest number of SDGs (n = 9 out of 17). In the next stage, these goals are operationalized into objectives, represented by the CAP Target indicators, which have the greatest proportion of indicators explicitly aligning with the SDGs (83%). However, the CAP does not actually specify values for these indicators that should be met by a certain time, and no Target indicators exist at all for Pillar I of the CAP (Supplementary Data File S1). The payment instruments of the CAP are used to achieve the implementation stage, where the CAP Output indicators – which monitor, for example, the number of beneficiaries and the area or population covered under different funding measures – only align with four SDGs, and 86% do not explicitly align with any EU SDG indicator (Figure 4 & Supplementary Data File S1). Following the implementation of policy instruments, the outcome stage of behavioural responses is measured by the CAP Result indicators, leading to the final stage of social and environmental impacts. The CAP Result and Impact indicators, as well as the AEIs, each have between 44% and 61% alignment with the SDGs and cover 7 or 8 of the 17 goals, meaning that approximately half of the policy outcomes and impacts relevant for the current CAP also address the SDGs.
Aligning six sets of agricultural indicators (names in orange italics) used to monitor and evaluate the European Union's (EU) Common Agricultural Policy (CAP) with EU Sustainable Development Goals (SDGs) across stages in the policy-making process for the CAP. The structure of the policy process is adapted from Nilsson et al.'s (Reference Nilsson, Zamparutti, Petersen, Nykvist, Rudberg and McGuinn2012) policy coherence framework (stage names capitalized for each box) and described in Table 2 and Figure 2. Pie charts are scaled to the number of indicators within each set (*see Table 1) and pie segments relate to the number of indicators that were explicitly aligned to EU SDG indicators. Grey pie sections indicate the proportion of indicators from each set that did not align with any EU SDG indicators, which are often highly CAP-specific indicators. Agri-Environmental Indicators are not specified for different stages of the policy-making process and so are kept separate. Please see Supplementary Data File S1 for the full indicator list.
3.3. Indicator alignment with SDGs across the two pillars of the CAP
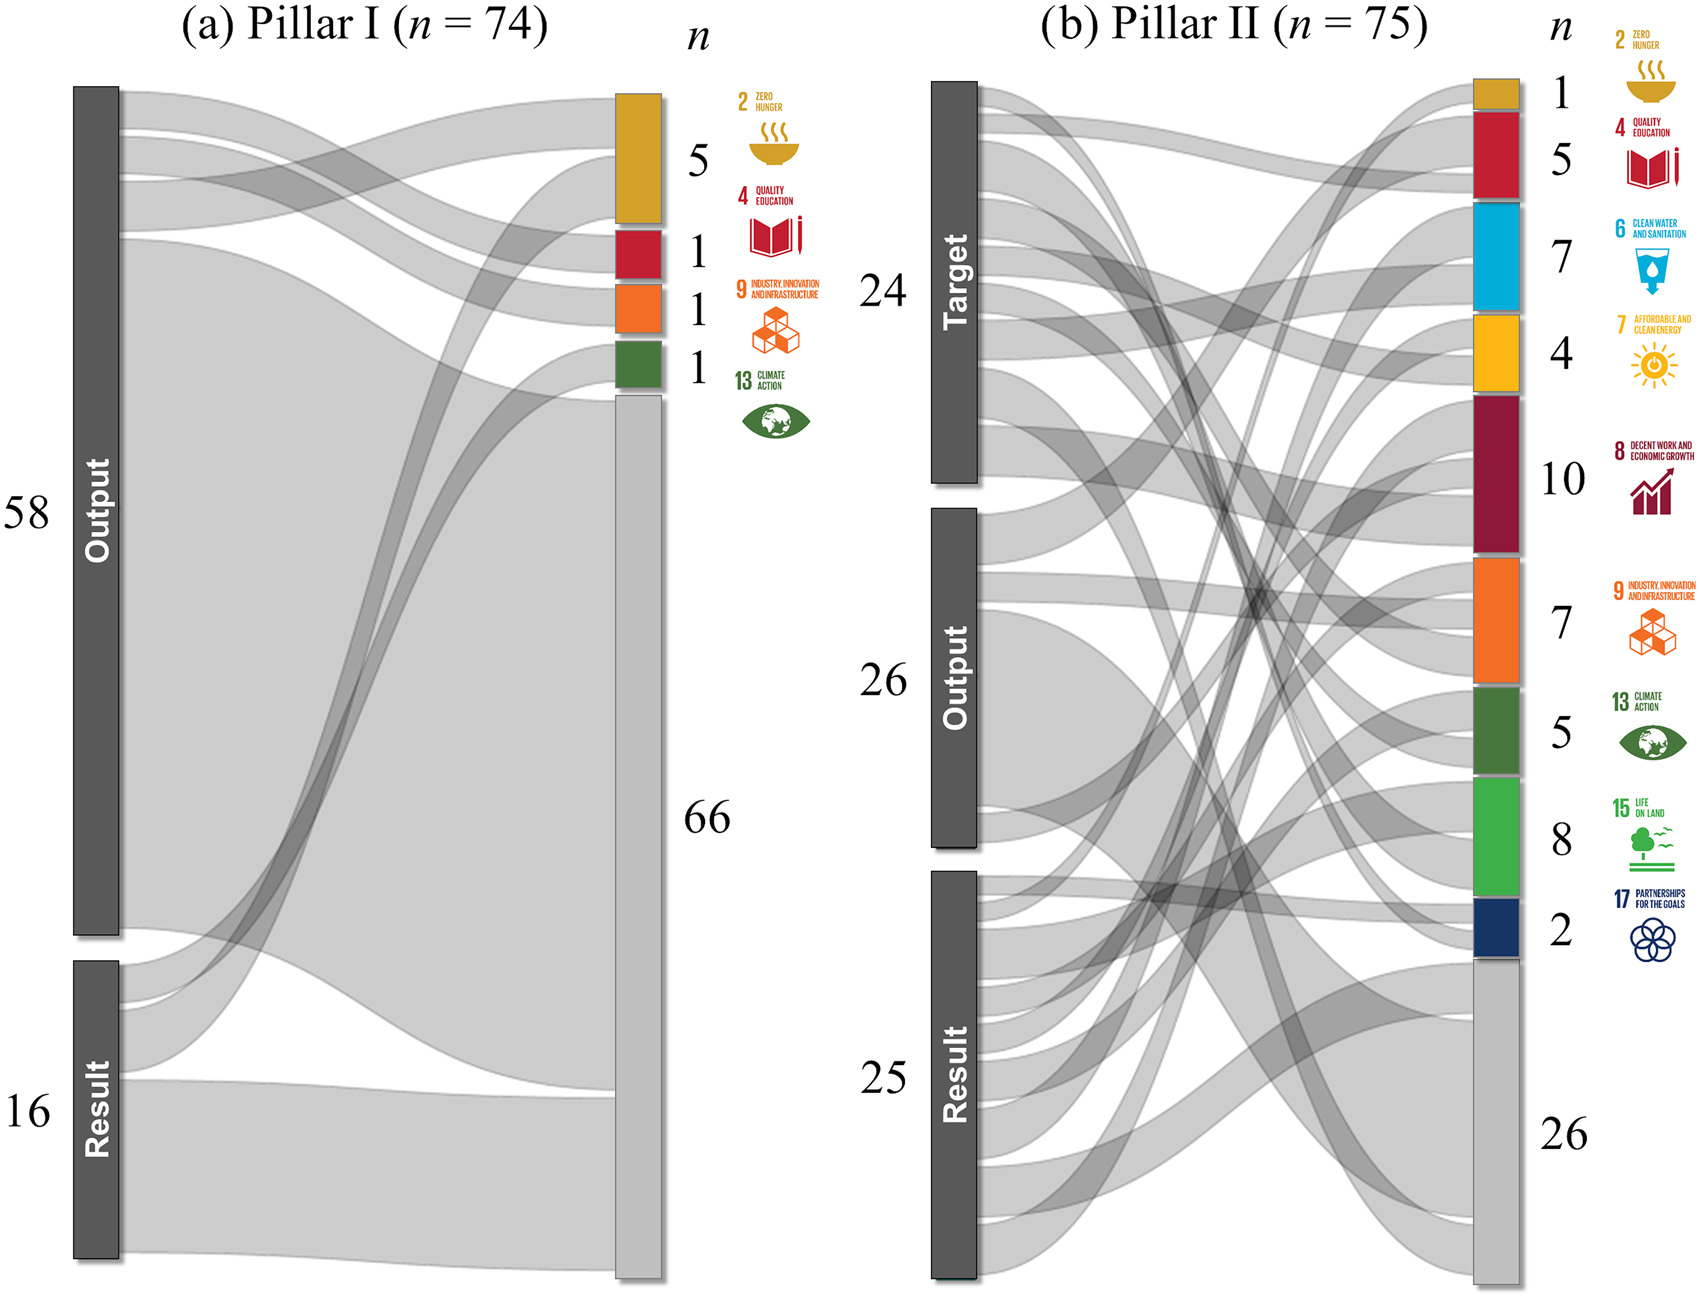
We analysed the alignment of agricultural policy indicators with sustainability goals between the two pillars of the CAP (Figure 5). Only the CAP Target, Output and Result indicators are specific to a pillar, whereas the Context and Impact indicators exist for the CAP as a whole (Table 1); thus, only the former were analysed here. While the two pillars had nearly identical numbers of indicators (n = 74 versus 75), only eight agricultural indicators from Pillar I (11%) aligned with EU SDG indicators (Supplementary Data File S1), covering only four SDGs (Figure 5). By contrast, Pillar II had six times more indicators aligned with EU SDGs, a total of 49 indicators (65%; Supplementary Data File S1) covering nine SDGs (Figure 5). Both pillars of the CAP have indicators that align with and could potentially monitor progress towards zero hunger (SDG 2), quality education (SDG 4) among farmers, innovation and improved infrastructure (SDG 9) in agriculture and climate action (SDG 13). Pillar II additionally has indicators aligning with SDGs 6, 7, 8, 15 and 17 (Figure 5). However, eight SDGs are not covered by the pillar-specific agricultural indicators (SDGs 1, 3, 5, 10, 11, 12, 14 and 16).
Proportion of pillar-specific agricultural indicators for the Common Agricultural Policy (CAP) aligned with European Union Sustainable Development Goal (SDG) indicators within the two pillars of the CAP. Pillar I (direct support, market measures and horizontal aspects) is dominated by CAP Output indicators and has only 11% indicator alignment across only four SDGs. By contrast, Pillar II (rural development) indicators are balanced across CAP Target, Output and Result indicators, with 65% aligned across nine SDGs. Note: Sankey diagram block sizes are automatically optimized for visualization and not precisely to scale; the number of indicators in each block is given for clarity.
4. Discussion
4.1. Key findings in context
Critical evaluation of how agricultural policies support or constrain sustainable development is necessary in order to determine whether existing policies can achieve the ambitious claims made for the sector. Our results for EU agricultural policy do not reflect assertions for agriculture's expected contribution to the SDGs in the region (EC, 2017). We found that EU agricultural policy indicators are primarily focused on three SDGs: zero hunger (SDG 2), decent work and economic growth (SDG 8) and life on land (SDG 15). EU agricultural indicators are missing entirely for good health and well-being (SDG 3), gender equality (SDG 5), life below water (SDG 14) and good governance through institutions (SDG 16) (Figures 3–5) – issues that have all been highlighted as important for agriculture by the FAO (FAO, 2017, 2018) and other scholars (Begashaw & Rockström, Reference Begashaw and Rockström2017; Jansson et al., Reference Jansson, Höglind, Andersen, Hasler and Gustafsson2019; Karlsson et al., Reference Karlsson, Gilek, Lundberg, Gilek, Karlsson, Linke and Smolarz2016). Other assessments, too, have found gaps in agricultural policy and the SDGs. Recent expert assessment concluded that the CAP is most relevant for SDGs 2 (zero hunger), 6 (water), 12 (responsible consumption and production), 13 (climate action) and 15 (life on land), but that current CAP instruments only support SDGs 1 and 2 (Pe'er et al., Reference Pe'er, Zinngrebe, Moreira, Sirami, Schindler, Müller and Bonn2019).
Considering our results as well as the Pe'er et al. (Reference Pe'er, Zinngrebe, Moreira, Sirami, Schindler, Müller and Bonn2019) expert assessment, SDG 2 appears to be the only goal that the current CAP is simultaneously (1) highly relevant for, (2) structured to support and (3) capable of monitoring progress towards. These finding disagree with the European Commission's communique on the future of the CAP (EC, 2017), which states that the CAP contributes to 13 of the 17 goals – excluding reduced inequalities (SDG 10), oceans (SDG 14), institutions (SDG 16) and partnerships (SDG 17). Our results also contrast global and African reports that highlight agriculture's contribution to oceans and institutions (SDGs 14 and 16) (Begashaw & Rockström, Reference Begashaw and Rockström2017; FAO, 2017, 2018), which are missing from both the European Commission's communique (EC, 2017) and our findings (Figure 3). These discrepancies highlight the need for rigorous and transparent methods for assessing policy alignment for the SDGs, such as the one we have presented here.
Two particular discrepancies between our results, those of Pe'er et al. (Reference Pe'er, Zinngrebe, Moreira, Sirami, Schindler, Müller and Bonn2019) and the European Commission's ambitions for the CAP are important to note regarding the goals for responsible production and consumption (SDG 12) and reduced inequalities (SDG 10). First, the only CAP indicator we found aligning with SDG 12 is the AEI ‘index of risk of damage from pesticide toxicity and exposure’ (Figure 3), yet experts rated this as the third most relevant SDG for the CAP (cf. figure 1 in Pe'er et al., Reference Pe'er, Zinngrebe, Moreira, Sirami, Schindler, Müller and Bonn2019). Thus, current indicators show that the CAP at present is not well positioned to contribute to broader food system sustainability (e.g., through encouraging healthy diets and reducing food waste). Such goals would need to be explicitly implemented in the CAP and other policies, especially under the currently discussed Farm to Fork Strategy, which aims to improve food value chains, help farmers create sustainable as well as productive agricultural systems, reduce chemical use and food waste and promote affordable and healthy food for all consumers (EC, n.d.b). Associated indicators would also be required to ensure the effective contribution of such relevant policies in order to support SDG 12.
Second, while we found indicators relating to reduced inequalities (SDG 10) in the CAP Context and Impact indicators, including a measure of purchasing power in rural areas, the European Commission's communique (EC, 2017) neglects this SDG from their ambitions for the CAP. Agricultural ‘exceptionalism’ (i.e., the belief that agriculture is fundamentally different from other sectors) is used to justify the structure of instruments (e.g., direct payments) under the CAP and has led to limited integration with other policies (Alons, Reference Alons2017). On the flipside, direct payments based on land area lead to inequity among CAP payment recipients, with 32% of payments going to only the top 1.8% of recipients (Pe'er et al., Reference Pe'er, Zinngrebe, Moreira, Sirami, Schindler, Müller and Bonn2019). Given broad social concern with increasing inequalities and failures of the CAP to address them, we believe it is important for sectors, including agriculture, to make SDG 10 more prominent in policy and indicators.
4.2. Policy recommendations
We identify several priority areas to better align EU agricultural policy and the SDGs. The development of policy indicators for the four missing SDGs (Figure 3) is needed if, indeed, agriculture should contribute to all SDGs. Potentially important indicators relate to the good health and well-being of farmers (SDG 3), particularly mental health (Berry et al., Reference Berry, Hogan, Owen, Rickwood and Fragar2011; Fraser et al., Reference Fraser, Smith, Judd, Humphreys, Fragar and Henderson2005) and serious farm work accidents; gender equality (SDG 5), particularly regarding land tenure (Doss et al., Reference Doss, Meinzen-Dick, Quisumbing and Theis2017; FAO, 2011); coastal nutrient pollution from fertilizer runoff (SDG 14; Jansson et al., Reference Jansson, Höglind, Andersen, Hasler and Gustafsson2019; Karlsson et al., Reference Karlsson, Gilek, Lundberg, Gilek, Karlsson, Linke and Smolarz2016); and good governance of the vast CAP expenditure (SDG 16; EC, 2018a). However, it is important to recognize that not all elements of the CAP must align with the global SDGs, because the CAP has additional important EU priorities beyond the SDGs (e.g., maintenance of grassland, young farmers and small farms), which should not be disregarded as existing policies are increasingly directed towards achieving the SDGs.
There is also a need for more indicators to assess responsible consumption and production (SDG 12) throughout the broader food system, including for food waste (Pe'er et al., Reference Pe'er, Lakner, Müller, Passoni, Bontzorlos, Clough and Zinngrebe2017) and for how well the food production incentivized under the CAP aligns with healthy diets that lower nutrition-related diseases (Recanati et al., Reference Recanati, Maughan, Pedrotti, Dembska and Antonelli2019) and supports both health and environmental goals (Willett et al., Reference Willett, Rockström, Loken, Springmann, Lang, Vermeulen and Wood2019). In order to support achieving the SDGs, these indicators may need to be explicitly assessed as impacts of European agriculture and agricultural policy, or else be considered specifically in other sectors – the Farm to Fork Strategy (EC, n.d.b) needs to play a role here in coordinating across sectors in the food system.
Our results identify systemic weaknesses in the current CAP monitoring and evaluation framework that must be addressed for the post-2020 CAP to support the SDGs. Relevant indicators are necessary but not sufficient to achieve the desired goals. We found that the indicators for stages at the beginning and end of (one cycle of) the CAP policy-making process (Figure 4) are reasonably well aligned with the SDGs, but that implementation of the policy through CAP payment instruments (Output indicators) diverges from the SDGs. This should be a reason for concern because it implies that once objectives are defined, there are insufficient instruments and budgets to implement them and insufficient or non-existent indicators to monitor (some of) the impacts until it is too late.
Pe'er et al. (Reference Pe'er, Zinngrebe, Moreira, Sirami, Schindler, Müller and Bonn2019) also found current CAP payment instruments to be concentrated on only one of the nine proposed post-2020 CAP goals, providing little support for the SDGs. Under the proposed post-2020 CAP, Member States will be required to develop their own strategic plans and, along with the European Commission, must establish a performance framework for the monitoring, reporting and evaluation of CAP implementation (CEU, 2019). We therefore recommend the development of clear targets to be met that are in line with the SDGs (Lafortune & Schmidt-Traub, Reference Lafortune and Schmidt-Traub2018), especially for Pillar I of the CAP, which should then be used to realign policy instruments and implementation towards achieving the SDGs (and towards all of the future CAP's nine goals; cf. Pe'er et al., Reference Pe'er, Zinngrebe, Moreira, Sirami, Schindler, Müller and Bonn2019). Consistent alignment of indicators across different stages of the policy-making process would also help us to evaluate whether CAP objectives, payments through policy instruments and associated outcomes achieve their desired impacts, which is necessary for moving to a results-based CAP as planned. In order to do so, regular timely updates to the data for relevant indicators must be made publicly available on a consistent platform.
4.3. Limitations
We have analysed only direct alignment between the CAP indicators and the SDGs, but policy instruments to achieve a particular agricultural objective may indirectly support or conflict with the SDGs. For example, 16 CAP Output indicators that do not explicitly align with an EU SDG indicator exist under the greening measure of the CAP (e.g., number of hectares of arable land subject to crop diversification), and these factors are relevant for soils and biodiversity (part of SDG 15). Consequently, we may slightly underestimate the alignment between the CAP and the SDGs by not considering these indirect links. Nonetheless, we believe this does not change our overall findings, which agree with other scholars that the CAP's potential for the SDGs is currently limited (Navarro & López-Bao, Reference Navarro and López-Bao2019; Pe'er et al., Reference Pe'er, Zinngrebe, Moreira, Sirami, Schindler, Müller and Bonn2019).
Trade-offs among competing goals are also common in agriculture (Kanter et al., Reference Kanter, Musumba, Wood, Palm, Antle, Balvanera and Andelman2018). Understanding whether indicators are positively or negatively correlated with each other is important for identifying and balancing such trade-offs (Lusseau & Mancini, Reference Lusseau and Mancini2019). Thus, indicators of outcomes in agricultural systems should not be assessed individually but rather systematically, considering interactions among indicators and their underlying causes. We suggest future research does so using a transparent and replicable method, as we have done here, ideally based on quantitative data for observed trends in the indicators (e.g., from Eurostat) rather than only on expert opinion (e.g., compare the quantitative and transparent method of Lusseau & Mancini, Reference Lusseau and Mancini2019, to the qualitative and subjective method of Nilsson et al., Reference Nilsson, Griggs and Visbeck2016).
Our analysis of existing policy indicators of sustainability extends beyond agriculture in Europe. For example, scholars have warned of the CAP potentially constraining global development goals by preventing developing countries from competing in the EU market (Cantore et al., Reference Cantore, Page and te Velde2011). This could be evaluated by further analysis of one of the two indicators we identified in the CAP indicators relating to partnerships for the goals (SDG 17): agricultural trade balance between different import/export geographical areas (CAP Impact indicator I.06). Similarly, the consideration of spill-over effects in other regions and sectors is essential for monitoring progress towards the SDGs (Lafortune & Schmidt-Traub, Reference Lafortune and Schmidt-Traub2018). Monitoring of CAP indicators alongside international agricultural and trade indicators (e.g., those of the FAO) would be required in order to evaluate whether such effects are occurring and whether the CAP is facilitating or inhibiting the achievement of the SDGs globally.
One limitation of using sectoral policy indicators is that it might oppose part of the SDGs’ purpose as a holistic strategy (Biermann et al., Reference Biermann, Kanie and Kim2017; OECD, 2016). However, a key feature of the SDGs is that governments have flexibility in how they are implemented nationally (Biermann et al., Reference Biermann, Kanie and Kim2017), which incentivizes the use of existing policies (and their established indicators), rather than the lengthy and proliferating development of new indicators (Reyers et al., Reference Reyers, Stafford-Smith, Erb, Scholes and Selomane2017). Sectoral policies will not become obsolete under the SDGs, so it is imperative that scholars and policy-makers adopt systems approaches to analysing interactions among indicators from established sectoral monitoring processes (see Kanter et al., Reference Kanter, Musumba, Wood, Palm, Antle, Balvanera and Andelman2018; Pradhan et al., Reference Pradhan, Costa, Rybski, Lucht and Kropp2017; Reyers et al., Reference Reyers, Stafford-Smith, Erb, Scholes and Selomane2017; Scown et al., Reference Scown, Winkler and Nicholas2019).
Another limitation of applying our method for indicator-based policy SDG assessment may be a potential lack of available indicators in some sectors and regions, since a well-developed and comprehensive policy indicator framework such as that for the EU's CAP (established in 1962) is by no means the norm globally. However, nations currently lacking such indicator frameworks are presented with the opportunity and support for their development under the SDG strategy (UN, 2015), which should help align national sectoral policies with the SDGs by design. We would encourage such efforts to make use of our method to align indicators with SDGs from the beginning in order to efficiently work backwards from desired policy impacts so as to inform policy formulation and associated indicator selection.
5. Conclusion
We have presented a rigorous, quantitative method to systematically and transparently evaluate sectoral alignment with the SDGs using existing policy indicators. In order to enable transparent and objective alignment of sectoral policies to the SDGs, we suggest evaluation throughout the entire policy-making process using measurable indicators, which are publicly accessible in a timely manner. We encourage the use of measurable indicators because they provide the empirical evidence of trends in policy outcomes and impacts (sensu Nilsson et al., Reference Nilsson, Zamparutti, Petersen, Nykvist, Rudberg and McGuinn2012) to quantitatively evaluate whether implementing existing policies will achieve their stated goals and objectives. This would also support the development of so-called SMART targets to enable successful implementation of actionable policies (see Green et al., Reference Green, Buchanan, Butchart, Chandler, Burgess, Hill and Gregory2019). Our approach could be applied by scholars and policy-makers in order to critically evaluate sectoral contributions to sustainability at any policy scale (e.g., businesses, cities, nations, regions). We have initially demonstrated our approach for the agricultural sector in the EU using the CAP and related indicator sets. Despite the EU's commitment to being a world leader in achieving the SDGs, we have identified the omission of indicators for important SDGs, the poor alignment of existing CAP funding instruments with the SDGs and the lack of clear values to be met for Target indicators as key concerns for agriculture's contribution to achieving the SDGs in the EU. Future work should complete a stocktake of other nations’ and regions’ policy priorities – in agriculture and other sectors – to ensure that the cumulative contributions will address key global challenges, including biodiversity loss, climate change and inequality, as well as to quantify the trade-offs among goals that must be managed and the synergies that can be leveraged in pursuing sustainable development.
Supplementary material
To view supplementary material for this article, please visit https://doi.org/10.1017/sus.2020.5.
Supplementary Data File S1 contains a full list of EU SDG and agricultural indicators used and analysis results.
Acknowledgements
The authors wish to thank Guy Pe'er and an anonymous reviewer, whose comments on a previous version greatly improved the article.
Author contributions
MWS conceived and designed the study, assembled and analysed the data and created the visualizations. MWS and KAN wrote and revised the article. KAN obtained the funding supporting the research.
Financial support
This research was supported by the Swedish Research Council Grant 2014-5899/E0589901.
Conflict of interest
None.
Ethical standards
This research and article complies with Global Sustainability's publishing ethics guidelines.
Research transparency and reproducibility
All information necessary to reproduce the results are provided in the Supplementary Material.


 Open access

