


1. Introduction
Since 1967 a variety of satellite imagery has become available for observing the variation of sea ice around Antarctica on the large scale. This imagery includes the minimum brightness composite photographs over the Antarctic region described by Reference SwithinbankSwithinbank (1971) and Reference Booth and TaylorBooth and Taylor (1969). More recently microwave imagery has also become available.
These systems allow the monitoring of variai ions in the large-scale smoothed sea-ice edge to be carried out over periods from days to months and longer. The U.S. Fleet Weather Facility, Suitland (FLEWEAFAG) uses the output from a number of different satellite systems to construct a map of sea-ice extent and concentration around Antarctica on a weekly basis. Here use is made of minimum brightness photographs from 1967 to 1970 and the FLEWEAFAG maps from 1971 onwards.
A strong case for the importance of the effect of Antarctic sea ice on global climate has been made by Reference FletcherFletcher (1969). Already Reference StretenStreten (1973) has made a preliminary examination of the relation between the sea-ice extent in 1969 and 1970 and the strength of the circulation. He concluded that there was at least general qualitative support for stronger circulation with greater ice extent. An even more fundamental relation may be expected between the sea ice and temperature. Long-term records of temperature and ice conditions have been kept at Laurie Island (lat. 6o° 44’ S.) since 1904. These have been shown by Reference ProhaskaProhaska (1951), Reference Heap, Priestley, Priestley, Adie and RobinHeap (1964) and Schwerdtfeger (1970) to indicate a high correlation between the annual mean temperature and the duration of the ice in Scotia Bay. Since Laurie Island is just one isolated station, the question arises as to the horizontal extent of the variations observed there and their relation to climate fluctuations in other localities.
In order to study the scale of long-term temperature changes, the annual mean temperatures from stations around Antarctica are discussed here. The reasons annual mean temperatures are used are several. First, in the relation between sea ice and temperature it is not clear what is cause and effect and what is feed-back. Although the temperatures of the months preceding the maximum ice extent may be expected to influence the extent most, this extent may be expected to influence the temperatures in following months. In addition, Reference Schwcrdtfeger and OrvigSchwcrdtfeger (1970) found that the sea-ice duration had a higher correlation with the annual mean temperature than with the mean of the winter months. Finally, for longer-term changes, the annual mean represents an integral of shorter-term changes and hence provides an indication of net effects.
If long-term climatic changes are to be deduced from stable-isotope variations in ice cores, it is furthermore important to understand how current variations are associated with observed temperatures nearby and how these are related to large-scale events.
With these considerations in mind this report presents a brief preliminary analysis of temperature and sea ice variations around Antarctica. A more extensive study is given by Budd (in press).
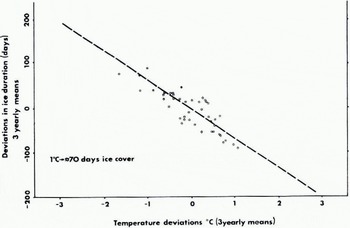
Fig. 1. Sea-ice variations, Scotia Bay, Laurie Island, Antarctica.
2. The relation between sea ice and temperature changes at laurie island
The long-term data of annual mean temperature at Laurie Island and the duration of ice in Scotia Bay are shown to be closely associated by Heap (1964). Schwerdtfeger (1970) shows that a high correlation also exists strongly over five-year running means. Using the same data it is here found that the correlation coefficient is greater for three-year running means as shown in Figure 1. Linear regression gives the result that a ±1 deg temperature change corresponds to a change in ice duration of ±70 d. These variations are about the means of —4.4 deg and 180 d. Thus a deviation of about ±2.6 deg could make the severe difference between no ice and always ice for the year at that location.
3. Ice extent versus duration around antarctica
If in cold years the ice lasts longer at a certain location, then for large-scale anomalies it could be expected that the ice grows thicker and moves further north at its maximum. Thus it seems reasonable that variations in the duration could also be linked to variations in the maximum extent.
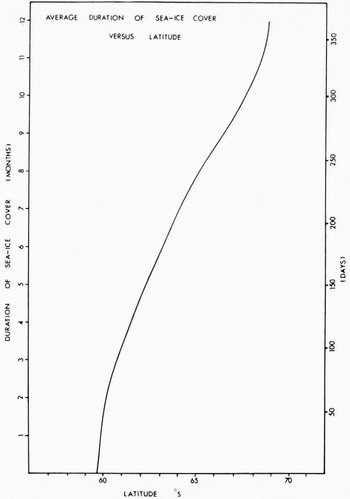
Fig. 2. Average duration of sea-ice cover venus latitude.
From the extent of the sea ice in différent months throughout the year, the period of duration of the sea ice at different latitudes around Antarctica can be derived. Although this relation varies with longitude around the Antarctic, the curves have a generally similar shape, and hence the average curve can be considered as representative in terms of gradients. Thus Figure 2 shows the mean variation in the duration of the sea-ice cover with latitude around the continent.
If it can be assumed that the variation in ice duration with temperature at Laurie Island is representative of other locations around the Antarctic, Figures 1 and 2 can be used to derive a relation between fluctuations in the mean temperature and the latitude of the maximum extent.
4. Variation of latitudinal extent with temperature
Figure 3 shows the variation in latitude of the extent of the sea ice with deviations of annual mean temperature derived as described above. There are several notable features of this curve. The slope of the curve is a maximum about the latitude of the Antarctic, circle with the value of c. 2.5° lat./deg. However this gradient decreases for large température deviations such that by lat. 60° the gradient is about 1° lat./deg. This decrease of the gradient with increasing anomaly strength suggests a stable feed-back rather than an unstable one as suggested by Budyko (1969). However the situation may be different if the temperature and ice anomalies occur over the whole pack-ice region around the continent.
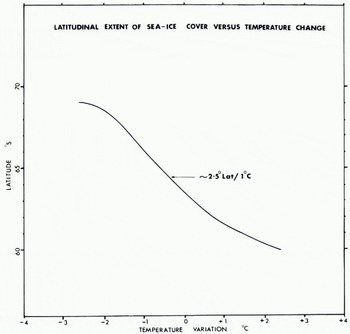
Fig. 3. Lalitudinal extent of sea-ice cover versus temperature change.
5. Satellite observations of sea-ice cover
To illustrate the variations in sea-ice extent from one year to another as derived from the satellite observations, Figure 4 shows the extent in October and December 1967 and 1968 from the 30 d mean minimum brightness composites. The notable features are the greater extent in 1967 only in the region from near the Antarctic Peninsula to about Novolazarevskaya. For the rest of the boundaries the 1968 extent is generally greater.
It can be seen from the corresponding result for December that these differences persist for several months. Photographs for September, January and March indicate that this persistence extends over the entire season. Examination of the maximum extent in subsequent years confirms the pattern of anomalies, or shifts, in the sea-ice distribution rather than general increases or decreases in the extent as a whole.

Fig. 4. Mean sea-ice extent. October and December 1967 and 1968. For key lo station symbols see Appendix.
6. Annual mean temperature changes around antarctica
A number of stations were established around Antarctica about the mid 1950s just prior to the I.G.Y. Many of these are still operating, others have been discontinued, and further new stations have been established. The annual mean temperatures from these stations have been sought from many sources (cf. Appendix) to form a picture of changes around the continent during this period. The net result is illustrated in Figure 5 which, in spite of a few gaps, presents a reasonably clear picture, of the temperature variations around Antarctica from the Antarctic Peninsula clockwise (west to east) around the coast.
A number of points are noteworthy. First, no definite trend over the period is apparent. Secondly, large fluctuations occur of ±1 to ±2 deg which tend to vary systematically in strength around the Antarctic and grow or decay differentially with time. There are no clear cases of uniform major warmings or coolings for the Antarctic as a whole. However large anomalies tend to develop around large sections of the coast often with an anomaly of the opposite sign further around.

Fig. 5. Annual mean temperatures of Antarctic stations. For key to station symbols see Appendix.
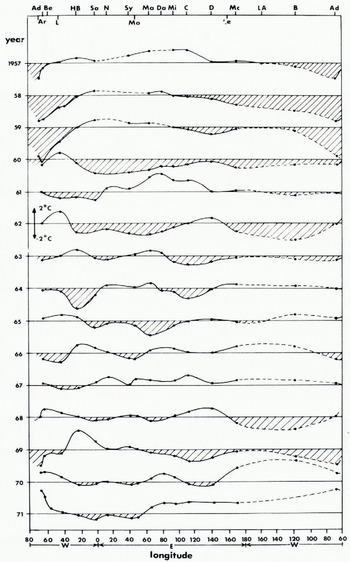
Fig. 6. Annual mean temperature anomalies around Antarctica. For key to station symbols see Appendix.
7. Temperature anomalies around antarctica
In order to bring out more clearly the changes in the annual mean temperature anomalies around Antarctica with time, these anomalies have been plotted for each year against longitude around the continent (Fig. 6). Although there are large gaps especially between McMurdo, Byrd, and the Antarctic Peninsula, there appears to be sufficient systematic variation to show the growth, decay, and possible movement of large anomalies. The anomalies seem to move from west to cast at a rate of between 20° and 100° longitude/year. At the same time some anomalies seem to intensify, others weaken, some spread out, and others become narrower.
A comparison of the anomalies for 1967 and 1968 shows that the only region where 1967 is substantially colder than 1968 corresponds to the region around Halley Bay for which the sea ice is some 3º latitude further north in 1967 than in 1968. The large cold anomaly on the longitudes and at Byrd and McMurdo in 1968 corresponds to a generally greater sea-ice extent of about 5° latitude.
8. Comparison of sea ice and temperature anomalies
Since 1968 was somewhat of a transitional year in temperatures between 1967 and 1969, the sea-ice extent in October of 1967 and 1969 as shown in Figure 7 are used to examine the relationship between the deviations in sea-ice extent and temperature. In general the occurrence of zones of greatest difference in sea-ice extent corresponds reasonably well with the zones of greatest difference in annual mean temperature. In spite of considerable scatter, a definite trend of about — 2° latitude/deg change is apparent. This confirms that although the annual fluctuations at Laurie Island do not represent expansion or contraction of the whole Antarctic sea ice, they are representative of major fluctuations in parts of the sea-ice coverage around the continent.
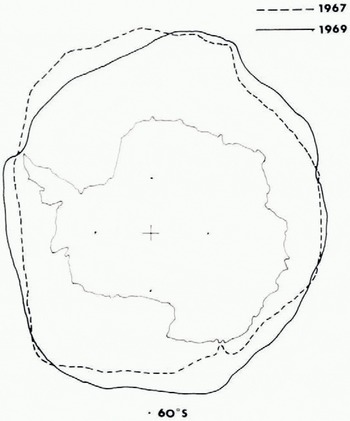
Fig. 7. Mean sea-ice extent. October 1967 and 1969.
However the cause and effect is still not completely clear. For example the greater sea ice extent in 1968 in the region of Dumont d’Urville compared to 1969 is not consistent with the temperature anomalies there for those years. On the other hand the persistence of sea ice there from 1968 right through to March 1969 may be a substantial cause of the colder temperatures in 1969. Study of later years may be able to clarify this feed-back problem.
9. Implications for climate studies
It is apparent that over the period of observations of the last 15 years no major trends in temperature have occurred. However large anomalies of 1 or 2 deg in magnitude extending over large distances around the continent occur from year to year. The movement and change of these anomalies suggests that, they are related to sea surface temperatures and thus ocean surface currents, which have a tendency to westerly movement of the order of 0.5 knots (0.3 m s-1) around the ice-edge region (Goodell and others, 1971).
Over the period since 1967 the variation in the sea-ice extent seem to be directly related to these temperature anomalies. From 1967 to 1969 a net shift across the Antarctic in longitudes 30º W. and 150º E. of 5º to 7º latitude is apparent. This shift may be expected to affect the surface temperature contours further north, and thus the circulation patterns accordingly.
The stage is now being reached at which numerical models can use the mean sea-ice extent of different occasions as input to run over extended periods to develop climatic statistics of different anomalies.
The expected main features of the effect of the sea ice on the global climate can now be considered in two parts. First, a general increase in the sea-ice extent may be expected to increase the meridional temperature and pressure gradients and thus the zonal circulation index. Secondly, the large asymmetric anomalies considered here may be related to asymmetric features of the general circulation such as the southern oscillation (Reference TroupTroup, 1965). Finally this work suggests that the proposed GARP FGGE program (Global Atmospheric Research Programme (GARP), 1974) to use drifting buoys in the southern ocean to measure surface temperature and pressure will be particularly valuable for determining the magnitude and motion of these large temperature anomalies with their important implications for climatic fluctuations over the time scales of seasons to years. In the meantime the satellite sensing provides a valuable current means of monitoring the anomalies in the sea-ice distribution as they appear.
Acknowledgements
The author is particularly grateful to Mr J. O. Fletcher of the Office of Polar Programs of the U.S. National Science Foundation and Dr U. Radok of the Meteorology Department, University of Melbourne, for their assistance in the provision of the satellite minimum-brightness data. Many sources have helpfully provided temperature data but special thanks are due to Professor W. Schwerdtfeger of the University of Wisconsin for his careful collection and provision of various data.
Appendix
Antarctic stations and data source

Data Sources
-
World Weather Records, 1951-60 (U.S. Dept. of Commerce. Environmental Science Services Administration. Environmental Data Service), Vol. 6, 1968.
-
Monthly Climatic Data for the World (U.S. Dept. of Commerce. National Oceanic and Atmospheric Administration. Environmental Data Service), Vol. 7, No. 1-Vol. 26, No. 12, 1954-73.
-
TAAF: Terres Australes et Antarctiques Françaises, Nos. 6-59, 1959-73.
-
Informatsiannyy Byulleten’ Sovetskoy Antarkticheskoy Ekspedilsii, 1-87, 1958-73. [Section "Po radio iz Antarktika [Radio messages from the Antarctic].]
-
ANARE Data Reports. Series D. Meteorology (Australia. Dept. of Supply. Antarctic Division), for the years 1954-68.
-
Antarctic Meteorological Data obtained through the Japanese Antarctic Research Expedition, 1956-1962 (Japan. Meteorological Agency), Vols, a—11, 1964-71.
-
Burdecki, F. The climate of Sanae. Part I. Notos (South Africa. Dept. of Transport. Weather Bureau), Vol. 18, Nos. 1-4, 1969, p. 3-60.
-
Climatological Data for selected U.S. Antarctic Stations (U.S. Dept. of Commerce. National Oceanic and Atmospheric Administration. Environmental Data Service), Nos. 1-11, 1962-7
-
Chesneau, J., and Heuzey, J. Données climatiques de la station Dumont d’Urville. Monographies de ta Météorologie. nationale (Paris), No. 72, 1969.
-
New Zealand. Ministry of Transport. Meteorological Service. Meteorological Observations for the years 1960-72.
Discussion
O. ORHEIM: Your results regarding the annual mean temperature changes around Antarctica are very similar to those I obtained a few years ago for about 20 stations between about lat. 45° and 65° S., in that within a region the changes are highly correlated, but this disappears when stations at opposite sides of the continent are compared. However, at present I doubt seriously whether it is possible to establish that temperature anomalies migrate systematically in the manner you describe. Much closer station spacing, and buoy programmes like that envisaged under FGGE, are needed before this question can be resolved.
Regarding the curve for duration of sea-ice cover versus latitude, which determines the shape of your curve for duration of sea ice versus temperature, I understand this is averaged around Antarctica. However, are there not errors in this averaging, which could influence the shape of the curve, namely (a) because Antarctica is eccentrically located with respect to latitude, and (b) because parts of Antarctica, notably the Antarctic Peninsula, have very different sea-ice cover on their eastern and western sides?
W. F. Bunn: In East Antarctica the stations are more evenly spaced around the continent edge and it is easier to follow the movement of anomalies with time. In cases where the change from one year to another is large, the movement is more clearly brought out by the progression of monthly and quarterly mean values.
We have examined the variation in duration of the sea ice around the Antarctic at 10 longitude intervals. These show that although with latitude a certain duration varies around the continent, the slopes or rates of change of duration with latitude are similar except near the Peninsula. In addition the maximum extent of the sea ice tends to be circular around the continent and it is the variations in this maximum to which the relation obtained has been applied.
A. O. POULIN: My impression of the persistency and movement of sea ice is that, in addition to temperature, there is a large dependence on wind, but I noticed that there is no consideration of wind in your analysis. Is that because the data are insufficient?
BUDD: The main effect of the wind is to cause short-term variations of the sea-ice margin. We have been interested in longer-term averages, such as over one month, which smooth over these small variations. The changes in the large-scale averages from year to year are large by comparison.


