

Introduction
Projections of global sea-level change depend largely upon the mass balance of Earth’s ice sheets. If the future net mass balance is negative (net ice loss), then sea-level rise will be amplified, but if it is positive (net ice gain), sea-level rise could be offset. A number of climate models, for example, project a relatively uniform increase in snowfall over Antarctica under climate-warming scenarios (e.g. Reference Thompson and PollardThompson and Pollard, 1997; Reference Tebaldi, Mearns, Nychka and SmithTebaldi and others, 2004; Reference Krinner, Magand, Simmonds, Genthon and DufresneKrinner and others, 2007). Reference Steig, Schneider, Rutherford, Mann, Comiso and ShindellSteig and others (2009) and Reference Orsi, Cornuelle and SeveringhausOrsi and others (2012), among others, have shown that temperatures over the past half-century are indeed increasing over the West Antarctic ice sheet (WAIS). This warming will theoretically lead to increased precipitation due to the associated increase in saturation vapor pressure of the atmosphere (e.g. the Clausius–Clapeyron relationship) and positive net accumulation of snow over the WAIS. Yet a number of studies have shown no evidence for a statistically significant increase in WAIS snow accumulation over the period of documented warming (Reference Siegert and PayneSiegert and Payne, 2004; Reference MonaghanMonaghan and others, 2006a,Reference Monaghan, Bromwich and Wangb; Reference BurgenerBurgener and others, 2013; Reference MedleyMedley and others, 2013).
Is the problem that the climate models are not accurate on these spatial/temporal scales, or that interannual variability in accumulation is overwhelming any imposed accumulation trends, or that temperature changes have not been large enough to significantly influence accumulation rates? Or is the uncertainty in the net accumulation estimates overwhelming the signal?
Accumulation (defined here as the net precipitation, wind redistribution, sublimation and melt) estimates are often based on in situ point measurements (e.g. from firn/ice cores, snow-stake farms and snow pits), but these measurements invariably suffer from poor spatial coverage. This issue can be addressed using satellite and ground-penetrating radar (GPR) estimates (e.g. Reference DasDas and others, 2013; Reference MedleyMedley and others, 2013), or climate reanalysis products (e.g. Reference MonaghanMonaghan and others, 2006a; Reference Bromwich, Nicolas and MonaghanBromwich and others, 2011; Reference LenaertsLenaerts and others, 2012), but these derivations are often calibrated or validated based on the in situ point measurements. For example, GPRs rely on the firn-core data for the density and for dating the internal layers (e.g. Reference Spikes, Hamilton, Arcone, Kaspari and MayewskiSpikes and others, 2004). Therefore, whatever sources of uncertainty affect in situ accumulation measurements also propagate to the more spatially comprehensive methods. Furthermore, the skill of climate models is often evaluated by comparing simulated accumulation to these accumulation measurements (e.g. Reference Van Lipzig, Van Mekjgaard and OerlemansVan Lipzig and others, 2002; Reference LenaertsLenaerts and others, 2012; Reference MedleyMedley and others, 2013).
Models of accumulation include processes such as direct precipitation and surface evaporation/sublimation. Climate modelers often attempt to increase the skill of their models at reproducing the spatial and temporal variability in accumulation by also incorporating processes such as wind redistribution of snow and sublimation of blowing snow (e.g. Reference LenaertsLenaerts and others, 2012). They then validate the model against in situ accumulation measurements. But if uncertainties in these measurements are not well defined, then it follows that the climate modelers may have been validating against an imprecise measurement. That is, if the measurement uncertainties are large enough, then fine-tuning the models by incorporating these higher-order physical processes may not produce changes in the model output that can be empirically tested.
The primary sources of uncertainty typically reported for firn-core accumulation data are the analytical uncertainty in firn-density measurements and uncertainties in the depth– age scale. Uncertainties in the depth–age scale, however, have not usually been included in the statistical accounting of the uncertainty in reconstructed accumulation. One notable exception is a study by Reference Venteris and WhillansVenteris and Whillans (1998). They used a bomb pulse horizon to quantify mean accumulation over 1955–64, and then quantified uncertainty due to density measurements and errors in the depth–age scale. They noted the importance of depth–age uncertainty for mean accumulation estimates, but were not able to apply their method to interannual accumulation variability, which is a common estimate for models to try to match. Reference Klauenberg, Blackwell, Buck, Mulvaney, Röthlisberger and WolffKlauenberg and others (2011) also emphasized the importance of depth– age uncertainty, but their focus was on even longer-term averages, with an emphasis on uncertainties due to glaciological modeling of depth–age scales. There has been significant work quantifying depth–age uncertainties in sediment cores, but these studies largely focus on issues surrounding interpolation of ages over significant time periods given a limited number of absolute ages (e.g. radiocarbon) and uncertainties in the absolute ages themselves (Reference Haslett and ParnellHaslett and Parnell, 2008; Reference RamsayRamsay, 2008; Reference Blaauw and ChristenBlaauw and Christen, 2011). While the methods and issues surrounding sediment core depth–age uncertainties are not always directly applicable to the high-resolution, well-dated ice and firn cores of interest here, this body of work emphasizes the importance of quantifying these uncertainties.
Arguably, current methods for reporting the uncertainty in accumulation estimates involving high-resolution ice or firn cores (which cover longer time periods than snow stake farms or snow pits) may be inadequate. In particular, the impact of dating uncertainty is exacerbated when (as commonly observed) the potential magnitude of dating errors is not consistent throughout the core. These isolated sections of the core can yield dating errors on the order of 0.5–1 years. Errors of this magnitude can in turn yield dramatically understated or overstated accumulation estimates for these sections of the core. Because of the principle of leverage in linear regression, large errors in estimated accumulation located in the ends of the core will have much greater impact on false positives for trend, while large errors in estimated accumulation located in the middle of the core will have much greater impact on false negatives (due to increased standard errors associated with estimated trends). Consequently, the quantification of specific uncertainties associated with different locations in the core is necessary for proper understanding of the impact of dating uncertainty on accumulation trends. In addition, the distribution of the dating uncertainties significantly impacts estimates of interannual accumulation variability throughout the core. Questions surrounding the relevance of an anomalous accumulation year must include an accounting of the dating uncertainty within that section of the ice core.
In this contribution, we use statistical simulation methods to assess the uncertainty in accumulation estimates due to uncertainties in measured depth–age scales, with a focus on high-resolution (annual) accumulation records. In particular, we show that a significant amount of apparent interannual variability in reconstructed accumulation can arise from depth–age scale uncertainties. Uncertainties in the accounting of the number of years within a given core can also impose false trends in accumulation if considering shorttimescale (multi-decadal) records.
Methods
We explore how uncertainty in the assigned timing of the seasonal peaks in ice-core data (peak-date uncertainty) and the accounting of number of years represented in the data (peak-identification uncertainty) affects the interannual variability and trends in accumulation. This is accomplished by applying statistical simulation methods to both raw (untransformed) and detrended firn-core accumulation data. In this section, we introduce the firn cores used for this statistical study and how depth–age scales are generated. We then discuss the sources of associated peak-date and peak-identification uncertainties. We create a simulated accumulation time series from the firn-core data accounting for the depth–age scale uncertainties and present our statistical methods and analysis for quantifying uncertainty in accumulation trends and interannual variability.
Firn-core collection and analysis
Our study consists of five shallow (∼18 m) firn cores that span the most recent several decades. These firn cores were collected as part of the Satellite Era Accumulation Traverse (SEAT) in December 2010 across a strong accumulation gradient in central West Antarctica (Fig. 1). A detailed description of the core collection and analysis is given by Reference BurgenerBurgener and others (2013), and we briefly describe the relevant details. Here we consider the accumulation uncertainties due to peak-identification and peak-date errors in the depth–age scales. We define ‘peak-identification uncertainty’ as the errors in estimates of the number of years represented by different segments of each core. We define ‘peak-date uncertainty’ as the errors in estimates of the absolute date represented at any particular depth along a core (more detail below).
Map showing central WAIS and the SEAT-2010 firn-core locations. The background grayscale of the map is modified from Reference Morse, Blankenship, Waddington and NeumannMorse and others (2002) and shows the relative accumulation gradient across WAIS Divide from high (white) to low (black).

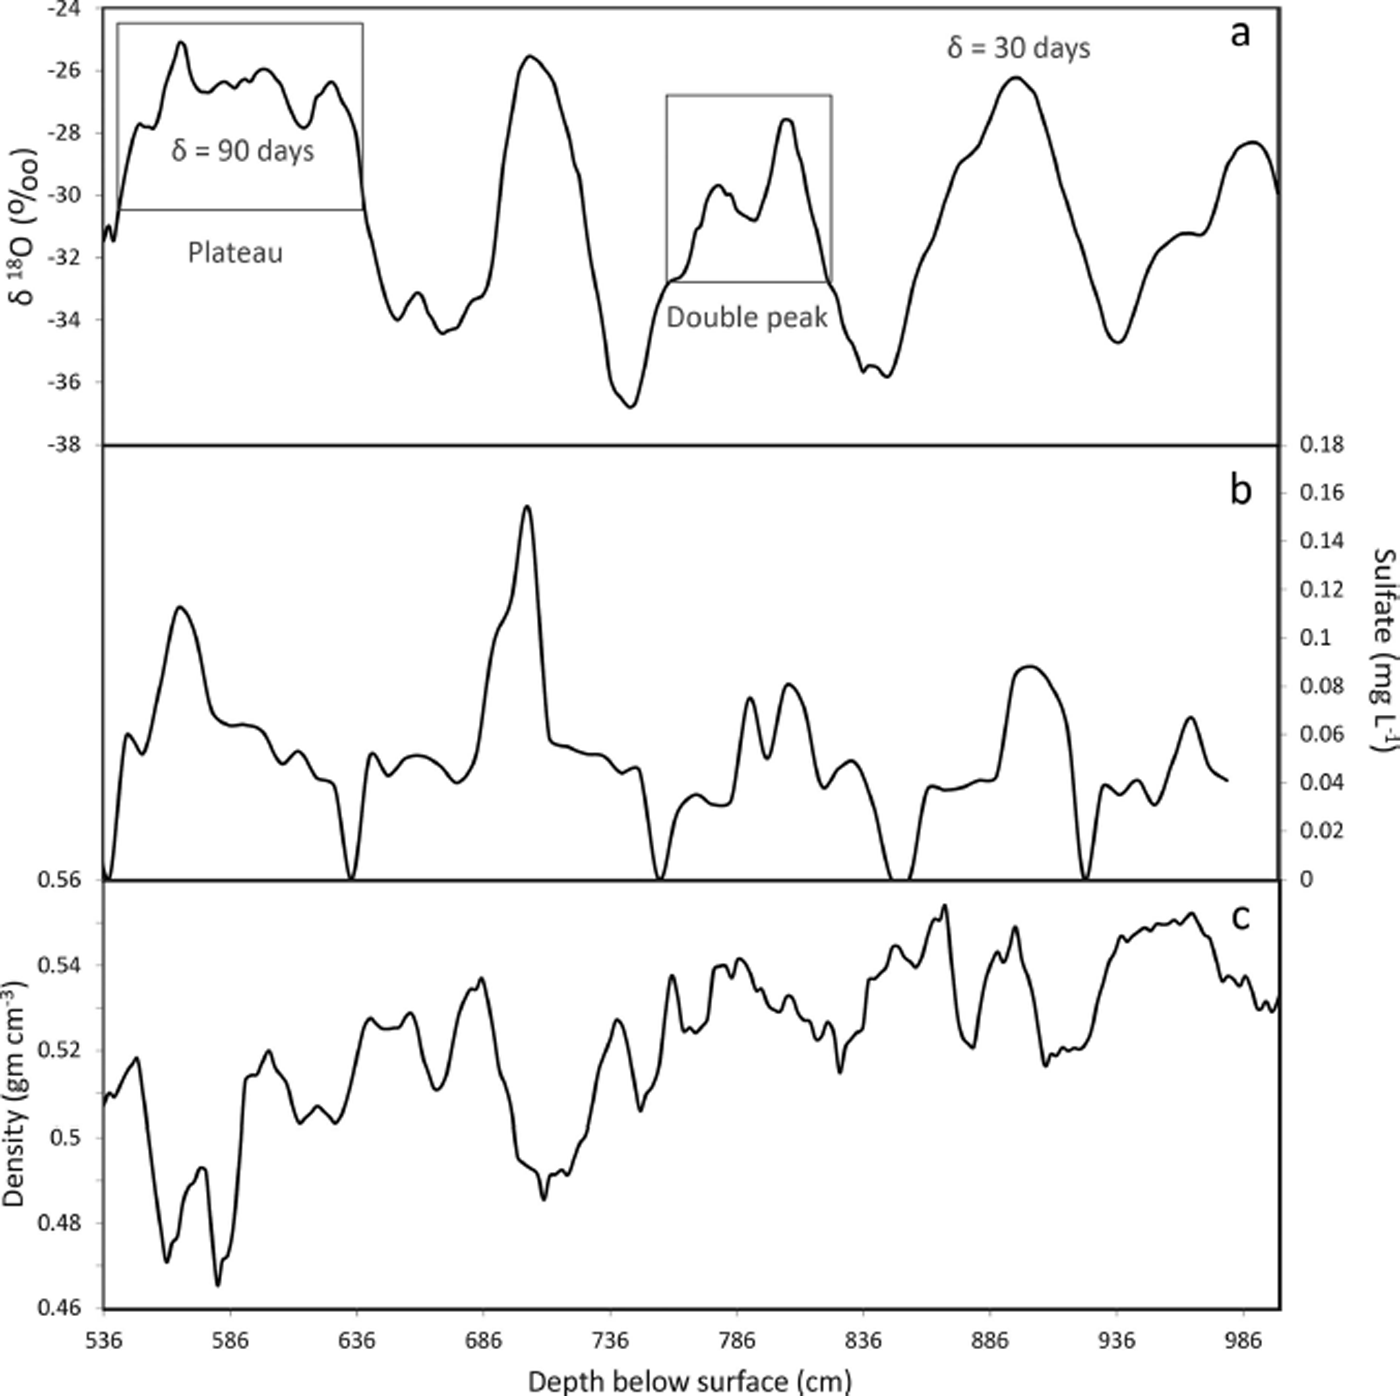
Stable water isotope (δ 18O, δD), solute anion (F−,Cl−, NO−, PO4 3−, SO4 2−)and density analyses were completed at ∼2 cm resolution for each core, and electrical conductivity measurements (ECM) were carried out at sub-centimeter resolution. The combination of these data was used to develop depth–age scales and accumulation time series. Timescales at seasonal resolution were developed for each core by counting the peaks and troughs in the seasonal signal of the δ 18O and δD records. The majority of both the δ 18O and δD summer maxima were easily identified by the presence of sharp and distinct peaks. But the morphology of some peaks was not always as distinct, displaying small double peaks or broad ‘humps’ or ‘plateaus’, making it difficult to determine if the peak in question actually represented one, two or several years of accumulation (Fig. 2a). This was the source of the peak- identification uncertainty in our preliminary depth–age scales; however, peak- identification was improved for the final depth–age scales by comparing the isotopic data to the density and solute records. If all data showed several small peaks, it was assumed that the observed peaks were, in fact, several seasonal maxima. Alternatively, if the isotope record showed several small peaks, while the density and/or solutes did not, it was assumed that the observed isotopic peaks were more likely due to intra-seasonal variability. Volcanic horizons were identified in the ECM and solute data and used as timestratigraphic markers within the cores. In particular, both the 1991 Pinatubo (Philippines) and 1982 El Chichón (Mexico) distinct volcanic horizons were used to quantify the uncertainty in the peak-identification of the depth–age scales.
(a) Isotopic data for a section of core SEAT-10-4 with boxed examples of double peaks and broad plateaus that can occur in seasonal data. These are the types of issues that give rise to peak-idenfitication and peak-date uncertainties in depth–age scales. In the data presented here, all potential peaks were assigned a 90% probability range of ±δ = 30 days that the peak represents 1 January. The one exception in the data here is the plateau, which was assigned a value of ±δ = 90 days. (b, c) Sulfate data (b) and density data (c) used to refine the preliminary depth–age scale based on the isotopes. Based on this suite of data, the double peak in the isotopes was assigned an 85% probability that 738–836 cm represents a single year, and a 15% probability that it represents two separate years.
Peak-date uncertainty arises from the assumption that the time represented by the distance between seasonal peaks in the ice-core data is exactly 1 year. However, the exact date of the seasonal maxima can actually vary by several weeks for any given year (Reference SteigSteig and others, 2005). Thus, the actual number of days between two seasonal summer peaks could be more or less equivalent to a complete year, depending on when the seasonal maxima actually occurred.
Water-equivalent annual accumulation records were reconstructed by multiplying the density of the firn by the thickness of the firn between seasonal peaks, according to the method described by Reference Cuffey and PatersonCuffey and Paterson (2010). Therefore, any uncertainty in the peak-identification or peak-date in the depth–age scale introduces uncertainty in the water-equivalent estimated annual accumulation.
Quantifying uncertainty
To properly account for peak-identification uncertainty, we assigned to each 2 cm segment of the cores a probability that it truly represented a summertime maximum. Most of these probabilities were either 0 or 1, but on occasion, even with the combination of seasonal indicators, it was questionable whether a peak represented a summertime maximum or intra-annual noise. For example, a small double peak occurs at 776 cm in core SEAT-10-4 in the isotope and solute data, but not the density data. We assigned an 85% chance that this peak does not represent a new year, but rather a midyear weather anomaly. In other words, we assigned an 85% chance that the accumulation between 738 and 836 cm represents a single year, and a 15% chance that it represents two years (Fig. 2) (see Supplementary Material at http://www.igsoc.org/hyperlink/14j042supp.docx). The assignment of these probabilities was based on comparisons between ice-core data and temperature measurements over the WAIS (e.g. Reference SteigSteig and others, 2005), but was somewhat subjective. One can certainly argue about the specific values, but for our purposes we need only show that peak-identification uncertainty can significantly affect our interpretations of the firn-core accumulation data, so our probabilities only need to be reasonable.
As mentioned above, peak-date uncertainty is related to the number of days between summer maxima in the firn-core data. Typically, peaks thought to represent summer maxima are assigned a date of 1 January (for the Southern Hemisphere), but the peak might more accurately represent 18 December or 5 January, for example. We assigned a 90% probability range of ±δ days to each potential peak, representing the probability of deviation of the summer maximum from 1 January. Nearly all the potential peaks in our data were assigned a value of δ = 30 days, but a few flatter or ill-defined peaks were assigned values of δ = 50 or 90 days (Fig. 2). Assuming a zero-mean normal distribution for the peak-date uncertainty associated with a legitimate midsummer peak, the value of δ is 1.645σ (σ = standard deviation) (see Supplementary Material at http://www.igsoc.org/hyperlink/14j042supp.docx for details). The assigned probabilities are based on the phase relationships between δ 18O and solute concentration data in a suite of Antarctic ice cores from the WAIS region. In particular, Reference SteigSteig and others (2005) conservatively estimated a peak-date uncertainty of ±1 month. Reference KreutzKreutz and others (1999) also estimate peak-date uncertainty of ±1 month for Siple Dome, West Antarctica. The δ = 90 days uncertainty was chosen as the maximum peak-date error as this would constrain the broadest peaks to lie within the duration of the austral summer.
Uncertainties in the depth–age scale will map directly onto the uncertainties in the accumulation estimates. The suite of cores used here represents a large range in depth– age scale uncertainties, equivalent to the range reported for many cores covering similar time periods. In particular, our cores range in uncertainty from ±1 month (i.e. SEAT-10-5) to ±2 years (i.e. SEAT-10-4). Thus the results presented here provide insight into the range of accumulation uncertainties that can arise from a range in depth–age scale uncertainties, and the results are directly applicable to many other accumulation data.
Probability-generated accumulation
To quantify the uncertainty in accumulation variability and trends, given the peak-identification and peak-date uncertainties, we first consider the original accumulation time series in the light of the estimated dating uncertainties associated with each firn core. These are the accumulation estimates based on the conventionally determined depth–age scale (e.g. assuming the peaks occur each 1 January, and each clear peak represents a single year) as published in Reference BurgenerBurgener and others (2013). We hereafter refer to these data as ‘conventional accumulation’. We then probabilistically generated suites of accumulation series based on the depth– age scale uncertainties. These are hereafter referred to as ‘probability-generated accumulation’.
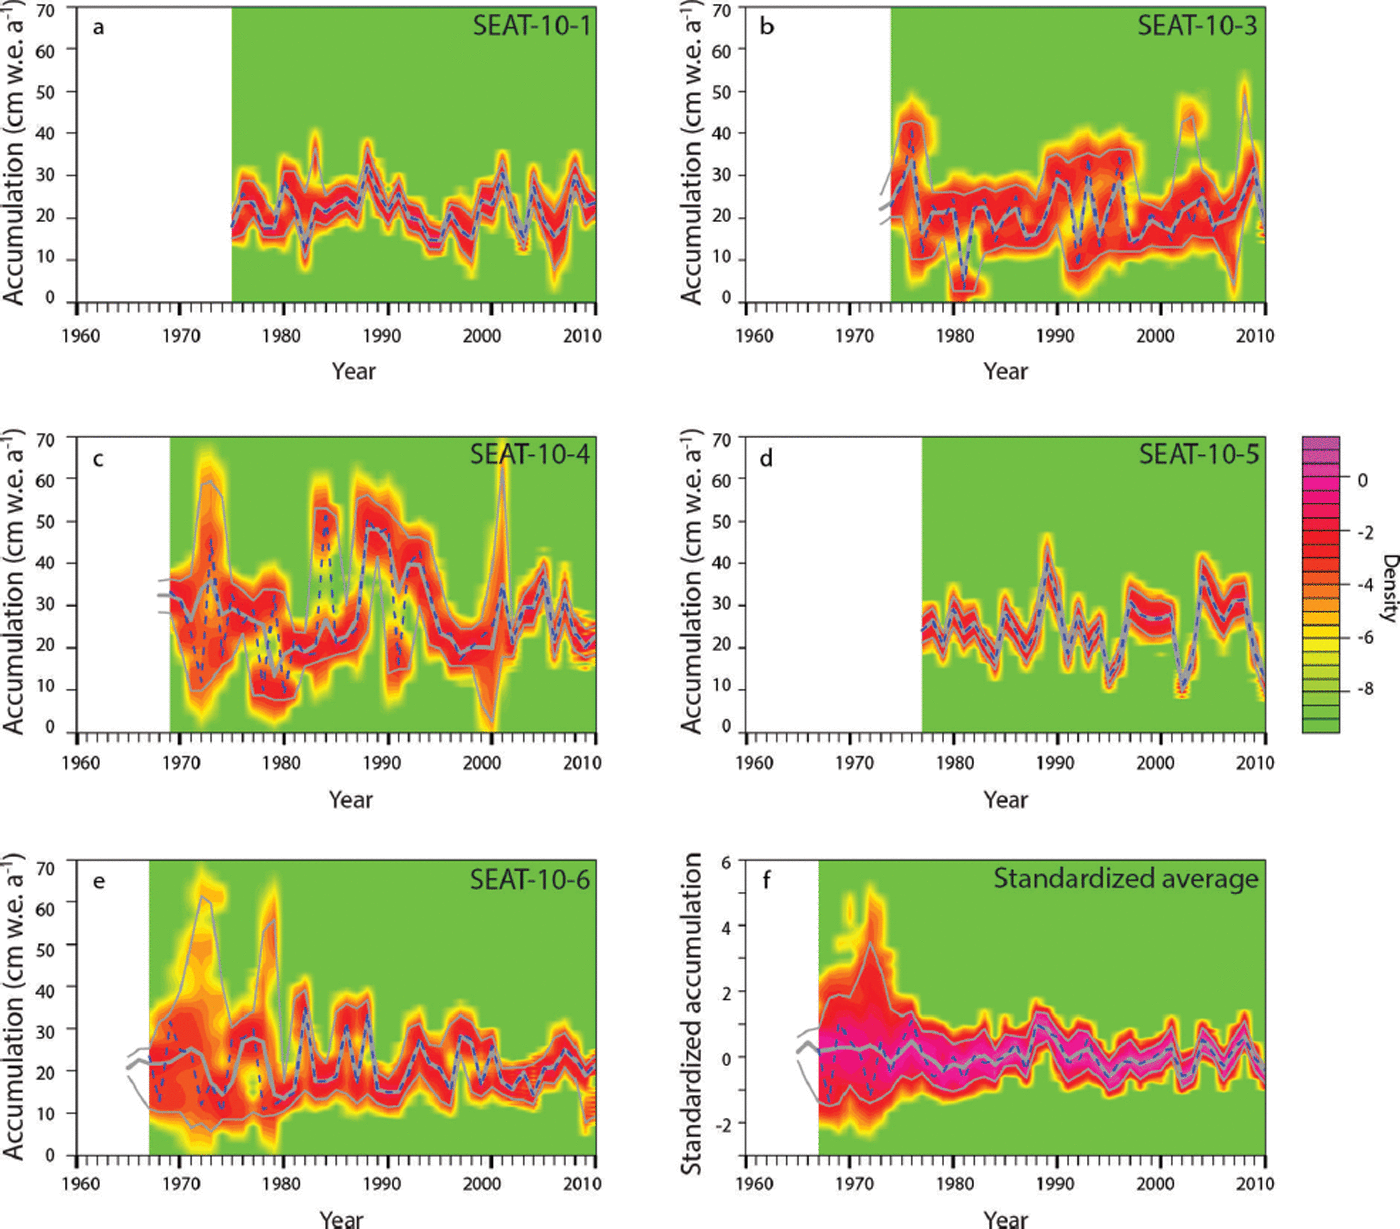
The collection of probability-generated accumulation time series represents the range of reasonable accumulation estimates that might be obtained from the original firn-core data (Fig. 3), as presented by Reference BurgenerBurgener and others (2013). Each simulated accumulation is obtained by randomly drawing new dates associated with each firn-core segment, where the distribution for each random draw depends on the specified peak-identification uncertainty and the peak-date uncertainty (see Supplementary Material at http://www.igsoc.org/hyperlink/14j042supp.docx for the algorithm for probability-generated accumulation). The results are 1000 synthetic data series that retain the fundamental properties of the conventional accumulation time series, but which exhibit a degree of variability that is commensurate with the dating uncertainties.
1000 probability-generated accumulation time series (with no detrending) for each SEAT-10 core (a–e) and the stacked average (f), given defined peak-date and peak-identification uncertainties in the depth–age scales (gray lines). Black curves are the conventional accumulation time series. (Figure modified from Reference BurgenerBurgener and others, 2013.) Note difference in the vertical axis (accumulation) scales.

Analyses of the probability-generated accumulations allow us to evaluate the probability that the observed trends in the conventional accumulations are real. If a sizable fraction (e.g. >5%) of the probability-generated accumulations do not show statistically significant trends, we will be inclined to conclude that an observed significant trend in the conventional accumulation may be a false positive.
To further understand the importance of depth–age scale uncertainties, we also explore how these dating uncertainties affect observed trends and interannual variability in zero-trend accumulation time series. We created flat, or detrended, accumulation series via two different approaches: yearwise detrending and linear detrending of the conventional accumulation series (Figs 4 and 5). In the yearwise detrending approach, we first set the accumulation for each segment so that the summed accumulations within each year were equal to the long-term mean accumulation. This results in an accumulation time series with no interannual variability and no trend. In the linear detrending approach, the overall trend in accumulation was removed, but the interannual variability was retained. The peak-identification and peak-date uncertainties (assuming a normal distribution for the peak-date uncertainty) were then applied to both the yearwise detrended and the linear detrended time series, generating 1000 different probability-generated accumulation series for each detrended time series. (See Supplementary Material at http://www.igsoc.org/hyperlink/14j042supp.docx for further details.) The purpose of this was to create a suite of plausible accumulation series in which any interannual accumulation variability (for the yearwise detrended time series) and overall trends (for both detrended time series) would have to be the result of the uncertainties, and nothing else. For comparison, we also created a suite of probability-generated accumulation series that only accounts for peak-date errors.
Distribution of linearly detrended accumulation time series given peak-date and peak-identification uncertainty for each SEAT-10 core (a–e) and the stacked average (f). The dashed blue line is the linearly detrended accumulation for the core assuming no dating uncertainty (‘the conventional accumulation’). The thick gray line denotes the median of all 1000 probability-generated accumulation time series, and the thin gray lines denote the 2.5th and 97.5th percentiles of accumulation. The density scale for each SEAT-10 core is unitless, and represents the log(probability) of an accumulation measure falling within each of 300 accumulation intervals between 0 and 70 cm w.e. a−1. Multiplying each interval’s probability by the interval width (70/300) and then summing over the 300 intervals yields a sum of 1. The scale for the standardized average of SEAT cores is similar, but is defined over a standardized accumulation between −6 and 14.

Same as Figure 4, but here the dashed blue line is the mean accumulation for the core, which would be the value of the yearwise detrended cores under no dating uncertainty.
Statistical analysis
Using a linear regression model with autocorrelated errors, we calculated linear trends and interannual variabilities for all probability-generated accumulation series and obtained the p-value associated with each trend (slope) estimate. Specifically, we fit an autoregressive error model with up to ten lag parameters, with autoregressive terms selected for inclusion using backward selection. We characterize inter-annual variability using the regression standard deviation. (See Supplementary Material at http://www.igsoc.org/hyperlink/14j042supp.docx for more details.)
Results and Discussion
The results of our statistical analyses show that peak-identification and peak-date uncertainties in depth–age scales can substantially affect estimates of slope and interannual variability in accumulation estimated from firn-core data, and that the magnitude of that effect is determined by both the size of the uncertainties and the location of uncertainties within the core. Figure 3 shows 1000 probability-generated accumulation time series (before detrending) for each of the five SEAT-10 cores, and the stacked average, given both peak-date and peak-identification uncertainties. The blacker, thick line represents the accumulation time series for the depth–age scale assuming no uncertainties, or the conventional accumulation series from Reference BurgenerBurgener and others (2013). Table 1 shows that even after accounting for the full range of possible ways that dating uncertainty could have corrupted the estimated accumulations, it is nearly always the case that the probability-generated accumulation record exhibits a statistically significant downward trend. Only SEAT-10-5 exhibits some notable potential for non-significance, but even then, fully 97% of the probability-generated accumulations associated with SEAT-10–5 were statistically significant. The observed downward trend in accumulation is not a dating-uncertainty-induced false positive, consistent with the results presented by Reference BurgenerBurgener and others (2013).
Percent of probability-generated series with significant (two-sided) test for trend when using the conventional accumulation time series (i.e. before detrending) (table from Reference BurgenerBurgener and others, 2013)

To evaluate the potential of these dating uncertainties to produce a false positive in an observed series that truly has no trend, we consider the detrended accumulation series. In Figure 4, the original firn-core data series are linearly detrended and the probability-generated accumulations from the detrended data are obtained. These new accumulations arising from the detrended data are illustrated in probability density plots for the 1000 possible linearly detrended time series. Here we also plot the median of the probability-generated accumulation series with a thick gray line, and the 95% confidence interval between thin gray lines. The dashed blue line denotes the conventional accumulation series. Figure 5 plots the yearwise detrended data in the same manner, except that the dashed blue line represents the mean, rather than the conventional accumulation series. Note that although the collection of probability-generated accumulations are generally flat, there are some possible accumulation series that could erroneously be interpreted as an exhibition of trend. More detailed analyses of these data follow.
Slope analysis
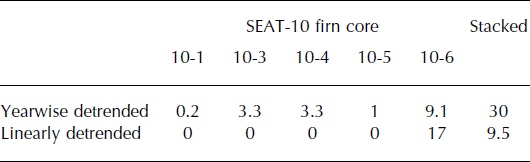
Figure 6a and b show box plots of the slopes in the yearwise and the linearly detrended possible accumulation series, respectively. (Box plots are graphical representations of the data through their quartiles). By definition, the slopes of detrended accumulation series should be zero, but peak-identification and peak-date uncertainties give rise to false, nonzero slopes. Table 2 lists the fraction of probability-generated accumulation series that exhibit statistically significant trends for both types of detrended data. Few of the false trends are statistically significant, but their likelihood increases for the yearwise detrended data and the stacked accumulation series. The yearwise detrended series are more likely to produce statistically-significant false trends simply because they exhibit lower interannual variability. The stacked records are more likely to produce false trends for two possible reasons: (1) peak-identification uncertainty tends to increase with depth, leading to a lever effect in the calculated slopes that is compounded by averaging, and (2) not all cores cover the same period, so fewer cores are averaged during older periods of the stack. Thus, while averaging cores tends to remove small-spatial-scale variability in reconstructed accumulation, the likelihood of spurious trends increases. While few of the false trends are statistically significant, the slopes for the probability-generated accumulation series exhibited notable variability. From the yearwise detrended data, we obtain 1000 different possible slope estimates based on the dating uncertainty characteristics for each core. The central 95% of the 1000 slopes for SEAT-10-6, for example, fall between −0.22 and 0.05 cm w.e. a–2 (the 2.5th and 97.5th percentiles of the distribution). A representative range in the magnitude of accumulation trends reported from modeling and ice-core studies for this region of the central WAIS is 0.05–2 cm w.e. a–2, so our calculated range in slopes due only to depth–age scale uncertainties is of the same order of magnitude as many reported trends (Reference Bromwich, Guo, Bai and ChenBromwich and others, 2004; Reference KaspariKaspari and others, 2004; Reference MonaghanMonaghan and others, 2006a,Reference Monaghan, Bromwich and Wangb; Reference BurgenerBurgener and others, 2013). Because depth–age scale uncertainties can give rise to false trends, the statistical significance of trends needs to account for the depth–age scale uncertainty.
Distribution of the slopes for the 1000 probability-generated (a) yearwise detrended and (b) linearly detrended accumulation time series, accounting for peak-date and peak-identification uncertainties. Circles associated with a box plot denote outliers extending >1.5 times the interquartile range beyond the first and third quartiles.

Percent of yearwise and linearly detrended accumulation time series with significant (two-sided) test for trend
Variability analysis
Several factors can give rise to significant interannual variability in snow accumulation as recorded in firn- and ice-core records. First, interannual variability in accumulation due to climatic variability associated with direct precipitation of snow will obviously give rise to variability in the year-to-year accumulation. This becomes complicated by the various processes that can alter the direct precipitation of snow, such as wind redistribution and sublimation of snow. This is referred to as small-spatial-scale variability, and often results in even closely spaced cores having low correlations. Both the direct precipitation of snow and the small-spatial-scale processes ultimately give rise to the spatial and temporal variability in accumulation at any given location on the ice sheet. However, uncertainty in the depth–age scale will also affect the accumulation record. Here we assess the magnitude of interannual variability that may be due only to depth–age scale uncertainties.
Figure 7 shows box plots for the standard deviation of the accumulation for all 1000 detrended probability-generated accumulation series, for each SEAT core and the standardized accumulation average. Here the yearwise detrended data (Fig. 7a) are most interesting, because all of the scatter in the accumulation is due solely to peak-identification and peak-date uncertainties in the depth–age scale; there is no variability due to physical processes. The interannual variability introduced by accounting for these uncertainties is large. The mean standard deviations for the accumulation ranged between 2 and 5 cm w.e. a–1.The central 95% of the 1000 standard possible deviations for SEAT-10-6, for example, fall between 2.0 and 8.9 cm w.e. a−1. In comparison, the magnitude of the standard deviation in the reported accumulation rates for central WAIS ice cores ranges from 3 to 13.9 cm w.e. a−1 (Reference KaspariKaspari and others, 2004; Reference Genthon, Kaspari and MayewskiGenthon and others, 2006; Reference BurgenerBurgener and others, 2013). Thus it is highly likely that a large fraction of the reported variability in accumulation is due, at least in some cores, to depth–age scale uncertainties.
Same as Figure 6, but for standard deviations instead of slopes.

The interannual variability in accumulation estimated from firn cores is often assumed to be greater than the actual direct precipitation variability due to small-spatial-scale noise, such as wind redistribution of snow (e.g. Reference KaspariKaspari and others, 2004; Reference MonaghanMonaghan and others, 2006a,Reference Monaghan, Bromwich and Wangb). Much effort has gone into characterizing this small-spatial-scale noise in order to better constrain the direct precipitation of snow and the physical processes affecting the net accumulation within a given region (e.g. Reference Van Lipzig, Van Mekjgaard and OerlemansVan Lipzig and others, 2002; Reference LenaertsLenaerts and others, 2012). While small-spatial-scale processes are certainly an important physical mechanism operating in many regions, the results presented here suggest that a significant fraction of the reported interannual variability might also be due to peak-identification and peak-date uncertainty in the depth–age scale. Therefore, if the effects of dating uncertainty on interannual variability of snow are neglected, one may significantly overestimate the influence of wind redistribution of snow, sublimation and other physical processes affecting the accumulation of snow at a given site. This is an important result, because ice-sheet mass-balance modelers often resort to higher-order processes like wind redistribution of snow and sublimation to reproduce high measured interannual variabilities. While these processes do occur, it may not be meaningful to use them in models to better match measured interannual variability that may include large components of measurement uncertainty.
Table 3 illustrates the relative importance of peak-identification and peak-date uncertainty for introducing error into interannual variability estimates. Here we show the percentage of the interannual variability in the yearwise detrended data that is accounted for when only peak-date uncertainty is considered. Table 3 and Figure 7 highlight the result that when peak-identification uncertainty exists in an accumulation series, it dominates the errors that arise in the standard deviations. For example, 100% of the standard deviation in the yearwise detrended SEAT-10-5 record is due to peak-date (i.e. there is no identified peak-identification uncertainty), and the 95% confidence interval in standard deviations is 1–3. SEAT-10-6, by contrast, has the largest peak-identification uncertainty. In this record, peak-date uncertainty only accounts for 16% of the standard deviation, but the 95% confidence interval for the standard deviations is 1–10. Thus, efforts to improve the peak-identification in ice-core data will be most fruitful for minimizing the uncertainty in interannual variability and quantifying the true magnitude of interannual variability in net snow accumulation.
Ratios of the peak-identification variances over the peakidentification-plus-peak-date variances when using the yearwise detrended accumulation time series

Conclusions
Peak- identification and peak-date uncertainties in depth–age scales have to be adequately quantified to place appropriate error bars on accumulation from firn-core data. These types of uncertainties can introduce false, yet statistically significant, trends, and may substantially increase apparent inter-annual variability in accumulation. When depth–age scale uncertainties are large (e.g. SEAT-10-4 in this study), the long-term mean may still be meaningful, but the interannual variability is not. Indeed, peak-date errors alone can account for as much as 50% of the apparent interannual variability in accumulation. Thus better quantification of error in accumulation will provide more reasonable targets for model development and reanalysis data. It will also improve our ability to meaningfully compare ice-core data across different regions of the ice sheet.
For the SEAT-10 cores, strong evidence for a negative trend in accumulation remains even after using the proposed simulation methods for evaluating the potential impacts of dating uncertainty (Reference BurgenerBurgener and others, 2013). Notwithstanding, the use of detrending and simulation makes it readily apparent that the dating uncertainties associated with these cores would have had the potential to produce some incorrect conclusions even if there had been no trend. Analysis of the SEAT-10 data accentuates the importance of rigorous dating uncertainty analyses, particularly since the potential for dating errors is generally not uniformly distributed across the length of the core being analyzed. For example, there is often greater dating uncertainty in the bottom of the core relative to the top of the core. In such cases, inferences about trends will be complicated.
The use of multiple seasonal indicators (e.g. isotopes, solutes and tritium) and stratigraphic markers (e.g. volcanic or bomb-pulse horizons) is known to greatly improve the peak-identification of depth–age scales (e.g. Reference MeeseMeese and others, 1994; Reference SteigSteig and others, 2005; WAIS Divide Project Members, 2013). While these analyses can be time-consuming and costly, the absence of multiple indicators will significantly reduce the reliability of the firn-core accumulation data. Importantly, it is the combination of accurate depth–age scales with a rigorous analysis of the depth–age scale uncertainties that will provide the most meaningful ice-core data for environmental reconstructions, model–data intercomparisons, remote-sensing algorithm development and surface mass-balance estimates of ice sheets.
The general methods and results presented here are not unique to firn-core accumulation. Depth–age scale uncertainties will directly affect both the trends and interannual variability in other firn-core or ice-core data (e.g. isotopes, solutes, etc.). The approach developed here can be applied to any firn-/ice-core record to assess the impacts of depth– age scale uncertainty on trends and variability. Efforts to improve the quantification of depth–age scale uncertainties will also improve our quantification of error in firn-/ice-core data in general.
Acknowledgements
This work was supported by the US National Science Foundation Office of Polar Programs (OPP-094470 to S.R. and OPP-0944653 to R.R.F.) and Geobiology and Low-Temperature Geochemistry Program (EAR-1227215 to B.R.B.), NASA grant (MFRP-NNX11AH11G to B.R.B.), NASA’s Cryospheric Sciences Program (to L.S.K.) and NASA Earth and Space Science Fellowship (to C.M.). We thank the two anonymous reviewers for thoughtful, constructive reviews that helped improve the manuscript.


