


Introduction: Voluntary action and the local context
The role and impact of voluntary action in the United Kingdom is once again on the political and scholarly agenda. The COVID-19 pandemic and the subsequent cost of living crisis highlighted the contribution of voluntary organizations to their communities and gave rise to optimism that those contributions might be expanded (Kruger, Reference Kruger2020). However, there are long-standing concerns that the uneven distribution of voluntary organizations across local areas would limit the ability of voluntary action to reach all communities (Mohan, Reference Mohan and Morvaridi2015; Wolfenden, Reference Wolfenden1978). As John Stuart Mill (Reference Mill and Nathanson1848: 299) pithily surmised: “Charity almost always does too much or too little. It lavishes its bounty in one place, and leaves people to starve in another.”
The uneven distribution of voluntary organizations matters because they provide direct community-level benefits, including the diverse and direct contributions they make to quality of life, supporting disadvantaged or excluded groups, and providing outlets for prosocial activities. There are also contentions that latent benefits for community functioning arise from a strong voluntary sector presence, primarily through the formation of social capital, with the beneficial consequences that are said to flow from it (Sharkey et al., Reference Sharkey, Torrats-Espinosa and Takyar2017). Recognition of these contributions has meant that there is also practitioner interest from policymakers and stakeholders in the importance of the spatial distribution of voluntary organizations because of the contribution they might make to the reduction of regional and local disparities in prosperity and well-being. Drawing on that context, this article is motivated by the need to interleave recent and historical snapshots of voluntary action in a coherent, rigorous manner. Using longitudinal data on charitable organizations across six census periods (1971–2021), we estimate growth trajectories in the number of charities per capita for local authorities across England and Wales. We assess whether the shape of these trajectories is associated with the demographic mix of an area’s residents (e.g., levels of education, or age and ethnic composition) and of its location, including its level of material deprivation, geographic region, and degree of rurality. We examine whether there is substantial variation in the level and shape of these trajectories across local authorities or whether there is a “national” trajectory for the development of voluntary organizations in the United Kingdom. Our findings suggest that the latter is the case: charity density grew rapidly from 1971 to 2001, followed by a noticeable plateau and decline to 2021, with this trend consistent across almost all local authorities. In addition, we reveal enduring and widening equalities in the level of charity density across local authorities, and minimal relative movement of areas up or down the distribution. Our findings suggest that spatial inequalities in the distribution of charitable organizations are substantial and persistent, which raises important questions about how far these inequalities might be modified, whether through public policy or through private initiative.
We first describe theoretical explanations for unevenness in the distribution of voluntary organizations across geographic contexts, followed by a review of important empirical work on this topic. We then consider issues of data and method before presenting the main empirical findings. We situate these findings in the context of prior theoretical and empirical contributions before concluding with a consideration of the implications for policy and practice, against the background of public policy concerns about enduring spatially concentrated disadvantage in the United Kingdom.
Theoretical foundations: Variation in voluntary activity and its implications
Voluntary organizations, of which charities are a significant subset, are often defined using the Structural-Operational definition developed by Lester Salamon and colleagues: they are formally constituted, nonprofit distributing, autonomous, and therefore not controlled by state entities, and they benefit from significant voluntary contributions of time and money from their unpaid board members (trustees), volunteers, and donors (Salamon & Anheier, Reference Salamon and Anheier1992). In the United Kingdom, registered charities form the largest component of the organizational base of the voluntary sector. Their emergence of a voluntary sector, at the national and local levels, is often explained with reference to classical demand and supply-side theories. The former posit that the government or market undersupplies public goods and services in an area and thus there is latent demand from the populace that voluntary organizations can satisfy—especially when it comes to services for issues that affect minority groups (Hansmann, Reference Hansmann, Powell and Steinberg1987; Weisbrod, Reference Weisbrod and Phelps1975). These demand-side theories are framed as market or government failures. Supply-side theories contend that organizational formation is contingent on the availability of sufficient “enabling resources” in an area, such as a pool of willing and able volunteers and founders, or diverse and adequate funding sources (James, Reference James and Powell1987; Musick & Wilson, Reference Musick and Wilson2008). Interdependence theory contends there is a symbiotic relationship between government and the voluntary sector: the former recognizes and leverages the value of these organizations in addressing social needs, whereas the latter depends on government for sufficient resources and legitimacy (Mayer, Reference Mayer2024; Salamon, Reference Salamon1987). The supply-side perspective thus provides a strong basis for expecting unevenness in the distribution of voluntary organizations according to compositional differences in socioeconomic resources, especially the availability of government funding and donations (Logan & Molotch, Reference Logan and Molotch1987) and volunteers/social entrepreneurs (James, Reference James and Powell1987). For example, deprived areas may struggle to generate sufficient financial capital to sustain a thriving voluntary sector, while also lacking a pool of individuals with the capacity to engage consistently and intensively in voluntary work.
These frameworks are complemented by deficiencies in the operational form and logic of voluntarism. Voluntary failure theory (Salamon, Reference Salamon1987) describes two of these as “resource insufficiency” (the inability of a voluntary organization to generate and sustain sufficient operating resources) and “philanthropic particularism” (the disjuncture between the preferences of voluntary organization founders/trustees and “priority” areas of need). However, rather than considering these as flaws, Toepler (Reference Toepler2023) argues that they represent drivers for increased collaboration between the voluntary sector and government (interdependence theory). For example, resource insufficiency can be addressed by targeted government funding and policy programs (e.g., initiatives aimed at the regeneration of areas of concentrated disadvantage), while philanthropic particularism can be tempered by government stipulating fair access to voluntary goods and services (e.g., through charitable or equalities law).
Finally, ecology theories posit that the organizational environment in which voluntary organizations operate shapes the size and sustainability of local voluntary sectors (i.e., their density). These theories argue that organizations are exposed to environmental selection pressure in the form of competition for resources and search for legitimacy, which in turn influences the number of organizations that can be “carried” or present in a field or community (Carroll & Hannan, Reference Carroll and Hannan2000; Hannan & Freeman, Reference Hannan and Freeman1989). For example, Mayer (Reference Mayer2025) demonstrated how nonprofit foundation and dissolution rates change in response to shifts in density of these organizations within U.S. counties. Organizational ecology theory potentially explains why some areas have higher levels and growth rates of voluntary organizations than others.
If inequalities are to be expected, do they matter? There are important consequences for voluntary organizations themselves (Crubaugh, Reference Crubaugh2021; Mayer, Reference Mayer2023, Reference Mayer2025): their prospects of survival are influenced by geographical context. In a comparison of more disadvantaged versus more prosperous areas, rates of charity formation are lower, and the risk of charity dissolution is higher, in more deprived areas (Clifford, Reference Clifford2018). Therefore, inequalities in the distribution of these organizations are enduring and sustained through reinforcing processes of foundations and dissolutions that are shaped by the local context. Inequalities affect the ability of local populations to access goods and services provided by voluntary organizations. Voluntary organizations contribute directly to the “mixed economy of welfare” (Billis & Glennerster, Reference Billis and Glennerster1998), they serve marginalized groups whose needs are not well met by mainstream programs (Musick & Wilson, Reference Musick and Wilson2008), and they offer opportunities for volunteering and social entrepreneurship (Ben-Ner & Van Hoomissen, Reference Ben-Ner and Van Hoomissen1992).
A strong presence of such organizations also provides latent benefits to communities. First, it influences citizen engagement in voluntary action—there are small, but statistically significant, positive associations between the distribution of nonprofit organizations and the likelihood of volunteering (Deri-Armstrong et al., Reference Deri-Armstrong, Devlin and Seifi2023; Mohan & Bennett, Reference Mohan and Bennett2019; Rotolo & Wilson, Reference Rotolo and Wilson2012). Second, in Sampson’s (Reference Sampson2012) major study of neighborhood development in Chicago, variations in the distribution of nonprofit organizations were seen as part of a community’s infrastructure, linking individuals together in unintended ways that enhanced tasks oriented toward the public good, such as mobilizing claims for resources from city government (Sampson, Reference Sampson and Demeulenaere2011). Third, the stability of the distribution of nonprofit organizations over time was consistent with Sampson’s (Reference Sampson2012) wider arguments that neighborhoods are durable features of the social fabric. Thus, dense networks of voluntary organizations help create spaces for political association and activism, shaping access to government support and services, and encouraging community responses to social problems, thereby strengthening collective efficacy (Billis & Glennerster, Reference Billis and Glennerster1998; Brandtner & Dunning, Reference Brandtner, Dunning, Powell and Bromley2020; Clifford, Reference Clifford2021; Crubaugh, Reference Crubaugh2021; Sharkey et al., Reference Sharkey, Torrats-Espinosa and Takyar2017). In summary, there is a growing appreciation of the value of adopting a spatiotemporal perspective when studying voluntary organizations and their environmental conditions (Macindoe & Oakley, Reference Macindoe and Oakley2023; Mayer, Reference Mayer2023, Reference Mayer2024).
Empirical evidence: the extent and predictors of variation in voluntary activity
These theoretical predictions have borne out in studies of voluntary sectors in many countries. In the United Kingdom, there are sizeable and enduring differences in the numbers of charitable organizations between and within local government areas (Clifford, Reference Clifford2012, Reference Clifford2018; McDonnell et al., Reference McDonnell, Mohan and Norman2020), with similar findings derived from studies in the United States and South America (da Costa, Reference da Costa2016; Dalvi et al., Reference Dalvi, Mainardes and Sepulcri2024; Mayer, Reference Mayer2023; Peck, Reference Peck2008; Wo, Reference Wo2018). What drives these observed inequalities? The level of social need or material deprivation in an area is predicted to have a substantial effect on the number of voluntary organizations present or operating there. The evidence is mixed but tends toward supporting supply-side theories of emergence: on average, there are more organizations present in affluent than deprived areas. This relationship is often nonlinear, with a number of studies revealing a relationship with a convex functional form between deprivation/need and voluntary organization density. In other words, the most deprived areas have higher levels of organizations than their slightly less deprived counterparts, but lower levels compared with the most affluent areas (Clifford, Reference Clifford2018; McDonnell et al., Reference McDonnell, Mohan and Norman2020). Studies that find that density increases as deprivation worsens tend to be focused on specific subsectors, such as antipoverty nonprofits (Yan et al., Reference Yan, Guo and Paarlberg2014; see also Peck, Reference Peck2008). Other studies point to more complex and ambiguous connections between voluntary organization density and social need. For example, indicators of need (unemployment and poverty), ethnic diversity, and income inequality were not always associated with nonprofit density in a consistent manner, and some nonlinear relationships were also found (da Costa, Reference da Costa2016; Van Puyvelde & Brown, Reference Van Puyvelde and Brown2016; Wo, Reference Wo2018; Wu, Reference Wu2021). Zhulke (Reference Zhulke2022) argues that the mixed evidence on the association between demand and supply-side factors and nonprofit density reflects a deficiency in theoretical and methodological framing: studies either do not test the association of both types of factors in the same study, or, when they do, they fail to link or interact these factors.
Pluralist political theory and supply-side nonprofit research suggest that dissatisfied citizens do not have an equal ability to start, seek out, or provide nonprofit services due to the unequal distribution of group resources… Thus, nonprofit service provision is simultaneously determined by both supply-side (i.e., resources) and demand-side (i.e., demand heterogeneity) factors. (Zhulke, Reference Zhulke2022, p. 458; see also Pennerstorfer et al., Reference Pennerstorfer, Pennerstorfer and Neumayr2024)
This article makes a distinctive contribution by estimating and explaining the growth process that produces uneven patterns in voluntary organization density across local areas. By combining longitudinal data and latent growth-curve models, we show, for the first time, how the density of charitable organizations has developed over a 50-year period in England and Wales overall and for each local authority specifically. We achieve this by specifying two research questions. First, do local authorities differ significantly in their charity density trajectories over time? Second, what factors determine the level and trend in these trajectories? There are very few analyses of how density changes over time and whether there is spatial variation in this change, yet such work can reveal local contexts where growth in charity density is particularly strong or weak, and thus whether inequalities have worsened or improved over time.
Data and method
We focus on charitable organizations that, at some point in their history, have been formally registered with the Charity Commission of England and Wales (“The Commission”). Charities are a subset of the voluntary sector that—in addition to being formal, nonprofit distributing, autonomous, and benefitting from voluntary contributions (Salamon & Anheier, Reference Salamon and Anheier1992)—must operate for public benefit to possess charity status. We use a recent version of the Charity Register that provides a census of charities registered in England and Wales between 1961 and 2021 inclusive (N = 336,193). The register contains information on year of registration and deregistration, geographic scale of activity, and registered office address and postcode. Information on field of activity (e.g., Social Services and Education) is drawn from the UK Charity Activity Tags project and linked deterministically via registered charity number. Using the National Statistics Postcode Lookup (May 2022) file, we identify the local authority a charity’s postcode is in and create summary measures of charitable activity for each local authority and registration year: the number of charities present at the beginning of each year (a); the number of new charities registered that year (b); the number of existing charities de-registered that year (c); and finally the total number of charities present at the end of the year (d = a + (b − c)). We exclude observations for the City of London (which is one of the 33 local authorities in the greater London area). This local authority is geographically (1.12 square miles) and demographically (population size <10 k) small but has several thousand registered charities: many of these organizations do not operate in the City of London and are in many cases long-established grant-making trusts registered through solicitors’ offices. Thus, their presence is driven by different foundation and dissolution processes than in other local authorities. Moreover, the City of London’s distinctive history (as an administrative unit strongly associated with the financial district with which it shares a name) and organizational structure (it does not share the same functions as all other local authorities and, highly unusually, has its own police force) mean that it is defensible to exclude it from this analysis.
Sociodemographic data for each local authority have been obtained from the six censuses from 1971 to 2021 in England and Wales. To account for boundary changes for administrative areas over time, the data are adjusted to a common set of spatial units (Norman et al., Reference Norman, Rees and Boyle2003)—the 2021 definition of the local authorities. Previous repositories of consistent variables over time in terms of both definition and geography have been updated to 2021 and extended to include additional variables than were previously available (Lloyd et al., Reference Lloyd, Catney, Noble, McLennan and Norman2022; Norman, Reference Norman2016, Reference Norman2017; Norman et al., Reference Norman, Lloyd, McLennan, Ferguson and Catney2024).
The data on charities and local authorities are linked using local authority geocodes. The result is a balanced panel containing 1,980 observations across six census periods for 330 local authorities in England and Wales. We then calculate our outcome of interest, charity density, as the number of charities per 1,000 residents for a given local authority and census year. Our key covariates are the level of deprivation in a local authority, measured using the Townsend Score, the degree of rurality, UK region, ethnic composition, and level of education. The Townsend Score is a long-established composite measure comprising four variables that capture different aspects of disadvantage, measured for geographical areas. They are the proportions experiencing unemployment (signaling lack of material resources and insecurity), overcrowding (an indicator of living conditions), lack of owner-occupied accommodation (a proxy for household wealth), and lack of car ownership (a proxy indicator of income). These have been available consistently over time in the UK census since 1971. The index is a Z-score, in which where a value of zero represents a local authority with a mean level of material deprivation, above zero identifies more deprived areas relative to mean deprivation, and below zero identifies more affluent areas relative to mean deprivation (cf. McDonnell et al., Reference McDonnell, Mohan and Norman2020). Rurality is operationalized as an ordinal categorical measure of the number of persons per hectare (“Most Urban,” “Very Urban,” “Urban,” “Rural,” and “Most Rural”)—previous studies have shown that rural/urban differences in density are expected, and including this measure alleviates some of the confounding that can occur between density and material deprivation (Clifford, Reference Clifford2012; da Costa, Reference da Costa2016); UK region, measured using the International Territorial Levels classification (“North East,” “North West,” “Yorkshire and The Humber,” “East Midlands,” “West Midlands,” “East of England,” “London,” “South East,” “South West,” and “Wales”); ethnic composition, measured as the percentage of non-White individuals (non-British Isles born in 1971 and 1981, and non-White ethnicity 1991 onwards); and level of education, measured as the percentage of individuals with the highest level of educational qualification (i.e., degree). Population structures, such as ethnic, educational, and educational diversity, have consistently been found to be associated with levels of voluntary or civic activity (Borkowska et al., Reference Borkowska, Kawalerowicz, Elgenius and Phillimore2024; Grønbjerg & Paarlberg, Reference Grønbjerg and Paarlberg2001; Kim, Reference Kim2015). Note that we cannot produce more granular measures of ethnic diversity because of changes in the way this is reported in the census over time.
Our aim is to analyze long-run trends in charity density from 1971 to 2021, with a particular focus on variation in these trends between local authorities as a function of their characteristics. We use growth-curve models in a multilevel modeling framework to estimate the average change in charity density across the census periods, as well as local authority-level differences in this change. These models account for (i) how units of analysis change over time and (ii) between-unit differences in change simultaneously (Singer & Willett, Reference Singer and Willett2003). There have been recent calls for increased applications of these methods in nonprofit and voluntary research (see, e.g., Zhao et al., Reference Zhao, Galaskiewicz and Yoon2022). Growth-curve models have two main factors: an intercept (e.g., baseline level of charity density) and slope (e.g., rate of change in charity density over time; Curran et al., Reference Curran, Obeidat and Losardo2010). They are a specific application of the random-coefficients multilevel model where the coefficient of time (e.g., census year) is allowed to vary randomly between units (e.g., local authorities; Rabe-Hesketh & Skrondal, Reference Rabe-Hesketh and Skrondal2022). The growth-curve model for charity density is specified as follows:
 $$ y_{it}={\displaystyle \begin{array}{l}{\beta}_{0}+{\beta}_{1}{period}_{it}+{\beta}_{2}{period}_{it}^{2}+{\beta}_{3}{town}_{it}+{\beta}_{4}{town}_{it}^{2}\\
+\quad {\beta}_{5}{educ}_{it}+{\beta}_{6}{nonwhite}_{it}+{\beta}_{7}{region}_{i}+{\beta}_{8}{rurality}_{i}\\
+\quad {\mu}_{0i}+{\mu}_{1i}{period}_{it}+{\varepsilon}_{it},\end{array}} $$
$$ y_{it}={\displaystyle \begin{array}{l}{\beta}_{0}+{\beta}_{1}{period}_{it}+{\beta}_{2}{period}_{it}^{2}+{\beta}_{3}{town}_{it}+{\beta}_{4}{town}_{it}^{2}\\
+\quad {\beta}_{5}{educ}_{it}+{\beta}_{6}{nonwhite}_{it}+{\beta}_{7}{region}_{i}+{\beta}_{8}{rurality}_{i}\\
+\quad {\mu}_{0i}+{\mu}_{1i}{period}_{it}+{\varepsilon}_{it},\end{array}} $$
where y represents the level of charity density in local authority i for census period t, B0 the mean level of charity density in 1971, B1 the mean linear change in charity density over time, B2 the mean curvilinear change in charity density over time, B3 the mean linear change in charity density for a one-unit increase in material deprivation, B4 the mean curvilinear change in charity density for a one-unit increase in material deprivation, B5 the mean difference in charity density for a one-unit change in the percentage of non-White individuals, B6 the mean difference in charity density for a one-unit change in the percentage of individuals with the highest level of qualification, B7 the mean differences in charity density for regions outside of London, B8 the mean differences in charity density for areas that are not classified as “Most Urban,” u0 the difference between mean level of charity density in 1971 (B0) and the level for local authority i in 1971 (random intercept for each local authority), u1 the difference between the mean linear change in charity density over time (B1) and the linear change for local authority i (random slope for each local authority), and e the difference between observed and predicted charity density in local authority i for census period t.
Results
The mean level of charity density across the census periods is 2.71 charities per 1,000 residents (SD = 1.64), with a few local authorities with very high levels relative to the mean (>15 per 1,000 residents). The typical local authority is slightly affluent relative to its peers across the census periods. There is considerable variation across local authorities in the percentage of individuals with the highest education qualifications and in the percentage of non-White individuals. Most local authorities are classed as rural across the census periods (65%). Table 1 presents a summary of local authority characteristics.
Summary statistics for outcome and covariates

Table 1. Long description
The table contains seven columns. The first column lists variables and subgroups. The next six columns provide summary statistics. For continuous variables: Charity density has N 1,980, median 2.34, mean 2.71, S D 1.64, minimum 0.28, maximum 19.22. Townsend score has N 1,980, median minus 0.36, mean minus 0.02, S D 3.12, minimum minus 5.78, maximum 12.41. Percent of individuals with highest educational qualification has N 1,980, median 12.62, mean 16.54, S D 12.06, minimum 1.13, maximum 62.77. Percent of non-White individuals has N 1,980, median 3.24, mean 7.05, S D 10.08, minimum 0.10, maximum 68.57. For categorical variables, urban/rural classification is subdivided: Most urban N 277, 13.99 percent; Very urban N 98, 4.95 percent; Urban N 299, 15.10 percent; Rural N 1,086, 54.85 percent; Most rural N 220, 11.11 percent. U K region is subdivided: North East N 72, 3.64 percent; North West N 234, 11.82 percent; Yorkshire and The Humber N 126, 6.36 percent; East Midlands N 210, 10.61 percent; West Midlands N 180, 9.09 percent; East of England N 270, 13.64 percent; London N 192, 9.7 percent; South East N 384, 19.39 percent; South West N 180, 9.09 percent; Wales N 132, 6.67 percent. All figures are rounded to two decimal places.
Note: Figures rounded to two decimal places.
There is clear evidence that local authorities differ in their levels of charity density across the census periods and that density also varies over time within local authorities. Figure 1 suggests that there has been growth in the typical level of charity density over time (horizontal line in each box plot), while the range of values has also increased (indicated by how far apart the vertical ends of each box plot).
Distribution of charity density by year. Note: Outliers not shown to aid legibility.

Fig. 1. Long description
The box plot has six boxes, each corresponding to a year: 1971, 1981, 1991, 2001, 2011, and 2021, arranged left to right on the x axis. The y axis is labeled Number of charities per 1000 residents, ranging from 0 to 8. For 1971, the box spans roughly 1 to 2.5 with a median near 1.5 and whiskers from about 0.5 to 4. For 1981, the box spans about 1.2 to 3 with a median near 2, whiskers from about 0.7 to 5. For 1991, the box spans about 1.5 to 3.5 with a median near 2.5, whiskers from about 0.8 to 6. For 2001, the box spans about 2 to 4.5 with a median near 3, whiskers from about 1 to 7.5. For 2011, the box spans about 1.7 to 3.7 with a median near 2.5, whiskers from about 0.7 to 6.5. For 2021, the box spans about 1.5 to 3.5 with a median near 2.5, whiskers from about 0.7 to 6.5. The median and spread increase from 1971 to 2001, then decrease slightly through 2021. Outliers are not shown.
Estimating charity density growth trajectories
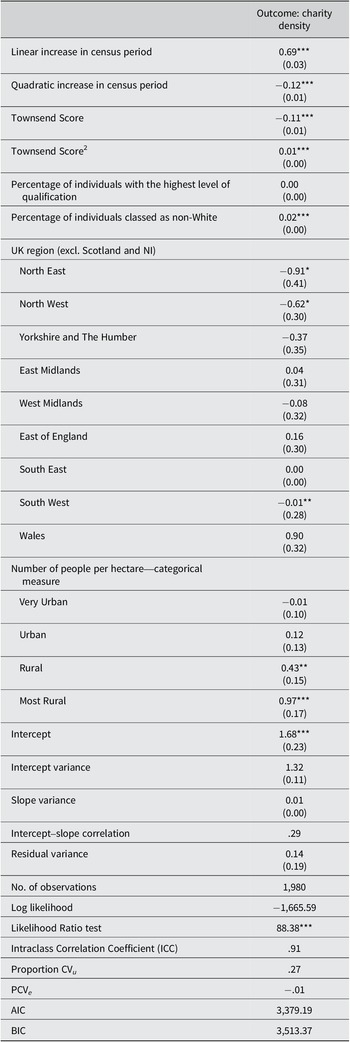
Table 2 presents the results of a growth-curve model that tests the explanatory value of our covariates of interest. The model is estimated on a consistent sample of 1,980 observations for 330 local authorities with no missing values for the outcome and covariates. Alternative models, specifications, and post-estimation results are available in the Supplementary Material. The positive coefficient for a linear increase in time combined with a negative coefficient for a quadratic increase suggests that the relationship between charity density and time is curvilinear (concave) in its functional form: there was substantial initial growth, which slowed down in 2001 and begun to reverse in 2011. The relationship between deprivation and charity density is similar but the inverse functional form (convex): the level of charity density decreases as local authorities become more deprived, with a slight correction in this trend for the most deprived areas. The effect is similar whether we compare local authorities with different levels of deprivation or track individual local authorities becoming more or less deprived over time. There is a small expected increase in charity density for a one-unit change in the percentage of individuals classed as non-White; there is no observed association between the percentage of individuals with highest level of qualification and charity density. There are considerable regional disparities in density: relative to London, the North East, North West, and Wales have noticeably lower levels of charity density, whereas the South West has higher levels. These patterns, to some degree, reflect the longer inheritance of communities in London and the south and east of England, in contrast to, say, mining districts in northern England and Wales, where some settlements have existed for barely a century. Finally, we test Zhulke’s (Reference Zhulke2022) conditional demand heterogeneity hypothesis by interacting material deprivation with ethnic and educational characteristics: we find no support for this hypothesis but acknowledge that we do not have the same demand and supply-side measures in our model.
Growth-curve regression model for charity density

Table 2. Long description
Starting from the top, the table presents model terms in the left column and corresponding coefficients with standard errors in the right column. For census period, linear increase is 0.69 triple asterisk with standard error 0.03, quadratic increase is minus 0.12 triple asterisk with standard error 0.01. Townsend Score is minus 0.11 triple asterisk with standard error 0.01, Townsend Score squared is 0.01 triple asterisk with standard error 0.00. Percentage of individuals with the highest level of qualification is 0.00 with standard error 0.00. Percentage of individuals classed as non-White is 0.02 triple asterisk with standard error 0.00. For U K region, excluding Scotland and Northern Ireland, North East is minus 0.91 asterisk with standard error 0.41, North West is minus 0.62 asterisk with standard error 0.30, Yorkshire and The Humber is minus 0.37 with standard error 0.35, East Midlands is 0.04 with standard error 0.31, West Midlands is minus 0.08 with standard error 0.32, East of England is 0.16 with standard error 0.30, South East is 0.00 with standard error 0.00, South West is minus 0.01 double asterisk with standard error 0.28, Wales is 0.90 with standard error 0.32. For number of people per hectare, Very Urban is minus 0.01 with standard error 0.10, Urban is 0.12 with standard error 0.13, Rural is 0.43 double asterisk with standard error 0.15, Most Rural is 0.97 triple asterisk with standard error 0.17. Intercept is 1.68 triple asterisk with standard error 0.23, intercept variance is 1.32 with standard error 0.11, slope variance is 0.01 with standard error 0.00, intercept–slope correlation is 0.29, residual variance is 0.14 with standard error 0.19. Number of observations is 1,980. Log likelihood is minus 1,665.59. Likelihood Ratio test is 88.38 triple asterisk. Intraclass Correlation Coefficient is 0.91. Proportion C V sub u is 0.27. P C V sub e is minus 0.01. A I C is 3,379.19. B I C is 3,513.37. Significance codes are triple asterisk for p less than .001, double asterisk for p less than .01, single asterisk for p less than .05.
Note: ICC, intraclass correlation coefficient. AIC, Aikaike Information Crierion. BIC, Bayesian Information Criterion. *** = p < .001, ** = p < .01, * = p < .05
The growth-curve model allows us to go beyond revealing associations between the covariates and the outcome. We observe a positive, moderate correlation between the local-authority and census-period random effects (rho = .29, p < .001); that is, local authorities with higher than average levels of charity density in 1971 had higher than average linear rates of growth over time, suggesting a growth advantage arising from higher initial density. The intraclass correlation (ICC), also known as the variance partitioning coefficient, is a measure of how much unexplained variation in the outcome lies in unobserved differences between clusters/groups. The ICC is .91, suggesting that almost all of the unexplained variation in charity density is accounted for by unobserved differences between local authorities. This is unsurprising, given there is only one local authority-level, time-invariant covariate in the model (region) and thus potentially many other unobserved factors that could explain why local authorities differ in their levels of charity density. An example might be levels of public expenditure across local authority areas, which are impossible to track over time because of changes in the functional responsibilities of local authorities over time as well as because of administrative reorganizations. The low-residual level-1 variance in the models indicate that the predicted growth trajectories are reasonable summaries of how charity density changes within local authorities over time.
We use the model to predict the average growth curve for all local authorities, as well as the specific trajectory for each local authority (individual blue lines in Figure 2). The predicted shape of the trajectories is homogenous across local authorities and mirrors the overall trends, even though the model allows the rate of change in charity density to vary across local authorities. Only a small number of local authorities have experienced consistent increases in charity density across the period (particularly the areas with the highest levels of density). However, there are substantial differences in the level of charity density across areas: that is, local authorities have very different initial positions, which are sustained over time due to a common rate of change. Figures 3– 5 present the predicted trajectories by 1971 quintiles of the Townsend Score (i.e., areas’ initial level of deprivation), region, and rurality, respectively. The shape of the trajectory is homogenous across deprivation profiles, but there are marked differences in the level of charity density: the least (quintile 1) and most (deprived) areas have the lowest levels of density, with higher levels observed for the middle group of local authorities. Such differences in levels rather than trends are seen in the predicted curves by region and rurality: the exception appears to be the most rural local authorities, where the predicted curve does not decline in the most recent period. This is likely a function of lower levels of immigration to these areas rather than any substantial increase in the number of charities founded.
Predicted growth trajectories for each local authority and overall.

Fig. 2. Long description
The x-axis is labeled Census year, ranging from 1971 on the left to 2021 on the right. The y-axis is labeled Number of charities per 1000 residents, ranging from 0 at the bottom to 15 at the top. Many thin blue lines represent individual local authority growth trajectories, starting near the bottom left and trending upward with varying slopes, some reaching above 15 by 2021. A single thick orange line, labeled Typical Growth Trajectory, runs through the middle of the blue lines, showing a gradual increase from about 3 in 1971, peaking just above 5 around 2001, and then slightly declining toward 2021. The legend at the bottom identifies blue as LA Growth Trajectories and orange as Typical Growth Trajectory.
Predicted growth trajectories by deprivation quintile. Note: 1 = least deprived quintile (1971); 5 = most deprived quintile (1971).

Fig. 3. Long description
The layout consists of five line graphs, each labeled with a quintile number. The x-axis in all panels is census year, marked at 71, 81, 91, 01, 11, and 21. The y-axis is number of charities per 1000 residents, ranging from 1 to 4. Panel 1 (top left, least deprived) starts near 1 in 1971, rises to just above 2 by 2001, then declines slightly by 2021. Panel 2 (top center) starts near 1.5, peaks above 2.5 in 2001, then declines. Panel 3 (top right) starts near 1.5, peaks near 3 in 2001, then declines. Panel 4 (bottom left) starts near 2, peaks above 3 in 2001, then declines. Panel 5 (bottom right, most deprived) starts near 1.5, peaks near 2.5 in 2001, then declines. All panels show a similar pattern: steady increase from 1971 to 2001, followed by a decline to 2021. The y-axis maximum is higher for more deprived quintiles.
Predicted growth trajectories by UK region.

Fig. 4. Long description
There are ten panels, each labeled with a U K region: North East, North West, Yorkshire and The Humber, East Midlands, West Midlands, East of England, London, South East, South West, and Wales. All panels have the same axes: X axis is census year, labeled 71, 81, 91, 01, 11, 21; Y axis is number of charities per 1000 residents, ranging from 0 to 4. In each panel, the line starts low in 1971, rises to a peak around 2001, then declines slightly by 2021. The South West shows the highest peak, reaching above 4 charities per 1000 residents. London and Wales have lower peaks, not reaching 3. All regions follow a similar convex trajectory, with the rise occurring between 1971 and 2001, and a mild decline or plateau after 2001.
Predicted growth trajectories by rurality.

Fig. 5. Long description
Top row, from left to right: Most Urban, Very Urban, Urban. Bottom row: Rural, Most Rural. Each panel plots number of charities per 1000 residents on the y axis, census year from 1971 to 2021 on the x axis. In all panels, the line rises from 1971, peaks around 2001, then declines or plateaus by 2021. Most Urban starts near 1.5, peaks just above 3, then drops slightly. Very Urban starts near 1.5, peaks near 3.5, then declines. Urban starts near 1.5, peaks just above 2.5, then declines. Rural starts near 2, peaks near 3, then declines. Most Rural starts near 2.5, peaks near 4, then plateaus. The highest peak is in the Most Rural panel, the lowest in Urban.
Do trajectories vary by charity type? We can classify charities by whether they operate solely within a single local authority. This partly ameliorates the “headquarters effect,” whereby charity activity is underestimated due to issues identifying organizations that operate outside the area they are in registered in. Figures 6 and 7 for local and nonlocal (i.e., regional, national, or overseas) charities. The results for local charity density mirror those for the charity sector overall (unsurprising given this is the most common scale of operation for UK charities), but there is evidence that nonlocal charity density has not suffered a similar decline since 2001 and in a number of local authorities has continued to grow.
Predicted growth trajectories for local charities.

Fig. 6. Long description
The x axis lists census years from 1971 to 2021. The y axis measures number of local charities per 1000 residents, ranging from 0 to 8. Many thin blue lines represent individual local authority growth trajectories, most starting near 2 and rising gradually, with some diverging upward or downward over time. A single thick orange line labeled Typical Growth Trajectory starts near 2, rises steadily to a peak just above 2.5 around 2001, then declines slightly through 2021. The blue lines show considerable variation, but most follow a similar upward then slightly downward pattern as the orange line. The legend at the bottom identifies blue as LA Growth Trajectories and orange as Typical Growth Trajectory.
Predicted growth trajectories for regional, national, or overseas charities.

Fig. 7. Long description
The x-axis is labeled Census year, ranging from 1971 to 2021. The y-axis is labeled Number of non-local charities per 1000 residents, ranging from 0 to 15. Multiple blue lines represent L A Growth Trajectories for different regions, all showing a steady upward trend over time. An orange line labeled Typical Growth Trajectory runs below most blue lines, also increasing but at a lower rate. The blue lines diverge, with the highest reaching above 13 by 2021 and the lowest remaining near 2. The legend at the bottom identifies blue as L A Growth Trajectories and orange as Typical Growth Trajectory.
Finally, we estimate growth trajectories for the five most common “vertical” fields of charitable activity. There is a great deal more variability in typical trajectories across fields of activity, as well as between local authorities within a given field (identified by a “fanning out” of the trajectories over time). The density of Education and Social Services charities has increased over time, the former smoothly and the latter in an uneven fashion (Figure 8). The Culture and Recreation, Housing, and Religious fields mirror the overall charity density trends shown in Figure 2.
Predicted growth trajectories by field of charitable activity.

Fig. 8. Long description
From top left, the first panel is Culture and Recreation. The x-axis is labeled Census year, ranging from 1971 to 2021. The y-axis is labeled Number of charities per 1000 residents, ranging from 0 to 2. Multiple blue lines labeled L A Growth Trajectories show upward trends, with one orange line labeled Typical Growth Trajectory running below most blue lines. The second panel, top right, is Education, with similar axes but the y-axis maximum is 1.5. Blue lines show upward trends with some inflection around 2001, and the orange line remains below the blue cluster. The third panel, bottom left, is Housing, Community and Economic Development, with axes matching the first panel. Blue lines show moderate upward trends, orange line is lower. The fourth panel, bottom right, is Social Services, with y-axis maximum at 1. Blue lines show a sharp increase around 2001, then plateau, orange line follows a similar but lower pattern. The fifth panel, bottom center, is Religious, with axes as in the first panel. Blue lines show gradual upward trends, orange line is consistently lower. All panels include legends for L A Growth Trajectories and Typical Growth Trajectory.
Discussion
The spatiotemporal distribution of voluntary organizations is an increasing concern of scholars and policymakers (Mayer, Reference Mayer2023). This article examines changes in the level and trend of charity density for 330 local authorities in England and Wales over a 50-year period (1971–2021). Our results inform the literature on strengthening civil society and supporting voluntarism at the local and national levels. We highlight a number of key findings.
First, we show enduring, sizeable, and slightly widening inequalities in charity density over time, extending similar analyses by McDonnell et al. (Reference McDonnell, Mohan and Norman2020) for a further intercensal period. Local authorities in the 90th percentile have a charity density three to four times that of those in the 10th percentile, whereas the variance in charity density—unexplained differences between local authorities—has increased over successive census periods. These inequalities are strongly associated with differences between areas in their level of material deprivation, degree of rurality, and geographic region (and to a lesser extent ethnic diversity). The negative relationship between density and deprivation reinforces the importance of supply-side theories of nonprofit sector development, particularly the need for sufficient enabling resources (Musick & Wilson, Reference Musick and Wilson2008). While this suggests voluntary failure theory may be a an explanation for why these inequalities arise, the picture is more nuanced: the most deprived areas have levels of charity density similar to the most affluent local authorities. This lends credence to Toepler’s (Reference Toepler2023) argument that voluntary failure is not failure at all but rather a driver of interdependence between government/funders and the voluntary sector through place-based policy and funding initiatives for areas with high levels of social need, for example. The persistence of inequalities in charity are also sustained through reinforcing processes of charity foundation and dissolution: deprived areas are less likely to have new charities founded and existing organizations are more likely to dissolve (Clifford, Reference Clifford2018). This further supports the claim that local areas reproduce themselves in highly structured ways despite significant change in individual organizations over time (Clifford, Reference Clifford2018; Sharkey, Reference Sharkey2013).
Second, we uncover a consistent, “national” growth trajectory of charity density. Almost all 330 local authorities experienced a similar trend of rapid growth in density between 1971 and 2001, followed by a plateauing or decline to 2021. The post-2001 trend is characterized by increasing levels of charity dissolution (particularly in deprived areas) and a near-universal increase in the population size of local authorities. The homogeneity of the trajectories across local authorities is a major factor in how inequalities in the level of charity density persist over time: it ensures there is little change in the rank order of local authorities according to their level of density.
Third, there is substantial variation in the growth trajectories—in both baseline levels and temporal trends—for different fields of charitable activity (e.g., education and social services) and areas of operation (e.g., charities that operate beyond the scale of their immediate local authority). Variation in the former reflects the fact that the charity sector is a “loose and baggy monster” (Kendall, Reference Kendall2003), encompassing a wide variety of causes and activities that vary in popularity and support (from the public and state) over time. Variation in the latter may result from a combination of processes. Opportunities for charities to bid for public service contracts have led to many reincorporating as charitable companies (to take advantage of the protections against liabilities offered by company status), while numerous operational units of public services are now under charitable control (e.g., in culture and recreation, education, and social services). Such entities may seek to operate on a wider spatial canvas (e.g., to extend their ability to serve a broader geographical area than is often the case with long-established charities, which may have restrictive areas of benefit—e.g., a stipulation that the charity must operate only within the confines of a small administrative unit such as a parish).
A number of limitations must be acknowledged. Mappings of the voluntary sector reflect the sources on which they draw (Eikenberry & Nickel, Reference Eikenberry and Nickel2016). Our reliance on data about formalized organizational entities means that unregistered, informal entities are not considered. This is a long-acknowledged limitation of research in this field, although, on the other hand, charities account for the great majority of registered voluntary organizations in England and Wales. Second, we study the presence of charitable organizations in local areas, not the extent to which their activities occur in a particular place. Robust, high-coverage data on where charitable activity occurs are not available for the United Kingdom (or indeed for any country); this is why we focus on organizations that say they operate within a single local authority is a valid proxy for where they operate (accounting for two thirds of all charities). Nevertheless, where these organizations are administratively present is of significant consequence to a local area: they provide substantial volunteering and employment opportunities and can shape access to statutory as well as voluntary services. While acknowledging the benefits of adopting a more granular perspective, local authorities are of substantive relevance to voluntary organizations as they are an important source of public funding to charities in a range of fields (such as social services, education, arts, culture, and recreation) and can offer tax relief to charities liable for business rates (a form of property tax; Rees, Reference Rees2014).
Conclusion
Understanding levels and changes in charity density informs the growing interest among policymakers and funders in the nature, extent, importance of, and funding for social infrastructure in the United Kingdom (British Academy and Power to Change, 2023; Department for Culture, Media & Sport, 2023). This study is original as it tracks spatial disparities in a significant component of the voluntary sector organizational landscape over such a long time period. The general national trajectory revealed here is one of strong initial growth in, then a plateauing and decline of charity density since 2001. There has been significant growth in local authority population size since then, as well as increasing numbers of charity dissolutions. Therefore, organizational efforts may be spread across larger populations. In some measure counteracting this, the charity model is not the only form of voluntary action and newer approaches have arisen: Community Interest Companies and social enterprises in particular have emerged as popular forms of voluntary or social purpose organizations. Work that examined the complementarity between the pattern of these organizations and that of charities would be a welcome addition to the evidence base, although this is currently only possible for the last two census years (legislation to create Community Interest Companies took effect only in 2004).
However, there are counterarguments that paint a more pessimistic picture of the contemporary trajectory of voluntary action. The COVID-19 pandemic disrupted the registration of new charities, and early evidence suggests that foundation rates are also lower in subsequent years (McDonnell & Clifford, Reference McDonnell and Clifford2023). The UK Government’s program of public spending austerity beginning in the early 2010s impacted the charity sector through reductions in income resulting from cuts to local authority funding from central government (Clifford, Reference Clifford2021). Between 2010 and 2021, there has also been a steep reduction in the number of and expenditures by national and local voluntary sector infrastructure bodies (4% and 25%, respectively; Kane & Cohen, Reference Kane and Cohen2023). It is possible that this reduction in capacity to support voluntary action has negatively influenced the establishment of new charities in the most recent period covered by our study.
The United Kingdom currently finds itself in a constrained public finance environment, and medium-term spending projections—notwithstanding the recent change of government—do not suggest that an expansion of the level of public funding available to organizations is on the horizon; local government, historically an important source for voluntary organizations, is particularly constrained. The voluntary and public sectors have often been interdependent, with evidence showing that increases in government funding lead to higher levels of charity density, and thus not driving out or constraining voluntary activity (Lecy & Van Slyke, Reference Lecy and Van Slyke2013; Mayer, Reference Mayer2024). However, voluntary organizations rely on a mixed funding portfolio, and therefore reductions in public funding are more likely to impact on organizational capacity rather than on organizational presence. Spatial targeting of the efforts of charitable funders will make little difference to the pattern of organizations because such efforts are small-scale, and the same can also be said of the most recent initiatives dedicated to spatial targeting, such as the previous government’s “leveling up” programs. The promotion of an expansion of the voluntary sector is more likely to result from national economic growth and stability. This is crucial to providing the conditions for sustained and renewed voluntary action, by ensuring that more individuals have the resources of time and money that enable them to support organizations. Voluntary organizations are an important component of local social infrastructure (Sampson, Reference Sampson2012), and our findings shed important insights into how the presence of these organizations is changing over time and relative to important area characteristics. The sizeable, enduring inequalities we have identified pose a challenge to policymakers interested in strengthening communities and social infrastructure: the answer may ultimately lie in national-level economic and social policy rather than in spatially targeted efforts narrowly focused on the voluntary sector.
Supplementary material
The supplementary material for this article can be found at http://doi.org/10.1017/S0957876526000069.
Acknowledgements
The authors would like to thank the editor and three anonymous reviewers for their detailed and critical comments on this article. David Clifford and Vernon Gayle provided valuable methodological insight on the original research design. The authors are indebted to the teams at PopChange, the Charity Commission for England and Wales, and the Office for National Statistics for providing us with high-quality data relating to local authorities and charities.
Competing interests
The authors have no competing interests associated with this research.
Dr. Diarmuid McDonnell is a Visiting Fellow at the Gradel Institute of Charity, New College, Oxford. His research interests include the geographical distribution of voluntary action and the measuring and modeling risk in the voluntary sector.
Dr. John Mohan is a Professor of Social Policy in the Department of Social Policy, Sociology, and Criminology at the University of Birmingham, where he is currently the Director of the Third Sector Research Centre.
Dr. Paul Norman is an Associate Professor specializing in population and health geography. His research interests include the harmonization of small-area-level sociodemographic, morbidity, and mortality data to enable time-series analysis of demographic and health change.


 Open access