Epidemiological Study Designs
Epidemiological studies are scientific investigations that examine the patterns, causes, and effects of health conditions in populations. Analytical epidemiological studies, which are commonly used, operate on the simple and intuitive principle that if two factors frequently or repeatedly occur together, they are likely to be related. For example, if fish consistently appear whenever fish food is thrown into a river, it suggests there is a link between fish food and fish responding. Similarly, if a disease occurs more frequently when a particular risk factor is present, it indicates a possible association between the two.
The key difference between various epidemiological study designs lies in how and where the study begins.
Cohort study: starts with a risk factor and follows participants over time to observe the outcome (disease).
Case–control study: begins with the outcome (disease) and looks backwards to identify potential risk factors.
Cross-sectional study (survey): examines both the risk factor and the outcome at a single point in time.
Experimental study: actively manipulates the exposure, determining who is exposed to a risk factor rather than merely observing naturally occurring exposures.
Epidemiological studies are broadly classified into observational and experimental studies:
1. Observational studies are separated into descriptive and analytical studies:
Descriptive studies describe the distribution of diseases or health conditions in a population. They focus on ‘who, what, when, and where’. Examples include:
– Case reports: detailed descriptions of individual cases.
– Case series: collections of case reports.
– Cross-sectional studies: studies that examine data from a population at a single point in time.
Analytical studies aim to identify and evaluate the causes and risk factors of diseases or health conditions in a natural setting without intentionally manipulating the exposure. They focus on ‘why and how’. Examples include:
– Cohort studies: studies that follow a group of people over time to see who develops a disease.
– Case–control studies: studies that compare people with a disease (cases) to people without the disease (controls) to identify potential risk factors.
– Ecological studies: studies that use group-level data to assess relationships between exposures and health outcomes.
2. Experimental studies (interventional studies) involve intentionally changing one or more factors (an intervention/exposure) in a population and observing the effect on outcome.
Measurements in Epidemiological Studies
Prevalence
Prevalence is the proportion of a population that has a particular disease or condition at a given time:

Types of prevalence:
Point prevalence: the proportion of a population that has a disease at a specific point in time.
Period prevalence: the proportion of a population that had the disease at any time during a specified period (e.g. a month or a year), including both existing and new cases.
Lifetime prevalence: the proportion of a population that has ever had the disease or condition at any point in their life, up to the time of the survey.

Prevalence Bathtub Model
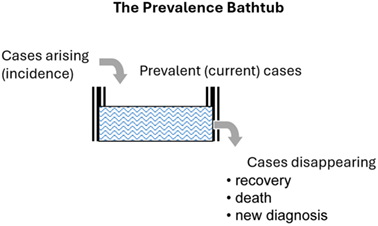
The difference between prevalence and incidence is best understood through the prevalence bathtub analogy (Figure 1.1), where:
inflow is incidence (new cases entering the tub)
water in the tub is prevalence (existing cases)
outflow is recovery, death, or change in diagnosis (cases leaving the tub).
The prevalence bathtub model.
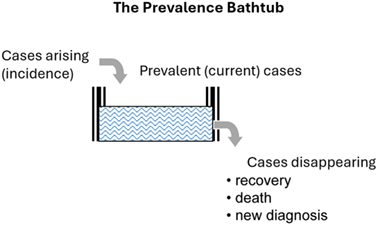
Figure 1.1 Long description
The diagram comprises a rectangular bathtub with double-walls on either side. There appears to be an orifice on the bottom right wall. Cases arising (incidence) are poured into the bathtub from above. The prevalent (current) cases are still in progress. The orifice is an outlet for cases disappearing due to recovery, death, and new diagnosis.
Risk
Risk is the proportion of subjects initially at risk who experience an event during a study period. The correct denominator for risk measurement can sometimes be difficult to determine.
Rate
Rate is the frequency of events occurring over a defined time period, divided by the total person-time at risk during that period. Rates are often used to estimate risk and are adjusted using multipliers (e.g. per 100,000) for easier interpretation.
Crude Death Rate
The crude death rate is the total number of deaths occurring in a population during a specific period (usually one year), divided by the total population. It does not account for population characteristics such as age or gender:

Cause-Specific Death Rate
The cause-specific death rate measures the death rate due to a specific cause in the total population:

For example, if 200 people die from heart disease in a population of 500,000:

Standardized (Adjusted) Rates
Standardized rates compare disease or mortality rates across different populations by accounting for differences in demographic factors such as age and sex. These rates help remove the effect of confounding variables, ensuring a fair comparison.
Direct Standardization
A standard population is chosen as a reference and used when age-specific rates are available:

where:
Standardized Mortality Rate
The standardized mortality rate (SMR) is used when age-specific rates are unknown or unstable (e.g. due to small numbers). It is calculated as:

For example, if a mining workforce has 150 observed lung cancer deaths, but the expected deaths based on a standard population is 100, then:
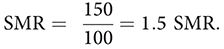
This means the miners have a 50% higher mortality rate than expected.
Chapter Summary
Epidemiology is the study of the distribution and determinants of health conditions in populations. Epidemiological study designs differ in their starting point and how exposures and outcomes are assessed. Cohort studies begin with a risk factor and follow participants over time, whereas case–control studies start with disease status and look backwards for exposures. Cross-sectional studies measure exposure and outcome at a single point in time, while experimental studies involve active manipulation of an intervention.
Key epidemiological measurements include prevalence and incidence. Prevalence describes the proportion of individuals with a disease at a given time and may be classified as point, period, or lifetime prevalence. It is calculated as:

Incidence refers to the number of new cases occurring over a specified period and is calculated as:

Risk represents the probability of developing an outcome during follow-up and is expressed as:

Rates measure the frequency of events over time and incorporate person-time:

Mortality can be described using crude death rates, which measure overall deaths in a population:

Cause-specific death rates focus on deaths attributable to a particular condition:

Comparisons between populations often require standardized (adjusted) rates. Direct standardization adjusts for differences in age structure when age-specific rates are available:

When age-specific rates are unavailable or unstable, the standardized mortality ratio (SMR) is used. SMR compares observed deaths with expected deaths:
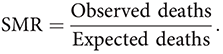
An SMR greater than 1 indicates higher mortality than expected, while an SMR less than 1 indicates lower mortality than expected.
Together, these study designs and measurements form the foundation for describing disease patterns, assessing risk factors, and comparing health outcomes across populations.
Practice Questions
Q1. Which of the following is best described as a cohort study?
A. Start with the disease and control and look backwards for risk factors.
B. Examine risk factors and outcomes at a single point in time.
C. Begin with a risk factor and control and follow participants over time.
D. Actively manipulate exposure to a risk factor and look for outcomes.
E. Use group-level data to assess relationships.
Q2. Which of the following is an example of a descriptive observational study?
A. Cohort study
B. Case–control study
C. Cross-sectional study
D. Experimental study
E. Interventional study
Q3. Which of the following studies uses group-level data to assess relationships between exposures and health outcomes?
A. Cohort studies
B. Case–control studies
C. Cross-sectional studies
D. Experimental studies
E. Ecological studies
Q4. Choose the appropriate measurement rate for the definitions given below.
A. Age-specific death rate
B. Case fatality rate
C. Cause-specific death rate
D. Crude death rate
E. Incidence
F. Standardized mortality ratio
G. Prevalence
H. Standardized (age-adjusted) rate
1. The number of existing cases of a disease in a population at a particular time, expressed as a proportion of the total population.
2. The number of deaths per 1,000 people in a population over a specific period, without adjusting for age or other factors.
3. The proportion of new cases of a disease occurring over a specified period, relative to the at-risk population.
4. A mortality rate that allows comparisons between populations with different age distributions by adjusting for age.
5. The number of deaths due to a specific disease per 100,000 population in a given period.
6. A measure comparing observed deaths to expected deaths after adjusting for age.
7. The proportion of individuals in a defined age group who die within a given time period.
Answers
Correct answer: C. Begin with a risk factor and control and follow participants over time.
Explanation of the other options:
A. Start with the disease and control and look backwards for risk factors → case–control study.
B. Examine risk factors and outcomes at a single point in time → cross-sectional study.
D. Actively manipulate exposure to a risk factor and look for outcomes → experimental study.
E. Use group-level data to assess relationships → ecological study.
Correct answer: C. Cross-sectional study
Correct answer: E. Ecological studies
The two lists should be paired as:
1. G (prevalence)
2. D (crude death rate)
3. E (incidence)
4. H (Standardized (age-adjusted) rate)
5. C (cause-specific death rate)
6. F (standardized mortality ratio)
7. A (age-specific death rate)