
The availability of freshwater for human consumption, agricultural production, economic development, and a variety of ecosystem services is at the forefront of global concerns regarding the sustainable use of natural resources. Worldwide, 70 percent of water is used for agricultural irrigation, while more than one billion people lack adequate water for their essential needs.Footnote 1 Water management is complicated by rural migration and rapid growth in dense cities, where supplying water to meet increasing demands is a significant challenge. Much of this urban growth is occurring in relatively arid regions, from the Far East to the American Southwest, necessitating special attention to water policies in desert metropolitan regions.
Over the last century, the world has experienced a sixfold increase in water consumption—twice the rate of population growth.Footnote 2 Although the minimum amount of water needed for basic human uses is estimated at five to eight gallons per person daily, rates of consumption far exceed basic needs in developed nations. Water demand also varies widely, from thirty-four gallons per capita daily (GPCD) in Germany to more than one hundred in the United States. Even within the United States, water consumption varies significantly from place to place, with some of the highest rates in southwestern Sunbelt cities such as Phoenix, Arizona. Illusions of abundance are prevalent in desert cities throughout the American Southwest, despite the semi-arid climate, recurring droughts, and ultimately limited water supplies.Footnote 3
In metropolitan Phoenix, the focus of this article, the proliferation of hyper-green golf courses, human-made lakes, and well-watered lawns sustains a historic pattern of perpetuating an artificially lush oasis in defiance of the native Sonoran Desert ecosystem.Footnote 4 The resultant high water-use rates not only far exceed national averages but also substantially exceed consumption in more conservation-minded desert cities nearby, such as Tucson, which has an average water-use rate of 172 gallons per capita daily compared to 230 GPCD in Phoenix.Footnote 5 Ironically, these high rates of consumption persist today despite nearly three decades of conservation efforts mandated by the Arizona Groundwater Management Act (GMA) of 1980. Herein we examine the weakening of this often-heralded state water law, focusing on the mandate to achieve “reasonable reductions in per capita use” in the state’s capital and central urban region.Footnote 6
Although the GMA was designed to end groundwater overdraft by 2025, in part through progressively more efficient water-use standards, our findings reveal that the Arizona Department of Water Resources, the state legislature, and the municipal water providers in metropolitan Phoenix have steadily eroded conservation standards and made woefully inadequate progress toward reducing urban water demand. These changes not only counteract state legislative goals, but they also defy repeated calls by Governor Janet Napolitano to establish a “culture of conservation” in Arizona.Footnote 7 Instead, our research shows that a libertarian culture of consumption remains firmly in place and is evident in high water-use rates, weakened regulations for reducing water demands, perpetual attention to the utilization (not conservation) of renewable water, and continued searches for additional water supplies to support growth and economic development.
Conservation, or the reduction of water use through enhanced efficiency, is becoming an increasingly important component of sustainable resource management.Footnote 8 Water importation and supply augmentation have been the traditional response to water scarcity in the American West, but such opportunities are increasingly problematic. The hunt for additional water supplies cannot go on forever, especially given the environmental, social, and economic costs of giant water development projects.Footnote 9 In the face of limited supplies, conservation (also referred to as demand management in this paper) is an integral part of sustainable water use in urban areas. Accordingly, we focus on the historic changes in municipal conservation policy between the passage of the GMA in 1980 and today (2008). Before empirically demonstrating the weak, declining commitment to conservation in metropolitan Phoenix, we first set the stage for our analysis by describing the severity of the area’s resource problems, the historical context of water management in central Arizona, the limits of supply-side alternatives, and the tradition of high water consumption in the region.
THE PROBLEM: GROUNDWATER OVERDRAFT
Unsustainable groundwater use—that is, taking more water from an aquifer than is returned annually—is called overdraft or groundwater mining. It is a critical problem in China, India, and many parts of the United States, from California’s agricultural valleys to the humid Florida peninsula. Yet the size of central Arizona’s urban population, its record-setting growth rate (among the highest in the nation), extremely low rainfall (seven inches annually), and the speed at which the state’s groundwater supplies have been depleted merit critical analysis, particularly in light of the mixed results of state efforts to resolve the problem.Footnote 10
Historically, ample groundwater helped make Arizona the largest producer of cotton in the 1920s and also enabled growth of the greater Phoenix area after World War II (along with local surface water supplies, which we address later). Throughout the twentieth century, agricultural and urban development consumed this vital resource at rates that exponentially exceeded replenishment. Since the aquifers store fossil water as old as eight million years, deposited during a wetter climatic period than today, groundwater in Arizona, as well as elsewhere around the world, is a nonrenewable resource subject to depletion.Footnote 11
Groundwater overdraft is detrimental because it induces higher energy and drilling costs to pump water from increasing depths, often for lower-quality water requiring expensive treatment.Footnote 12 In areas of severe overdraft, land subsidence—or the sinking of the earth’s surface due to aquifer depletion—causes fissures and cracks that damage roads, reservoirs, buildings, and other infrastructure.Footnote 13 Groundwater depletion also threatens the ecological health of rivers due to the connections between surface and underground water. Perhaps most important, groundwater overdraft threatens the future viability of the communities and businesses that are dependent on this declining water supply.
HISTORICAL CONTEXT
Political leaders in Arizona have been aware of the overdraft problem since the 1930s,Footnote 14 yet no comprehensive management laws were adopted until 1980. Instead, state leaders concentrated on augmenting water supplies with dams, reservoirs, and canals, securing federal funds for the largest projects. In the early 1900s, the United States Bureau of Reclamation launched the Salt River Project in central Arizona to deliver irrigation water to the sparsely populated desert valley, where cotton, citrus, and alfalfa fields quickly sprouted. By midcentury, six dams on the Salt and Verde Rivers, along with hundreds of miles of canals, captured and delivered about one million acre-feet of water throughout the valley. Farms and communities without access to developed surface water drilled wells into the desert alluvium to harvest ancient water from the aquifer. Together, groundwater and federal reclamation projects fueled a prodigious regional boom in the twentieth century.Footnote 15
A system of water rights based on the “first in time, first in right” prior appropriation principle has historically determined access to water flowing in the local Salt, Verde, and Gila Rivers. Meanwhile, groundwater has been governed by a different set of rules, or, more accurately, the lack thereof. Restrained only by the depth of the aquifer and the latest pumping technology, any landowner could sink a well to extract water beneath their property. Groundwater was and still is a common pool resource subject to what Garrett Hardin termed “the tragedy of the commons.”Footnote 16 As individual pumpers enjoy the benefits of groundwater, the costs and effects of aquifer depletion are felt by others. By midcentury, farmers, towns, and water companies encountered problems from the unrestricted pumping. Some wells went dry and had to be drilled deeper. Intensive extraction in one area lowered the water table in other areas and sometimes dried up streams to which other people owned water rights. Conflicts erupted and the state, which manages water rights, had to intervene.Footnote 17
Commonly treated as a property right, landowners’ pumping of water from largely elusive underground aquifers has seldom been regulated or restricted. Before 1980, the primary state rule governing groundwater was a weak 1948 law that prohibited new wells from being drilled for irrigation in designated “Critical Groundwater Areas” where aquifer depletion was a recognized problem. But the policy was described as inadequate even at the time of its enactment.Footnote 18 The prohibition of new wells did not stop excessive pumping from existing wells, and groundwater extraction continued unabated as water levels dropped precipitously during the boom decades following World War II. Between 1940 and 1990, aquifers in central Arizona experienced a 33 percent reduction in volume. By the 1970s, Arizona was using groundwater at a rate that would drain the state’s centrally located aquifers in less than one hundred years.Footnote 19
Instead of reducing or addressing water demand, policymakers invariably preferred to satiate increasing, competing uses of the vital resource by acquiring additional supplies. With local reclamation projects completed by midcentury, the state turned to the Colorado River for more water. Arizona had substantial rights to the Colorado River, but only landowners along the river had the capacity to use the water. So Phoenix-area movers and shakers and Arizona’s congressional delegation launched a multigenerational campaign for federal funding of a giant canal and a series of pumping stations to transport Colorado River water several hundred miles inland and a thousand feet uphill to the growing metropolis of Phoenix. In 1968, Congress approved the Central Arizona Project (CAP), but Arizonans had to fight for two more decades to keep the federal dollars flowing to complete the canal.Footnote 20 With CAP water assumed to be on the way in the 1960s and 1970s, state authorities continued to ignore the overdraft problem and to sidestep groundwater regulation.
At the time Congress authorized the CAP canal, a major shift from agricultural to urban water use was under way. The postwar Sunbelt population boom converted former farm towns surrounded by croplands into bustling cities surrounded by sprawling suburbs. The Salt River Project increasingly served municipalities rather than farmers. Because farms in the desert require more water acre for acre than housing developments, the conversion of farmland to tile and stucco seemed a partial solution to the groundwater overdraft problem. Agriculture’s share of the total water budget steadily declined for decades. But even with the midcentury conversion of farms to urban land uses, groundwater overdraft remained a mounting problem. In 1980 the overdraft in the Phoenix region was 1.3 million acre-feet—more than the annual amount of surface water delivered to farms and towns through the Salt River Project.Footnote 21 Unfortunately, the conversion of farmlands to housing developments has not solved the overdraft problem.
As state leaders poured their energies into securing federal funds to build the CAP, one of the most expensive river diversion projects in American history, policy initiatives to address groundwater overdraft stalled. The Carter administration broke the impasse in the late 1970s, when U.S. Secretary of the Interior Cecil Andrus delivered a powerful ultimatum to the state: adopt an effective groundwater code to curtail the overdraft problem or else federal investment in the 336-mile-long canal would be terminated. After intense negotiations among mining, agricultural, and urban interests, the Arizona legislature passed the Groundwater Management Act to reduce groundwater overdraft.Footnote 22 Governor Bruce Babbitt signed it into law in June 1980. A visionary policy for its time, scholars have hailed the GMA as a major policy innovation with substantial authority and a clear mandate to end overdraft.Footnote 23 Since sustainable management requires balancing the demand for water with available supplies, the GMA encompasses both supply-side and demand-side programs. Before our analysis of the municipal demand provisions of the GMA for the Phoenix area, we first briefly present an overview of the primary uses and sources of water in the region.
CONTEMPORARY WATER DEMAND AND SUPPLY IN METROPOLITAN PHOENIX
Due to population growth and urbanization, municipal demand is the fastest-growing sector of water use in the greater Phoenix area. At the turn of the twenty-first century, municipal uses accounted for roughly 40 percent of demand and they are expected to exceed agricultural and direct industrial uses by 2025.Footnote 24 Commercial and some industrial uses account for a portion of municipal demand, but the majority of water is used for residential purposes, specifically outdoor activities such as irrigating yards and maintaining swimming pools.Footnote 25 As such, outdoor uses offer the most potential for reducing municipal demand.Footnote 26
The strong desire for thirsty landscapes, complete with grass lawns and ornamental lakes, no doubt contribute to high rates of water consumption in the Phoenix area.Footnote 27 The region exhibits markedly high per capita water demand even when compared to similarly arid regions in the American Southwest like El Paso, Texas, and Albuquerque, New Mexico. According to a 2001 study of water-use trends in thirteen southwestern cities, municipalities in the Phoenix region (notably, Scottsdale and Tempe) shared the distinction, along with Las Vegas, of having the highest rates of consumption—more than 300 gallons per capita daily. For the remaining cities, the average rate was around 200 GPCD.Footnote 28
Currently, nonrenewable groundwater meets 39 percent of water demand in metropolitan Phoenix, while surface water accounts for 56 percent, and effluent, or treated wastewater, only 5 percent.Footnote 29 Surface water comes from the local Salt, Verde, and Gila Rivers, in addition to the more-distant Colorado River. While surface water is more or less renewable, scientists including former state climatologist Andrew Ellis predict that reductions in surface water runoff are likely under expected climate-change scenarios.Footnote 30 These changes would mean less water stored in local reservoirs to meet future demands.
With the CAP canal delivering water to the Phoenix area since 1985, the region has increasingly relied on Colorado River water for its continued growth. In part because water rights to the river were negotiated in the early twentieth century, after a period of unusually high rainfall, the allocated rights exceed “normal” flows by approximately 20 percent.Footnote 31 Given predictions of a drier future, water shortages in the overallocated basin are seemingly inevitable. And when shortages occur, Arizona is among the first to lose its allocation since the state’s rights to CAP water are junior to other users in the basin.Footnote 32 Nevertheless, the state’s efforts to reduce groundwater overdraft have largely relied on increased use of renewable and presumably secure Colorado River water.Footnote 33
Optimistic water managers continue to pursue new supply augmentation strategies such as desalinating seawater and importing water from other areas.Footnote 34 But the economic costs and political realities make additional water-supply development schemes difficult, if not prohibitive, and Arizona state law generally forbids interbasin groundwater transfers.Footnote 35 Perhaps the source of water with the most potential to expand in the future is effluent, or recycled wastewater. The reliance on effluent is limited, however, by the amount of wastewater produced and the capacity to clean and distribute it. In addition, the “yuck factor” has to date largely rendered “toilet to tap” programs socially unacceptable.Footnote 36
Since farming devours the vast majority of water in the southwestern United States and elsewhere around the world, the transfer of water from agricultural to municipal uses provides another source of future supplies. When the GMA was enacted in 1980, for instance, agricultural water use accounted for nearly 90 percent of total demand statewide.Footnote 37 This number has declined substantially and the trend is even more dramatic in the Phoenix area, where farm-based uses diminished from 82 percent in 1985 to 63 percent in 2000, as municipal uses have risen considerably with urban growth.Footnote 38
Often seen as the holy grail of future water supplies, water transfers are not without quandaries and constraints. Shifting water from farms to cities involves practical limits, institutional constraints, political resistance, and deleterious impacts on the source agricultural communities.Footnote 39 The conversion of farmland around cities also entails some social and economic risks by eroding an important buffer against temporary shortages, that is, because cutting off water supplies to farms during periods of drought or scarcity is more feasible and less costly than cutting off municipal supplies to homes and businesses. With the decline of irrigated farmland, finally, new development in the greater Phoenix region is increasingly encroaching on native desert lands that lack water rights or accessible supplies.Footnote 40
In essence, the region’s water supply is limited hydro-climatically as well as politically, economically, and legally. Recognizing the end of the dam-building era and the high costs of supply-augmentation strategies, water experts such as Peter Gleick call for “soft path” approaches to water management, specifically demand-side strategies that enhance water-use efficiency. Yet many policymakers cling to “the unshakeable belief … that large, centralized systems are the only way to meet unrelenting growth in demand.”Footnote 41
According to Drs. Denise Lach, Helen Ingram, and Steve Rayner, water-management institutions are resistant to change because they operate along established norms of conduct and thereby tend to be conservative in maintaining the status quo.Footnote 42 Through numerous interviews in the United States, these well-respected researchers found that water managers evaluate success in terms of their ability to continuously deliver reliable water supplies to consumers at minimal costs. Moreover, professional success depends on avoiding negative attention from customers, who are thought to be inflexible with respect to changing their water-use activities, as water managers typically “gauge their success by the absence of political or public attention.”Footnote 43 This culture of passivity in regulating water use at least partly explains why, in spite of a recent long-run drought and substantially lowered reservoirs, the Phoenix area has not implemented water-use restrictions but instead has relied on increased groundwater pumping to meet demands.Footnote 44
A formidable barrier to governing water demand in the American West is a conservative political culture characterized by individualism and antiregulation sentiment as well as faith in a free-market economy fueled by growth and resource development. With an estimated 20 percent of employment linked to land development in the Phoenix area, social and political resistance to curbing water demands and high consumption rates is reinforced by the centrality of growth in the regional economy.Footnote 45 While demand-side strategies alone cannot support all future water needs under projected growth rates, they are a crucial component in reducing groundwater overdraft and achieving sustainable water use.Footnote 46 The Groundwater Management Act was designed to address these issues, but is it working? Based on our policy analysis, the answer appears to be no, since per capita water demand remains high, conservation targets have been abandoned, and overdraft continues at a rate that will make it impossible to meet a condition called “safe yield” by 2025.
THE EVOLUTION OF MUNICIPAL WATER-DEMAND MANAGEMENT IN GREATER PHOENIX
The legislative mandate of the 1980 Groundwater Management Act is to achieve safe yield by 2025, which essentially means balancing groundwater withdrawals with recharge and the replenishment of aquifers.Footnote 47 Since the state is more than halfway through the implementation period, now is a crucial time to assess progress toward meeting the goals of the GMA. The legal mandate of safe yield applies only to parts of the state, designated “Active Management Areas” (AMAs), with the most severe groundwater overdraft (fig. 1).Footnote 48 Collectively, the AMAs contain approximately 75 percent of the state’s population and 70 percent of the groundwater overdraft.
The Phoenix Active Management Area
Note: This map was first published in Environmental History 133, no. 495 (July 2008), published by the American Society for Environmental History and the Forest History Society, Durham, North Carolina.
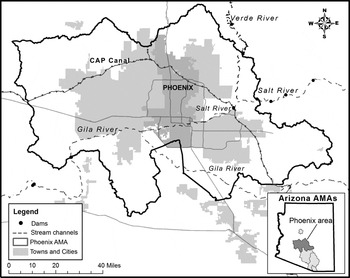
Our focus is on the largest AMA encompassing the City of Phoenix and more than twenty surrounding municipalities and unincorporated areas totaling 5,600 square miles. The region is currently home to about 3.9 million residents, and the population is expected to double by 2055.Footnote 49 With much of this new growth in suburban towns along the metropolitan fringe, younger and smaller municipalities compete with established suburbs and the urban core to attract residents, businesses, and developers to their jurisdiction for sustained growth and economic development.Footnote 50
Because “local bodies would be reluctant to adopt and enforce demanding conservation requirements against people in their communities,” the negotiators of the GMA opted for centralized management by the state.Footnote 51 In particular, farmers were concerned that local control would place too much power in cities. The agency created to oversee the implementation of the GMA, the Arizona Department of Water Resources (ADWR), adopts management plans for each AMA, monitors water consumption and groundwater pumping rates, establishes specific conservation standards for water users, and enforces compliance with those requirements.Footnote 52 With a governor-appointed director, the agency has significant authority and may levy fines up to $10,000 for noncompliance with regulations.
Despite substantial statutory authority, the lack of statewide political support for ADWR is evident in recent budget allocations. As Arizona’s population increased 45 percent between 1990 and 2003, for instance, ADWR’s staff declined by 29 percent. The state’s total revenues grew by 19 percent during the same period, while the agency’s appropriation from the General Fund decreased by 17 percent.Footnote 53 Constrained by dwindling resources and facing considerable opposition from constituents, ADWR has struggled to fulfill its regulatory responsibilities. These trends do not bode well for sustainable water management, which necessitates strong institutional capacity and political leadership.Footnote 54
The 1980 groundwater law required ADWR to develop five consecutive management plans for each AMA. By incrementally eliminating groundwater overdraft, each plan is designed to move the AMA toward safe yield by 2025.Footnote 55 The first management plan covered the period 1980–90, with each subsequent plan covering the following ten-year period. As of 2008, the department was implementing its third management plan and drafting the fourth plan for the Phoenix AMA. Each plan addresses water supply and demand for municipal, agricultural, and industrial uses.Footnote 56 We are concerned in this article with the municipal-demand features of the Phoenix area plans, which were designed to reduce per capita water consumption in cities throughout the AMA. In the assessment that follows, we illustrate how municipal water policies and conservation standards were incrementally eviscerated over the first three management periods of the 1980 Groundwater Management Act.
The First Management Period (1980–1990)
The GMA requires “reasonable reductions in per capita use,” with heightened conservation standards in each management plan intended to curtail groundwater overdraft by 2025.Footnote 57 ADWR director Wesley Steiner adopted the First Management Plan in 1984, assigning conservation targets (expressed as average annual GPCD) to municipal water providers in the Phoenix AMA. Depending on whether their 1980 “baseline” GPCD was relatively high or low, each large provider was initially required to reduce total per capita water consumption in their service territories by 11 percent, 6 percent, or not at all.Footnote 58 No reductions were required for providers whose service areas used less than 140 GPCD—the consumption rate deemed consistent with safe yield.Footnote 59 Water providers whose GPCD ranged between 141 and 350 were required to reduce consumption by 6 percent, and those whose GPCD exceeded 350 were to reduce consumption by 11 percent. These were initial reductions only. ADWR intended to increase conservation targets in the future, since at 300 GPCD a 6 percent reduction is still roughly 280 GPCD—double the safe-yield target. Among fifty-one large providers identified in the first plan, twenty-three had to reduce their GPCD by 6 percent and fourteen by 11 percent.Footnote 60 Although the mandated reductions in water use were straightforward on paper, compliance proved difficult over the coming years.
ADWR gave water providers two years to meet their GPCD targets (by 1987), allowing them to adopt whatever conservation measures were necessary to get the job done. This approach is consistent with prevailing policy perspectives that suggest outcomes should be clear, but the means for achieving them should be flexible. In other words, “performance-based programs are superior to prescriptive approaches because they provide flexibility to the entities regulated.”Footnote 61 Yet in August 1989, two years after the compliance deadline, ADWR authorities issued a press release informing the public of their recent monitoring activities in the Phoenix AMA: nineteen providers were out of compliance with their GPCD targets, four providers had minor violations, and six more were negotiating their targets with ADWR.Footnote 62 In total, fewer than 40 percent of providers were in compliance with the conservation requirements (see fig. 2 for municipal trends in meeting targets over time).
Despite these high levels of noncompliance, ADWR director Bill Plummer took a conciliatory approach, explaining: “Our preference is to negotiate a settlement that includes implementation of specific conservation measures that will enable water providers to meet their conservation targets and reduce their groundwater demand.”Footnote 63 Instead of levying fines, ADWR preferred to enter into written agreements with providers, called Stipulation and Consent Orders (SCOs), to specify a suite of best-management practices (such as conducting water-efficiency audits and distributing informational materials) to be implemented.Footnote 64 Over the course of the next ten years, twelve of the nineteen out-of-compliance providers identified in the 1989 press release entered into SCOs with the department. Within this group, two-thirds again breached their agreements before the year 2000.Footnote 65 Although the SCOs may have created a feeling of goodwill between water providers and ADWR, they did very little to facilitate substantial reductions in actual water use or move the AMA toward safe yield.
Rather than dedicating themselves concertedly to meeting their modest conservation targets, many out-of-compliance cities challenged ADWR’s data and the assumptions used to establish the GPCD targets, such as projections of future population growth, estimates for seasonal residents, and water-use rates for new development.Footnote 66 On the surface, calculating average annual GPCD is straightforward: divide the amount of water delivered (in gallons) by the population served and the number of days in the year. This simplicity became grounds for objections, as municipalities complained that the water-use targets did not take into account the unique local conditions of their service areas. For example, the City of Tempe, which hosts the lushly landscaped Arizona State University, argued its high proportion of nonresidential uses skews its GPCD figures upward.Footnote 67 Wealthy Scottsdale argued that its relatively large lot sizes, replete with pools and irrigated landscapes, explain its high water-use rates. Rather than rising to the challenge of reducing per capita water demand through whatever means deemed effective and feasible locally, water providers resented and resisted regulation, claiming that the “Total GPCD” program was unfair.
In response to high rates of noncompliance and contention over GPCD calculations, ADWR customized the water-use targets for each city during the subsequent period, with the hope of reducing complaints and improving compliance. During the first management period, the agency also thinned the ranks of the municipal providers subject to regulation. Although ADWR initially planned to regulate all water providers, regardless of size, they exempted small municipal providers (serving fewer than 100 acre-feet per year) from the Total GPCD program in 1986, asserting they had “limited conservation potential.”Footnote 68 Considering the department’s early experience with water providers, the administrative burden of monitoring compliance for approximately one hundred small providers likely contributed to this decision. Regardless, these changes inaugurated an era of regulatory accommodations, which over the next twenty years notably weakened municipal demand management in the region.
The Second Management Period (1990–1999)
In late 1989, the director of ADWR formally adopted the Second Management Plan, which according to the GMA would require additional reductions in per capita water use.Footnote 69 Whereas the first plan mandated a percent reduction in water-use rates, the second one assigned each provider an individually tailored conservation target. Former ADWR administrators Kathy Jacobs and Jim Holway explained: “A much more rigorous analysis was conducted and each provider was given a unique gallons-per-capita-per-day target.”Footnote 70 The new approach took into account the providers’ ability to achieve reductions based on nonresidential demand, such as large industrial uses, and the expected amount of new residential development, which is inherently more efficient due to water-saving technology.Footnote 71 ADWR hoped an in-depth assessment of a provider’s service territory would yield achievable conservation targets. With the new calculations, the targets stayed the same for seven of the ten largest cities in the region, increased for two municipalities, and barely decreased for one (from 175 to 174 GPCD).Footnote 72 Nevertheless, eight of the ten largest public municipal providers were still out of compliance with their GPCD targets during this management period.Footnote 73
Even though ADWR developed the new conservation targets with a Municipal Advisory Committee comprised of various water providers (along with other entities), the water providers failed to meet the modest GPCD standards and continued to contest the water-use targets. According to an ADWR memo, the most frequent complaints levied by providers questioned the accuracy of the base data, which included provider-submitted information such as water withdrawals and housing projections.Footnote 74 In addition to data-oriented criticisms, providers voiced larger, philosophical objections to the department’s approach to demand management. For example, one municipal employee stated: “We feel [ADWR] has not sufficiently evaluated many of its requirements for agricultural, municipal, and industrial uses from an economic benefits perspective, and secondly, the Department seems to have over-emphasized the regulatory requirements aspect of the plan. … What we would like to see is the de-emphasis of a conservation stint to the management plan and to get into the larger water resource development planning.”Footnote 75 In other words, providers resisted the water-use efficiency standards on economic grounds and pushed for developing new water supplies.
As opposed to assessing fines for noncompliance, ADWR’s preferred action continued to be the negotiation of SCOs specifying a demand management program with largely voluntary conservation programs.Footnote 76 During this management period, eighteen providers signed SCOs with ADWR because they failed to meet their specified targets.Footnote 77 In 1988 Phoenix AMA director Frank Barrios summarized the department’s approach to compliance for the second planning period: “We feel if we can educate people there will not be much room for enforcement and that’s our primary effort.”Footnote 78
Despite ADWR’s lenience and the changes made to address providers’ concerns about regulatory standards, dissatisfaction with the municipal conservation program remained high and resentment toward the use of GPCD targets increased over time. A 1996 study by ASU’s Morrison Institute for Public Policy reported, “Gallons Per Capita Per Day is widely—perhaps unanimously—considered unreasonable by providers.”Footnote 79 Several providers called GPCD a “faulty” measure because, for example, it “doesn’t take into consideration the large industries that are needed to help support growth.”Footnote 80 The rationale for resistance was largely economic. As a representative of a growing residential suburb stated, the GPCD target “is not flexible enough to allow for … growth in industry, parks, schools, golf.”Footnote 81 Another typical criticism charged that GPCD standards did not distinguish between well and surface water, with the logic that because the GMA is concerned with groundwater overdraft, demand management standards should not apply to renewable surface water. Since Scottsdale had the capacity to serve most of its demand with surface water, rather than groundwater, for instance, it argued for maintaining its high rate of consumption.Footnote 82
Meanwhile, municipal water providers vociferously contested the use of GPCD targets because of reduced revenues.Footnote 83 Since the pricing of water is regulated by the state, private companies argued, they cannot freely increase what they charge to maintain or increase profits. Kris Mayes of the Arizona Corporation Commission (ACC), the elected body in charge of regulating private water companies, recently challenged this complaint by calling it a “fundamental misperception” on the part of providers who have not even tried to initiate or discuss a potential rate change with the ACC to accommodate their conservation efforts.Footnote 84 The objections acquired a new level of formality and ferocity when the second largest private provider in the state, the Arizona Water Company, took ADWR to court over the content of the Second Management Plan.
In January 1990, the Arizona Water Company (AWC) filed an action in Superior Court seeking judicial review of ADWR’s adoption of the second plan. In particular, AWC took issue with the municipal program, citing multiple reasons why the conservation requirements were “arbitrary and capricious” and should therefore be abandoned.Footnote 85 The company claimed the per capita water-use targets were “unsupported by substantial evidence,” and further, the GPCD program should impose conservation requirements on end-users rather than water providers. After conducting an administrative review, ADWR concluded the GPCD requirements for the AWC “remain correct.”Footnote 86 Frustrated with the outcome, the company filed a second complaint in Superior Court in May 1999. The two complaints were subsequently consolidated into a single legal action questioning the viability of the Total GPCD program and the authority of ADWR’s municipal conservation policies.
Facing litigation and persistent noncompliance with the municipal demand elements of the second plan, ADWR started to backpedal. Refraining from invoking regulatory mechanisms specified in the law, such as issuing fines or cease-and-desist orders, ADWR chose to weaken the existing conservation program in the middle of the management period. Authorized by the state legislature in 1994, the department again reduced the number of regulated providers (from fifty-one to thirty-two) by exempting all those delivering fewer than 250 acre-feet of water per year (compared to 100 in 1985). In addition, ADWR created an alternative conservation program called the Non-Per Capita Conservation Program (NPCCP), approved by the state legislature in 1992 and incorporated into the second plan in 1995 (fig. 2).Footnote 87
The new program was especially attractive to the municipal providers who did not meet their GPCD targets, since it only mandated implementation of twelve mostly voluntary “Reasonable Conservation Measures” (RCMs).Footnote 88 The few regulatory RCMs were limited to new developments, with focus on model homes in subdivisions, efficient plumbing fixtures, and homeowner-association restrictions on landscaping.Footnote 89 The alternative program also required providers to submit annual reports estimating the financial costs and water savings of their conservation measures. Compared to the GPCD program, to quote ADWR, the alternative program “exempts qualified large municipal providers from per capita conservation requirements by substituting [RCMs].”Footnote 90 In other words, ADWR allowed noncomplying providers to join a program that lacked standards for water use, and, instead, primarily required a suite of conservation efforts. The program assumed the measures would lead to reductions in per capital water use, but substantive gains in conservation were no longer a point of compliance.Footnote 91
When the first three cities—Chandler, Scottsdale, and Tempe—entered the alternative NPCC program in 1997, each had repeatedly missed their conservation targets in the first and second plans.Footnote 92 While ADWR sought a steady reduction in GPCD, consumption rates for these cities actually increased over time (fig. 2). In the new program, providers merely had to provide statements of their estimated water savings from the RCMs, often with vague statements such as: “It is assumed that with becoming more aware of water usage [with informational campaigns] people will use less water on a daily basis.”Footnote 93 Such claims contradict empirical research and prevailing theories about what motivates water-use behaviors.Footnote 94 In fact, a recent nationwide study of demand management programs reported that efforts “based on public awareness, customer service, [and] utility goodwill” often pose as water conservation “when in fact little in savings has been achieved.”Footnote 95
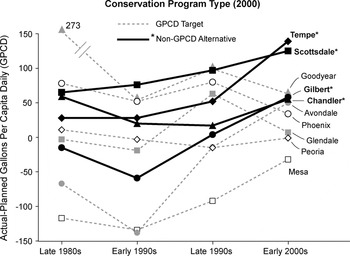
Actual Minus Planned Water Use in the Largest Municipalities of Metropolitan Phoenix Across Two Decades
This figure illustrates the amount by which ten municipalities have either failed to meet (>0) or exceeded (<0) their municipal water-conservation targets between the late 1980s and early 2000s. A rising line represents the increasing failure to meet regulatory water-use targets over time. The four cities that joined the alternative (NPCC) program are highlighted with an asterisk* in the legend and by thick black lines in the graph.
Note: The source of the first planned GPCD targets (1987–91) is ADWR, FMP: 136–37; numbers for the second (1992–94), third (1995–99), and fourth (2000–2001) targets are from ADWR, SMP: 314. The sources and dates of the actual water-use rates: 1988 GPCD figures from ADWR, “Press Release” 18 August 1989 in MCPP, Phoenix AMA, ADWR; 1995 GPCD figures from ADWR, TMP: 5-78, 5-79; 1998 GPCD figures from Phoenix AMA Area Director files, Phoenix AMA, ADWR; 2000 GPCD figures were calculated by authors because ADWR has not released calculations. The 1995 figures represent average annual GPCD rate for 1992–96 because this is how ADWR published the data in 1999. The authors worked in conjunction with ADWR staff to devise a formula for the 2000 figures that mimics ADWR’s previous calculations: the total gallons delivered in the service area was divided by the population of the service area for the same year, and then divided by 365 for a daily rate. Regarding population estimates, we added the number of single and multifamily housing units from the water provider’s annual reports to ADWR and multiplied this figure by the average annual household size and average occupancy rates from the Census Bureau.
While the two programs are legally “equivalent,” the Arizona Republic acknowledged that the alternative program was virtually a loophole for providers wishing to avoid regulation under the GPCD program. Discussing the fourth city (Gilbert) to join the program, the newspaper reported that the suburban community’s average water consumption in 2000 was 220 GPCD.Footnote 96 With a mandated target of 184 GPCD, the rationale for joining the program was “to get state regulators off their backs.”Footnote 97 The benefits of the alternative program, including license to violate the GPCD target, outweighed the administrative and financial burden of adopting the RCMs.Footnote 98 While ADWR gave the impression that water savings in both of the programs would be equivalent, the town’s logic in joining the NPCCP demonstrates that the two programs were in fact quite different.
The development of the NPCC program reveals a fundamental shift in ADWR’s approach to municipal conservation. In the first planning period, the state mandated substantive outcomes while maintaining procedural flexibility as to how providers achieved water-use standards. In the second period, firm GPCD targets were partly abandoned in favor of a suite of specific actions untethered to performance. Not only is this shift counter to policy perspectives, but the move toward a procedural program merely documenting conservation activities, such as the number of landscape brochures distributed annually, significantly weakened municipal water conservation in the Phoenix area. Over a period of fifteen years, local providers successfully leveraged regulatory flexibility from the state—that is, the flexibility to violate conservation targets and avoid penalties for high water-use rates.
The Third Management Period (2000–2010)
As with the second plan, the fundamental objective of the municipal conservation program in the Third Management Plan was to “achieve additional reasonable reductions in per capita use.” After adopting the third plan in 1999, ADWR continued to monitor and enforce GPCD targets based on each city’s unique “conservation potential” with the exception of the select municipal providers in the alternative NPCC program. But after some legal setbacks, the state moved entirely away from enforcing specific water-reduction targets in favor of a program simply requiring “reasonable conservation measures.” Essentially redefining compliance with the law, ADWR resorted to measuring effort rather than accomplishment. During this planning period, they also stopped tracking GPCD.
A number of court rulings threatened the viability of the municipal conservation program during this time period. In 2000, AWC filed a new lawsuit challenging the third plan.Footnote 99 Requesting judicial review of the management plan, another company filed a complaint against ADWR in Superior Court.Footnote 100 In August 2000, Judge Roger Kauffman issued a ruling against ADWR in the earlier litigation against the second plan, writing, “The second groundwater management plan cannot be enforced as written because it fails to address water utilization by end users.”Footnote 101 According to Kauffman, the GPCD requirements for the private utility were unlawful because the burden of conservation is placed on the water provider, not the customer. The ruling questioned ADWR’s statutory authority to regulate municipal providers. In the face of this legal challenge and increasing budget constraints, the agency stopped collecting annual reports from providers and put its GPCD compliance program in abeyance. A legal journal gently summarized the dormancy of the municipal program: “Arizona’s water conservation program has been ‘on the back burner,’ in a manner of speaking, given the unresolved issues regarding its enforceability.”Footnote 102
A subsequent decision issued by the Arizona Court of Appeals in 2003 maintained the decision of the lower court. The municipal conservation requirements remained unenforceable for AWC’s utility in Apache Junction and, by implication, the entire Phoenix area. ADWR then appealed this decision to the Arizona Supreme Court, and the tables turned. In June 2004, the Arizona Supreme Court determined that ADWR does indeed have the authority to enforce conservation requirements on municipal water providers without regulating end-users (that is, utility customers).Footnote 103 While the court ultimately decided in favor of ADWR, the department nevertheless continued to move away from specific targets for actual water use. ADWR and the private water companies informed the court, late in 2004, that they were working together to reformulate the municipal conservation program.Footnote 104 In consideration of the collaborative planning process, the court placed both lawsuits on the inactive calendar.Footnote 105
Ultimately, ADWR decided to make the Total GPCD program optional, while all other providers would be placed in a modified version of the non-per capita conservation program. The new program emphasized a number of entirely voluntary best-management practices (BMPs), with focus on outreach and incentives. Although voluntary approaches have been praised for their lack of coercion and their community-based features, scholars question their effectiveness.Footnote 106 What had previously functioned as a loophole—a substitution for providers who could not achieve reductions in per capita water use—became the foundation of the municipal demand management program in the Phoenix region. The proposed changes were finalized when Governor Napolitano signed a bill amending the municipal conservation program for the third plan on April 24, 2007.Footnote 107
Under the new program, providers are required to engage in conservation education by providing free informational materials to the public and by contacting water customers at least twice annually. Beyond this base program, providers must implement one or more conservation practices based on a “tiered approach” in which the number of service connections in a provider’s territory determines the number of BMPs required (one, five, or ten).Footnote 108 In particular, “providers may choose to implement any of the BMPs” on a specified list, including those already implemented.”Footnote 109 With conservation activities under way for some time now and continued high rates of water use throughout the region, the ability of the modified program to achieve substantial reductions in per capita water use is questionable.
ADWR’s regulatory reforms have camouflaged violations at the substantive heart of the law behind a facade of commitment to largely meaningless regulatory actions. Supporters of the modified conservation program argue that one of its benefits is increased rates of compliance. However, “compliance” under the new program is measured by the mere existence of mostly voluntary programs. As a representative from AWC advised at an ADWR stakeholder meeting: “Compliance determinations should be based on measures implemented and methods used to implement [them], not on the actual level of participation or [water] savings achieved.”Footnote 110 If the program is not evaluated on the basis of savings or actual water use rates, then it is functionally irrelevant to the goals of the GMA.
Under the region’s “current use scenario” in the third plan, groundwater overdraft is estimated to rise by over 30 percent between 1995 and 2025, making it impossible to reach safe yield.Footnote 111 In 1999, ADWR and the state auditor general both acknowledged that the “current regulatory structure” was insufficient for meeting safe yield.Footnote 112 In 2001, the Governor’s Water Management Commission agreed, and in 2005 ADWR’s annual report acknowledged that “all credible predictions for the year 2025 show continued overdraft conditions.”Footnote 113 The erosion of regulatory standards and lack of enforcement in demand management contribute to this failure, and the adoption of the modified non-per capita conservation program will likely exacerbate the situation or, at the very least, perpetuate the status quo of relatively high water-use rates in the desert metropolis of Phoenix.
To be fair, some areas in the Phoenix region have made more progress than others in reducing their water-use rates or meeting their GPCD targets (for example, see Goodyear and Peoria in fig. 2). Although the reasons underlying the variability in water demand across the region are complex, one overall pattern is lower and declining water-use rates in recently developed suburban areas along the metropolitan fringe, where new housing developments are equipped with drought-tolerant landscapes and the latest water-saving devices. Such gains in efficiency are at least partly due to mandatory conservation standards, from national plumbing standards to local homeowner associations’ (especially newer ones) restrictions.Footnote 114 Regardless, the regional disparities in water-demand rates highlight the inequitable use of a resource subject to the tragedy of the commons, such that advances in efficiency on the part of some municipalities are counteracted by foot-dragging, water-devouring municipalities that contribute more substantially to regional demand and aquifer depletion.Footnote 115 As a whole, the historic water-policy trends we documented for demand management in the Phoenix area reflect the powerful influence of political forces, capitalist interests, and social momentum in essentially maintaining business as usual.Footnote 116
CONCLUDING THOUGHTS: POLICY LESSONS AND BROADER SIGNIFICANCE
This case study shows how a progressive policy designed to achieve sustainability goals can be eroded within an institutional context that appears committed to the policy. Custom-designed conservation programs provided cover for ADWR and the municipalities to claim progress and due diligence, while in fact the substantive goals of the law were not being met. The failures we have documented in municipal demand management extend to the agricultural sector as well, but that is another story.Footnote 117 The GMA may have been a landmark water law when passed in 1980. However, subsequent amendments, regulatory loopholes, and constituent noncompliance have gutted its original intent and promise.
The shift from top-down regulatory policies to bottom-up voluntary approaches reflects a broader trend toward decentralization and market-based solutions. Our findings warrant a note of caution about such neoliberal policies. While the voluntary participation of constituents in policy implementation is preferable to command-and-control programs, the state must be willing to use its authority, incentives, and penalties when goals are not being met. Otherwise, in the case of groundwater overdraft, the tragedy of the commons is perpetuated. When one city meets its target reductions in water use, it is disadvantaged vis-à-vis other cities that do not achieve similar reductions. Meanwhile, violators that maintain high consumption rates benefit from the savings to the regional water budget by cities that comply with their water-use targets. The state can avoid this result and advance both equity and efficiency in demand management by leveling the playing field and enforcing clear outcome-oriented goals.
Las Vegas offers an instructive example. Following a 2002 water-supply crisis, the water authority mandated aggressive conservation policies, such as strict turfgrass restrictions and enforcement of ordinances aimed at minimizing water waste, leading to a 10 percent drop in per capita consumption from 2003 to 2005.Footnote 118 This remarkable accomplishment derived from applying regulations uniformly across the region, following the development of a strong regional agency to oversee water management.Footnote 119 In effect, the top-down regional water-conservation initiatives made it impossible for individual municipalities to compete for new development through weak regulations or lax water-use standards.
State-level water-managing agencies like ADWR cannot level the playing field and achieve water conservation and sustainable groundwater use without substantial political will and support from the legislature, the courts, and the public. Since enactment of the Arizona Groundwater Management Act in 1980, ADWR undercut its own efforts and authority by exempting dozens of small water providers from demand management programs, tolerating and even enabling noncompliance among water providers, and abandoning mandates for concrete reductions in per capita consumption in favor of inadequate voluntary information- and incentive-based programs. But ADWR did not backpedal in a vacuum. Its behavior was shaped by social, political, and economic circumstances: concerted resistance from water providers, an entrenched antiregulatory political culture, formidable interests in the growth industry, timid central leadership within the state, and the legislature’s weakening amendments and stingy purse strings. The entire institutional setting evolved into a design for failure, both in achieving reductions in water demand and in attaining the ultimate goal of safe yield of groundwater.
Many policy analysts have called for reforms to get Arizona back on the path to sustainable water management, but a deficit of leadership and the lack of an imminent water-supply crisis have so far favored the status quo of comparably high water-use rates, supply-side alternatives, and an economy largely dependent on perpetual population growth and land development.Footnote 120 Even in the context of a decade-long drought, the region failed to implement water-use restrictions and continued to rely on groundwater pumping despite the GMA’s goal of eliminating groundwater overdraft.Footnote 121 The crisis that led to the passage of the GMA was essentially a funding crisis: the federal government’s threat to end financial support for the CAP canal. The GMA solved that short-term crisis, but it was also designed to solve a longer-term water-resource problem. After twenty-eight years of implementation, the state’s largest metropolitan region seems unable and unwilling to make significant progress toward the long-term goal of restraining groundwater overdraft. Instead, it remains focused on supply-oriented strategies and using, rather than conserving, renewable surface water.
Delaying demand management only compounds the state’s challenges. Many scholars suggest that the era of large reclamation projects has passed. Meanwhile, the future of the southwestern United States is looking hotter and drier, making the renewable supply of river water less reliable.Footnote 122 Perhaps a drying climate will lead to a rebirth of another large-scale water-development era.Footnote 123 But the economic costs, legal limits, and political feasibility of such projects face an uphill battle given influential environmental laws and constituents, interest-group and interstate rivalries, escalating energy costs for desalination and pumping, and current budget deficits in the state of Arizona and the United StatesFootnote 124 In recognition of the fundamentally limited nature of water supplies and the actuality of escalating scarcity, both physically and legally, soft-path demand-side strategies to reduce consumption must be as rigorously pursued today as the supply-side hard-path strategies of yesterday. After all, a gallon saved is a gallon earned, and the effective management of water demand is vital to quench the seemingly insatiable thirst of rapidly growing desert cities, where sustainability depends on the efficient and responsible use of a scarce, precious, and finite resource.


