


1. Introduction
Self-incompatibility (SI) has evolved in many flowering plant families to avoid self-fertilization (de Nettancourt, Reference de Nettancourt2001). SI is in most cases under genetic control by a single Mendelian locus, the S locus, which typically contains several genes (Silva & Goring, Reference Silva and Goring2001). In the sporophytic type of SI (SSI), the SI phenotype of the haploid pollen is determined by the S-locus genotype of the diploid parent, the sporophyte (Richards, Reference Richards1997). In the Brassicaceae family, which has the best-studied SSI system, two adjacent S-locus genes, SRK and SCR, determine the female (pistil) and male (pollen) SI specificities, respectively (Stein et al., Reference Stein, Howlett, Boyes, Nasrallah and Nasrallah1991; Schopfer et al., Reference Schopfer, Nasrallah and Nasrallah1999; Suzuki et al., Reference Suzuki, Kai, Hirose, Fukui, Nishio, Takayama, Isogai, Watanabe and Hinata1999). The SRK gene is expressed as a trans-membrane receptor kinase in the stigma, where it recognizes the soluble gene product of its cognate SCR, which is expressed at the pollen surface (Takayama et al., Reference Takayama, Shimosato, Shiba, Funato, Che, Watanabe, Iwano and Isogai2001). The SRK and SCR genes are typically inherited as a single unit (Casselman et al., Reference Casselman, Vrebalov, Conner, Singhal, Giovannoni, Nasrallah and Nasrallah2000), as recombination between the two determinant genes would disrupt the SI response (Uyenoyama & Newbigin, Reference Uyenoyama and Newbigin2000). Indeed, population-based studies have found evidence for the near-absence of historical recombination between SRK and SCR (Kamau & Charlesworth, Reference Kamau and Charlesworth2005; Charlesworth et al., Reference Charlesworth, Kamau, Hagenblad and Tang2006; Hagenblad et al., Reference Hagenblad, Bechsgaard and Charlesworth2006; Takuno et al., Reference Takuno, Fujimoto, Sugimura, Sato, Okamoto, Zhang and Nishio2007).
In SSI, there is typically a dominance relationship among S-locus alleles, which, for a given pair of alleles, may differ between the stigma and the pollen (Richards, Reference Richards1997). In the Brassica genus, S-locus alleles belong to either of two dominance classes, where class I alleles are dominant over class II alleles in pollen but co-dominant in the stigma (Nasrallah et al., Reference Nasrallah, Nishio and Nasrallah1991). Dominance relationships among S alleles are more complex in Arabidopsis with four dominance classes being identified to date (Prigoda et al., Reference Prigoda, Nassuth and Mable2005). SI is a classic example of a trait evolving under strong negative frequency-dependent selection with rare S alleles having more mating opportunities than more common alleles, because of the higher number of compatible mates available (Wright, Reference Wright1939; Schierup, Reference Schierup1998). This situation accounts for the high levels of polymorphism typically observed at S loci (Lawrence, Reference Lawrence2000). The relative fitness of a given S allele therefore depends mainly on its current frequency in the population. In SSI systems, however, the position of an allele in the dominance hierarchy also affects its fitness: a recessive S allele that is not expressed may ‘escape’ recognition in a particular mating and may thus attain a higher population frequency than a dominant allele – the so-called ‘recessive effect’ (Sampson, Reference Sampson1974; Schierup et al., Reference Schierup, Vekemans and Christiansen1997; Vekemans et al., Reference Vekemans, Schierup and Christiansen1998; Uyenoyama, Reference Uyenoyama2000; Billiard et al., Reference Billiard, Castric and Vekemans2007).
Because of the special dynamics of S alleles in natural populations, the existence of additional fitness effects, over and above those determined by the frequency and dominance of S alleles, has been proposed. In particular, since frequency-dependent selection maintains S alleles in a population for periods of time much longer, on average, than alleles at neutral loci (Vekemans & Slatkin, Reference Vekemans and Slatkin1994), S alleles may build up a significant genetic load by accumulating deleterious mutations (Uyenoyama, Reference Uyenoyama2003). Also, due to the reduced rate of recombination in the S-locus region, each S allele will carry a unique array of mutations (Uyenoyama, Reference Uyenoyama2003, Reference Uyenoyama2005). Generally, purifying selection will eventually ‘purge’ deleterious mutations from the population, unless population size is very small (e.g. Gale, Reference Gale1990). At the S locus, however, selective purging may be inefficient for two reasons: first, the typically high heterozygosity at the S locus will shelter recessive deleterious mutations from selection (Uyenoyama, Reference Uyenoyama1997; Glémin et al., Reference Glémin, Bataillon, Ronfort, Mignot and Olivieri2001). Secondly, purifying selection against deleterious mutations, whether recessive or dominant, will be counteracted by the strong frequency-dependent selection favouring rare S alleles (Glémin et al., Reference Glémin, Bataillon, Ronfort, Mignot and Olivieri2001). As a consequence, the contribution from deleterious mutations to overall S-allele fitness may significantly influence equilibrium frequencies of S alleles in natural populations (Uyenoyama, Reference Uyenoyama2003). It should be noted that the idea of an allele-specific mutational load applies more generally to loci in low-recombination regions experiencing balancing (including frequency-dependent) selection (Uyenoyama, Reference Uyenoyama2005).
Because S alleles that carry a relatively large mutational load may suffer a segregation disadvantage compared with less affected S alleles, due to selection at the gametophytic (haploid) and/or zygotic stage, observations of unequal segregation ratios of S alleles in controlled crosses have been taken as evidence for the presence of deleterious mutations segregating at the S locus in natural populations of self-incompatible plants (Lawrence & Franklin-Tong, Reference Lawrence and Franklin-Tong1994; Bechsgaard et al., Reference Bechsgaard, Bataillon and Schierup2004; Stone, Reference Stone2004). In Brassica, indications of distorted segregation of markers linked to the S locus have been reported in conjunction with genetic map construction in cultivated Brassica napus (Cheung et al., Reference Cheung, Champagne, Hubert, Tulsieram, Charne, Patel and Landry1997) and Brassica oleracea (Camargo et al., Reference Camargo, Savides, Jung, Nienhuis and Osborn1997), but no studies of S-locus segregation have been carried out in any wild Brassica species. Here, we investigate the segregation of alleles at the SRK gene in the wild species Brassica cretica using experimental crosses between parents with known genotypes.
2. Materials and methods
2.1. Plant material and crosses
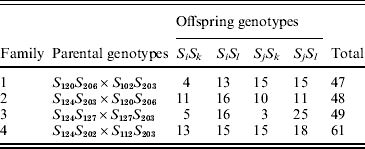
B. cretica is a diploid (2n=18) species occurring mainly in the Aegean region in the eastern Mediterranean (Snogerup et al., Reference Snogerup, Gustavsson and von Bothmer1990). It belongs, together with wild and cultivated B. oleracea, to a group of closely related Brassica species, which all carry the Brassica C-genome (Harberd, Reference Harberd1972; Kianian & Quiros, Reference Kianian and Quiros1992; von Bothmer et al., Reference von Bothmer, Gustavsson and Snogerup1995). For the present study, four full-sib families were obtained from crosses made with plants originating from a B. cretica population at Moni Kapsa on eastern Crete (Table 1). The same plant was used as the maternal and paternal parent to families 1 and 2, respectively (Table 1), while the remaining six parents were unique. The parental plants were unrelated.
Parental and offspring SRK genotypes in four full-sib B. cretica families. The parental genotypes are given as SiSj (maternal parent)×SkSl (paternal parent/pollen donor). Alleles S102–S127 and S202–S206 are class I and class II alleles, respectively
2.2. DNA extraction and S-locus genotyping
Genomic DNA was extracted from young, fresh leaf tissue ground under liquid nitrogen and processed with the DNeasy Plant Mini kit (Qiagen) according to the instructions of the manufacturer. From each parental plant, approximately 1200 bp of the SRK kinase domain (exons 4–7) were amplified using primers specific for each of the two dominance classes. The primer pairs KD5, KD8 and KD4, KD7 were used to amplify class I and class II alleles, respectively. Separate amplification reactions were performed for each dominance class. For primer sequences see Park et al. (Reference Park, Lee, Watanabe, Takahata and Nou2002). The amplification reactions contained 1·5 mM MgCl2, 0·25 mM dNTP, 1·5 μM of each primer and 0·3 U of AmpliTaq Gold DNA polymerase (Applied Biosystems) in a 20 μl reaction volume. The cycling scheme included 95°C for 8 min, 30 cycles of 94°C for 1 min, 56°C for 2 min and 72°C for 2 min, and finally 72°C for 7 min. PCR products from parental individuals having both class I and class II alleles (I/II heterozygotes; six out of a total of seven distinct parents) were sequenced directly, whereas the PCR product from the single parent lacking class II alleles (apparent I/I homozygote) was first cloned in the pGEM-T vector system (Promega) before sequencing six positive clones. In both cases, sequencing was done in both directions using the original PCR primers and BigDye chemistry (Applied Biosystems). Sequences were assembled and edited in SeqMan (Lasergene6, DNAstar). Restriction enzyme recognition site differences between each pair of parents were identified from the SRK sequences obtained and offspring genotypes were determined by cleaving the SRK amplification product from each offspring individual with allele-specific restriction enzymes (BclI, PpiI, DraI and AluI were used to distinguish class I alleles in families 1, 2, 3 and 4, respectively; HindIII were used for class II alleles). In this way, every allele segregating in each family could be unambiguously identified.
2.3. Data analysis
Offspring SRK genotype data from each family were analysed within a maximum-likelihood framework following Bechsgaard et al. (Reference Bechsgaard, Bataillon and Schierup2004). Briefly, the observed proportions of SRK genotypes among offspring in each of four families were fitted to three nested models describing alternative patterns of segregation of parental alleles among the offspring: (i) a Mendelian model with no free parameters where there are equal numbers of the four genotypes, (ii) a ‘gametic’ model with two free parameters where offspring genotype proportions are (½+α1)(½+α2), (½+α1)(½−α2), (½−α1)(½+α2) and (½−α1)(½−α2), where ½+αi and ½−αi denote the proportions in which the two alleles from parent i segregate, and (iii) a ‘zygotic’ model with three free parameters where offspring genotype proportions are x 1, x 2, x 3 and 1−x 1−x 2−x 3. The Mendelian model describes a situation with perfect Mendelian segregation. In the gametic model, alternate alleles from one or both of the parents are inherited in unequal proportions, presumably as a result of selection during the gametophytic (haploid) phase. In the zygotic model, which is fully parameterized, offspring proportions may take any value from 0 to 1; under this model, deviations from Mendelian proportions may be the result of selection during the gametophytic and/or sporophytic (zygotic) phase. For each model and family, parameter values were found that maximized the likelihood of the data. For each family, models were compared hierarchically by a likelihood-ratio test with P values obtained from a χ2 distribution. The magnitude of segregation distortion was quantified by finding the maximum-likelihood value of α for each parent using a ‘reduced’ gametic model with one free parameter (α); statistical significance was determined by comparing with a reduced Mendelian model in which the two alleles from a given parent segregated in equal proportions. For further details on model formulation and statistical procedures, see Bechsgaard et al. (Reference Bechsgaard, Bataillon and Schierup2004).
3. Results
Between 47 and 61 offspring individuals from the four families were successfully genotyped (Table 1). In families 1, 2 and 4, both parents carried one SRK class I allele and one SRK class II allele (I/II heterozygotes; Table 1). In family 3, the maternal parent carried two SRK class I alleles (I/I homozygote), whereas the paternal parent was a I/II heterozygote (Table 1). The two class I alleles of the maternal parent in family 3 were, however, different; thus all parental individuals were S-locus heterozygotes. There was a total of five distinct class I alleles, and three distinct class II alleles, among the seven different parents (Table 1).
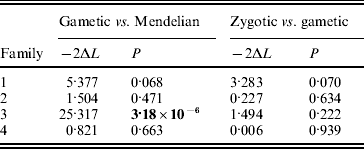
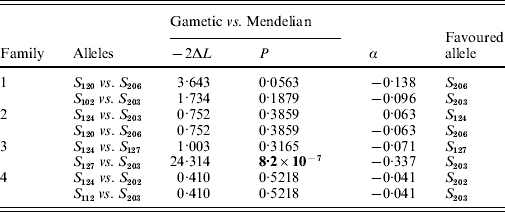
In two of the families (families 2 and 4), S-allele segregation conformed to a Mendelian model, whereas family 3 displayed a significantly skewed segregation pattern (Table 2). The deviation from Mendelian proportions in family 3 was not better explained by a parameter-rich zygotic model than by a reduced gametic model, as determined from the non-significant likelihood difference between the two models (Table 2). In the remaining family (family 1), the deviation from a Mendelian segregation ratio was close to being significant at the 5% level (Table 2). This family also showed the highest likelihood difference between the zygotic and gametic models, but, again, the difference failed to reach significance (Table 2). Analysing the segregation of SRK alleles from each parent separately, we found a significant segregation advantage of the class II allele S 203 over the class I allele S 127 in the paternal parent of family 3 (P=8·2×10−7, α=−0·337; Table 3), and a nearly significant segregation advantage of the class II allele S 206 over the class I allele S 120 in the maternal parent of family 1 (P=0·0563, α=−0·138; Table 3). No significant segregation distortion was detected in any of the remaining parents, but we note that in all but one of the class I/II heterozygous parents, segregation was in favour of the class II allele (Table 3).
Likelihood-ratio test of nested models of SRK allele segregation; −2ΔL denotes twice the difference in log-likelihood between the models compared. Boldface indicates significance at P<0·05
Likelihood-ratio test of nested models of SRK allele segregation in individual parents; −2ΔL denotes twice the difference in log-likelihood between the models compared; α is the magnitude of segregation distortion, the value of which refers to the first allele in each comparison. Boldface indicates significance at P<0·05
4. Discussion
We found a large and significant deviation from strict Mendelian segregation at the S locus in family 3 and a strong tendency towards non-Mendelian S-locus segregation in family 1. In both families, but less obviously so in family 1, the deviation could best be explained by a gametic model, indicating that selection has acted during the haploid gametic stage (Table 2). Gametic selection acting on S alleles has been inferred as the major cause of S-locus segregation distortion also in Papaver rhoeas (Lawrence & Franklin-Tong, Reference Lawrence and Franklin-Tong1994) and in Arabidopsis lyrata (Bechsgaard et al., Reference Bechsgaard, Bataillon and Schierup2004). These findings suggest that if S-locus segregation distortion is caused by accumulated deleterious mutations, as theory predicts, then these mutations are most likely expressed during the gametophytic stage. Even though a skewed segregation ratio is often observed at marker loci dispersed throughout the genome (e.g. in genetic mapping studies), segregation distortion at the S locus appears to be particularly pronounced. In a recent study, Leppälä et al. (Reference Leppälä, Bechsgaards, Schierup and Savolainen2008) found a higher rate of distortion at the S locus compared with the average of 16 unlinked markers distributed across all eight chromosomes in A. lyrata. In concordance with theory (e.g. Uyenoyama, Reference Uyenoyama2003), this finding implies that the particular evolutionary dynamics of the S locus (negative frequency-dependent selection and a low regional rate of recombination) will lead to an allele-specific mutational load.
Only the alleles from the paternal parent segregated unequally in family 3 (Table 3). Among these alleles, the S 203 allele had a segregation advantage over the S 127 allele (Table 3). S 203 is a class II recessive allele, while the alternative paternal allele is a class I dominant allele. Indeed, in six of the seven parents that were class I/II heterozygotes, the recessive class II allele had a segregation advantage (even if this was significant in one parent only; Table 3). Similarly, Bechsgaard et al. (Reference Bechsgaard, Bataillon and Schierup2004) found that segregation advantage accrued mainly to recessive S alleles in A. lyrata. In SSI species such as B. cretica and A. lyrata, dominant S alleles cannot appear in homozygous form, whereas recessive alleles can. For this reason, recessive S alleles can be expected to carry fewer recessive deleterious mutations since such mutations are more likely to be purged by selection when homozygous (Uyenoyama, Reference Uyenoyama1997; Glémin et al., Reference Glémin, Bataillon, Ronfort, Mignot and Olivieri2001). Moreover, dominant S alleles are expected to accumulate more dominant deleterious mutations by random drift due to their smaller effective population sizes compared with recessive S alleles (Bechsgaard et al., Reference Bechsgaard, Bataillon and Schierup2004). The combined effect would be a higher overall mutational load for dominant S alleles, which would explain the observations of unequal segregation in favour of recessive S alleles observed in both B. cretica and A. lyrata.
We found that the B. cretica S 203 allele apparently enjoys a substantial segregation advantage, at least in one of the four parents in which it occurred (Table 3). Segregation advantages of similar magnitude have been reported from A. lyrata (Bechsgaard et al., Reference Bechsgaard, Bataillon and Schierup2004). These results clearly indicate that the additional selective advantage provided by segregation distortion may significantly influence the frequencies of S alleles in natural populations. In A. lyrata, alleles favoured by segregation have been reported to be present in higher than expected number in a natural population (Bechsgaard et al., Reference Bechsgaard, Bataillon and Schierup2004; Schierup et al., Reference Schierup, Bechsgaard, Nielsen and Christiansen2006). In B. cretica, ongoing investigations indicate that the S 203 and S 206 alleles are indeed among the most common in natural populations of this species (K. Edh, unpublished results). Nevertheless, care should be taken when extrapolating results from a limited set of experimental crosses to the situation in natural populations, as the segregation advantage of a given S allele may differ among families. The B. cretica S 203 allele, for example, is present in all four families, but showed a significant segregation advantage in one family only (Table 3). The same phenomenon has also been observed in A. lyrata (Bechsgaard et al., Reference Bechsgaard, Bataillon and Schierup2004). Presumably, the absolute magnitude of segregation distortion in a certain family depends on the difference in mutational load between the two alleles in each parent.
Finally, we note that in family 3, both parents possessed a copy of the class I SRK allele S 127 (Table 1). Given that class I alleles are pollen dominant and stigma co-dominant, this cross should have been incompatible. We see a few possible explanations why this was not the case. First, even though the maternal and paternal S 127 alleles were identical with respect to the sequenced part of the kinase domain of the SRK gene, the alleles might differ in the S-domain, which codes for the part of the SRK protein directly involved in recognition (Kachroo et al., Reference Kachroo, Schopfer, Nasrallah and Nasrallah2001). We do not find this possibility very likely, however, since data from cultivated Brassica species show that SRK alleles carrying different SI specificities with a few exceptions differ substantially also at the kinase domain of SRK (Awadalla & Charlesworth, Reference Awadalla and Charlesworth1999; Takebayashi et al., Reference Takebayashi, Brewer, Newbigin and Uyenoyama2003). Secondly, the class I S 127 allele could be recessive to the class II S 203 in the pollen parent. However, class I alleles are always dominant over class II alleles in the close relative B. oleracea, and this dominance relationship appears to be the rule also in wild Brassica species (Glémin et al., Reference Glémin, Gaude, Guillemin, Lourmas, Olivieri and Mignot2005; K. Edh, unpublished results). Thirdly, S 127 may be a non-functional allele. We find this hypothesis the most likely for the following reasons: The SRK nucleotide sequence at exons 4–7 of the B. cretica S 127 allele is very similar to the B. oleracea S-28 allele (K. Edh, unpublished results), which, in turn, is similar to the dominant class I S allele S-f2 in Brassica rapa (Fujimoto et al., Reference Fujimoto, Sugimura, Fukai and Nishio2006), indicating that B. rapa S-f2, B. oleracea S-28 and B. cretica S 127 belong to the same allelic lineage (and share the same basic recognition specificity). Furthermore, Fujimoto et al. (Reference Fujimoto, Sugimura, Fukai and Nishio2006) observed that in B. rapa individuals heterozygous for S-f2 and the recessive class II S 60, allele transcription of both alleles was abolished leading to complete absence of S-genotype expression and concomitant loss of SI. Thus, even though the evidence is clearly circumstantial, the B. cretica S 127 allele and the B. rapa S-f2 allele may carry the same structural mutations that make them non-functional, explaining why the cross producing family 3 was compatible. Indeed, upon enforced self-pollination, all the offspring in family 3 produced seed (A. Ceplitis, unpublished results). However, whether the S 127 itself is non-functional, or linked to a different locus conferring self-compatibility, cannot be determined from the family 3 data alone. In fact, the B. oleracea S-28 is a fully functional allele. Since B. cretica is more closely related to B. oleracea than to B. rapa, shared mutations between B. cretica and B. rapa S alleles would be unexpected, but might have been caused by incomplete lineage sorting during speciation. This hypothesis must, however, be verified by more detailed studies of SRK expression in B. cretica. Nevertheless, even if the S 127 allele were non-functional, we should expect equal genotypic proportions in the offspring in the absence of segregation distortion. Hence, whatever the reason for the compatibility between the parents of family 3, it does not alter the conclusion of a significant segregation distortion of SRK alleles in this family. Together with previous studies, our results suggest that segregation distortion at the S locus might be a widespread phenomenon with a potentially significant influence on S-allele frequencies in natural populations.
We thank Bengt Jacobsson for taking care of the plant material. We are grateful to two anonymous reviewers for constructive comments on the manuscript. This work was financially supported by a grant from the Crafoord Foundation to A.C.



