

1. Introduction
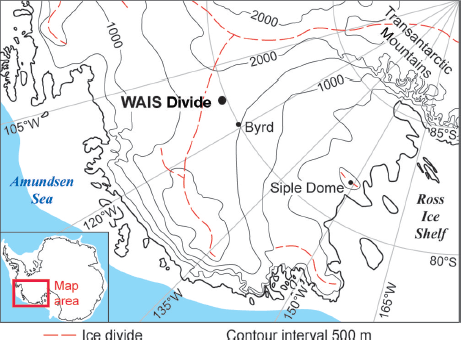
The WAIS (West Antarctic Ice Sheet) Divide ice core was recently recovered over five drilling seasons in West Antarctica from 2007/08 to 2011/12 with an additional replicate coring season in 2012/13. The drill site location (79°28.0580 S, 112°05.1890 W; surface elevation 1766 m; Fig. 1) experiences a current mean annual surface temperature of –31 1°C and a current net mean annual accumulation of 22 cm ice eq. a–1 (Reference Conway and RasmussenConway and Rasmussen, 2009; Reference FegyveresiFegyveresi and others, 2011). The drillhole was completed to a total depth of 3405 m at the end of the 2011/12 season, ending 50 m off the bed to avoid possible contamination of subglacial ecosystems, and there was no evidence of basal debris or other interaction with the bed in the deepest ice recovered.
Location of the West Antarctic Ice Sheet (WAIS) Divide ice-core drill site and other West Antarctic ice-core locations.
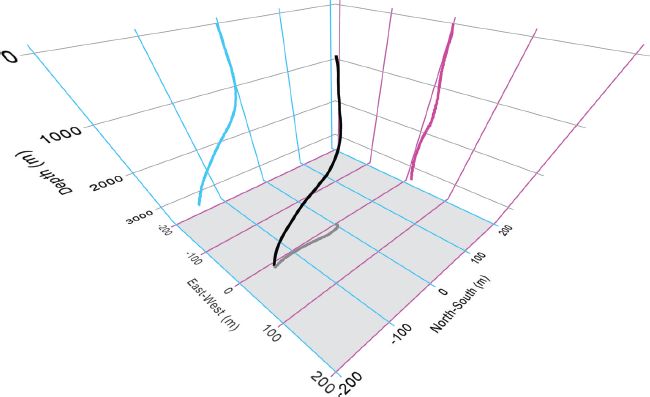
Borehole geometry (Fig. 2; personal communication from A. Shturmakov, 2013) was reconstructed utilizing inertial and magnetic sensing data from a 3DM-GX1® navigation module mounted in the instrumentation section of the drill sonde (personal communication from N. Mortensen, 2014). Inclination of the borehole was within 1° of vertical to a depth of 1000 m, below which it increased to a maximum value of 5.14° at 1873 m. The inclination decreased below this depth, dropping below 3° at the bottom of the hole. The bottom of the borehole was 145 m south of the top of the borehole at the time of its completion. Distance along the hole to the bottom, measured as the cable payout length, differs from true vertical depth by 5 m. Re-logging the borehole for deformation rate information is planned for the 2014/15 and 2016/17 field seasons (personal communication from E. Pettit and R. Obbard, 2014). The age at the bottom of the core is estimated at 68 ka before 1950 CE (WAIS Divide Project Members, 2013).
Geometry of the WDC06A main borehole at WAIS Divide (source: A. Shturmakov, Ice Drilling Design and Operations group, University of Wisconsin, USA). Directions are relative to geographic north. Blue, magenta and gray lines are projections of the borehole geometry (black) onto the north–south/depth plane, east–west/depth plane and east–west/north–south plane respectively. Borehole geometry was reconstructed utilizing data from a three-axis inertial and magnetic sensing navigational module mounted in the instrumentation section of the drill sonde.
This paper reports the measurements of the physical properties of the WAIS Divide main core (WDC06A) and provides a comparison between this core and others from West Antarctica and central Greenland.
2. Sample Preparation
The WAIS Divide main core was processed to completion over the course of four summer processing lines in 2008, 2010, 2011 and 2012 at the US National Ice Core Laboratory, Denver, Colorado. Core recovered over the brittle-ice depth range (650–1300 m) during the 2009/10 drilling season was left to overwinter on site and was processed during the 2011 processing line; the rest of the core was processed during the boreal summer after recovery.
Continuous visual stratigraphy was carried out on the entire core after initial side-wall cuts for continuous sampling were made and the resulting surface had been planed for a.c. and d.c. electrical-conductivity analysis. In addition to visual inspection, high-resolution digital images were acquired for each meter of ice using the optical scanning system developed for this purpose (Reference McGwire, McConnell, Alley, Banta, Hargreaves and TaylorMcGwire and others, 2008).
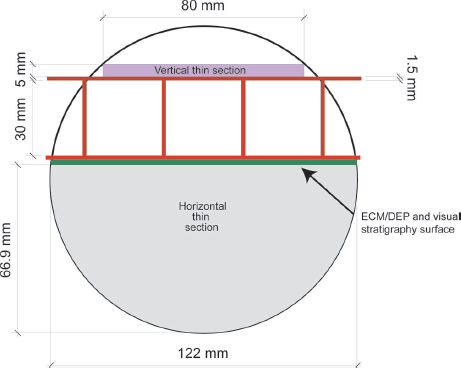
Vertical and horizontal 10 cm 10 cm thin and thick sections, for grain and bubble analyses respectively, were prepared from 1 cm thick samples taken on a 20 m sampling interval from 120 m depth to 3402 m depth (Fig. 3). All surfaces were microtome-polished to a 1 µm finish. Thin sections were mounted to glass substrates using a thin layer of cyanoacrylate adhesive and reduced to a thickness of 0.3–0.5 mm (first-order to low second-order maximum birefringence colors) by microtome. Bubble sections were affixed to their glass substrates by means of a water/ice bead around the edges, and reduced to a thickness of 1.0–2.0 mm by microtome.
WAIS Divide main core cut plan showing the configuration of samples taken for horizontal and vertical thin and thick sections, and the surface at which d.c. electroconductivity (ECM) and dielectric profiling (DEP) measurements were performed and visual stratigraphy was recorded.
Thin sections were photographed in cross-polarized transmitted light at a camera resolution of 240 pixels (px) in–1 (94.5 px cm–1) and a scale factor of 800 px cm–1 using a computer-controlled digital single-lens reflex (DSLR) camera fitted with a 105 mm autofocusing micro lens. The resulting image files were 8-bit RGB (red, green, blue) color images. At this scale, nine individual frames were typically required to photograph the entirety of each sample. These frames were merged without distortion (only rotation and x –, y –positioning were permitted) to create a single image encompassing the entire sample. Samples were photographed in two optical orientations in order to permit unambiguous grain-boundary location assignments during analysis. Fabric and grain analyses were carried out on the same samples.
Bubble sections were imaged with a computer-controlled DSLR camera at a resolution of 300 px in–1 (118 px cm–1) and a typical scale factor of 670 px cm–1. Samples were photographed in 90° illumination using a square array of unidirectional LED light sources in the plane of the section and a customized height-adjustable stage to ensure the best possible contrast at bubble surfaces. In this configuration, only light that has scattered off the bubbles or other features (e.g. clathrate inclusions) reaches the camera lens. The resulting image files were 8-bit grayscale images. As with the thin sections, full coverage of an entire sample typically required nine frames that were later merged without distortion to create a single image file. Bubble section thicknesses were measured and recorded using digital calipers at the time the sections were photographed, to permit bubble-number density calculations. Because no glue or water intruded between the sample and the glass plate, which form a tight and bubble-free bond, the total thickness is the sum of the sample and glass-plate thicknesses.
Three types of electrical measurements were made along the core: a.c. and d.c. electrical conductivity measurements (ECM; Reference HammerHammer, 1983; Reference TaylorTaylor and others, 1993) were made from 6 to 113 m and from 1300 to 3405 m; dielectric profiling (DEP; Reference MooreMoore, 1993) was performed from 113 to 1300 m. The d.c. ECM below 1955 m was run along multiple (typically seven) tracks across the face of the ice core, allowing a two-dimensional (2-D) picture of the electrical stratigraphy (Reference Taylor and AlleyTaylor and Alley, 2004). The d.c. ECM records were also stacked to produce a single record for identifying annual layers. First, the apparent dip of the layers was calculated and the tracks aligned. Then high and low values at each position along the core were excluded and the remaining tracks were averaged.
3. Visual Stratigraphy
A visual examination of the uncut core and logging of features of interest were carried out in the field immediately after recovery. A more detailed inspection under controlled lighting on a freshly planed flat surface (Fig. 3) was conducted as part of each core-processing line carried out for the WAIS Divide core. Meticulous examination and recording of features such as thin, clear, nearly bubble-free crusts, annual layering (and its inclination to the core axis), cloudy layers and particulate layers provides a visual key for chemical, isotopic and electrical determinations.
3.1 Methods
Using diffuse transmitted light opposite a planed surface in a light-shielded booth, visual stratigraphy of each 1 m long segment of the entire WAIS Divide main core was conducted by the same individual (M.K.S.), with occasional overlapping observations by other members of the author team. This effort was aided by previous experience the stratigrapher gained while visually examining the entire ice core returned from Siple Dome, Antarctica (Reference TaylorTaylor and others, 2004), using similar equipment and methods. Observations were recorded in 1 m long logbooks designed for this purpose, which were later digitized.
3.2 Observations
The character of the annual signal as revealed visually in an ice core evolves throughout the depth of the core. In the firn layer, the annual signal reveals itself in the contrast between the initially coarse-grained, low-density summertime hoar layers vs the fine-grained, higher-density winter layers (Reference AlleyAlley and others, 1997). Although the near-surface summer/winter contrasts may subsequently be altered by the effects of seasonally varying impurity concentrations on processes in the firn (Reference Freitag, Kipfstuhl, Laepple and WilhelmsFreitag and others, 2013), seasonal contrast generally is retained below the firn in bubble number-density and size (Reference Spencer, Alley and FitzpatrickSpencer and others, 2006). At depths below which clathrates begin to form and bubbles are increasingly absent, indications of annual layers are very faint at WAIS Divide. Based on other datasets from this core, and analogy with cores from other sites (e.g. Reference GowGow and others, 1997; Reference SvenssonSvensson and others, 2005), it is likely that the weak annual signal arises from some combination of small seasonal variations in dustiness, and their effects on grain-size contrast. As is common in annual-layer dating (e.g. Reference AlleyAlley and others, 1997), the stratigrapher looked for a repeating wavelength of variation. This introduces the possibility of errors caused by combining two years into one in the case of anomalously low accumulation, or splitting one year into two when accumulation was anomalously high.
A comparison of the annual-layer thickness determined by visual stratigraphic means and the annual-layer thickness as determined from the WDC06A-7 depth–age scale (which was produced without input from the visual stratigraphy results) is presented in Figure 4. Data in Figure 4 were averaged over 50 m intervals, the depth range covered per logbook used in the visual stratigraphy. Observations were sufficiently difficult near some depths that the exact location of the layer closest to each end of each core section observed was less accurate than those farther into the core; thicknesses of years spanning two core sections were omitted in calculating average thicknesses, although this has little effect on the averaged data.
Comparison of mean annual-layer thicknesses as derived from visual stratigraphy and from the WDC06A-7 timescale.
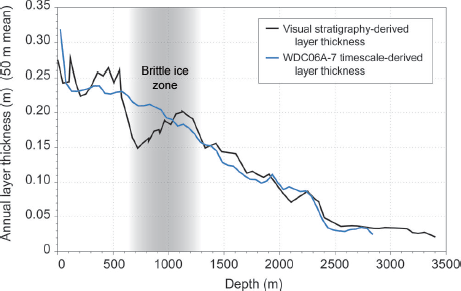
The largest deviations between annual-layer thicknesses determined from the visual stratigraphy alone and those determined from the methods used in the construction of the WDC06A-7 depth–age scale in Figure 4 may in part arise from the influence of the ‘brittle ice’, which occurred between about 650 and 1300 m depth; visual observations are complicated by the additional fracturing and lower core quality caused by the unavoidable effects of relaxation of high-pressure bubbles. Aside from the differences observed in the brittle ice zone, the layer thicknesses determined from the visual stratigraphy alone match those derived from the published WDC06A-7 depth–age scale relatively well, with the best agreement occurring below 1300 m depth.
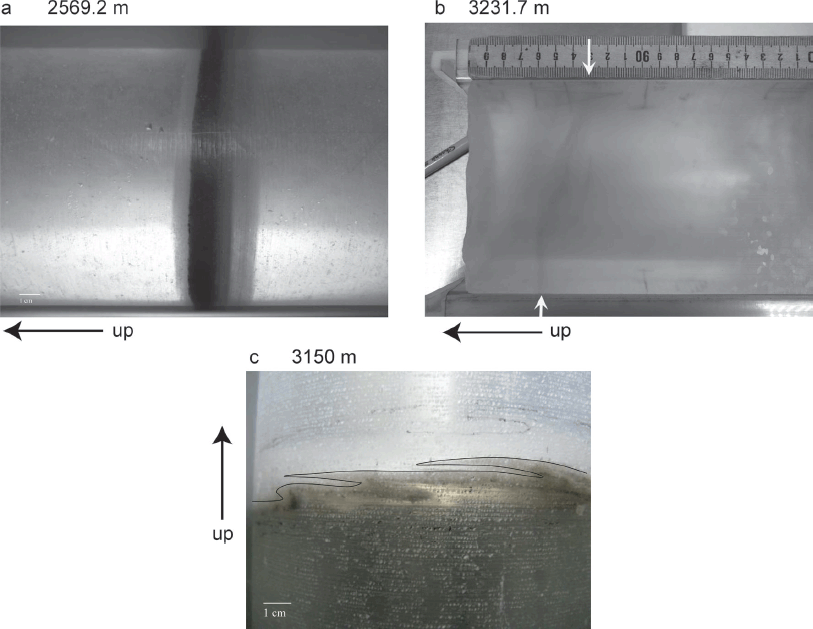
Notably dusty or cloudy layers, many of which are volcanic ash, were observed at many depths (Fig. 5). Of particular importance, except for very small and localized exceptions as described next, these layers were not significantly folded, steeply dipping or otherwise disturbed (Fig. 5a). Very small (mm or less) ‘topography’ on the surfaces of some of these layers (Fig. 5b) may be suggestive of future folding (Fig. 5c) if basal shear is sufficiently fast compared with layer thinning (e.g. Reference Waddington, Bolzan and AlleyWaddington and others, 2001). In these regions, layering may no longer be intact at the mm to cm (sub-annual) scale, but there is no evidence of large-scale stratigraphic disturbance. In regions lacking such clearly evident dusty layers, the faintly observed strata appeared horizontal and undisturbed. No ice with high concentrations of silt originating from bed materials was encountered.
Dusty layers observed in the WDC06A core. (a) Thick, undisturbed volcanic tephra layer at 2569.2 m (22.45 ka before 1950) with an as-yet undetermined source (personal communication from N. Dunbar, 2014). (b, c) Slightly disturbed tephra layers from 3231.78 and 3150 m. Detail is enhanced in (c) with the addition of hand-drawn lines.
In firn and bubbly ice, many thin (1 mm) bubble-free or nearly bubble-free crusts were observed, which might be wind-packed features or glazed ‘sun crusts’. They will be discussed further in a follow-up paper in preparation by one of us (J.M.F.) on firn processes. Extensive data (e.g. Reference BattleBattle and others, 2011) show that air circulates readily past these features in the firn. Importantly, although these were easily observed, none of the thicker nearly bubble-free layers were seen that clearly result from refreezing of abundant melt-water (Reference Das and AlleyDas and Alley, 2005). Hence, through the bubbly ice, alteration of the climatic record by meltwater can be excluded with high confidence. The isotopic data (WAIS Divide Project Members, 2013) indicate that the bubbly ice from the Holocene was deposited at the highest temperatures of any ice in the WAIS Divide ice-core record, so melt-water is unlikely to have affected any of the climate histories being developed.
4. Grain Characteristics
4.1 General observations
Unless otherwise indicated, all general observations on grains were carried out on vertical thin sections (cut parallel to the core axis). Because azimuthal control during drilling was inconsistent, comparisons between samples that depend on knowing the absolute azimuth are restricted to instances in which core runs could be unambiguously matched by end fitting or the orientation could be provided from the fabric results.
4.1.1. Grain–bubble interactions
In the close-off zone (67–77 m at WAIS Divide; Reference BattleBattle and others, 2011), all bubbles are situated either at triple junctions or on two-grain boundaries. Because bubbles are less mobile than grain boundaries under conditions typical in the shallow portions of an ice sheet, grain boundaries detach and move away from them as grains grow (Reference Alley, Perepezko and BentleyAlley and others, 1986a). Thus the percentage of the population of bubbles no longer residing on boundaries with increasing depth is a general indicator of the progress of grain growth in shallow portions of the ice sheet.
In the shallowest sample at 120 m depth, 36% of bubbles do not reside on grain boundaries, as observed in thin section. Some bubbles extend up or down out of the sample, and may be contacted by grain boundaries in those extensions, but the fraction contacted in the section scales with the total fraction contacted (e.g. Reference UnderwoodUnderwood, 1970). By 600 m the percentage of non-grain-boundary-touching bubbles levels off at 75%. From 600 to 1000 m, the depth range over which the mean grain size is relatively constant (see below), a steady state of grain-boundary/bubble interaction seems to be reached.
Grain-boundary pinning by bubbles, clathrates and particles, recognized by local deviation of boundary curvature where it contacts an inclusion, is observed at all depths. Such deflected grain boundaries still appear below the depth at which bubbles become scarce and eventually disappear, having been converted to air-hydrate clathrate (1600 m). In the deepest ice, grain-boundary deflection is also observed around particulates.
4.1.2. Subgrain boundaries and polygonization
Subgrain boundaries can be detected in thin sections by observing optically-coherent domains that have slightly differing extinction orientations within individual crystals when examined in cross-polarized light. When the orientation mismatch of adjacent domains becomes large (>5° to 15°), the domains separated by the subgrain boundaries within the original parent grain are recognized as distinct grains with a smaller grain size than the original parent grain. Although the unambiguous identification of polygonized grains requires a nearest-neighbor orientation analysis, the suggestion of full polygonization can be observed by visual inspection of 2-D thin sections under crossed polarizers. The suggestion of polygonization is reinforced by the observation that (1) it occurs in the largest grain-size fraction of a given sample in similarly oriented grains, and (2) groups of nearest-neighbor grains of similar extinction orientation, when re-aggregated into a single grain, approximate the mean size of the large fraction of unpolygonized grains in the same sample. Preliminary inspection of the c –axis data supports this inference that polygonization is active below the top few hundred meters.
Subgrain boundaries have been reported in shallow ice (<100 m) (e.g. Reference KipfstuhlKipfstuhl and others, 2009; Reference Weikusat, Kipfstuhl, Faria, Azuma and MiyamotoWeikusat and others, 2009, Reference Weikusat, Miyamoto, Faria, Kipfstuhl, Azuma and Hondoh2011; Reference Spaulding, Meese and BakerSpaulding and others, 2011) but are not detected in thin sections in the shallowest samples at WAIS Divide by the methods utilized in this study. They first appear in the sample from 200 m depth, and are commonly observed below 500 m, where they are concentrated in the large-size grain fraction. Chessboard-patterned subgrain-boundary development, similar to that commonly seen in high-temperature metamorphosed quartz (Reference KruhlKruhl, 1996; Reference Okudaira, Takeshita and ToriumiOkudaira and others, 1998; Reference BlenkinsopBlenkinsop, 2000; Reference Passchier and TrouwPasschier and Trouw, 2005), is common below 800 m, with the boundary traces developed parallel and perpendicular to the crystallographic c –axis. It is most apparent in grains whose crystallographic c –axis lies close to the plane of the thin section and it has also been observed in ice-core samples from central Greenland. Apparent grain polygonization is observed below 600 m, becomes common below 1200 m and persists to the bottom of the core (Fig. 6). It is of interest to note that as chessboard subgrain-boundary development becomes prominent, bubbles are very commonly observed along or at the corners of these boundaries inside large grains, suggesting the involvement of bubbles in the process of subgrain-boundary evolution.
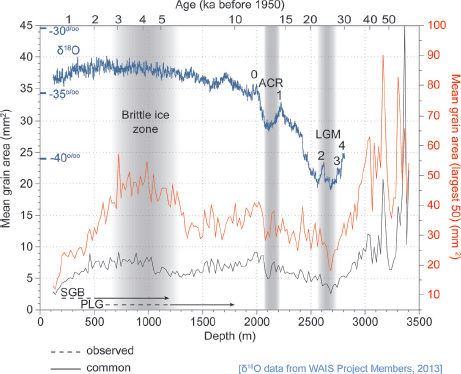
Curves showing the mean grain areas of the entire observed population of grains in each sample and the mean grain areas of the largest 50 grains in each sample. The first appearance of subgrain boundaries (SGB) and the apparent onset of polygonization (PLG) are indicated as dashed and solid lines. Oxygen-isotope curve and the age extents of the Antarctic Cold Reversal (ACR) and the Last Glacial Maximum (LGM) from WAIS Project Members (2013) marked with Antarctic Isotope Maxima (Reference JouzelJouzel and others, 2007) are provided for reference. The depth span of the brittle-ice zone, as defined in the field, is also indicated.
4.1.3 Spatial distributions and layering
The WAIS Divide core is characterized by broad grain-size distributions at the thin-section scale (10 cm) and the persistence of discrete layering of coarse- and fine-grained layers in deep ice (>2000 m depth). Sample size distributions broaden quickly below 120 m depth and are neither Gaussian nor strictly lognormal (all distributions of the mean-normalized natural log of the grain radius populations fail standard normalcy tests). Consequently, non-parametric representations of the size distributions have been used in this study. In all cases where clear grain-size layering contrast was observed in the deeper ice (e.g. Fig. 10a), it was stratigraphically horizontal to sub-horizontal. No instances of shear banding were observed and although bands of particulates from nearby volcanic eruptions were encountered (Fig. 5a and c), the thick layers (typically >0.5 m) of silt-laden ice frequently encountered at the bottom of other deep cores (Reference Gow, Epstein and SheehyGow and others, 1979, Reference Gow1997; Reference Hammer, Clausen, Dansgaard, Neftel, Kristinsdóttir and JohnsonHammer and others, 1985; Reference Gow and MeeseGow and Meese, 2007) were not observed at WAIS Divide.
4.2 Image processing and analysis
Grain boundaries are located by performing a principal component analysis (PCA) on each acquired RGB image and applying the resulting eigenmatrix transformation to the multichannel image as described by Reference FitzpatrickFitzpatrick (2013). In general, the first channel of the resulting image contains the highest significance (the largest dynamic range). This grayscale channel is then extracted from the re-mapped RGB image and used as the starting point for edge detection. Edge detection is typically accomplished using a gradient-vector algorithm with a 3-pixel neighborhood on one or both of the 8-bit grayscale images resulting from the PCA. Bi-level thresholding of the edge-detected image(s) is accomplished using a Kittler (Reference Kittler, Illingworth and FögleinKittler and others, 1985), Shannon (Reference PunPun, 1980; Reference ParkerParker, 1996) or Otsu (Reference OtsuOtsu, 1979) algorithm. The resulting binary image is a 2-D representation of the location of all grain boundaries visible in the starting RGB image(s). Grains touching the edge of the analytical frame are rejected as being incomplete. Metrics on all non-edge-touching grains are then gathered using the methods described by Reference RussRuss (2011) and include, at a minimum, position, size, shape, complexity and 2-D spatial orientation information. Once analyzed, fabric data are added into the grain data tables generated through the image processing and analysis steps. Visualizations of grain metrics and orientations can then be created using spatial mapping algorithms. This type of treatment yields information on the spatial relationships between grain size and orientation, and on grain-size segregation that is not easily detected by other methods.
4.3. Mean grain sizes and grain-size distributions
Early literature on grain characteristics in ice cores presents size measurement data as the mean of the grain areas (typically derived using manual planimetry or intercept lengths) or the mean of the diameters of the circular equivalents (EqD) for each grain population at each depth sampled (e.g. Reference GowGow, 1970; Reference Gow and WilliamsonGow and Williamson, 1976; Reference Duval and LoriusDuval and Lorius, 1980; Reference Herron, Langway and BruggerHerron and others, 1985; Reference Langway, Shoji and AzumaLangway and others, 1988; Reference Lipenkov, Barkov, Duval and PimientaLipenkov and others, 1989). More-recent studies also utilize the mean to report grain-size measurements (e.g. Reference Tison, Thorsteinsson, Lorrain and KipfstuhlTison and others, 1994; Reference Alley and WoodsAlley and Woods, 1996; Reference GowGow and others, 1997; Reference Thorsteinsson, Kipfstuhl and MillerThorsteinsson and others, 1997), but some of these studies incorporate size-population distribution information as well (e.g. Reference Azuma and HondohAzuma and others, 2000). Grain studies on more-recent ice cores (Reference DurandDurand, 2004; Reference Binder, Weikusat, Freitag, Garbe, Wagenbach, Kipfstuhl and BarnettBinder and others, 2013) utilize a variety of approaches to characterize the measured grain-size populations more comprehensively. These new approaches have become possible with the development of high-resolution digital imagery and image-processing algorithms. In order to facilitate direct comparison between as many ice-core records as possible, it is therefore necessary to present data from new cores in several different ways. We have adopted this approach in this study in order to facilitate comparisons with other similar studies on other ice cores.
Mean grain areas measured directly as pixels for the entire population at each sampled depth and the mean grain areas of the largest 50 grains at each sampled depth for the entire WAIS Divide core are shown in Figure 6. Grains with areas <0.047 mm2 were not observed, although the detection limit was 0.0014 mm2 and many instances of birefringent microfractures smaller than 0.047 mm2 emanating from bubbles were observed in overwintered brittle ice and below. Figure 7 shows grain sizes characterized as the mean grain radius of an equivalent circle calculated from the observed discrete areas of the entire population of grains, with error bars accounting for both the sectioning effect and the variation in the total number of grains measured for each sample (Reference DurandDurand, 2004).
Grain size as mean grain radius, R h i, calculated as the equivalent circular radius. Error bars are 2 and account for both the sectioning effect and the variability of the number of grains analyzed.

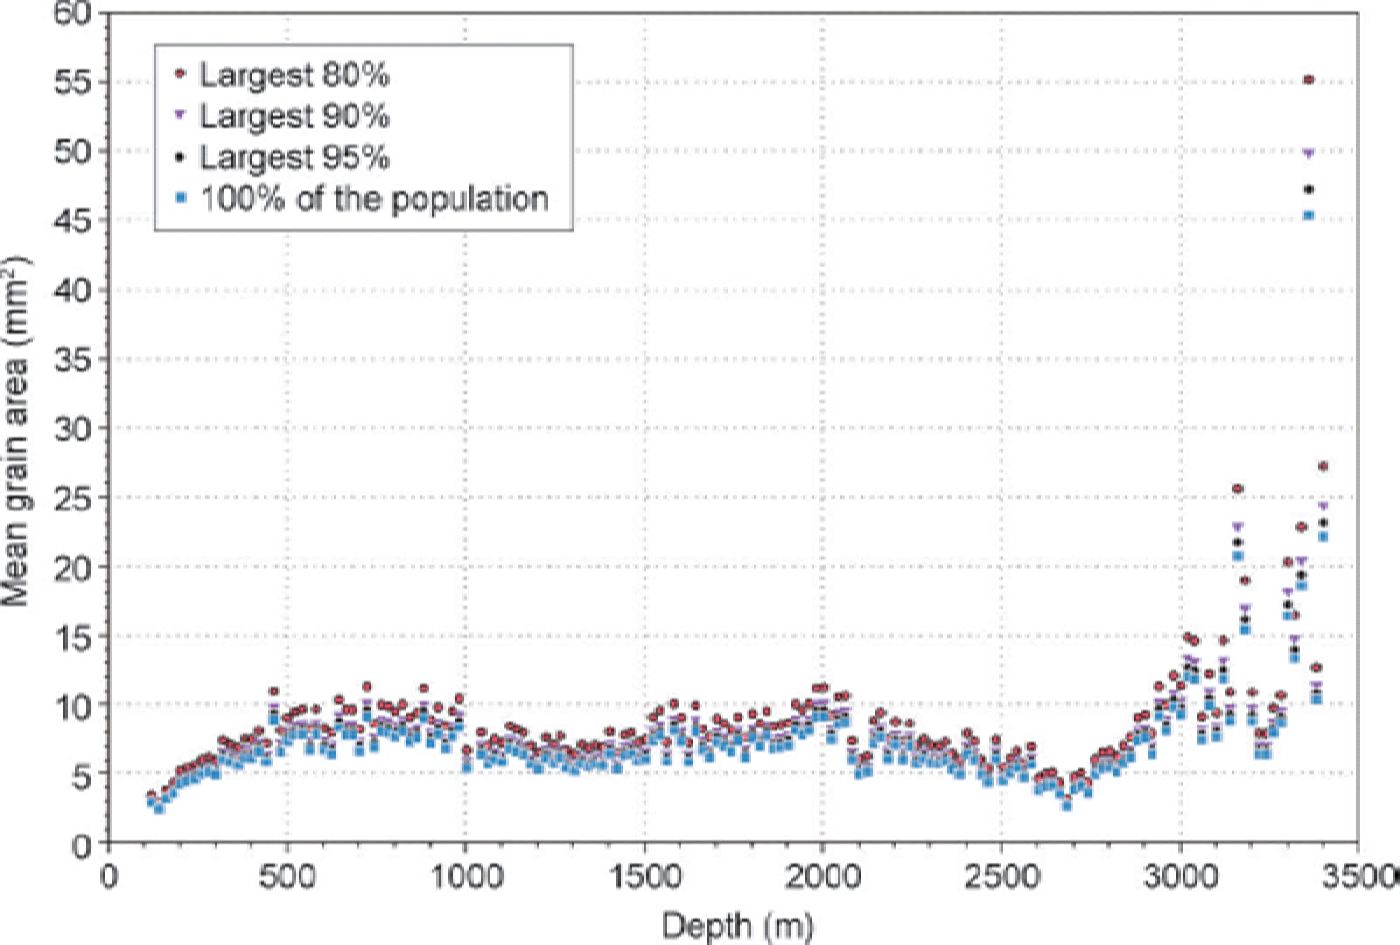
The sensitivity of the mean grain area values to the small-grain end of the population distribution (as suggested by Reference Binder, Weikusat, Freitag, Garbe, Wagenbach, Kipfstuhl and BarnettBinder and others, 2013) is shown in Figure 8. The smallest grains observed in the present study are 1.6 times larger than the minimum suggested cut-off in Reference Binder, Weikusat, Freitag, Garbe, Wagenbach, Kipfstuhl and BarnettBinder and others (2013). The value of the mean is relatively insensitive to the lower cut-off value down to 3000 m. From 120 to 3000 m depth the average difference in the mean calculated from the entire population and the largest 80% of the population is 1.5 mm2. Below 3000 m it reaches a maximum value of 9.8 mm2 in the sample from 3362 m.
Sensitivity of the mean grain size to the small grain-size cutoff. Data compare the calculated means of 100%, 95%, 90% and 80% of each grain size population down to 3405 m depth. Region of greatest sensitivity lies below 3000 m.
From the shallowest sample at 120 m depth to a depth of 560 m, the mean grain area increases linearly with age at a rate of 3 10–3 mm2 a–1. This is comparable with the rate of growth in other cores from sites with similar accumulation rates and temperatures (Fig. 9; Reference Cuffey and PatersonCuffey and Paterson, 2010). From 560 to 1000 m the mean grain area is relatively constant near 7.5 mm2. The bottom of this interval is near the depth at which apparent grain polygonization becomes common. From 1000 to 1400 m the full-population mean decreases slightly, primarily due to a continuous decrease in the size of the largest fraction of the grain population (Fig. 6). This behavior is consistent with polygonization outpacing grain growth. This decreasing trend in the full-population mean reverses below 1200–1300 m depth where the mean grain area begins to increase again with increasing depth until the Antarctic Cold Reversal (ACR) is reached at 2080 m. The mean grain area decreases abruptly going down-core into the ACR and generally continues to decrease downward, reaching a minimum value of 2.61 mm2 (equiva-lent grain radius = 0.962 mm) in the sample from 2686 m (26 ka before 1950) in ice from the Last Glacial Maximum (LGM). The mean grain area does not return to pre-ACR values again until a depth of 2880 m. Below 3300 m (–9.5°C), the ice transitions into the basal regime that is characterized by the presence of very large crystals with geometrically complex, interlocking boundaries.
Comparison of rates of grain growth in the ‘normal’ grain growth regime from multiple ice-core sites in Antarctica and Greenland (WAIS Divide shown with red triangle). The growth rate at WAIS Divide is comparable with the rate of growth observed in cores from other sites with similar accumulation rates and temperatures. (Other data compiled in Reference Cuffey and PatersonCuffey and Paterson, 2010.)

Grain-size population distributions in the WAIS Divide core samples widen quickly over the first few hundred meters. Abnormally large grains in finer-grained populations are sometimes observed at the scale of individual thin sections (10 cm), which is sub-annual above 1985 m depth (Fig. 10a).
(a) WDC06A at 721.983 m depth. Broad sub-annual grain-size distributions are commonly observed. The large grain in this section is actively extending its grain boundaries as evidenced by the convex curvature of these boundaries at pinning bubbles. Its area is >50 times greater than the mean of the remaining population. (b) WDC06A at 2603.305 m depth. The sample is characterized by interlayering of coarser- and finer-grained strata. The mean equivalent diameter for the fine-grained layer at A is 1.57 mm, and in the adjacent coarser layer at B it is 2.27 mm.

Interlayering of coarse- and fine-grained ice persists within the deepest samples analyzed (Fig. 10b) and is generally highly correlated with both chemistry (Section 5) and particulates. Fabric analysis of these instances in the deeper ice indicates that the fine-grained layers are generally more coherently crystallographically aligned than adjacent coarse-grained layers (Fig. 11). Grain-size distributions are presented using non-parametric box-and-whisker plots in Figure 12.
WDC06A, 3202.840–3202.940 m depth, grain orientation map. Grain c –axis orientations mapped onto the grain images indicate the high degree of fabric anisotropy in the interlayered coarse- and fine-grained ice. Grain fill color indicates size class. Arrow line direction specifies the azimuth of the c –axis (), and the arrow color specifies the classes of the angle of the c –axis from the normal to the plane of the thin section (). Orange and red arrow colors lie closest to the plane of the thin section.

Non-parametric box-and-whisker representation of the grain-size distributions in the WAIS Divide core on 100 m increments. Whiskers are 1.5 times the interquartile range (Q3–Q1). Grains falling outside these ranges are marked as outliers. Data points that lie between 1.5 times the interquartile range (i.e. the end of the whisker) and 3.0 times the interquartile range are shown as outliers with filled circle symbols. Data points that lie outside 3.0 times the interquartile range are shown as outliers with open circle symbols.

5. Grain Areas and Impurities
Particulate and dissolved impurities have long been known to influence physical processes in ice, and recent work has shown that these influences may in some cases be stronger than previously suspected. Grain size in turn may influence deformation. Here we assess possible effects of impurities on grain size (e.g. Reference GowGow, 1969; Reference Alley, Perepezko and BentleyAlley and others, 1986a, Reference Alley, Perepezko and Bentleyb; Reference Alley and WoodsAlley and Woods 1996; Reference Cuffey and PatersonCuffey and others, 2000; Reference Weiss, Vidot, Gray, Arnaud, Duval and PetitWeiss and others, 2002; Reference DurandDurand and others, 2006; Reference Freitag, Kipfstuhl, Laepple and WilhelmsFreitag and others, 2013) in the WAIS Divide core.
5.1. Physical basis
An inverse relationship between impurity content and grain growth in metallurgical and ceramic systems has been known for many decades (Reference Lücke and DetertLücke and Detert, 1957; Reference CahnCahn, 1962). Small grains in high-impurity layers have also been observed in multiple instances in glacier ice (Reference GowGow, 1970; Reference Gow and WilliamsonGow and Williamson, 1976; Reference Alley, Perepezko and BentleyAlley and others, 1986a, Reference Alley, Perepezko and Bentleyb; Reference AlleyAlley, 1992; Reference DurandDurand and others, 2006).
Our analysis focuses on the segment of the WAIS Divide core from 577 to 1300 m, where a consistent chemical impurity dataset is available, and where grain areas are nearly constant across a large depth range with relatively small changes in temperature and strain rate (Reference Morse, Blankenship, Waddington and NeumannMorse and others, 2002). In light of the available data and the physical influences, this is the easiest part of the core in which to assess the influence of impurities on grain sizes. We briefly return to impurity influences in deeper ice with faster deformation in Section 7, but defer detailed analyses of more complicated intervals to planned future studies.
Different impurity analyses were conducted at different depths in the WAIS Divide core, optimized for ice conditions and scientific questions. For the 577–1300 m depth range, brittle ice made some measurements less appropriate than others. Fortunately, a consistent solubleion dataset with 2–4 cm resolution is available for this depth interval for species including sodium (Na+, a proxy for sea salt), non-sea-salt sulfate (nssSO4 2–, a proxy for biogenic and volcanic aerosols) and magnesium (Mg2+, a proxy primarily for terrestrial dust). Sea-salt and terrestrial and volcanic inputs typically dominate ice-core impurity loadings. A complete suite of ions (including calcium) is not available in this depth interval, but because of the typically strong correlations among different indicators of sea salt, and among different indicators of terrestrial dust including Mg2+ and Ca2+, which occur for strong physical reasons, useful results can still be obtained (e.g. Reference BlenkinsopBowen, 1979; Reference MayewskiMayewski and others, 1994; Reference Fischer, Siggaard-Andersen, Ruth, Röthlisberger and WolffFischer and others, 2007; Reference Cuffey and PatersonCuffey and Paterson, 2010; Reference WolffWolff and others, 2010).
As discussed in Section 4.1.2, polygonization likely is occurring in the depth range considered. The grain size represents a balance between growth of old grains and production of new grains by subdivision or nucleation (e.g. Reference Alley, Gow and MeeseAlley and others, 1995). We consider it most likely that impurities influence grain size primarily through their effect on growth rate, because of the strong physical evidence that impurities slow grain-boundary migration (e.g. Reference CahnCahn, 1962; Reference Ashby, Harper and LewisAshby and others, 1969; Reference Alley, Perepezko and BentleyAlley and others, 1986a, Reference Alley, Perepezko and Bentleyb); however, our data do not allow an independent assessment of this.
5.2. Regression analysis and results
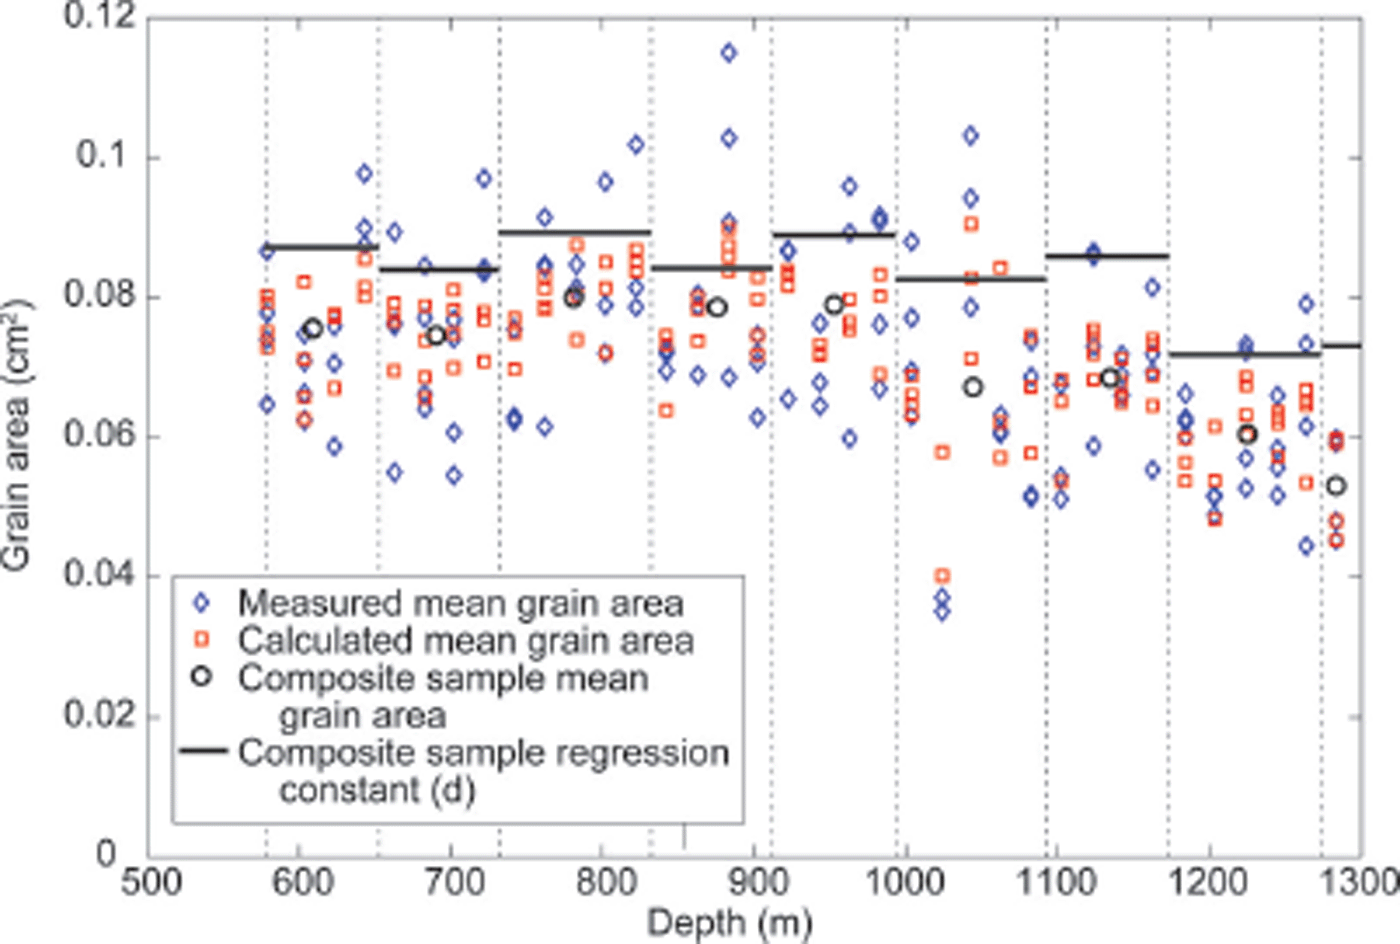
We explored various ways to relate impurity loading to grain size, and settled on multiple regression as the simplest and clearest approach. The 2–4 cm vertical span of a single chemical measurement typically includes several hundred grains across the 10 cm width of our vertical thin sections. These formed several subsections that have sufficiently large grain area sample sizes to estimate mean grain area with quite small uncertainty (Reference Alley and WoodsAlley and Woods, 1996). However, the 10 cm height of our square thin sections spans too few chemical measurements to allow statistically confident comparisons of chemistry and grain size. We thus combined subjacent sections, with their 20 m spacing, until we obtained a statistically significant composite sample; four to five sections proved sufficient. We kept the number of sections combined into each composite sample as small as practicable, to minimize influences of depth variations of temperature or cumulative strain. This grouping gave us nine independent composite samples in total, and thus nine independent regressions.
Regression was conducted in MATLAB® as
with A the mean grain cross-sectional area, and the concentrations of the indicated impurity chemical species as the independent variables; the intercept d can be understood as the grain area with zero impurities. Coefficients a, b and c are computed weighting parameters taken to represent each impurity species’ relative influence on observed grain area variability. Results are shown in Figures 13 and 14.
Measured and calculated grain areas from regression analysis for 577–1300 m depth in the WAIS Divide core. Each vertical thin section was divided into a few subsections spanning 2–4 cm, corresponding to the depths of the available chemical analyses. The mean measured grain area of each 2–4 cm subsection is shown by a blue diamond; at this resolution, all the subsections of one thin section appear at the same depth. The vertical black dashed lines separate the composite samples; each composite sample is composed of all of the subsections in four to five sections, providing sufficient data for statistically significant regression analysis. The average grain area for a composite sample is shown by a black circle in the middle of the depth range for that composite sample. The intercept, d, for the composite sample, which is the no-impurity grain size, is shown by a solid black line spanning the whole depth range of the composite sample. The regression equation for a composite sample returns a calculated grain size for each subsection in that composite sample, and these are shown by red squares. Some ‘noise’ is evident, possibly related to additional impurities not measured, or to other issues, but the overall trend of impurities reducing the grain size is clear.
Apparent effect of the individual impurities on grain area. Products of regression weighting coefficients (a, b and c) and the measured impurity concentrations for each subsection are taken here to represent the apparent effect on grain area for each impurity species within a given composite sample. Blue diamonds represent sodium (sea-salt) effect, green circles represent magnesium (terrestrial dust) effect, and red triangles represent non-sea-salt sulfate (volcanic or biogenic) effect. Vertical dashed lines divide depth extents of composite samples. The summed apparent influence for each subsection is represented by a black square. Inspection shows that for most measurements the non-sea-salt-sulfate effect is small, and that magnesium generally reduces grain size, usually by more than sodium. All chemical measurements are plotted, but only the average behavior across a whole composite sample is statistically significant. Considering the behavior across all composite sections, there is high confidence that impurities and reduced grain size are correlated, with the strongest effect from magnesium among these impurities.

The sign of the influence of individual impurities is not constrained by the regression, but in each of the nine composite samples the net effect of impurities is to lower the grain size, by 15 6.3%. There is no single impurity that has greatest influence in all of the composite samples; instead, all seem to be important at some depths. This is consistent with the results of Reference Alley and WoodsAlley and Woods (1996). Of the impurities considered, non-sea-salt sulfate generally has the smallest effect, and magnesium is somewhat more important than sodium. Given our understanding of correlations among impurities, and of the physical processes underlying the grain size in this depth range, we suggest that impurities slow grain growth somewhat, with dust having more importance than sea salt in most samples.
Grain area population and soluble impurity data are extant for ice below 1300 m for the WAIS Divide core and have been analyzed using the methods described here. The impurity data below 1300 m have higher resolution (1–2 cm averages), decreasing the depth range necessary to produce robust regressions, which becomes important as annual layers compress vertically. Current results produce trends more complex than those observed between 577 and 1300 m, and are under further study.
6. Bubbles and Clathrates
6.1. Core quality and clathrate observations
The depth of the brittle-ice zone observed in ice cores varies, probably controlled by site properties such as temperature and accumulation rate (Reference Shoji and LangwayShoji and Langway, 1982; Reference Uchida, Hondoh, Mae, Lipenkov and DuvalUchida and others, 1994). Core drilling and handling technologies and procedures are also very important, so precautions were taken at every step in coring and processing to minimize damage from brittle behavior (Reference SouneySouney and others, 2014). The high pressure of air in bubbles from this zone cracks ice brought to the surface, complicating analyses. The WAIS Divide site was chosen, in part, so that the brittle-ice zone would be confined to depths within Holocene ice, with planning initially predicting a brittle zone of 1.8–9.4 ka (Reference Morse, Blankenship, Waddington and NeumannMorse and others, 2002).
During field logging of the WAIS Divide core, the quality of each section was quantified by drilling technicians based on a metric for the number of visible fractures, breaks and spalls logged in each meter of ice (Fig. 15). Precautions were taken at every step in coring and processing to minimize damage from brittle behavior (Reference SouneySouney and others, 2014). The brittle ice was confined to 650–1300 m depth (5.51– 11.37 MPa bubble pressure, calculated from the overburden pressure and density data, assuming that bubble pressure had reached overburden pressure). These depths equate to 2.7–6.1 ka before 1950 based on the published WDC06A-7 depth–age scale (WAIS Divide Project Members, 2013). The initial estimates may have been somewhat too broad, but the narrower-than-expected brittle zone may also in part represent the success of the measures taken during drilling and handling to minimize core breakage.
Core quality against depth, from on-site logging during initial field core processing. Fractures were first observed at 650 m and became more frequent through 1100 m, where their highest frequency was observed. Smoothing curve is a first-order LOESS non-analytic weighted least-squares fit with an interval width of 70 m (Reference ClevelandCleveland, 1979; Reference Cleveland and DevlinCleveland and Devlin, 1988). Core quality recovered quickly as clathrates began to dominate at 1250 m, with completely unbroken core below 1300 m.

Clathrates were observed by microscopic examination of thin-section samples. Small numbers were found as shallow as 700 m, and began to dominate over bubbles at a transition depth of 1250 m. Evidence of the brittle-ice/clathrate-ice transition can also be seen in both the shape and size distribution of bubbles in the core, as discussed below. A detailed analysis of the clathrate frequency, classification and size distribution is planned for future study to better understand the brittle-ice/clathrate-ice transition at WAIS Divide.
6.2. Bubble characterization data
The number, size and distribution of the bubbles trapped during the firn close-off process are conserved above the depth of clathrate formation except under extreme deformation (Reference WeertmanWeertman, 1968). The number density depends on site temperature and accumulation rate during firnification (Reference Spencer, Alley and FitzpatrickSpencer and others, 2006), and this paleoclimatic indicator was recently used to reconstruct a temperature history for the two millennia prior to 1700 CE at the WAIS Divide site from bubble data and an accumulation-rate history based on strain-corrected annual-layer thicknesses (Reference FegyveresiFegyveresi and others, 2011).
Here we add data from new bubble sections from deeper parts of the WDC06A ice core, down to 1600 m, following and slightly updating the procedures described by Reference FegyveresiFegyveresi and others (2011). We find that the technique is applicable through the brittle-ice zone, although with one caution discussed below, until bubble loss to clathrate formation becomes significant below 1250 m.
New ice-core subsamples were cut and prepared. These subsamples were all vertically oriented, and were prepared following the procedures described by Reference FegyveresiFegyveresi and others (2011). Each of these samples was digitally photographed using a collage technique, producing high-resolution final bubble images for each depth, at 20 m spacing, ranging from 580 to 1600 m. Measured bubble-number densities within the brittle zone range from 400 to 500 bubbles cm–3 (Fig. 16), with a significant and rapid decline below 1250 m. These values average slightly higher than those measured in the shallower ice.
Measured bubble number-densities within the WDC06A core through the brittle-ice zone. The values remain stable through the brittle ice, but begin to drop off sharply at a depth of 1250 m. Smoothing curve is a first-order LOESS non-analytic weighted least-squares fit with an interval width of 150 m.

A companion manuscript detailing the trends in bubble number-density and their implications on paleoclimatic reconstruction is in preparation for submission by Feveresi and others; comparison of the climate reconstruction in the brittle zone with independent indicators suggests that there might be a slight overcount of bubbles in the brittle zone. Independently, inspection of the sections suggests the possibility that fracturing associated with the brittle ice may have introduced a few features that were identified as bubbles. These erroneous identifications ranged from 1% of bubbles in shallow brittle samples to as high as 7% of bubbles, with 5% typical for the bulk of the brittle ice. Individually reexamining all of the samples for all of these features proved too labor-intensive to be practical, but the consistency of the misidentification allowed a quantitatively useful correction. Bubble counts were reduced for this overcount, by 1% for the first brittle-ice sample (660 m), and increased linearly by 1% increments per sample until the 5% correction was achieved at 740 m. The 5% correction was then maintained through the remaining brittle-ice samples.
Thus, these results together suggest that in brittle ice, the bubble number-density paleoclimatic reconstruction technique is still capable of providing close estimates, with a small bias of known sign for which corrections can be made.
Below 1250 m, the measured bubble number-density drops significantly due to the increasing concentration of clathrates. Thus, below this depth, bubble number-density no longer remains a viable paleoclimatic indicator, although some bubbles were still observed as deep as 1600 m. It is unknown whether the bubble number-density can be estimated from clathrate number-density for samples from deeper than 1250 m, because bubble/clathrate ratios are still not fully understood within ice-sheet ice (Reference Shoji and LangwayShoji and Langway, 1982; Reference Pauer, Kipfstuhl, Kuhs and ShojiPauer and others, 1999).
Measured average bubble radii diminish with increasing depth, ranging from 0.17 mm at 120 m depth, to 0.07 mm at 1600 m depth (Fig. 17, center inset), primarily due to the pressure increase with increasing depth. Within the brittle-ice zone more scatter was observed in bubble size distributions, likely due to the increased frequency of cracks along bubble edges. Although this microcracking due to relaxation was present, it did not, in general, affect the overall integrity of the counting or the measurements of features.
Box-and-whisker plot of bubble size distributions, with brittle-ice zone boxes shaded for reference. Inset (b) shows average bubble radius through depth in the core at 100 m intervals. Error bars are the standard deviation between two reads (by different observers) of two sample sections. Box width for first-order LOESS curve fit is 250 m. Insets (a) and (c) are representative population distributions of bubble radii for samples from 120 m (left) and 1600 m (right) depths.

An analysis of the clustering behavior of the bubbles was also completed on core samples from 120 m through 1600 m. Nearest-neighbor distances were calculated for each sample depth and their distributions plotted (Fig. 18). To characterize bubble clustering, at each depth the distribution of observed distances to nearest neighbors was measured (Fig. 18). The mean observed distance and the corresponding mean for a random (Poisson) distribution with the same number-density of bubbles are shown in Figure 18, and their ratio is plotted in the inset.
Box-and-whisker plot of nearest-neighbor distributions. Primary plot shows mean nearest-neighbor distances and calculated Poisson distributions vs depth. Inset shows the calculated ratio vs depth with linear fit (R 2 = 0.9376).

Sample thicknesses were typically 1.5 mm, but with small deviations. Thicker samples contain more bubbles and thus have a smaller mean nearest-neighbor spacing when observed in plane section. A small correction for this effect was made following Reference Bansal and ArdellBansal and Ardell (1972). The ratio values are not affected since both values used in the calculation of the ratio are equally affected by the thickness biases. The calculated ratios indicate that the bubbles shift from a self-avoiding (spaced) configuration in the shallow ice (ratio of 1.38) to a nearly random configuration in the deeper ice (ratio of 1.01). A linear trend of ratio against depth gives R 2 = 0.9376.
The observed self-avoiding pattern at shallow depths reflects firn processes. Because pores bear no load, stresses immediately adjacent to pores are higher than stresses farther away, which would promote closure of channels or other pores that are too close (Reference CobleCoble, 1970). The evolution to positions with nearest-neighbor distances similar to a nearly random distribution may arise from the actions of grain boundaries in dragging bubbles in more-or-less random directions (Reference Hsueh and EvansHsueh and Evans, 1983); interactions clearly occur, as discussed above, and physical understanding indicates that bubbles are somewhat mobile and so will be displaced by migrating boundaries, even though those boundaries ultimately detach from the bubbles (e.g. Reference Alley, Perepezko and BentleyAlley and others, 1986a). With typical bubble spacings of a few tenths of a millimeter, a bubble displacement on the order of 0.1 mm would be sufficient to change the distribution significantly. We note that although the distribution of nearest-neighbor distances is similar to a random distribution, examination of bubble sections shows that there is a tendency for bubbles to outline current or former grains or subgrains.
6.3. Bubble shapes
Bubble shapes in the shallowest samples range from subrounded and equant to elongated and dumbbell-shaped, reflecting the inherited shapes of the pores from which they formed. Bubbles with inherited pore-shaped aspects are still in evidence at the pore-pressure equalization depth (180 m and 1.28 MPa) but, with increasing depth and load, bubble shapes evolve towards circular in cross-section, and by 400 m the observed global mean aspect ratio of bubbles reaches a near-circular value of 1.2. No instances of highly elongated bubbles, such as those seen in the Taylor Dome core (Reference Alley and FitzpatrickAlley and Fitzpatrick, 1999), were observed in the deeper ice at WAIS Divide.
The observed slight elongation of the bubbles is preferentially oriented. We looked in detail at one section, from 580 m, chosen to be deep enough to have allowed notable strain, but shallow enough to avoid major brittle-ice bubble cracking that would change bubble shapes. We found that the bubbles in each grain were elongated in or very close to the basal plane of the grain, and thus perpendicular to the c- axis. Because the strongest orientation of the c –axes is toward the vertical (see below), the strongest preferred orientation of the bubbles is horizontal. This tendency for preferred horizontal orientation of the elongation increases with increasing depth in the bubbly ice, consistent with increasingly strong c –axis fabrics.
Several processes may contribute to elongations in the basal plane, including crystallographically controlled cracks initiated from bubbles during or following core recovery, crystallographic influence on surface energies affecting vapor pressure and thus diffusion in bubbles, or preferential glide on the basal plane during deformation. The orientations begin shallower than we see any evidence of post-recovery cracking, so we do not believe that is the sole explanation. Additional work will be required to test the other hypotheses.
7. Fabric Evolution
Fabric, the collective crystallographic orientation distributions of ice crystals, has been measured and studied on deep ice cores to provide insights into flow processes and history, and to examine possible stratigraphic disturbances that would diminish confidence in interpretation of the paleo-climate record contained in the ice core (e.g. Reference AlleyAlley, 1988; Reference Alley1992; Reference Ferrick and ClaffeyFerrick and Claffey, 1993; Reference Van der Veen and WhillansVan der Veen and Whillans, 1994; Reference Alley, Gow and MeeseAlley and others, 1995; Reference Prinzio, Wilen, Alley, Fitzpatrick, Spencer and GowDiPrinzio and others, 2005; Reference Kennedy, Pettit and PrinzioKennedy and others, 2013). Methods for collecting measurements of c –axis orientations have evolved with time. Automated c –axis analyzers (e.g. Reference Azuma and HondohAzuma and others, 2000; Reference Russell-Head and WilsonRussell-Head and Wilson, 2001; Reference Wilen, DiPrinzio, Alley and AzumaWilen and others, 2003) have allowed a vast improvement in the ability to rapidly analyze most of the grains in a thin section, and even many points within single grains. This can be done post-measurement on the images stored electronically, permitting new questions to be answered even if the original samples are no longer available.
7.1. Methods
The c –axis analyzer used for this study was described in detail by Reference WilenWilen (2000) and Reference Hansen and WilenHansen and Wilen (2002), and was used for study of the Siple Dome ice core by Reference Prinzio, Wilen, Alley, Fitzpatrick, Spencer and GowDiPrinzio and others (2005). The WAIS Divide ice core was sampled for physical properties every 20 m where possible. The core was also sampled at several depths for other purposes not related to this study and, where possible, additional thin sections were obtained to augment the 20 m dataset. As described by Reference Hansen and WilenHansen and Wilen (2002), the accuracy obtained with this analyzer is 0.25° for the c –axis orientation.
The thin sections prepared for the physical properties studies were almost all cut from vertical samples of the core. Thus, the analyses yield the fabric of vertical sections. The advantage of having vertically cut sections is that strati-graphic variations in fabric and texture with depth can be studied, at least within a 10 cm section.
7.2 Schmidt plots
Schmidt equal-area plots for selected sample depths are shown in Figure 19. Most commonly, prior studies have used horizontal sections, with the resulting Schmidt plots viewed along the vertical axis of the core. Therefore, unless otherwise noted we have rotated the data for our vertical sections so that they are viewed as if they are horizontal sections. To test the fidelity of our rotation algorithm, horizontal and vertical thin sections were cut from the same location in the core at three depths and results compared. All three depths were within depths at which girdle fabric was observed.
Representative selection of horizontal Schmidt plots showing the evolution of fabric with depth. Azimuth of the data has been rotated so that all plots have the same orientation, which is assumed to be perpendicular to the direction of the extensional ice flow. Sample depths (m) are indicated above each plot. Number of points (n) successfully measured by the c –axis-fabric analyzer in each sample is shown below each plot.

Orientation data for a grain within a section are included only if the acquisition was highly reliable. The criteria for inclusion of an analyzed grain presented by Reference Hansen and WilenHansen and Wilen (2002) and Reference Wilen, DiPrinzio, Alley and AzumaWilen and others (2003) call for fitting of the extinction curves with an R 2 value less than 0.05, and five images from which extinction curves can be determined.
Core sampling was conducted to yield orientations relative to magnetic north through an azimuth line marked on the core just before extraction from the drill barrel. Unfortunately, possibly because the core sometimes rotates in the barrel during or following break-off, this azimuth line did not always line up with the mark from the previous run, and, as a result, samples are not oriented to the same azimuth. In order to make the changes in fabric more readily apparent, we have rotated the Schmidt plots in Figure 19 so they have a common orientation. This was done by using PCA to find the best-fitting vertical plane through the data for each section, and then rotating about the vertical axis until all of these planes were parallel.
The WAIS Divide core was collected in a region of flank flow on the Ross Sea side of the ice divide with the drainage to Pine Island Bay. This setting produces stretching along-flow and vertical compression; in addition, measured velocities indicate slight horizontal convergence of flow (Reference Conway and RasmussenConway and Rasmussen, 2009). Basal shear occurs, and increases with increasing depth. Physical understanding indicates that c –axes rotate towards compressional axes and away from extensional axes of the flow field, and also rotate toward the vertical in response to basal shear (rotation plus pure shear; e.g. Reference AlleyAlley, 1988). Thus, in this setting, the flow field is expected to cause progressive rotation of c –axes towards a vertical plane transverse to flow, but with stronger concentration near the vertical than near the horizontal in that plane, and with increasing vertical concentration with increasing depth. Grain subdivision by polygonization causes only small changes in c –axis orientation, and, as noted below, nucleation and growth of new grains with c- axes at large angles to their neighbors does not become dominant until much deeper (see also Reference Budd and JackaBudd and Jacka, 1989; Reference AlleyAlley, 1992). Lacking independent evidence of the orientation of core sections, this physical understanding has been applied; after rotating all sections to place the core axis in the center of the Schmidt plot, those sections with a clear symmetry plane were rotated so that these planes are parallel, making comparisons easier (Fig. 19).
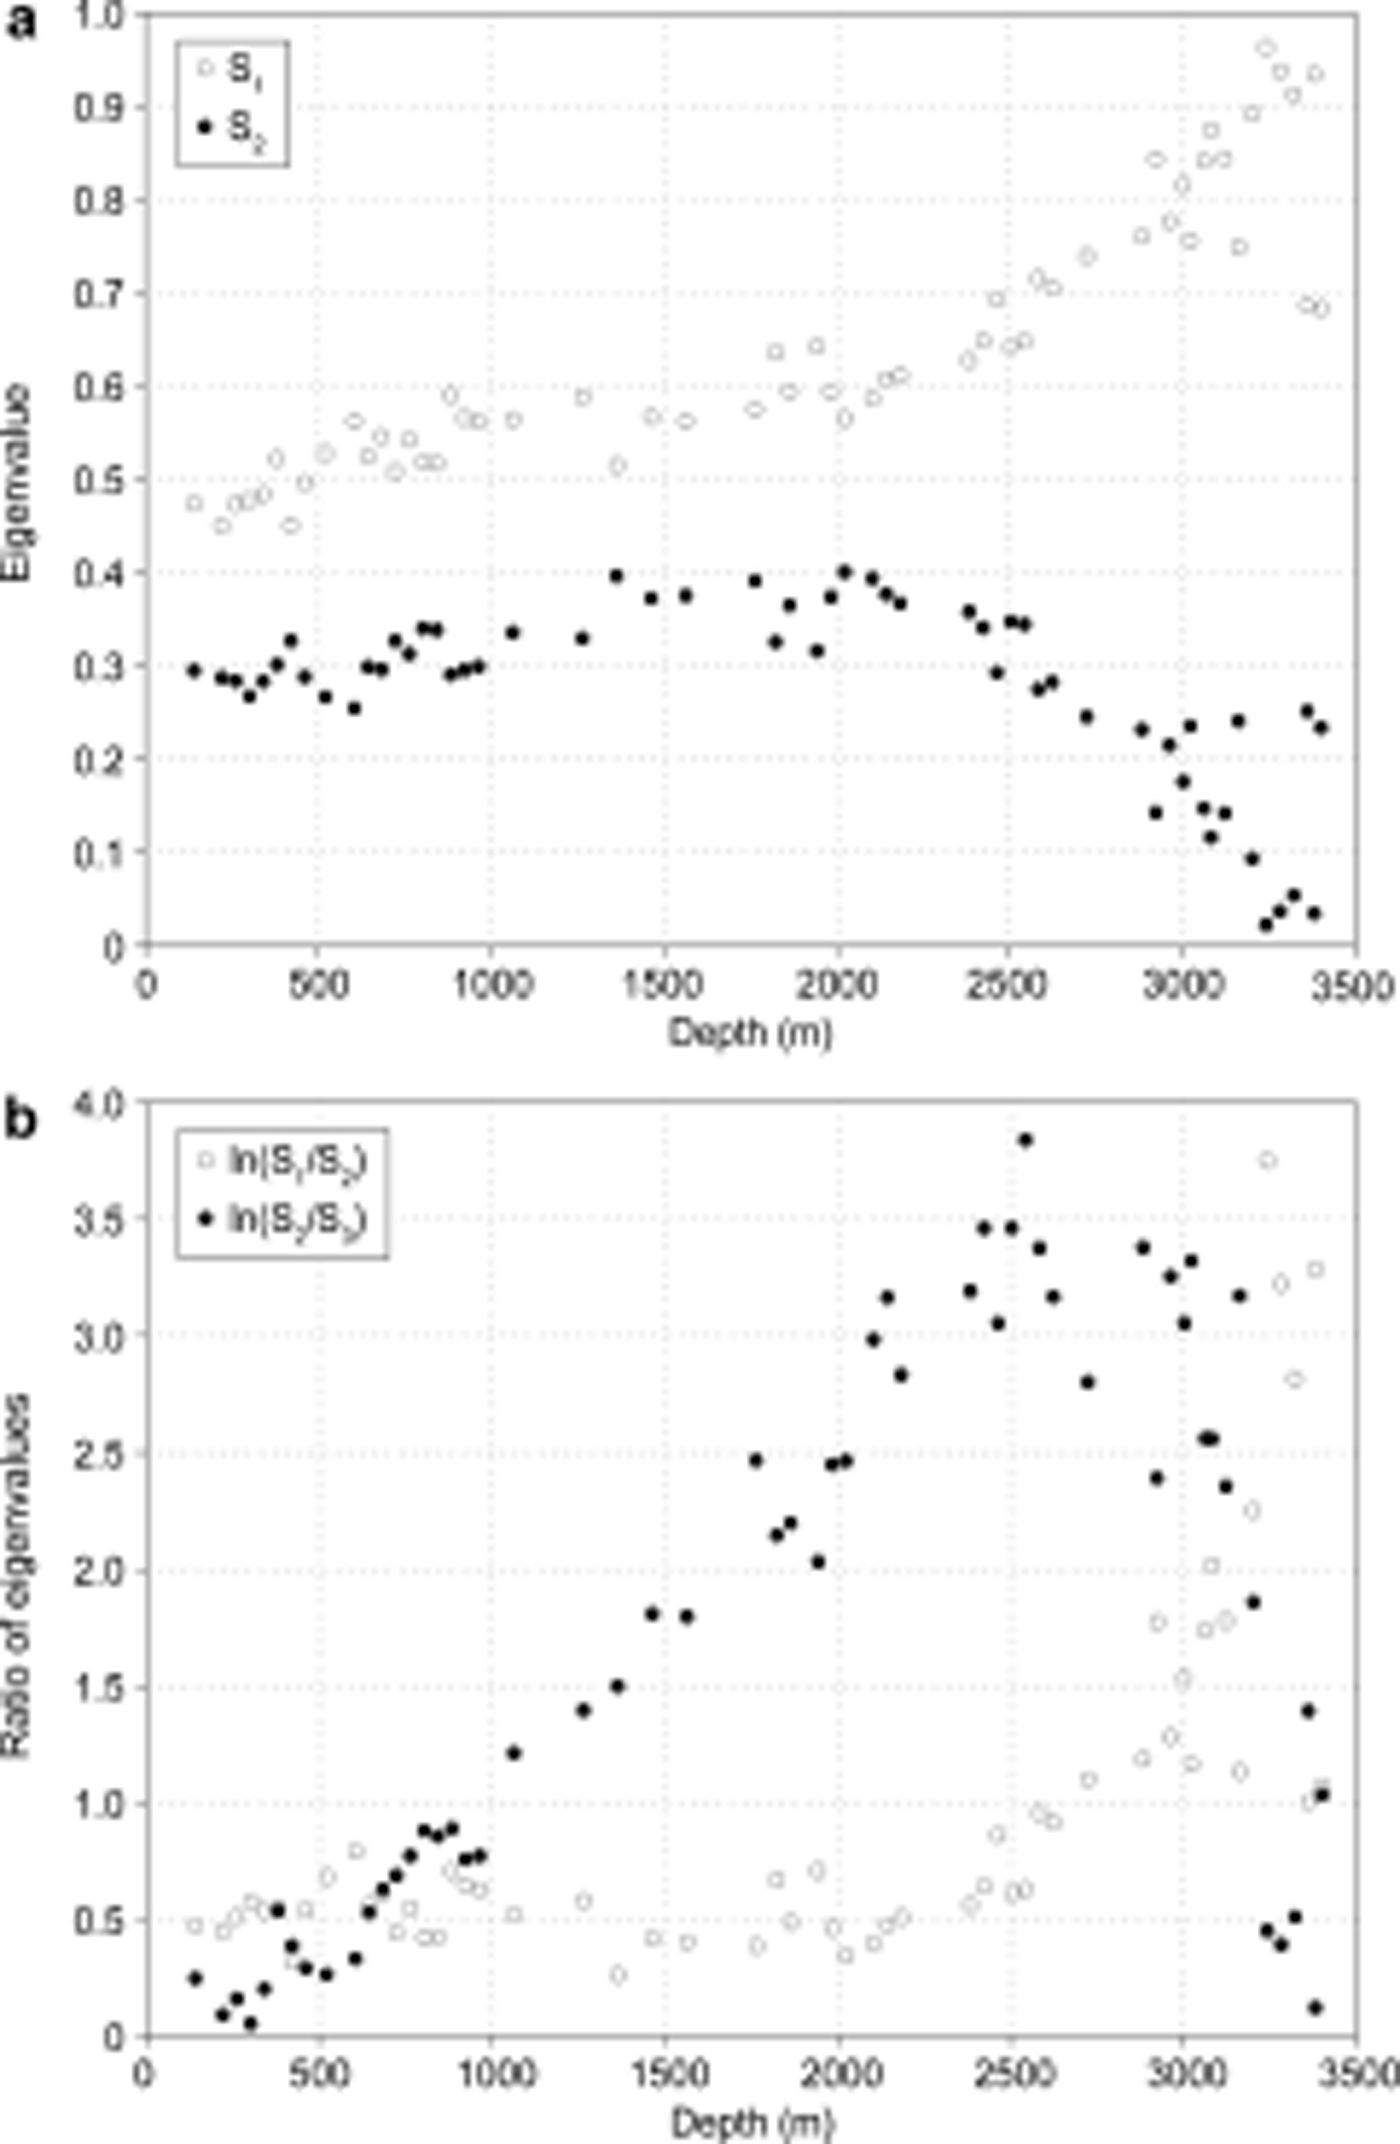
7.3. Eigenvalues
Eigenvalues provide a means by which the organization of the fabric can be described using three scalars. The normalized eigenvalues have the property that S 1 + S 2 + S 3 = 1 and that S 1 > S 2 > S 3. Ideally, a totally uniform fabric would show S 1 S 2 S 3 1/3, a fabric with all c –axes arrayed uniformly in a plane would have S 1 = S 2 = 1/2, S 3 = 0, and a fabric with all c –axes pointing in the same direction would have S 1 = 1, S 2 = S 3 = 0. In reality, these values are never attained. Previous workers have used eigenvalue methods to describe the fabric in a quantitative manner (e.g. Reference Prinzio, Wilen, Alley, Fitzpatrick, Spencer and GowDiPrinzio and others, 2005; Reference Kennedy, Pettit and PrinzioKennedy and others, 2013). Eigenvalues are limited in that they do not necessarily differentiate some fabric shapes such as between multiple clusters and a tight girdle.
7.4. Evolution of fabric
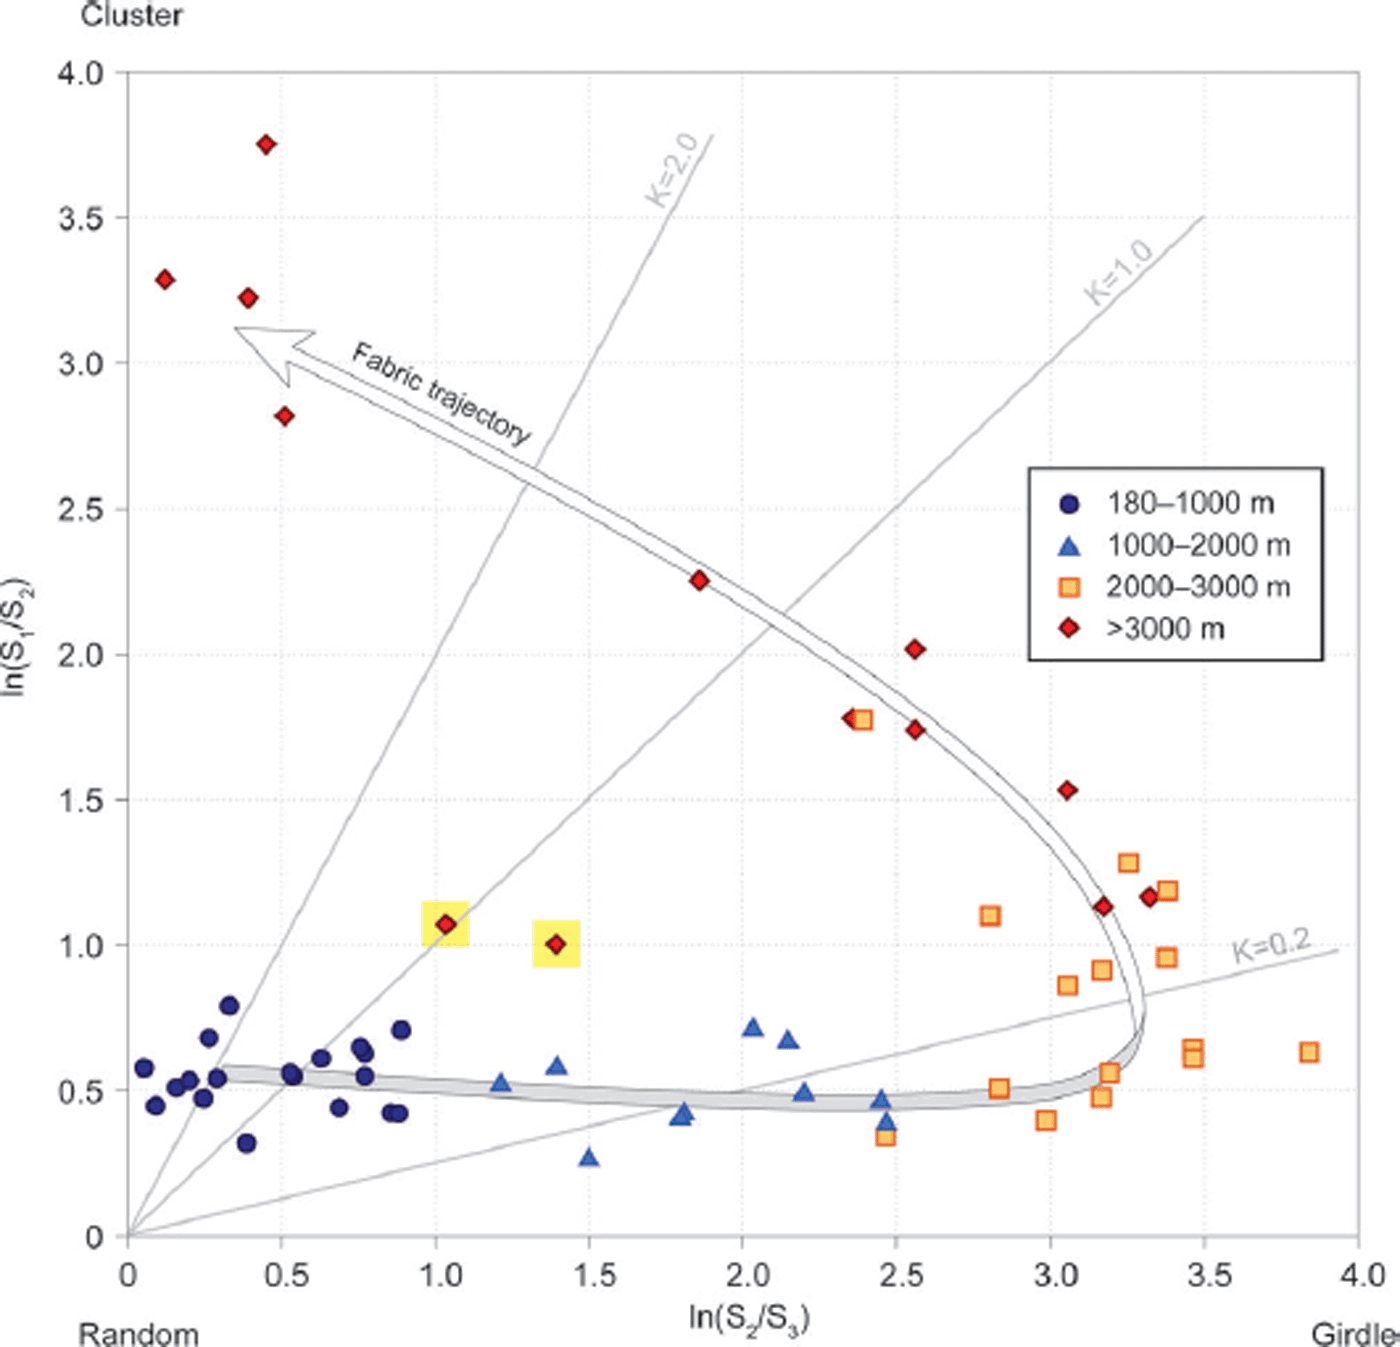
In Figure 20a, eigenvalues S 1 and S 2 are plotted against depth, showing changes in the strength of the fabric. Figure 20b shows the natural log of the ratios S 1/S 2 and S 2/S 3 plotted against depth. Figure 21 follows Reference WoodcockWoodcock (1977) in plotting these ratios against each other.
(a) The change in eigenvalue S 1 and S 2 with depth, revealing a downward increase in organization and a break in slope at 2500 m depth. This can be better seen in (b) ln(S 1/ S 2) and ln(S 2/S 3) vs depth.
A plot of the ratios of eigenvalues (Woodcock, 1977) shows the trend towards orientation types (random, girdle and cluster) with increasing depth at WAIS Divide. The full set of fabric data is subdivided and color/symbol coded into four subsets in 1000 m increments as a visual aid to perceive the depth progression more easily. An arrow is superimposed to indicate the trend of the fabric evolution with increasing depth. With increasing depth, fabric evolves from near random to a girdle then towards a polar cluster as simple shear begins to act as the principal force driving the rotation of the c –axes. The K value (Woodcock, 1977) is the ratio ln(S 1/S 2)/ln(S 2/S 3). Here the tendency for c –axes to cluster towards a vertical plane gives the trend toward smaller K in the upper part of the ice sheet, and the shift toward clustering about the vertical axis then gives the trend toward larger K in deeper ice. The two yellow-highlighted off-trend points (3365 m and 3405 m) are coarse-grained and likely represent multi-maximum ice as described by Reference Budd and JackaBudd and Jacka (1989). Note, however, that the large grain size greatly reduced the number of measurements in these samples (n = 89 and n = 163, respectively), which may have introduced some random variability.
The figures show that preferred orientation is present in the shallowest samples measured, 140 m depth. This preferred orientation at WAIS Divide is not quite as strong as that observed at similar depth in the nearby Siple Dome ice core (Reference Prinzio, Wilen, Alley, Fitzpatrick, Spencer and GowDiPrinzio and others, 2005). This can be seen in the eigenvalues. For the shallowest depth analyzed in the WAIS Divide core, 140 m, the values for S 1 and S 2 are 0.47 and 0.30 respectively. At Siple Dome these values (as estimated from Figure 3 of Reference Prinzio, Wilen, Alley, Fitzpatrick, Spencer and GowDiPrinzio and others, 2005) are 0.60 and 0.25, indicating a stronger preferred orientation.
With increasing depth to >2000 m, the c –axes progressively cluster toward the vertical plane with a concentration near the vertical axis, causing S 1 and S 2 to increase while S 1/S 2 remains nearly constant; the loss of grains oriented away from the preferred plane causes a rapid drop in S 3 and thus a rise in S 2/S 3. Beginning near 2550 m, which is within the LGM as shown in Figure 6, the fabric evolves from the plane-with-concentration to a strong single maximum, as shown by a strong rise in S 1, drop in S 2, and drop in S 2/S 3 as S 2 approaches S 3. Note, though, that a few of the deepest samples have broader distributions, likely from rapid migration recrystallization with mobile grain boundaries (Reference Budd and JackaBudd and Jacka, 1989; Reference AlleyAlley, 1992). The deep samples with strong single-maximum fabrics are relatively fine-grained, and the broader fabric clusters come from coarser-grained ice (Fig. 6).
8. Inter-Site Comparisons and Conclusions
A large and growing body of literature characterizes the physical make-up of the large ice sheets based on ice-core analyses and related studies, from Reference LangwayLangway (1967) and Reference GowGow (1970) through Reference Faria, Freitag and KipfstuhlFaria and others (2010) and Reference Binder, Weikusat, Freitag, Garbe, Wagenbach, Kipfstuhl and BarnettBinder and others (2013). Our data from WAIS Divide fit comfortably within the framework of understanding from this earlier work.
Perhaps the most important result is that the climate record in the ice core has not been notably distorted or mixed by ice flow. Inspection did not reveal folding or steep dips of the visible layers. Very slight folding was observed on a small number of layers very rich in volcanic ash (Fig. 5b). These layers may provide the greatest contrast and greatest tendency to fold of any layers in the ice core (Reference Gow and WilliamsonGow and Williamson, 1976). The observed folding suggests that the volcanic-rich layers in the deep ice are experiencing accelerated basal shear (Reference Gow and WilliamsonGow and Williamson, 1976), which would tend to promote overturning of small ‘bumps’, whatever their origin, into folds (Reference Waddington, Bolzan and AlleyWaddington and others, 2001; Reference Bender, Burgess, Alley, Barnett and ClowBender and others, 2011). However, similar folds or other deformational features were not observed in other ice, nor were steeply dipping layers.
Just as was found with the similarly high-quality but short-time-span record at NorthGRIP in Greenland (Reference Dahl-Jensen, Gundestrup, Gogineni and MillerDahl-Jensen and others, 2003), rapid basal melting may be important in preserving the fidelity of the WAIS Divide core (WAIS Divide Project Members, 2013). Melting causes ice to move through the strain field and melt off the bottom before sufficient shear strain can accumulate to cause widespread, strong overturning and mixing.
Many of the other results are as expected. The site has slight lateral convergence of ice flow (Reference Conway and RasmussenConway and Rasmussen, 2009), so that in addition to compression in the vertical, there is weak transverse compression, offset by along-flow extension. This leads to the expectation of c –axes clustering towards a vertical plane transverse to flow, with stronger vertical clustering that increases downward as basal shear stress increases (Reference AlleyAlley, 1988). We do not have reliable data showing absolute orientations of the vertical planes, but with this caveat, the data are fully consistent with expectations.
Recent work (e.g. Reference DurandDurand and others, 2006; Reference KipfstuhlKipfstuhl and others, 2009; Weikusat and others, 2011; Reference Freitag, Kipfstuhl, Laepple and WilhelmsFreitag and others, 2013) has given a much more nuanced view of the physical processes controlling subgrain formation, nucleation and growth of new grains, polygonization, and their dependence on impurities, than in earlier work; fairly clearly, most processes are active at most depths. However, as for other materials and situations with a great range of processes having different stress exponents (including viscous and higher-powered exponents) and activation energies (with exponential dependence on temperature; Reference Alley and FitzpatrickAlley and Fitzpatrick, 1999), one process is often dominant over others within some depth (stress) and temperature range, and that process is typically the one identified by the pioneering work in the field.
Thus, as argued by Reference GowGow (1969), grain growth occurring at least in part to minimize surface energy occurs in the upper part of the ice sheet. Impurity influences are small enough that the rate is largely controlled by site temperature, as is true for most ice at most sites. The rate at WAIS Divide is consistent with data from other sites for an activation energy appropriate for grain-boundary processes (42.4 kJ mol–1). Impurity drag is significant; however, as for most other Holocene ice, impurity concentrations are low enough that their effects are not huge, typically reducing grain sizes in the upper few hundred meters by order 10%. Additional work on nearest-neighbor relations will be required, but preliminary work suggests that polygonization contributes to the stabilization of grain size below 500 m (Reference Alley, Gow and MeeseAlley and others, 1995). Bubbles interact with grain boundaries, slowing but not stopping their motion and locally distorting their shapes; the boundaries also drag the bubbles, achieving enough displacement to notably change the distribution of nearest-neighbor distances.
Changes in ice properties at WAIS Divide often occur with changes in paleoclimatic conditions recorded in the ice, but less strongly than at some other sites, and especially central Greenland (e.g. Reference GowGow and others, 1997). WAIS Divide grain size is reduced in ice deposited during the ACR and LGM, and c –axes begin to cluster more strongly to the vertical in ice deposited during the LGM. Impurity effects are active, with higher impurity concentrations giving slower grain-boundary migration, longer-lived grains that can rotate more under the stress regime, and thus stronger single-maximum vertical c –axis fabrics, which promote faster basal shear and thus additional strengthening of the c –axis fabric (e.g. Reference Van der Veen and WhillansVan der Veen and Whillans, 1994). The smaller changes in impurity loading with climate changes at WAIS Divide than in central Greenland likely explain at least much of the weaker correlation between ice properties and climate at WAIS Divide. Very large grains develop in warm ice, here appearing first at temperatures just below –10°C (see also Reference Budd and JackaBudd and Jacka, 1989).
Work on the WAIS Divide core is ongoing, and additional insights are anticipated as we extend our physical analyses and compare them with emerging data from other groups on site and core characteristics and history. Additional comparisons with results from other cores are expected to be informative.
Acknowledgements
We acknowledge the following funding sources for support of this work: US Geological Survey Climate and Land Use Change Research and Development Program; US National Science Foundation Division of Polar Programs grants 0539578, 1043528, 1043313, 0839093 and 1142166. We also acknowledge the staff of the US National Ice Core Laboratory in Denver, Colorado; the WAIS Divide Science Coordination Office at the University of New Hampshire; and most especially the Ice Drilling Design and Operations group at the University of Wisconsin whose phenomenal success in designing and operating the new deep ice-sheet coring (DISC) drill has reinvigorated US deep ice-coring efforts. We thank numerous colleagues in the WAIS Divide project. Any use of trade, firm or product names is for descriptive purposes only and does not imply endorsement by the US Government.


