

1 Introduction
There are two schools of practice for empirical welfare analysis: partial and general equilibrium (PE and GE, respectively). While the historical divide goes back at least to Walras and Marshall and some theory and literature exists in common, each school has its own additional literature and practitioners with little communication between the two. This paper seeks to bridge the islands of practice by reviewing the logical consistency and substantial commonality among theoretical assumptions for PE and GE analysis. Where assumptions are not common, they may differ due to case specific relevance, empirical tractability or other analytical reasons but may as often be chosen based on the particular skills of the analyst. This article seeks first to (re)frame and synthesize assumptions to strengthen the bridges between practitioners. Second, the article questions the basis of the proscriptions against the use of GE by the U.S. Government in regulatory applications. The equally central empirical issue of which approach tends to have a smaller actual forecast error is not investigated here.
As a policy issue, the PE and GE divide appears from the expectation that a benefit-cost analysis (BCA) is part of a Regulatory Impact Analysis process in the United States. Every U.S. Presidential Administration since 1981 has required some form of BCA for proposed major regulations (Fraas & Morgenstern, Reference Fraas and Morgenstern2014). The Office of Information and Regulatory Affairs (OIRA) within the Executive Office of the President currently reviews the analyses. Over the years, OIRA has issued several guidance documents for BCA more generally and for regulation in particular (U.S. OMB, 1992, 2003). This central guidance has spawned additional guidance from some other agencies. While not binding, these documents incorporated input from leaders in the field and have some influence beyond the regulatory sphere. OIRA has a long-standing predisposition against GE analysis that is most clearly stated in its earliest guidance still in force:
Multiplier Effects: Generally, analyses should treat resources as if they were likely to be fully employed. Employment or output multipliers that purport to measure the secondary effects of government expenditures on employment and output should not be included in measured social benefits or costs. (U.S. OMB, 1992)
OIRA’s later guidance, targeted more specifically at regulation, identifies the potential for multimarket effects but falls well short of providing guidance on economy-wide impacts and on when or if GE analyses should be conducted.
Ancillary Benefits and Countervailing Risks
Your analysis should look beyond the direct benefits and direct costs of your rulemaking and consider any important ancillary benefits and countervailing risks. An ancillary benefit is a favorable impact of the rule that is typically unrelated or secondary to the statutory purpose of the rulemaking (e.g., reduced refinery emissions due to more stringent fuel-economy standards for light trucks) while a countervailing risk is an adverse economic, health, safety or environmental consequence that occurs due to a rule and is not already accounted for in the direct cost of the rule (e.g., adverse safety impacts from more stringent fuel-economy standards for light trucks). (US OMB, 2003)
In the review of assumptions that unite and divide PE and GE, the issue of the logical consistency of this apparent proscription against GE analysis will be assessed for its appropriateness and current relevance.
While the focus is on the U.S. application, EU guidance documents on BCA (EU 2008, 2014) have a somewhat more nuanced view of indirect effects. That guidance focuses on indirect effects caused by distortions, while noting that, in a perfectly competitive economy with small changes, all welfare effects are correctly captured by effects in the primary market. In a less than perfectly competitive economy, a “shadow price” measuring general equilibrium social opportunity cost is to be used (EU 2008, p. 48), so that the choice between PE and GE is one of convenience.Footnote 2 That guidance goes on to state that even if distortions exist, it may be that the change induced by a direct effect may be small (EU, 2008, p. 56). The guidance to ignore indirect effects appears strengthened in the updated guidance (EU, 2014, p. 64) although distributional effects are grouped with indirect effects. The EU guidance and the U.S. guidance both appear to default to a PE approach, although the EU guidance may be more accepting of the use of a GE model from which it is stated that equivalent PE shadow prices could be computed.
The methods used here to investigate PE and GE are those of a critical literature review where key issues are summarized and references provided to advanced texts widely used in foundational theory courses such as Varian (Reference Varian1992), Mas-Colell, Whinston and Green (Reference Mas-Colell, Whinston and Green1995) and Acemoglu (Reference Acemoglu2009), and occasionally to the professional literature. Text sources more specialized to BCA such as Boardman, Greenberg, Vining and Weimer (Reference Boardman, Greenberg, Vining and Weimer2011) and Just, Hueth and Schmitz (Reference Just, Hueth and Schmitz2004) are cited for their generally more applied approach to the topic. Numerous modeling variations exist in empirical practice, so what is reviewed here is subjectively focused on “standard” (versus “frontier”) practice (Farrow & Zerbe, Reference Farrow and Zerbe2013). The primary focus is on static PE and GE models, acknowledging the additional extensions in both metrics and estimation procedures for dynamic, stochastic and behavioral models (e.g., Acemoglu, Reference Acemoglu2009; Bernheim & Rangel, Reference Bernheim and Rangel2009).
The paper proceeds in Section 2 by summarizing topics related to commodity aggregation, conditions when PE and GE are equivalent and the mechanism of cross-market price effects, convergent and divergent assumptions between PE and GE as they affect the consumer, the firm, and Government; and finally assumed rules to close particular models. Section 3 addresses the specific question of OMB’s proscription against GE use.
2 Consistency and divergence of partial and general equilibrium
Within GE analysis, we observe several strains. One is optimized multimarket models in the spirit of pure microeconomics, such as computable general equilibrium (CGE) analysis (Shoven & Whalley, Reference Shoven and Whalley1992; Dixon & Jorgenson, Reference Dixon and Jorgenson2013) and their descendants including dynamic and stochastic elements. These models typically consist of many economic sectors and model the interactions between them. They typically although not necessarily use the concept of a representative agent (producer or consumer) as the decision-making unit of the sector. The GE framing typically involves a high level of aggregation but models direct and indirect effects transmitted through a chosen number of factor input and product output markets along with the expenditures of governments. Some distortions such as environmental externalities and labor taxation have a reasonably long history of inclusion but tend to be the exception rather than the rule (e.g., Ballard, Shoven & Whalley, Reference Ballard, Shoven and Whalley1985; Kokoski & Smith, Reference Kokoski and Smith1987; Hazilla & Kopp, Reference Hazilla and Kopp1990; Goulder, Reference Goulder1995; US EPA, 2017). These models may lack some of the financial components of the second strain of applied macroeconometric models that historically have had less microtheoretic foundations and that build from purely macroconcepts. We confine our attention to macromodels based on microfoundations rather than “pure” macromodels although the gap between even the two approaches may be diminishing.
Partial equilibrium welfare analysis limits itself to one or a few closely related markets as illustrated by the examples of ancillary costs and benefits cited above by OMB (2003). The PE approach is taught regularly in undergraduate and Master’s economics and policy courses using benefit-cost texts such as Zerbe and Dively (Reference Zerbe and Dively1994), Bellinger (Reference Bellinger2007), and Boardman et al. (Reference Boardman, Greenberg, Vining and Weimer2011). Such texts are almost if not entirely focused on the PE framing and methodology. Just et al. (Reference Just, Hueth and Schmitz2004) in a more advanced text focus on a PE approach but cover multimarket and GE in more detail, including distinguishing important cases when “equilibrium” PE analysis is formally appropriate (Just et al.; Appendix 9.B).Footnote 3 In contrast, a GE approach appears more widely accepted in Europe (Dreze & Stern, Reference Dreze, Stern, Auerback and Feldstein1987; Florio, Reference Florio2014) and in areas of application that tend to cross many market boundaries such as macroeconomic growth, international trade, taxation, and major terrorism events even if not commonly emphasized in applied textbooks (Dixon & Jorgenson, Reference Dixon and Jorgenson2013).
Markets and their nonmarket counterparts, like data, do not speak for themselves. It is an analyst’s choice to define the extent of one or more markets such as “food” or “all other commodities.” This commodity aggregation can be rationalized by the commonality of price movements of subcomponents whether deterministic or subject to a random error or through separability restrictions on utility (Varian, Reference Varian1992, pp. 147–154). Thus GE models, whatever their number of final markets, involve some commodity aggregation as do PE models. As succinctly summarized by Miller (Reference Miller u n d a t e d , pp. 98–101) or Whalley (Reference Whalley1975), such aggregation may be implicit in PE approaches that focus on the direct market of interest. Practically, data availability often creates institutionally defined boundaries to markets. Nonmarket effects such as pollution or other externalities may also involve aggregation at least as to effects and geographic extent.
The starting and often the ending point for many welfare analyses assumes perfectly competitive markets with no distortions in a closed economy. A small policy or project will have effects that can (but need not) be entirely measured in the primary market (Boardman et al., Reference Boardman, Greenberg, Vining and Weimer2011; Johansson & Kristrom, Reference Johansson and Kristrom2016). General equilibrium effects exist even with small changes, but cancel out by market clearing in other markets through an application of the envelope theorem. In that case, the PE and GE approaches are the equivalent (Johansson & Kristrom, Reference Johansson and Kristrom2016). This underscores an important point. Price changes are a typical linking mechanism across markets. However, price changes in other markets are necessary but not sufficient for justifying a GE analysis as illustrated by the results for an undistorted competitive economy.
A larger project causes impacts in related markets transmitted through nonzero cross-price elasticities. Such impacts can either be investigated structurally or in the market of direct interest via a reduced form (“equilibrium”) PE analysis (Harberger, Reference Harberger1964, Reference Harberger1971; Bullock, Reference Bullock1993; Just et al., Reference Just, Hueth and Schmitz2004, p. 361). The equilibrium comparison, however, takes into account the interactions normally considered in GE such that $\text{d}Q_{j}/\text{d}z_{i}$
is a total derivative taking into account changes in all markets where there are nonzero cross-price elasticities (Chetty, Reference Chetty, Arrow and Bresnahan2009, p. 458). As further complications arise, such as simultaneous distortions including labor taxes, imperfect competition or externalities, then the PE analysis – even taking into account cross-market (GE) adjustments – should take into account welfare impacts in the inter-related markets so that a multimarket or GE analysis is appropriate (Bullock, Reference Bullock1993; Just et al., Reference Just, Hueth and Schmitz2004, Appendix 9.B; Boardman et al., Reference Boardman, Greenberg, Vining and Weimer2011).
$\text{d}Q_{j}/\text{d}z_{i}$
is a total derivative taking into account changes in all markets where there are nonzero cross-price elasticities (Chetty, Reference Chetty, Arrow and Bresnahan2009, p. 458). As further complications arise, such as simultaneous distortions including labor taxes, imperfect competition or externalities, then the PE analysis – even taking into account cross-market (GE) adjustments – should take into account welfare impacts in the inter-related markets so that a multimarket or GE analysis is appropriate (Bullock, Reference Bullock1993; Just et al., Reference Just, Hueth and Schmitz2004, Appendix 9.B; Boardman et al., Reference Boardman, Greenberg, Vining and Weimer2011).
The common focus on cross-price elasticities as the mechanism that links markets can hide some of the generality of that “price” approach. Harberger (Reference Harberger1971) is clear when talking about taxes that he believes numerous policy issues can be modeled as a monetary shift in a market, whether a tax, an externality or another effect. It is through a chain rule that a nonzero cross-price elasticity can transmit a policy shock beyond a primary market. Consider a shock in market $i$
,
$i$
, $z_{i}$
, then the market interaction occurs through
$z_{i}$
, then the market interaction occurs through $\text{d}Q_{j}/\text{d}P_{i}\ast \text{d}P_{i}/\text{d}z_{i}$
, so that a nonzero cross slope (or elasticity) is a necessary but not sufficient condition for a GE analysis.
$\text{d}Q_{j}/\text{d}P_{i}\ast \text{d}P_{i}/\text{d}z_{i}$
, so that a nonzero cross slope (or elasticity) is a necessary but not sufficient condition for a GE analysis.
Most analysts hope for a rule of reason. When distortions exist in other markets, then the interaction between the change in the direct market and the other distorted markets is to be taken into account. Harberger (Reference Harberger1971, p. 791) hopes that “[t]he set of activities with significant distortions is a subset of the set of all activities; the set of activities whose levels are significantly affected by the action under study is another subset of the set of all activities. Only their intersection is important for the analysis of the effects of the specific policy action in question, and it is to be hoped that in most cases the number of elements in it will be of manageable size.” A limited type of multimarket analysis could then follow (Just et al., Reference Just, Hueth and Schmitz2004, pp. 346–349; pp. 365–366; Boardman et al., Reference Boardman, Greenberg, Vining and Weimer2011). Johansson and Kristrom devote considerable attention to a Taylor series approximation to distinguish among small, large and mega projects where analysts consider the magnitude of an approximation residual given discrete changes. Those approximations are driven by changes in price. But if many markets have distortions and are affected by a policy action, perhaps as through effects in the labor market, then a full GE analysis with all such affected markets are to be analyzed including traded goods.
Goulder and Williams (Reference Goulder and Williams2003) suggest that the labor market distortion created by labor taxes generates a large divergence between PE and GE approaches since that input market connects virtually all markets. Ultimately, whether GE impacts are large or small depends on the size of the change in the original market, the cross-price derivatives, the size of any distortion in the market and the accuracy of maintained hypotheses. Restrictions on these elements become important for PE analysis; but for GE analysis, the presence of market interactions represents the behavioral response of consumers (of both intermediate and final goods) such that the entire economy is sensitive to a change in any one market. The estimate of any impact is conditional on the maintained hypotheses of the model, such as the equilibrium or other closure restrictions, as well as the data and estimation procedures.
2.1 Welfare metrics, assumptions and distortions
Until the 1980s, distinct methodologies separated micro- and macroeconomics, and performance metrics differed between them as well. Microeconomics built a sequence of models beginning with individual actors such as consumers and producers, built first to a market level and then to a multimarket level. Models tended to use comparative static analysis evaluating changes in discrete equilibria. In that earlier era, macroeconomics focused on aggregated components such as the consumption and investment functions. In the 1980s, macroeconomic models became more explicitly built on microeconomic foundations aggregating from individual actors, to markets, to economy-wide analyses and typically with more attention to dynamic processes (Acemoglu, Reference Acemoglu2009, Chapter 5). Prior to this, input–output models, which contain many inherent limitations, such as assumptions of perfectly elastic supply response and absence of market considerations, were prevalently used for empirical multimarket analysis. PE models focus on metrics of net social benefits measured by the monetary value of welfare changes, while earlier GE models tended to focus on metrics such as GDP and employment.
2.2 Consumer welfare metrics and aggregation
The welfare metrics in contemporary optimized GE and PE studies typically measure the monetary value of a change in position, such as a change in utility for a consumer, which is then aggregated across consumers and at least two markets. The consumer is assumed to follow the rationality assumptions of neoclassical economics. While not underestimating the ability of economists to disagree, if welfare analysis focused solely on an individual consumer or producer, then the distinguishing elements among welfare metrics involving compensating and equivalent variation (CV and EV) and consumer surplus (CS) can be clearly delineated (Mohring, Reference Mohring1971; Mas-Colell et al., Reference Mas-Colell, Whinston and Green1995, pp. 80–85). Recall that compensating variation yields a money metric for the amount a consumer would require (or pay) to return to the initial condition, while equivalent variation bases the monetary metric on the new condition (at initial prices). Consumer surplus is the area between the individual Marshallian demand curve and the price and consequently does not hold utility constant. The welfare metrics are equivalent when there are no income (wealth) effects, as when utility functions are quasilinear in incomeFootnote 4 (Mas-Colell et al., Reference Mas-Colell, Whinston and Green1995, p. 24, 83). These metrics are usually developed in detail for consumers but can be applied to producers and factor suppliers (Just et al.).
Substantial intellectual effort has gone into distinguishing EV, CV and CS. Applied studies often assume no wealth effect or equivalently the quasilinearity of the utility function and hence the equality of EV, CV and CS measures (Varian, Reference Varian1992, p. 163; Mas-Colell et al., Reference Mas-Colell, Whinston and Green1995, p. 83). Or analysts may be relying on bounds on the estimation error when S is used in place of CV or EV when the (absolute value) of the income elasticity times the S share of income is less than a specified value (Willig, Reference Willig1976; Just et al., Reference Just, Hueth and Schmitz2004, Section 6.B). To the extent aggregation occurs – with more on the conditions for exact aggregation below – not only individual but aggregate measures of EV, CV and S can be estimated.
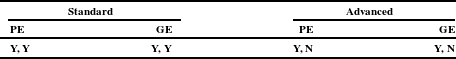
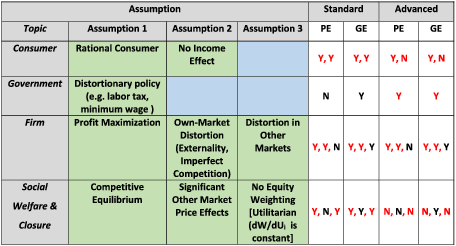
The standard choices for a rational consumer and the possible divergence due to income effects for standard and frontier PE and GE modeling are presented in Table 1. This table format will be repeated in subsequent sections based on the author’s review in the text. The table identifies which of various assumptions are typically accepted in either a standard or frontier analysis. A “Y” (“N”) indicates an assumption is typically accepted (not accepted) in the authors’ assessment. For consumer modeling, both PE and GE modeling generally maintain the assumption of a rational consumer and no income effect in standard modeling, but each sometimes drops the latter assumption in more advanced modeling. In contrast, the frontier area of behavioral welfare economics rejects the usual rationality assumptions (Bernheim & Rangel, Reference Bernheim and Rangel2009) but is not pursued here.
Consumer: assumptions of rational consumer, no income effect.
The existence of income (wealth) effects is a confounding factor in aggregation for even a single market. Consider if demands are heterogeneously shifted by changes in income, and a policy changes the income distribution. Then information on the heterogeneous nature of consumers (and other actors) would be necessary to aggregate by subgroup or individuals (Mas-Colell et al., Reference Mas-Colell, Whinston and Green1995, p. 106; Acemoglu, Reference Acemoglu2009, p. 150). Alternatively, if demand functions (derived from appropriate utility or indirect utility functions) are linear in income with a common coefficient on income across actors, then the members of that market can be represented by a single aggregate, representative actor (Varian, Reference Varian1992, p. 169; Mas-Colell et al., Reference Mas-Colell, Whinston and Green1995, p. 107; Acemoglu, Reference Acemoglu2009, p. 151). Such functions are said to have a Gorman Polar form (Gorman, Reference Gorman1961), which includes quasilinear demand functions. When it is not acceptable to assume that consumers have a common and constant marginal utility of income consistent with a Gorman form, then some degree of disaggregation is required to account for heterogeneity in welfare analysis.
Initially the choice of reference point for the welfare measure seemed arbitrary, but when there are multiple alternatives, then using the initial prices (but new condition) through EV seems appropriate for cross alternative comparison (Varian, Reference Varian1992). However, work by behavioral economists highlights the importance of the reference point in regards to gains and losses (e.g., Knetsch et al., Reference Knetsch, Riyanto and Zong2012; Brennan, Reference Brennan2016) and in regard to other departures from “rationality” such as the choices of addicts (Bernheim & Rangel, Reference Bernheim and Rangel2009; Weimer, Vining & Thomas, Reference Weimer, Vining and Thomas2009). Such adjustments are not common but are certainly present on the frontier.
The assumption of a representative consumer for welfare analysis is more often explicit in GE modeling and implicit in PE modeling when market level data are used. However, at least as far back as Samuelson (Reference Samuelson1947) and Samuelson and Swamy (Reference Samuelson and Swamy1974) there is concern with the positive (objective) consistency of assuming a constant and common marginal utility of income for aggregation (consistent with the Gorman form). PE models occasionally use explicit aggregation of micro-outcomes in place of a representative consumer, and frontier analyses may use more complex aggregation than standard practice. None-the-less, standard practice for both GE and PE is to aggregate consumers ignoring wealth (income) effects as is done implicitly when CS is assumed equal to CV and EV.
Additional metrics are used in GE analyses that have a welfare interpretation only under increasingly strong assumptions. One additional GE welfare metric is a revealed preference, aggregate approximation to EV or CV; variously called Laspeyres and Paasche cost difference or over and under measures (Ng, Reference Ng1980; Dixon & Rimmer, Reference Dixon and Rimmer2002). These measures, given microeconomic assumptions of exhaustion of budget and macroeconomic closure rules that government and savings are returned to households, are approximations of real national consumption at initial or postchange prices that omit substitution effects. In addition, GE modelers have decomposed welfare effects, particularly in regard to tax effects and international trade. Under various assumptions, one can decompose the total welfare effect into economically meaningful components such as a tax interaction effect (Shoven & Whalley, Reference Shoven and Whalley1992), a “commodity terms-of-trade” effect (Burfisher, Reference Burfisher2011), an “endowment” effect, and so on (Hanslow, Reference Hanslow2000; Huff & Hertel, Reference Huff and Hertel2001).
2.3 Firm and government welfare metrics and assumptions
Consumer welfare metrics are complicated by potential income effects. In contrast, as there are no income effects on the production side comparable to that on the demand side, an aggregate firm generally exists in the absence of distortions such as externalities and imperfect competition (Acemoglu, Reference Acemoglu2009, p. 158; Just et al.). Although CV and EV measures can be used for the firm, operating profit (that excludes fixed costs) generally measures the net willingness to pay for the output of the competitive firm in the short run. The equivalently termed producer surplus exists with considerations for the short run or the long run, although subtleties can exist related to shut-down conditions and so forth (Just et al., Reference Just, Hueth and Schmitz2004).
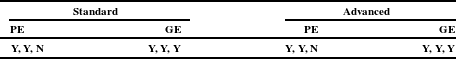
The welfare analysis of the firm is most frequently complicated by market distortions such as imperfect competition and externalities. The presence or absence of distortions in the rest of the economy affects the extent to which equilibrium market adjustments can be assessed solely in a primary market of concern as discussed above. PE models standardly include distortionary effects such as pollution and imperfect competition, although typically only in the primary market of concern. GE models may standardly incorporate some distortions such as externalities less frequently, although explicit modeling of taxes and an open economy occurs more frequently, effects that are discussed in the government and closure sections below. The distinction between PE and GE based on standard assumptions regarding externalities and market structure is shown in Table 2.
Firm: assumptions of profit maximization, primary market distortions such as externalities or market structure, secondary market distortions.
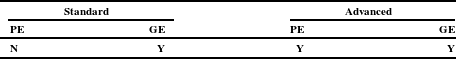
Government policies can also cause or correct distortions. Income taxes and minimum wages are common examples of creating distortions from the competitive baseline (albeit for well-argued reasons), while some regulatory actions, other taxes, or policies may seek to correct distortions. When taxes are included in an analysis, then both the PE and GE models include the net change in Government revenues (net change in transfers) as an additional component of the social welfare measure (Just, et al.; Zerbe & Dively, Reference Zerbe and Dively1994). Table 3 above identifies the common PE and GE assumptions about the role of Government. The presence of labor or capital taxes and the distortions they cause is one of the more frequently cited justifications for carrying out a GE analysis instead of a PE analysis (Harberger, Reference Harberger1964; Goulder & Williams, Reference Goulder and Williams2003).
Government: assumption of broad distortionary policy such as labor tax.
2.4 Social aggregation and closure rules
How the analyst chooses to aggregate individual preferences is captured in the explicit or implicit Social Welfare Function. A standard practice in both PE and GE is the utilitarian sum of equally weighted (monetized) impacts for those identified as having standing in the analysis. If consumer utility is consistent with a Gorman form, with its fixed coefficient on income or wealth, then strong normative properties exist such that aggregation is relevant for welfare evaluation with any form of wealth distribution (Mas-Colell et al., Reference Mas-Colell, Whinston and Green1995, p. 119). Further, if wealth is distributed optimally prior to any allocation, perhaps as a result of political rules, then aggregation based on Gorman forms for indirect utility implies aggregate welfare measures for any social welfare function (Mas-Colell et al., Reference Mas-Colell, Whinston and Green1995, p. 119). Other conditions may occur such that aggregate demand exists but it does not have welfare implications consistent with a specific welfare function (Mas-Colell et al., Reference Mas-Colell, Whinston and Green1995, p. 120). One argument for unequal social welfare weighting is differing marginal utilities of income (Nyborg, Reference Nyborg2012), also a reason why a single aggregate consumer may not exist. Both frontier PE and GE models admit heterogeneous groupings and welfare aggregation although it is not a common practice.Footnote 5 Johansson and Kristrom (Reference Johansson and Kristrom2016, Chapter 7) also survey social welfare functions and discuss how differing social weights are considered in some guidance documents.
The second type of social aggregation is how one market interacts with other markets to define an economy-wide solution. A competitive market (without taxation) defines an equilibrium where the supply price is equal to the demand price (the basis for the first best solution where PE is the same as GE as above). In general, as multiple distortions are introduced that separate the demand and supply price (consider externalities, taxes, and imperfect competition as above), then related markets are incorporated with numerous special cases having been investigated (Just et al., Reference Just, Hueth and Schmitz2004; Johansson & Kristrom, Reference Johansson and Kristrom2016). Welfare effects will depend on the magnitude of the induced change in price. This condition is also apparent in a Taylor series approximation to changes in welfare where larger changes in price have larger effects for a given cross-price elasticity (which are sometimes assumed equal in many markets in GE analysis). Hence the assumption of the magnitude of the price change (if any) in related markets is often associated with the choice between PE and GE.
In addition, a significant area of application of empirical GE models has been to place limitations on the availability of critical inputs to the production process, such as electricity and water services, caused by a natural disaster or terrorist attack or by the minimum wage referred to earlier. Constraints are placed on these inputs, so that the market equilibrium deviates from the unrestricted equilibrium (e.g., Rose & Liao, Reference Rose and Liao2005; Rose, Oladosu, Lee & Asay, Reference Rose, Oladosu, Lee and Asay2009; Sue Wing, Rose & Wein, Reference Sue Wing, Rose and Wein2016).Footnote 6 PE models can also include such restrictions.
The market interactions modeled in GE analysis typically require additional closure rules. These often are equated to major account balances and the specification of exogenous and endogenous variables in the modeling of a macroeconomy in order to solve the system of GE equations. The main consideration is whether one assumes these accounts are in equilibrium or disequilibrium, although this is often couched in terms of exogenous and endogenous variables (Burfisher, Reference Burfisher2011). Major accounts or markets to which this applies include the labor market, markets for traded commodities, and investment and savings, often referred to as “macroclosure.”
The most oft-considered closure rule relates to the labor market, often explicit in GE models and implicit in PE models. One approach termed the “Keynesian-closure rule,” allows for an underemployment equilibrium by fixing (holding constant) the wage rate, and allowing labor supply to adjust (Boardman et al., Reference Boardman, Greenberg, Vining and Weimer2011). The primary alternative is the “neoclassical closure rule” that uses inelastic labor supply and a flexible wage rate to define the equilibrium (Acemoglu, Reference Acemoglu2009, pp. 30–31). In some literatures, these two closure rules are referred to as the short-run and long-run labor market closures, respectively. This is a reasonable interpretation, as in the long run one would expect that labor mobility and various adjustments would bring about a full employment equilibrium. However, the downside is that most applications of the model using this closure rule will result in no change in employment due to a shock. While employment is not of itself a welfare measure (although it may have welfare implications), it is of significant interest to policymakers. Assuming the neoclassical closure implies that there are zero employment impacts in the spirit of OMB guidelines, which assume full employment, but this often raises policy concerns. Some models fully endogenize labor, and so employment changes can result even if that employment is “optimal.” One might think that the long-run closure rule is appropriate to most BCA involving a long duration. However, the short-run (Keynesian) closure rule would be applicable during the construction as opposed to the operating phase. Otherwise, the appropriate choice of closure rule is an empirical question as to whether labor is fully employed or not.
Most texts on BCA admonish the reader against including general equilibrium or other types of “multiplier” effects, citing that any gains in other markets must come at the expense of other activity because fully employed resources are diverted from the most productive uses. This is presumably the basis for the OMB proscription against including such effects. After numerous examples, however, texts often include a statement along the lines of: “Local projects are most likely to generate significant positive benefits in secondary markets when local rates of unemployment are high or other local resources are idle” (Boardman et al., Reference Boardman, Greenberg, Vining and Weimer2011, p. 115). Of course, this places a burden on the analyst to determine the level of employment, not only in the market in question, but elsewhere in the economy. At the same time, this statement may be less relevant in the case of a regional economy, or in a national economy with open or porous borders and ease of mobility. For example, at the regional level in the United States, it is not unreasonable to assume labor will migrate (or commute) into region to fill job openings from neighboring regions where unemployment exists.
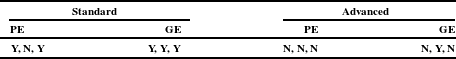
These assumptions for social aggregation and closure rules are presented in Table 4. Standard PE and GE use equivalent social welfare and closure rules, while advanced PE is more likely to involve equity (social welfare) weighting in the welfare function.
Social aggregation and closure: assumptions of no distortion competitive markets, significant other price changes, and no equity weighting.
3 Is the OMB proscription justified?
The preceding review of the common and divergent basis of modern PE and GE is summarized in Table 5. This table illustrates that both analytical frameworks begin with the same micro-assumptions about consumers, firms and government and their aggregation as generally indicated by red elements in Table 1 for standard analyses. Common types of divergence between the models begin with the existence of large cross-market price effects followed by other distortions such as taxes, externalities, and market structure indicated by some of the black elements for standard analyses. Either type of model is logically consistent; the divergence primarily depends on maintained hypotheses about conditions or effects in other markets, pre-existing distortions, and externalities.
Is the OMB proscription against including secondary or multiplier effects in BCA justified on the basis of the logical consistency of either model? The proscription, by its very wording, was done during an earlier generation of GE models, when input–output (I–O) modeling was the primary tool for applied GE analysis. In guidance for BCA (U.S. OMB, 1992), additional mention is made that at full employment there can be no economy-wide secondary or multiplier effects, presumably in aggregate. However, in the I–O general equilibrium model in use at the time, and still often used today (Rose, Reference Rose1995), the linear algebra behind the model requires that an increase in activity generates secondary or multiplier effects. Such a guaranteed result was perhaps abused in the analysis of various projects thereby encouraging a proscription against its use.
PE and GE convergent and divergent assumptions: red indicates commonality.
Source: Author’s assessments as above.
Modern GE models build on solutions to nonlinear feedbacks and equilibrium conditions in markets so that positive, “general equilibrium” multipliers are not a required outcome of the model. Depending on the form of labor market closure, constant employment, full employment, or sustained unemployment can be modeled. Hence newer GE models address some of the earlier concerns about use of GE models to inform policy decisions.
Ultimately, many policies of interest to government decision-makers are not small policies. In regard to regulation for instance, OMB only requires a regulatory impact assessment, including a BCA, if the economic effect is greater than $100 million (with some alternative criteria possible). More generally, polices related to the control of greenhouse gases, homeland security expenditures, the health care system, international trade agreements or large scale government expenditure programs to expand the economy are not small changes where effects occur in only one or a limited number of markets. A GE framing typically seems appropriate for such analyses. Other policies, including many but not all regulations, may require modeling at a high level of detail or consideration of nonmarket activities that may be difficult to analyze using a standard GE approach.
Consequently, given the common theoretical constructs for welfare measurement used in both PE and GE models today and the evolution in computation, the current, default proscription against GE models in BCA for regulatory, policy, and program purposes appears unwarranted and worthy of review.


 Open access