

INTRODUCTION
In recent years it has become common to use mathematical modelling to analyse the underlying disease dynamics of pandemic influenza virus candidates [Reference Merler and Ajelli1–Reference Ferguson10]. The use of mathematical models to explicitly support policy decisions is part of a more general change in the decision-making process that has led to the inclusion of objective qualitative and quantitative data in the policy-making process. As of April 2009, after the pandemic threat emerged worldwide [11], it was crucial for policy makers to have early predictions on the possible spread of A/H1N1v 2009 influenza virus. The 2009 A/H1N1v pandemic will continue to generate new challenges for public health decision makers over the next few years.
This work illustrates part of the real-time analysis undertaken to provide weekly advice to the Italian Ministry of Health during the early phases of the epidemic; in particular, a reference scenario on the spatiotemporal spread of the 2009 influenza pandemic was provided, and the potential effectiveness of mitigation interventions, both pharmaceutical and non-pharmaceutical, was assessed. The transmission model used was parameterized on the basis of existing evidence, as derived from the analysis of data from the National Surveillance System up to 17 June 2009 and on estimates of key epidemiological parameters as available at that time. In order to provide a preliminary assessment of the model predictions performed during the early stages of the epidemic, we compare model predictions with influenza-like illness (ILI) data, available since August 2009.
METHODS
Data description
The national active surveillance system for the 2009 influenza pandemic was in place from 28 April 2009 to July 2009. The case definition, the procedure for active case-finding of possible imported cases, and the universal laboratory testing of all suspected cases coming from affected areas are described in Rizzo et al. [Reference Rizzo12]. Briefly, all individuals coming from affected areas received specific medical advice from the health authorities at airports and seaports, advising them to refer to the hospital in case of symptoms. Following WHO recommendations [13], since end of July 2009 the focus of surveillance activities has been to report the weekly aggregated ILI cases according to a specific case definition (Ministry of Health, available in Italian at: http://www.normativasanitaria.it), as active case-finding became unsustainable and unnecessary. A case of ILI was defined as sudden onset of acute respiratory symptoms and fever >38°C, plus at least one of the following systemic symptoms: headache, malaise, chills, sweats, fatigue; plus at least one of the following respiratory symptoms: cough, sore throat, nasal obstruction. The new recommendations provided by the Ministry of Health to Regional Health Authorities were to report weekly ILI cases [from general practitioners (GPs), paediatricians and clinicians in general, to whom patients refer in case of symptoms] and to collect specimens only from patients with moderate to severe illness or in case of unusual events such as cases of severe or fatal ILI, cases of ILI requiring hospitalization, unexplained or unusual clinical patterns associated with serious or fatal cases, and clusters of ILI (Ministry of Health, available in Italian at: http://www.normativasanitaria.it).
By October 2009, following the increasing number of cases in Italy, the Sentinel Influenza Surveillance System (InfluNET available at: www.flu.iss.it) became the official surveillance system for ILI cases in Italy (Ministry of Health, available in Italian at: http://www.normativasanitaria.it). Since 1999, InfluNET has been routinely based on a nationwide, voluntary sentinel network of physicians in the 21 regions and autonomous provinces of the country. Incidence rates are therefore not based on consultations but on the served population of each reporting physician each week. Usually, during seasonal influenza, InfluNET is activated from week 42 (mid October) to week 17 (end of April). Following the emergence in late April 2009 of the A(H1N1)v influenza virus in the USA and Mexico the Italian Ministry of Health decided to continue InfluNET surveillance during the summer season (Ministry of Health, available in Italian at: http://www.normativasanitaria.it). However, no signal was detected from the system during the summer since very few sentinel practitioners reported ILI cases. InfluNET usually consists of an average of 830 (range 648–902) GPs (including also paediatricians) per year, covering about 1·5–2% of the general population, reporting ILI cases (according to a specific case definition), representative for age, geographic distribution and urbanization level. The Italian InfluNET surveillance system is part of the European Influenza Surveillance Scheme (EISS) coordinated by the European Centre for Disease Prevention and Control (ECDC).
The model
The transmission model was previously used for evaluating the effectiveness of the control measures adopted in the Italian pre-pandemic plan [Reference Ciofi degli Atti3] and for assessing the age-prioritized distribution of antiviral doses during an influenza pandemic [Reference Merler, Ajelli and Rizzo2]. In short, it is a stochastic, spatially explicit, individual-based simulation model. Individuals are explicitly represented and can transmit the infection to household members, to school/work colleagues and in the general population (where the force of infection is assumed to depend explicitly on the geographic distance). The national transmission model is coupled with a global homogeneous mixing SEIR model accounting for the worldwide epidemic. The fraction of worldwide infective individuals imported into Italy is determined by the number of international passengers arriving daily at Italian airports. Specifically, each imported case is assigned to a municipality where an airport is operating by randomly sampling from a multinomial distribution, whose probabilities are given by the number of yearly international arrivals at the different airports. Differences in the timing of the pandemic in Southern and Northern hemispheres are not explicitly modelled: first, such differences are accounted for by the global reproductive number used in the simulations; second, a much more detailed global model [Reference Balcan14] should be used for better describing the worldwide spread of the pandemic. Details on the national and global transmission models can be found in [Reference Ciofi degli Atti3].
Model parameterization
Regarding the epidemiological assumptions (e.g. length and shape of the infectivity period, which lead to an effective generation time of 3·2 days) this study is in accord with previous studies [Reference Merler, Ajelli and Rizzo2, Reference Ciofi degli Atti3, Reference Ferguson10, Reference Hayden15], except for the proportion of symptomatic individuals which is assumed to be 66·7% [16]. The reproductive number of the global SEIR model was estimated by analysing the cumulative number of worldwide deaths in the period from 16 May 2009 to 17 June 2009, as reported by the WHO [17]. The reproductive number of the national transmission model was set at 1·4, according to the early estimates as obtained during the initial phase of the epidemic in Mexico in a community setting [Reference Fraser18]. The analysis of the first 158 laboratory-confirmed cases [Reference Rizzo12] revealed that only 14 cases were autochthonous secondary cases while the remaining (87%) were believed to have been infected abroad, primarily either in the USA (100 cases) or in Mexico (nine cases). For the 148 (94%) influenza A(H1N1)v cases with available information on age, the median age was 28 years (range 0–69 years). We initialized our simulations through the global homogeneous mixing model in such a way that 144 imported cases were generated up to 7 June 2009. This gives a reliable method of fixing the time in the simulations and thus determining the timing of school closure and vaccination in the simulations. The model accounts for school closure for both summer and Christmas holidays: we assumed that in these periods contacts among students decrease while contacts in the general community increase [Reference Cauchemez19]. Specifically, for simulation steps corresponding to times in which schools are closed according to the Italian school calendar or to the implemented school closure strategies, the within-school transmission rate is set to zero, while the general community transmission rate is increased by 20%. We also considered scenarios accounting for partial immunity in the population. Specifically, we assumed that 1/3 of individuals aged >59 years have natural immunity to the pandemic virus, according to a serological study performed in the US population [Reference Xing and Cardona20].
A summary of all parameters used in the model is provided in Table 1.
Model parameters
* Consistent with the value used in refs [Reference Merler, Ajelli and Rizzo2, Reference Ciofi degli Atti3, Reference Ferguson4, Reference Ferguson10].
† Consistent with ref. [Reference Ciofi degli Atti3].
Intervention options
The model was used for creating possible scenarios on the effects of different mitigation measures already in place or to be implemented within few months (e.g. pandemic vaccine). The investigated intervention options considered were: case isolation, school closure, pandemic vaccination and antiviral treatment and prophylaxis.
Case isolation
According to the recommendations of the Ministry of Health (confirmed cases coming from affected areas were to be isolated for 7–10 days, either in hospital or at home), we assumed that imported symptomatic cases were isolated on the first day after the onset of symptoms. This recommendation remained in place until 27 July 2009.
School closure
According to the Italian school calendar, we assumed that schools were closed from 10 June 2009 to 10 September 2009 for the summer holidays and from 22 December 2009 to 6 January 2010 for the Christmas holidays. The effects of prolonged school closure were also investigated.
Vaccination
We assumed 6 weeks for the logistical distribution of doses of pandemic vaccine. We considered the administration of two vaccine doses 1 month apart (at the time of simulation specific recommendations regarding the administration of a single dose of pandemic vaccine from EMA were not yet available). The pandemic vaccine was considered effective after the administration of the second dose with a vaccine efficacy of 70%. We assumed the vaccine to be administered according to priority, first vaccinating the target population that accounts for essential service workers (including healthcare workers and blood donors), pregnant women at the second or third trimester, and at-risk patients (with chronic underlying conditions) aged <65 years, which, considering a vaccination coverage of 90%, corresponds to about 8·5 million individuals in Italy.
Antivirals
In the initial phase of the epidemic, antiviral treatment and prophylaxis were administered to confirmed cases and to close contacts. We assumed that the surveillance system would be able to detect 90% of symptomatic cases. After 8 July 2009, antiviral treatment was considered only for cases with severe complications and in case of local clusters. Since it was difficult to establish the proportion of treated cases, we considered different scenarios, e.g. antiviral treatment from 0% to 30% of symptomatic cases. In accord with Merler et al. [Reference Merler, Ajelli and Rizzo2], both treatment and prophylaxis were assumed to start 1 day after the clinical onset of symptoms in the index case. Treatment was assumed to reduce infectiousness by 70% [Reference Merler, Ajelli and Rizzo2–Reference Halloran5, Reference Germann7, Reference Longini9, Reference Ferguson10], whereas antiviral prophylaxis was assumed to reduce susceptibility to infection by 30%, infectiousness by 70%, and the occurrence of symptomatic disease by 60% [Reference Merler, Ajelli and Rizzo2, Reference Ciofi degli Atti3, Reference Halloran5, Reference Longini9].
RESULTS
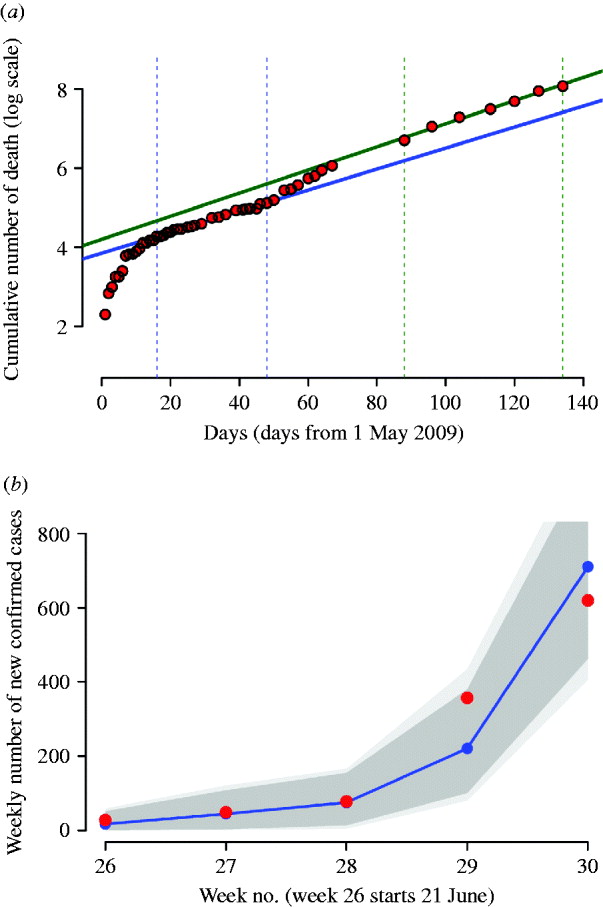
As of 26 July 2009, about 1238 confirmed cases had been reported to the Italian surveillance system for pandemic influenza (Fig. 1 b). From May to early July almost all confirmed cases reported before the beginning of July were travel related, the remaining cases who acquired the infection in Italy were close contacts of a confirmed travel-associated case. During July the sudden increase of ILI-confirmed cases suggested a sustained autochthonous transmission in Italy, which was also confirmed by reported outbreaks at several school summer camps. As of 27 July no deaths were reported in Italy. For the 1238 influenza A(H1N1)v cases with available information on age, the median age was 24 years (range 0–69 years) and 56% were male. Cases aged <30 years constituted 72% of the cases, 25% were aged between 30 and 59 years, and only 3% of cases were aged ⩾60 years.
(a) Red dots represent the logarithm of the cumulative number of worldwide deaths as reported in WHO updates. The solid blue line represents the best fit of an exponential model to the cumulative number of worldwide deaths during the period delimited by the two vertical dotted blue lines; solid green line represents the best fit during the period delimited by the two vertical dotted green lines. (b) Weekly number of confirmed cases in Italy, from 21 June 2009 to 26 July 2009 (red dots) and model fit (blue dots and line); the dark grey area represents 95% confidence intervals, the light grey area represents the minimum and the maximum of the simulated number of cases. The simulations have been generated by assuming cases isolation, antiviral treatment and prophylaxis of index cases until 8 July 2009. Detection probability is fixed to 90%.
According to ILI incidence reported to the surveillance system, Italy experienced a single major pandemic wave during autumn. The number of potential ILI cases reported to the surveillance system during the period from week 35 in 2009 to week 2 in 2010 was about 107 000. The frequency distribution of ILI cases, shown in Figure 2 a, reveals that the younger age groups were the most affected (about 86% of cases were reported in individuals aged <15 years). Despite the large number of individuals aged >64 years in the Italian population (about 22%) and a reporting factor reasonably higher than that observed in adults, the percentage of ILI cases was about 3%. This pattern is similar to that observed throughout Europe [Reference Reichert21]. The number of ILI-related deaths reported to the surveillance system was 245: the frequency distribution is shown in Figure 2 a. A completely different pattern with respect to ILI prevalence is observed: most deaths were observed in elderly individuals, especially those aged >84 years, where the number of ILI-related deaths was about 4·5/100 000 individuals; this differs strongly from what was observed for the first 100 deaths in Mexico [Reference Chowell22]. The temporal trend of ILI incidence and the number of ILI-related deaths is shown in Figure 2 b.
(a) Percentage distribution of influenza-like illness (ILI) cases (top) and ILI-related deaths (bottom) as reported to the surveillance system during the period from week 35 in 2009 to week 2 in 2010. (b) Blue vertical bars represent the weekly number of deaths related to ILI in Italy [as reported in the Flu news reports of the National Center for Epidemiology Surveillance and Health Promotion, Istituto Superiore di Sanità, (http://www.epicentro.iss.it/focus/h1n1/archivioflunews.asp)]. The red curve represents the weekly ILI incidence as reported to the national surveillance system. (c) The peak week of ILI incidence reported to the surveillance system in the different Italian regions as a function of the annual number of international passengers arriving at the regions' airports. Only regions receiving at least 100 000 international passengers annually are shown.
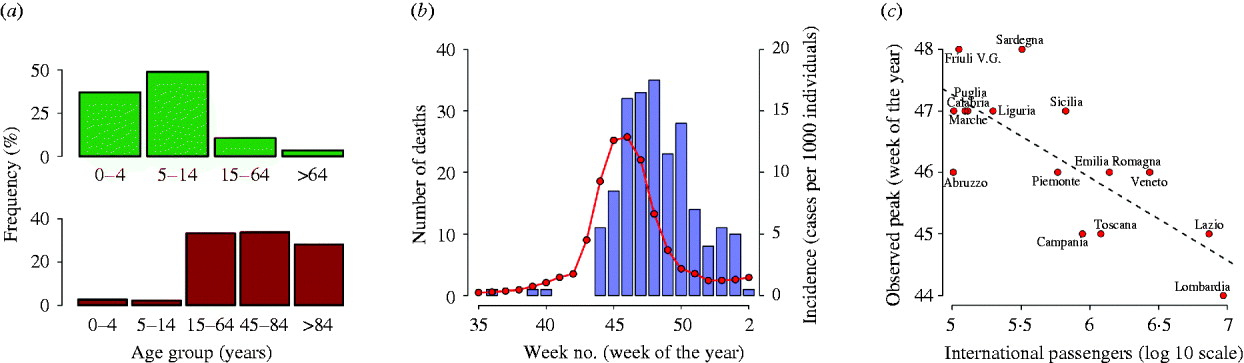
Peak week of ILI incidence reported to the surveillance system in the different Italian regions varied from week 44 to week 48. A clear geographical pattern cannot be easily detected. However, a negative correlation between peak week incidence and yearly number of international passengers arriving at the airports of the different regions has been observed (see Fig. 2 c).
By analysing the number of worldwide deaths during the period from 16 May 2009 to 17 June 2009, we found an exponential growth rate of 0·0266 days−1 (see Fig. 1 a, blue line). By assuming an average generation time of 3·2 days, we estimated the ‘global’ reproductive number to be R 0,global=1·08. This value was validated by using data from 1 May 2009 to 11 September 2009, during which the epidemic was better established worldwide. The new estimate of the exponential growth rate was 0·0292 days−1 (see Fig. 1 a, green line), leading to R 0,global =1·09. Of course, local estimates of R 0 could be higher, as shown in recent studies [Reference Yang23–Reference Boelle, Bernillon and Desenclos26].
By analysing the number of ILI cases reported to the surveillance system during weeks 39–44, we found that the exponential growth rate was 0·832 weeks−1 and thus we estimated the national reproductive number to be R 0=1·38. Although higher transmissibility during the autumn–winter season might have been expected, this independent estimate of the reproductive number supports the choice of the value adopted in the model simulations (R 0=1·4).
In the absence of intervention measures, the predicted cumulative attack rate was 30·6% [95% confidence interval (CI) 30·6–30·7] and the peak was expected in week 42 (95% CI 41–42) with a peak day incidence of 0·35% (95% CI 0·329–0·37) (see Table 2). A comparison between the number of confirmed cases from weeks 26–30 and model predictions, obtained by assuming case isolation, antiviral treatment and prophylaxis to 90% of symptomatic cases until 8 July 2009 is shown in Figure 1 b. Under such assumptions, the peak was expected in week 43 (95% CI 43–44). From now on, this last scenario will be considered as the reference scenario, since it is close to the situation experienced in Italy. By assuming 33·3% of natural immunity in the population aged >59 years, the peak was expected 1 week later than in the reference scenario, i.e. in week 44 (95% CI 44–45) (see Table 3), and a substantial decrease of the daily peak incidence, from 0·35% to 0·31%, and of the cumulative attack rate, from 30% to 27%, was predicted (see Tables 2 and 3). The findings, reported in the first two rows of Table 2 and in the first two rows of Table 3, suggest that the control strategies performed in Italy during summer had an impact in slowing the epidemic spread by at least 1 week. The good agreement between model predictions and weekly number of confirmed cases in Italy during weeks 26–30 (see Fig. 1 b) provides further support for the value of R 0 used in the simulations.
Effectiveness of mitigation strategies
AVP, Antiviral prophylaxis to household contacts of index cases.
Average values and 95% confidence intervals (in parentheses) are reported.
* Measured in days from 14 June 2009.
† Until 8 July 2009. Case detection fixed at 90%.
Effectiveness of mitigation strategies by assuming natural immunityFootnote *
AVP, Antiviral prophylaxis to households contacts of index cases.
Average values and 95% confidence intervals (in parentheses) are reported.
* Natural immunity on 33·3% of the population aged >59 years.
† Measured in days from 14 June 2009.
‡ Until 8 July 2009. Case detection fixed at 90%.
To validate the model, we compared model predictions (which are based only on the information available on the early phases of the epidemic) with ILI data. The peak week incidence as predicted by the reference scenario is 3 weeks in advance with respect to the observed ILI peak, which reduces to 2 weeks when natural immunity is considered (see Fig. 3 a, c). On the basis of model predictions, we estimated the underreporting factor of InfluNET to be 3·7, which reduces to 3·3 in the reference scenario accounting also for partial immunity. By aligning the peaks of simulations and ILI data, and by adjusting the ILI data by the underreporting factor, we observed that almost all the points in the increasing phase of the epidemic lie within the 95% CI of the reference scenario (with or without considering natural immunity, see insets in Fig. 3 a, c). On the other hand, the decay phase of the simulated epidemics shows a small delay with respect to the ILI data.
(a) The blue circles represent the average weekly incidence (cases per 1000 individuals) as in the reference scenario, vertical blue lines represent the 95% confidence intervals (CI). The red circles represent the influenza-like illness (ILI) incidence adjusted by the reporting factor. Summer and Christmas holidays, during which schools are regularly closed, are represented by a grey background. The inset shows the simulated epidemic and ILI data as obtained by aligning the peak of the simulations to the peak in the dataset. (b) The red horizontal line represents the cumulative incidence as obtained by summing the weekly incidences of ILI cases in the four age groups considered in the surveillance system: 0–4, 5–14, 15–64 and >65 years. The black curve represents the final attack rate by age (small grey area represents the 95% CI) as obtained by simulating the reference scenario. The blue horizontal line is the average of the final attack rate as predicted by the model in the four age groups considered in the surveillance system. (c) As for panel (a) but the simulations account also for a natural immunity in the elderly population (natural immunity is assumed for 33·3% of individuals aged >59 years). (d) As for panel (b) but the simulations account also for a natural immunity in the elderly population (natural immunity is assumed for 33·3% of individuals aged >59 years).
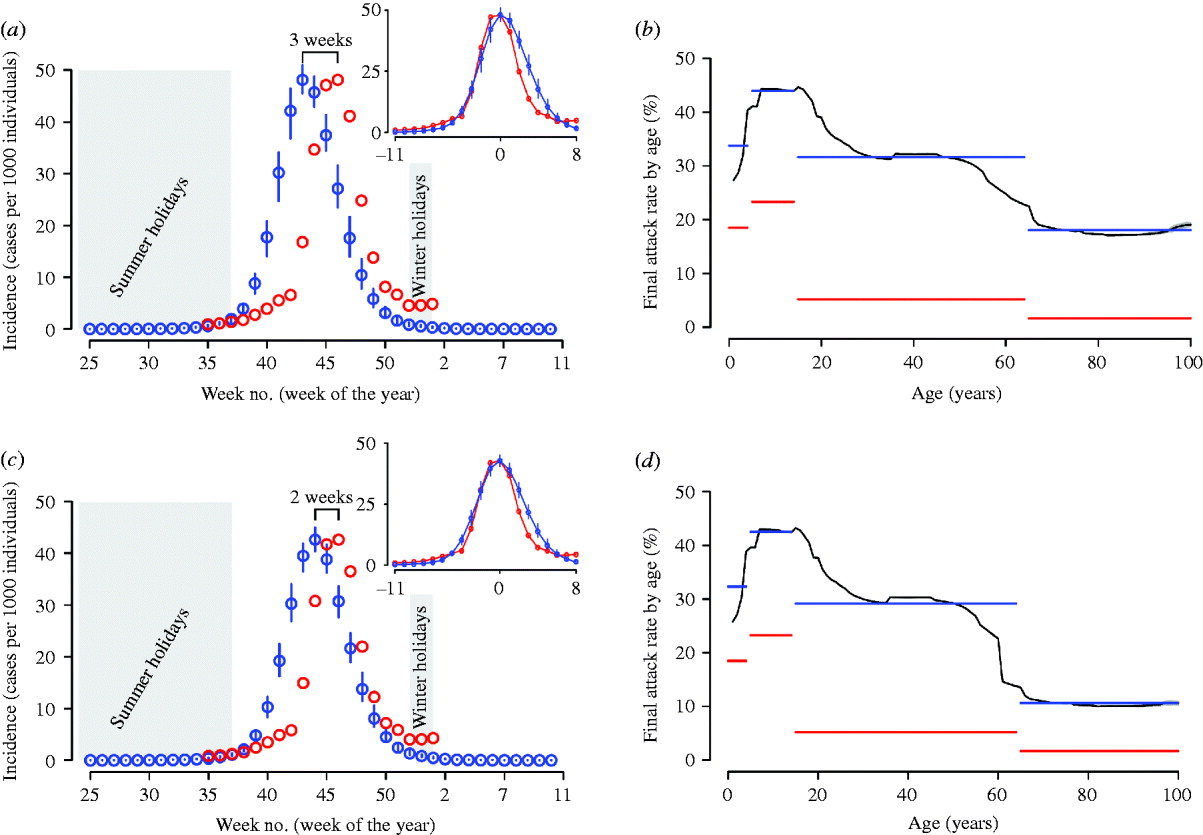
The reporting factor of the InfluNET surveillance system can vary considerably from one age group to another. Therefore, it is difficult to precisely estimate the cumulative attack rate by age group before serological data will become available. However, we can obtain an index of the impact of the pandemic in the different age groups by summing the weekly incidences as reported to the surveillance system for the four age groups considered over the period from week 35 in 2009 to week 2 in 2010. The relative differences in the simulated and the observed attack rates by age group (see Fig. 3 b) are much larger for adult and elderly individuals than for children and young individuals. It should be noted that the absolute values of simulated and observed attack rates by age group are not comparable quantities since we did not rescale the empirical data by any underreporting factor.
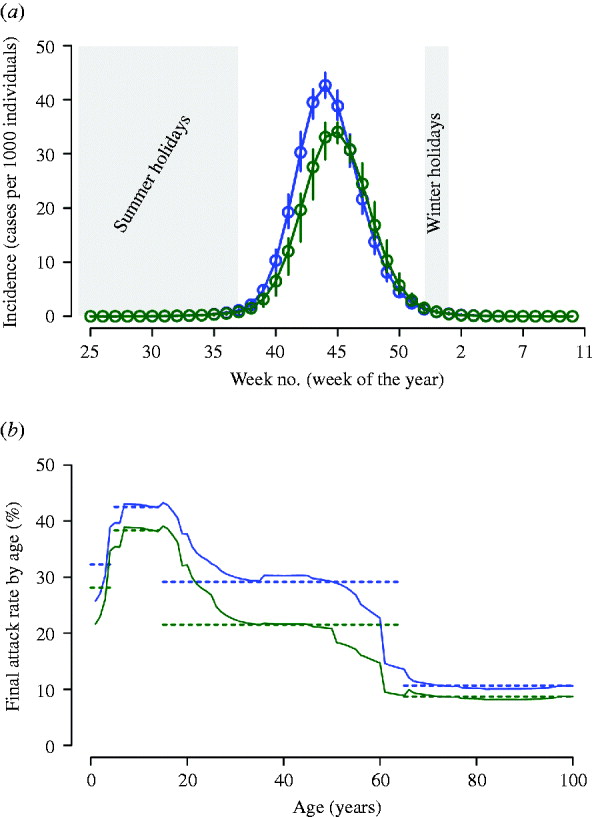
After the reference scenarios, we introduced single and combined mitigation measures, such as antiviral treatment and prophylaxis and vaccination, in the model. Results showed that even a low proportion of symptomatic cases treated with antiviral drugs could have led to a relevant reduction of the epidemic size (see Tables 2 and 3). In each considered scenario, 4100 000 antiviral courses would have been sufficient to mitigate the pandemic, a number which is well below the Italian antiviral stockpile [Reference Singer27]. We simulated the planned Italian vaccination strategy (begun on 15 October 2009; involving only essential service workers, pregnant women, and at-risk population), obtaining a limited but not negligible reduction of the attack rate with respect to the scenarios accounting only for antiviral treatment (see Tables 4 and 5). Moreover, we found that vaccination would be more effective if coupled with antiviral treatment, and that it would have no effect on delaying the epidemic peak. Scenarios with vaccination extended to other groups (results not shown) yield an extremely limited further decrease of the attack rate. Figure 4 shows the effects of considering multiple intervention strategies (i.e. antiviral prophylaxis and case isolation until 8 July 2009, antiviral treatment provided to 15% and vaccination) as well as initial natural immunity in the population (i.e. 33·3% of the population aged >59 years).
(a) The blue circles represent the average weekly incidence (cases per 1000 individuals) as in the reference scenario (antiviral prophylaxis and case isolation until 8 July 2009) accounting also for natural immunity (i.e. 33·3% of the population aged >59 years), vertical blue lines represent the 95% confidence interval (CI). Green circles: as blue circles; moreover, we assumed antiviral treatment provided to 15% of clinical cases (during the entire epidemic period) and vaccination beginning on 15 October 2009. The vertical green lines represent the 95% CI. Summer and Christmas holidays, during which schools are regularly closed, are represented by a grey background. (b) Solid lines: final attack rate by age for the two scenarios considered in panel (a). Horizontal lines represent the average value in the age groups considered in the surveillance system (i.e. 0–4, 5–14, 15–64, >65 years).
Effectiveness of vaccination-based interventions
AVP, Antiviral prophylaxis to households contacts of index cases.
Average values and 95% confidence intervals (in parentheses) are reported.
* Measured in days from 14 June 2009.
† Until 8 July 2009. Case detection fixed at 90%.
‡ Target population: essential workers and chronic patients (about 8500 000 individuals).
Effectiveness of vaccination based interventions by assuming natural immunityFootnote *
AVP, Antiviral prophylaxis to households contacts of index cases.
Average values and 95% confidence intervals (in parentheses) are reported.
* Natural immunity on 33·3% of the population aged >59 years.
† Measured in days from 14 June 2009.
‡ Until 8 July 2009. Case detection fixed at 90%.
§ Target population: essential workers and chronic patients (about 8500 000 individuals).
It is of interest to explore the impact of an earlier arrival of the vaccine on the course of the pandemic. The effect of starting vaccine distribution on 15 September 2009 is examined (results are reported in the last rows of Tables 4 and 5). Considering only antiviral prophylaxis and case isolation (until 8 July 2009) and vaccination (beginning on 15 September) we observed a moderate effect in reducing the predicted final attack rate which falls from 30·6% (95% CI 30·5–30·7) (as predicted in the reference scenario) to 28·1% (95% CI 27·1–28·5) (compare Tables 2 and 4). Even larger reductions are observed if vaccination is combined with antiviral treatment. Specifically, in the scenario accounting for the most intensive antiviral distribution (antiviral treatment administered to 30% of symptomatic cases) the predicted final attack rate is 18·3% (95% CI 18–18·7). Larger reductions of the final attack rate are obtained if initial natural immunity in the population is assumed (see Table 5).
DISCUSSION
Our results, based on the Italian 2009 A/H1N1v influenza surveillance data during the early phase of the epidemic, show that model simulations are in excellent agreement with Italian surveillance data in the early phase of the epidemic (when case isolation, antiviral treatment of index cases and antiviral prophylaxis to close contacts were implemented by the Italian regional public health authorities) and are basically consistent with InfluNET data during the course of the epidemic. In particular, the model has been useful for predicting the timing of the epidemic, while it has overestimated the impact of the 2009 A/H1N1v influenza pandemic for adults and elderly individuals. However, the misalignment is probably due to the model parameterization. Based on literature values [Reference Ciofi degli Atti3, Reference Ferguson4], which do not consider different susceptibility level of children with respect to adults as observed in the 2009 A/H1N1v influenza pandemic [Reference Cauchemez28], we assumed a similar fraction of cases in the different social contexts considered in the model (namely 1/3 in households, 1/3 in schools/work places and 1/3 in the general community) since analysis on the relative transmissibility of the virus had not yet been performed for any country. An analysis on the transmission dynamics of 2009 A/H1N1v influenza in the UK [Reference Ghani29] has shown a different pattern of transmission with 37% of transmission occurring in schools, 24% in households, 28% through travel abroad and 11% in the general community.
We estimated an underreporting factor for the InfluNET data in the range 3·3–3·7 (depending on the scenario considered). If we focus our attention on the reporting factor computed by considering the total number of cases (instead of symptomatic cases), the resulting value lies in the range 18–20·2%, which is in excellent agreement with the range estimated in Lunelli et al. [Reference Lunelli30] on previous H1N1 influenza seasons, i.e. 16·2–21·6%.
Moreover, our results have shown that vaccinating 40% of the Italian population was more than adequate to mitigate the pandemic. This is the reason why the Ministry of Health decided to stockpile a limited number of vaccines. We have also shown that starting the vaccination programme in October (or later) could have had only a limited effect on reducing the impact of the epidemic, although it may have been useful to prevent a possible second wave and to protect essential workers and at-risk patients. Finally, our results have shown that antiviral treatment would have been the most efficient strategy to reduce the impact of the influenza pandemic even with a limited antiviral stockpile.
Currently, more data are becoming available that will allow a better model calibration. In particular, serological data will definitely help in better understanding the actual impact of the epidemic, and in resolving several uncertainties. However, there are several open questions on the epidemiological and virological characteristics of the virus, which will have a crucial impact on mathematical models predictions. In particular, the presence of a partial or temporary immunity to the virus in the population is still debated [Reference Xing and Cardona20, 31, Reference Zimmer and Burke32]. Virus transmission seems to be influenced by seasonal effects like temperature or humidity [Reference Shaman and Kohn33, Reference Shaman34], but the mechanisms remain unclear. A better understanding of these issues would help in assessing, through suitable modifications of the current model, the potential for a second pandemic wave, as occurred in several countries in the flu pandemics of last century [Reference Miller35, Reference Rizzo36].
ACKNOWLEDGEMENTS
The authors thank the national investigation team based at the National Institute of Health (Istituto Superiore di Sanità), Italy (in particular Antonino Bella, Maria Cristina Rota, Silvia Declich, Stefania Salmaso) for providing their support in data collection, two anonymous reviewers for their useful comments that have certainly contributed to improve this manuscript and the European Union FP7 FluModCont project for research funding. M.A., S.M. and C.R. additionally thank the Italian Ministry of Health Epi-Int project (Grant no. 8M30) for research funding.
DECLARATION OF INTEREST
None.


