

Several studies Reference Bijl, Ravelli and van Zessen1–Reference van Os, Hanssen, Bijl and Ravelli6 have found that non-clinical psychotic symptoms (‘psychosis-like symptoms’) are relatively common in non-clinical populations and there has been considerable interest in these symptoms as a possible indicator of a psychosis continuum in adults. Poulton et al Reference Poulton, Caspi, Moffitt, Cannon, Murray and Harrington7 found that 14.1% of 12-year-old children in the Dunedin birth cohort also had psychosis-like symptoms that were associated with schizophreniform disorder later in life. However, there is still some possibility that symptoms in such young children could be due to misinterpretation of the questions used in assessments. Previous studies that rely upon self-report questionnaires for symptoms report high prevalences ranging from 6.0% to 58.9%. Reference Dhossche, Ferdinand, Van Der Ende, Hofstra and Verhulst8–Reference Yoshizumi, Murase, Honjo, Kaneko and Murajami10 Comparing self-reported answers with those obtained in a semi-structured interview would help to understand the nature of these phenomena. An association between low IQ score and the later development of schizophrenia has been established for many years. Reference Jones, Rodgers, Murray and Marmot11–Reference Reichenberg, Weiser, Rapp, Rabinowitz, Caspi, Schmeidler, Knobler, Lubin, Nahon, Harvey and Davidson16 The risk of schizophrenia increases gradually as IQ score falls, so that individuals with an average IQ score have an increased risk compared with those with the highest IQ scores. Reference David, Malmberg, Brandt, Allebeck and Lewis13,Reference Zammit, Allebeck, David, Dalman, Hemmingsson, Lundberg and Lewis14,Reference Reichenberg, Weiser, Rabinowitz, Caspi, Schmeidler, Mark, Kaplan and Davidson17 The relationship between IQ and psychosis-like symptoms in non-clinical populations is not, however, clearly established. One study Reference Johns, Cannon, Singleton, Murray, Farrell, Brugha, Bebbington, Jenkins and Meltzer18 reported an association, but another Reference Wiles, Zammit, Bebbington, Singleton, Meltzer and Lewis19 could not replicate this finding. Cannon et al Reference Cannon, Caspi, Moffitt, Harrington, Taylor, Murray and Poulton20 found that a lower IQ was associated with ‘strong’ and not ‘weak’ symptoms of psychosis at 11 years of age, but this finding was based upon relatively small numbers.
We investigated the prevalence of non-clinical psychotic symptoms in a large population-based birth cohort of 12-year-old children. We used both self-report and observer-rated semi-structured methods of assessment. We then examined the association between IQ score and symptoms. We compared verbal and performance IQ, and examined the risk of these symptoms across the whole range of IQ scores.
Methods
Sample
We examined data from the Avon Longitudinal Study of Parents and Children (ALSPAC) birth cohort (www.alspac.bris.ac.uk). Reference Golding, Pembrey and Jones21 The initial ALSPAC cohort consisted of 14 541 children born to residents of the former Avon health authority area who had an expected date of delivery between 1 April 1991 and 31 December 1992. The former County of Avon includes both urban and rural areas and the population is broadly representative of children in the UK. Reference Golding, Pembrey and Jones21 The parents have completed regular postal questionnaires about all aspects of their child's health and development since birth. From the age of 7.5 years, the children have attended annual assessment clinics where they participate in a range of face-to-face interviews and physical tests. The current study examined data obtained from 6455 children who attended the annual assessment clinic at 12.9 years of age.
Measures
The semi-structured interview (PLIKSi) instrument comprised an introductory set of questions on sleep (nightmares, night terrors and sleep walking) to accustom the child to probes for unusual experiences, and then 12 ‘core’ questions eliciting key symptoms covering the three main domains of positive psychotic symptoms: hallucinations (visual and auditory); delusions (delusions of being spied on, persecution, thoughts being read, reference, control, grandiose ability and other unspecified delusions); and bizarre symptoms (thought broadcasting, insertion and withdrawal). For these 12 core items, 7 stem questions were derived from the Diagnostic Interview Schedule for Children–IV (DISC–IV) Reference Shaffer, Fisher, Lucas, Dulcan and Schwab-Stone22 and 5 stems from sections 17–19 of the Schedules for Clinical Assessment in Neuropsychiatry version 2.0 (SCAN 2.0), 23 modified slightly after piloting. The coding of all items followed the glossary definitions, assessment and rating rules set out for SCAN.
The children's IQ was measured by the Weschler Intelligence Scale for Children (3rd UK edition (WISC–III)) Reference Wechsler, Golombok and Rust24 at 8 years of age. A shortened version of the test was applied by trained psychologists, whereby only alternate items were used for all subtests with the exception of the coding subtest which was administered in its standard form.
We used data from a range of measures in the ALSPAC data-set to assess confounding, as summarised in the online Table DS1. Also, at 8 years, trained psychologists assessed the children's bullying involvement as either victim or perpetrator for overt and relational bullying using a modified version of the Bullying and Friendship Interview Schedule. Reference Wolke, Woods, Bloomfield and Karstadt25
Ethical approval
Ethical approval was obtained from ALSPAC's Law and Ethics Committee. Informed consent was obtained from the parents of the children after explanation of the nature of the study. The research adheres to the tenets of the Declaration of Helsinki.
If the children's responses raised any concerns for the interviewer, ALSPAC's child protection procedures were adhered to, with a report on the interview being immediately sent to senior study staff and appropriate agencies contacted if necessary.
Procedure
The PLIKSi assessment was designed to last 20 min. First, the child's self-report of experiencing each symptom was recorded. The interviewer read out a stem question from the interview schedule and then presented a card with ‘yes’, ‘no’ or ‘maybe’ responses. If the child asked for more information, the interviewer could only repeat the exact question owing to the structured nature of this part of the interview.
If the child answered ‘yes’ or ‘maybe’ to the stem question, the reply was then cross-examined, in semi-structured format, using supplementary probes from the modified DISC–IV items and SCAN 2.0, in order to gain an observer-based rating of the symptom being experienced. The symptom frequency in the previous 6 months was also recorded. This allowed us to generate three outcomes of decreasing prevalence: (a) ‘suspected or definite’; (b) ‘definite only’; and (c) ‘definite without attributions and occurring monthly or more’. The attribution questions (e.g. ‘did these experiences only happen when you were ill with a high temperature?’) were asked to ascertain whether positive symptoms were experienced when the child was in hypnogogic and hypnopompic states, had a fever, had been drinking alcohol or using street drugs.
Training and reliability
The 13 interviewers were psychology graduates who were trained by experienced clinicians and SCAN trainers, C.H. (child psychiatrist) and G.H. (general psychiatrist). The interviewers were required to reach 95% agreement when scoring two gold-standard interview videotapes prepared by C.H. and G.H. Regular quarterly booster training sessions were held along with monthly workshops to discuss the scoring of complex cases and consolidate training.
Interrater reliability checks were carried out at 5, 10 and 15 months. Each interviewer audio-recorded all interviews until they had eight interviews containing several items rated positive or suspected. A second interviewer rated these tapes independently. Test–retest reliability was examined for 3% of the cohort, who were invited back for a second interview within 2 weeks of the initial interview.
Statistics
The sample that attended the PLIKSi was compared with the rest of the cohort. To assess and adjust for potential bias in the sample that attended the clinic, a logistic model was derived using gender, social class, maternal education and ethnicity. Predicted values from this model were then used to weight a second model. The weighted regression model was used to calculate the adjusted prevalence of psychosis-like symptoms because of underrepresentation of some social factors. For these analyses, parental social class 26 was dichotomised into manual v. non-manual occupations, as were maternal education, and ethnic origin Reference Osborn, Butler and Morris27 using the UK 1991 census format. Reference Dale and Marsh28 Frequencies for symptom values were calculated with confidence intervals and differences in proportions according to social class, ethnicity and gender.
In order to compare the child's self-report responses with the PLIKSi observer ratings, we calculated positive predictive values for each item.
For IQ, logistic regression was used to estimate odds ratios and 95% confidence intervals for the symptom outcomes. Significance testing was carried out using likelihood ratio tests. In order to investigate non-linear relationships, a quadratic term was used in addition to a linear term. IQ score was divided by 10 in order to produce odds ratios for a 10-point increase in IQ. The quadratic term was the square of the IQ score after division by 10. We adjusted first for factors that were present at birth or in early life and could not themselves have resulted from IQ: social class, housing tenure, gender, birth weight, family composition, maternal education, urban/rural residence and family history of psychiatric disorder. We adjusted additionally for Strengths and Difficulties Questionnaire (SDQ) Reference Goodman29 total score at age 8 years and bullying (both overt and relational). The proportional odds ordered logistic model was applied using Stata version 9.0 for Windows in order to simultaneously model three symptom outcomes.
We used the multiple imputation chained equation method Reference van Buuren, Boshuizen and Knook30 to generate a data-set for the 6751 children with IQ data, including all outcome and confounding variables.
Results
Response rate
The ALSPAC birth cohort consists of 14 541 pregnancies that resulted in 14 062 live births: 13 988 infants were still alive at 1 year. A total of 6455 (45.9%) children completed the PLIKSi, mean age 12.9 years (range 11.4–14.3). We compared participating children with the rest of the ALSPAC cohort on a number of variables: 49.3% of those completing the PLIKSi were male compared with 53.8% for the rest of the cohort (P<0.001, 95% CI −6.2 to −2.8); 43% of those who completed had a parental social class of manual v. 55.3% (P<0.001, 95% CI −14.1 to −10.5); 21.4% had a maternal education of below O-level (basic qualification obtained after 12 years of education) v. 38.6% (P<0.001, 95% CI −18.8 to −15.6); and 95.8% were White v. 93.1% (P<0.001, 95% CI 1.9–3.5).
Reliability studies
In the reliability studies, according to the standard benchmarks of Landis & Koch, Reference Landis and Koch31 the average interrater reliability was ‘very good’ (kappa=0.72) and for the majority (75%) of individual items the kappa was above 0.6. The overall kappa value slightly improved across the three time points used to measure maintenance of reliability through the study. For the test–retest study, 163 children completed a second interview producing a test–retest kappa of 0.48, suggesting ‘fair’ agreement. This finding was consistent with findings for test–retest analyses using other semi-structured interviews such as the Present State Examination – 9th edition (PSE–9). Reference Wing, Cooper and Sartorious32 In this selected group the prevalence of children displaying a psychosis-like symptom at the first visit was 13.6% falling to 8.4% at the second visit.
Frequency of psychosis-like symptoms
Overall, 38.9% (95% CI 37.5–40.1) of children self-reported experiencing one or more of the 12 symptoms (responding ‘yes’ or ‘maybe’) in the previous 6 months (Table 1). A total of 18.2% self-reported experiencing two or more symptoms and 9.3% reported experiencing three or more symptoms.
Number of children reporting psychosis-like symptoms: comparisons between self-report and observer-rated assessments (N=6435–6455)
| Self-report stem questionsa | Observer rateda | Frequency,b suspected or definitely presenta | Positive predictive valuesa,c | |||||
|---|---|---|---|---|---|---|---|---|
| Item | Yes | Maybe | Total | Suspected | Definite | Total | ||
| Hallucinations, n (%) | ||||||||
| Auditory | 489 (7.6) | 155 (2.4) | 644 (10.0) | 227 (3.5) | 243 (3.8) | 470 (7.3) | 84 (18.8) | 70.6 (67.1-74.2) |
| Visual | 393 (6.1) | 111 (1.7) | 504 (7.8) | 152 (2.4) | 105 (1.6) | 257 (4.0) | 31 (12.9) | 50 (45.6-54.4) |
| Delusions, n (%) | ||||||||
| Being spied on | 1054 (16.3) | 150 (2.3) | 1204 (18.7) | 142 (2.2) | 52 (0.8) | 194 (3.0) | 51 (28.3) | 16.1 (14.1-18.2) |
| Persecution | 509 (7.9) | 114 (1.8) | 623 (9.7) | 16 (0.2) | 1 (0.0) | 17 (0.3) | 7 (46.7) | 2.7 (1.5-4.0) |
| Thoughts being read | 424 (6.6) | 176 (2.7) | 600 (9.3) | 37 (0.6) | 3 (0.0) | 40 (0.6) | 11 (28.2) | 6.0 (4.1-7.9) |
| Reference | 115 (1.8) | 71 (1.1) | 186 (2.9) | 32 (0.5) | 16 (0.2) | 48 (0.7) | 8 (19.5) | 25.2 (19.0-31.5) |
| Control | 102 (1.6) | 38 (0.6) | 140 (2.2) | 33 (0.5) | 11 (0.2) | 44 (0.7) | 12 (28.6) | 31.4 (23.7-39.1) |
| Grandiose ability | 167 (2.6) | 81 (1.3) | 248 (3.8) | 57 (0.9) | 15 (0.2) | 72 (1.1) | 22 (35.5) | 28.2 (22.6-33.8) |
| Other unspecified | 14 (0.2) | 7 (0.1) | 21 (0.3) | 8 (47.1) | ||||
| Thought, n (%) | ||||||||
| Broadcasting | 213 (3.3) | 90 (1.4) | 303 (4.7) | 65 (1.0) | 20 (0.3) | 85 (1.3) | 21 (26.9) | 28.1 (23.1-33.2) |
| Insertion | 246 (3.8) | 89 (1.4) | 335 (5.2) | 71 (1.1) | 18 (0.3) | 89 (1.4) | 15 (18.8) | 26.6 (21.9-31.4) |
| Withdrawal | 80 (1.2) | 37 (0.6) | 117 (1.8) | 15 (0.2) | 8 (0.1) | 23 (0.4) | 4 (19.0) | 19.8 (12.6-27.1) |
| Overall, n (%) (95% CI) | 2083 (32.3) (31.2-33.5) | 839 (13.0) (12.0-13.7) | 2509 (38.9) (37.7-40.1) | 646 (10.0) (9.3-10.8) | 364 (5.6) (5.1-6.2) | 881 (13.7) (12.8-14.5) | 34.6 (32.7-36.4) | |
| Overall, complete,d unadjusted % (95% CI) | 32.1 (30.9-33.3) | 12.8 (12.0-13.7) | 38.7 (37.5-40.0) | 9.9 (9.2-10.7) | 5.50 (5.0-6.1) | 13.5 (12.6-14.3) | ||
| Overall, weighted,e % (95% CI) | 32.5 (32.1-33.7) | 12.8 (11.9-13.7) | 39.0 (37.7-40.3) | 10.1 (9.3-10.8) | 5.8 (5.1-6.4) | 13.8 (12.8-14.7) | ||
Following the PLIKSi, the observer-rated assessments scored 13.7% (n=881, 95% CI 12.8–14.5) of children as experiencing one or more of the 12 symptoms (suspected or definite: ‘broad psychosis-like symptoms’) in the previous 6 months (Table 1). After taking account of non-response, this prevalence estimate rose to 13.8% (Table 1). Of these, 9.3% were rated with only one symptom, 2.6% rated with two or more symptoms and 1.8% had three or more symptoms. For ‘definite only’ symptoms (‘narrow psychosis-like symptoms’), 5.6% (n=364, 95% CI 5.1–6.2) of the cohort were rated positive. Finally, 2.6% (n=165, 95% CI 2.2–3.0) were rated positive for ‘definite symptoms without attributions occurring monthly or more frequently’ (‘frequent psychosis-like symptoms’).
The value of the 12 self-reported questions as screening questions was further investigated by comparing replies with the final observer rating (suspected or definite present). The positive predictive values for the questionnaire responses compared with the ratings from the clinical interviews were poor for all items except auditory hallucinations (Table 1). Of those giving positive replies to the self-report question ‘since your 12th birthday have you ever heard voices that other people can't hear?’, after clinical cross-examination 70% were judged by interviewers to be truly experiencing this symptom. It was not possible to calculate sensitivity/specificity values because we could not, within the limits of the allocated interview time, assess further those children that replied negatively in order to investigate potential false negatives.
There were no significant differences in symptom-positive children in terms of gender or ethnicity but the prevalence of symptoms was higher for those of lower social class, with 15.2% (n=389, 95% CI 13.8–16.6) for manual compared with 12.1% (n=410, 95% CI 11.0–13.2) for non-manual (P=0.001), and in those with lower maternal educational attainment, with 15.3% (n=203, 95% CI 13.4–17.2) below O-level, 14.3% (n=314, 95% CI 12.8–15.8) at O-level and 12.2% (n=330, 95% CI 11.0–13.5) above O-level (P trend=0.005).
Table 2 shows the main attributions ascribed for definite ratings on PLIKSi. Being in a hypnogogic or hypnopompic state was the most common self-attribution, with the highest attribution rate (22.2%) recorded for visual hallucinations.
Number of children receiving a ‘definite’ observer rating for the four categories of symptoms and associated attributionsa
| Definite, n (%) | Definite and no attribution, n (%) | Definite with attribution, n (%) | |||
|---|---|---|---|---|---|
| Item | Hypnogogic/pompic | High temperature | Any attribution | ||
| Auditory hallucinations | 243 (3.8) | 189 (2.9) | 49 (20.2) | 10 (4.1) | 54 (22.2) |
| Visual hallucinations | 105 (1.6) | 81 (1.3) | 20 (19.0) | 5 (4.8) | 24 (22.9) |
| Delusions | 90 (1.4) | 85 (1.3) | 3 (3.3) | 2 (2.2) | 5 (5.6) |
| Bizarre delusions | 39 (0.6) | 37 (0.6) | 1 (2.6) | 1 (2.6) | 2 (5.1) |
In the DSM–IV, 33 only one of certain ‘core’ symptoms needs to be established to satisfy criteria A for schizophrenia. They must occur in the context of a clear sensorium and exclude those that occur while falling asleep or waking up. In our cohort, the prevalence of third-person hallucinations without attributions (that is, excluding hypnogogic and similar experiences) was 1.1% (n=73, 95% CI 0.9–1.4). The prevalence of ‘bizarre’ symptoms (thought withdrawal, insertion, broadcast) and/or delusions of control (without attributions) was 2.83% (n=182, 95% CI 2.4–3.2). Overall, the proportion of children with one or more of these ‘core’ symptoms of schizophrenia was n=233 (3.62%, 95% CI 3.2–4.1) suspected or definite; n=89 (1.38%, 95% CI 1.10–1.70); definite and n=45 (0.7% 95% CI 0.5–0.9) with symptoms at a frequency of monthly or more.
IQ score and psychosis-like symptoms
At the age of 8 years, data on IQ was available for 6751 children. The mean total IQ for this sample was 104.2 (s.d.=16.4). The mean verbal score IQ was 107 (s.d.=16.8) and performance score IQ was 99.7 (s.d.=17.0). Lower IQ score was more frequent in children with low birth weight, whose mothers were of manual social class and had less education, and who lived in renting households in single-parent families (online Table DS1). Low IQ was also more common in children who were victims of bullying and whose mothers reported higher SDQ scores (online Table DS1).
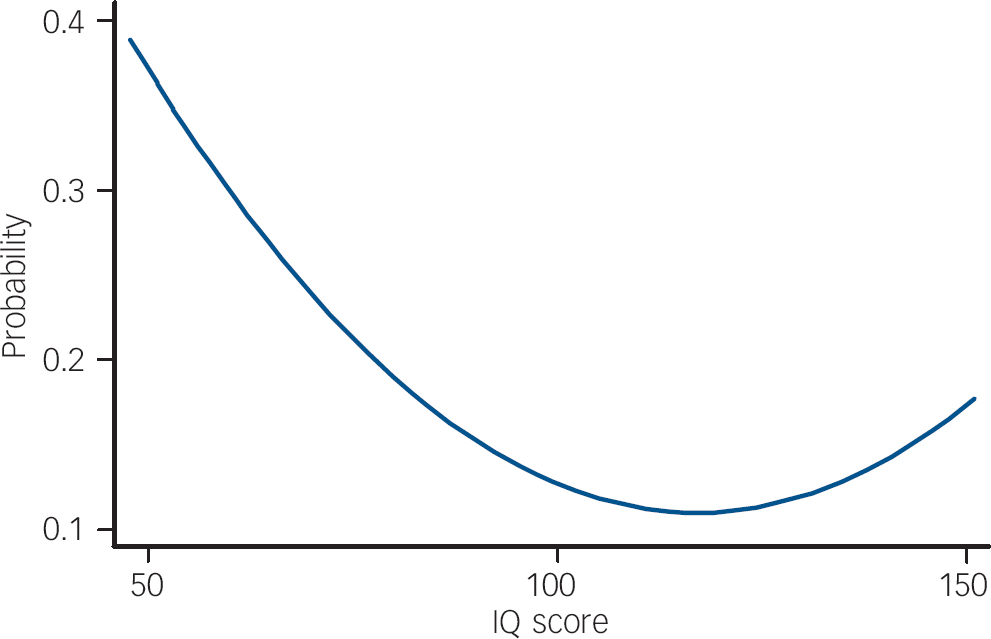
As a primary analysis, we examined all children who reported ‘suspected’ or ‘definite present’ symptoms on the PLIKSi (or broad psychosis-like symptoms). There was a non-linear relationship between IQ score and broad psychosis-like symptoms (Table 3). In the crude or unadjusted analyses, the increase in prevalence was most marked in those with lower IQ scores. This pattern of results remained after adjustment. In Table 3, this non-linearity is illustrated first by giving results by IQ score in five categories. The first adjustment had a relatively modest influence on the results. The relationship between IQ and symptoms was still statistically significant in the fully adjusted model (χ2=7.43, d.f.=2, P=0.02). Figure 1 illustrates a ‘reverse’ J-shaped relationship with most risk associated with low IQ but some increase in risk for those of high IQ, though this was only apparent after adjustment.
Odds ratios for psychosis-like symptoms (suspected and definite) according to IQ total score quintiles before and after adjustmenta
| IQ score | n (%) | OR (95% CI) | Adjusted ORb | Adjusted ORc |
|---|---|---|---|---|
| <79 | 297 (20.2) | 1.72 (1.26-2.34) | 1.62 (1.10-2.39) | 1.55 (1.00-2.39) |
| 80-89 | 564 (16.7) | 1.36 (1.05-1.75) | 1.62 (1.21-2.18) | 1.38 (0.98-1.94) |
| 90-109 | 2350 (12.9) | 1.0 | 1.0 | 1.0 |
| 110-119 | 1081 (11.5) | 0.88 (0.70-1.10) | 0.99 (0.77-1.28) | 1.03 (0.78-1.37) |
| ≥120 | 1036 (11.5) | 0.88 (0.70-1.10) | 1.05 (0.81-1.37) | 1.20 (0.90-1.59) |
| Total n | 5328 (100) | 5328 | 4042 | 3449 |
We also examined whether verbal or performance IQ was more strongly associated with psychosis-like symptoms. There was a correlation of 0.50 between verbal and performance IQ scores. There was an association between verbal IQ and PLIKS even after adjustment for performance IQ scores (verbal IQ score linear term=0.60, 95% CI 0.38–0.95; verbal IQ2=1.02, 95% CI 1.00–1.04) but no association between symptoms and performance IQ score after adjustment for verbal IQ (performance IQ=0.86, 95% CI 0.55–1.34; performance IQ2=1.01, 95% CI 0.98–1.03).
IQ and different symptom outcomes
The pattern of results for narrow psychosis-like symptoms (n=364) and frequent psychosis-like symptoms (n=165) was similar, but many of the results, particularly after the second adjustment, were not statistically significant. We also used an ordered proportional odds approach that enabled us to study all three outcomes simultaneously. We found results very similar to those reported in Table 4: the IQ score linear term after the first adjustment was 0.40 (95% CI 0.22–0.72) and IQ2 and the quadratic term was 1.04 (95% CI 1.01–1.07). The equivalent results after the second adjustment were 0.45 (95% CI 0.25–0.81) and 1.04 (95% CI 1.01–1.07).
Odds ratios for psychosis-like symptoms (suspected and definite) as linear and quadratic terms before and after adjustmenta
| OR (95% CI) | Adjusted ORb | Adjusted ORc | |
|---|---|---|---|
| Linear and quadratic (n=3449) | |||
| IQ total score | 0.37 (0.21-0.68) | 0.39 (0.21-0.71) | 0.44 (0.24-0.80) |
| Quadratic term (IQ2) | 1.04 (1.01-1.07) | 1.04 (1.01-1.07) | 1.04 (1.01-1.07) |
| Imputed dataset (n=6751) | |||
| IQ total score | 0.49 (0.33-0.74) | 0.49 (0.33-0.74) | 0.56 (0.37-0.85) |
| Quadratic term (IQ2) | 1.03 (1.01-1.05) | 1.03 (1.01-1.05) | 1.03 (1.01-1.05) |
Missing data
We investigated the possibility that attrition in the cohort might have contributed to the observed associations using imputation methods. Reference van Buuren, Boshuizen and Knook30,Reference Royston34 The results in Table 3 show that the same pattern of results was present and remained after our two adjustments. We compared unadjusted results in the 5328 children with complete data for IQ and symptoms with the 3449 children that also had data on all confounders. The association appeared to be stronger in the smaller data-set, whereas unadjusted results for the imputed data were closer to those for the 5328 children. This suggested that the attrition might have exaggerated the relationship between symptoms and IQ score.
Discussion
Prevalence of psychosis-like symptoms in childhood and early adolescence
Psychotic illness defined in terms of those disorders that present to psychiatric services is rare in 12-year-old children. In contrast, our findings suggest that individual psychotic symptoms are relatively common, although our estimates differ depending upon the method of measurement. Nearly 40% of children self-reported one or more psychotic symptoms in response to questions about 12 psychotic items, but this fell to 13.7% when the same children were assessed using a semi-structured clinical cross-examination. Across all items, positive predictive values for self-reported questions were poor except for auditory hallucinations. These findings lead to two conclusions. First, self-report questionnaires are inadequate tools to investigate psychosis-like symptoms in general population studies because they are likely to substantially overestimate the prevalence of these phenomena. Second, when rigorous assessments based on observer-rated clinical assessments are used, a substantial proportion of children (13.7%) are still found to report experiences that might be psychotic and 3% meet the strict phenomenological criteria for individual psychotic symptoms used in adult assessments of psychotic illness.
The 6-month period prevalence of 13.7% reported in these 12-year-olds is similar to reports from some adult surveys Reference van Os, Hanssen, Bijl and Ravelli6,Reference Poulton, Caspi, Moffitt, Cannon, Murray and Harrington7 and remarkably close to the 14.1% prevalence reported from the Dunedin birth cohort. Reference Poulton, Caspi, Moffitt, Cannon, Murray and Harrington7 Significant minorities of children (e.g. 1.3% for auditory hallucinations) reported that these experiences occurred at least weekly and, although around a quarter occurred in the setting of drowsiness or high temperature, in the vast majority of cases no such attributions were reported. These experiences were more common among those from lower socioeconomic backgrounds but there were no differences according to gender, a finding consistent with previous studies. Reference Dhossche, Ferdinand, Van Der Ende, Hofstra and Verhulst8,Reference Yoshizumi, Murase, Honjo, Kaneko and Murajami10
Relationship between IQ and symptoms
We found a non-linear relationship between IQ score and symptoms. The verbal IQ score was more important than the performance scale in this association. The relationship with low IQ score was only present for those with a less than average IQ score. After adjustment, there was also a reverse J-shaped relationship with IQ score. The relationship with IQ score was similar in pattern whether the broad, narrow or frequent definitions of psychosis-like symptoms was used. Adjusting for behaviour scores and bullying at 8 years reduced the observed association and it is possible that these factors are on the causal pathway between IQ score and symptoms. The association between IQ score and symptoms was probably not a result of confounding.
The association between low IQ and adult schizophrenia observed in previous studies may be understood as an expression of accumulating neurodevelopmental impairment on the pathway to psychosis. Alternatively, low IQ may simply be a non-specific risk factor for psychosis and other mental disorders. We found that the pattern of association between IQ score and symptoms differs from the results observed with schizophrenia in several important respects. In schizophrenia, most studies report Reference David, Malmberg, Brandt, Allebeck and Lewis13,Reference Zammit, Allebeck, David, Dalman, Hemmingsson, Lundberg and Lewis14,Reference Reichenberg, Weiser, Caspi, Knobler, Lubin, Harvey, Rabinowitz and Davidson35 a broadly linear relationship with IQ, such that people with average IQ scores have an increased risk compared with those with high IQ scores. In other words, risk of schizophrenia is spread over the whole of the IQ spectrum. In contrast, the increased risk of symptoms associated with IQ score occurs with below average IQ and to a lesser extent with high IQ. Further, most previous studies Reference Gunnell, Harrison, Rasmussen, Fouskakis and Tynelius12,Reference Zammit, Allebeck, David, Dalman, Hemmingsson, Lundberg and Lewis14,Reference Done, Sacker and Crow15,Reference Reichenberg, Weiser, Rabinowitz, Caspi, Schmeidler, Mark, Kaplan and Davidson17 report global cognitive decline as an antecedent feature of schizophrenia. Population-based studies that have examined sub-domains of premorbid IQ in later-onset schizophrenia and also adjusted for intercorrelations between subtests Reference David, Malmberg, Brandt, Allebeck and Lewis13,Reference Zammit, Allebeck, David, Dalman, Hemmingsson, Lundberg and Lewis14,Reference Reichenberg, Weiser, Caspi, Knobler, Lubin, Harvey, Rabinowitz and Davidson35,Reference Cannon, Bearden, Hollister, Rosso, Sanchez and Hadley36 have, with the exception of David et al, Reference David, Malmberg, Brandt, Allebeck and Lewis13 found impairment of both verbal and non-verbal IQ. In addition, Reichenberg et al Reference Reichenberg, Weiser, Caspi, Knobler, Lubin, Harvey, Rabinowitz and Davidson35 found that only poorer non-verbal reasoning conferred a significantly increased risk for schizophrenia-spectrum disorders after taking into account general intellectual ability. In contrast, our findings suggest that the association with psychosis-like symptoms may be stronger for verbal components of IQ.
Limitations
It is acknowledged that there was substantial attrition in ALSPAC and likely selection biases in the sample of participants (49.3%) that completed the PLIKSi. In particular, lower social classes and ethnic minorities were underrepresented in this sample. However, we attempted to adjust for this by producing weighted prevalences and by reporting analysis after imputing data. These further analyses suggest that the attrition, though it might be exaggerating the results with IQ, is unlikely to be the entire explanation for our results. With regard to the value of the stem questions vis-à-vis clinical cross-questioning, we were able to establish the positive predictive value for each item, but unfortunately the logistics of the available clinic time did not allow us to assess negative replies further to investigate the proportion of potentially false negatives. The interviewers did, however, return to an item if later answers indicated that the individual may wish to revise their response and they were trained to continue with further probes if the negative respondents appeared hesitant or unsure. Finally, our attrition was similar to that found in the Dunedin birth cohort, which assessed 82–97% of a baseline cohort of 1037 children from a total number assessed at birth of 1661.
Predicted probability of psychosis-like symptoms according to IQ scorea (fully adjusted model).
Strengths
Our findings are based upon a considerably larger (n=6455) sample of children than any other child or adolescent assessment to date. The PLIKSi was derived from widely used assessment tools for psychotic symptoms, and interviewers were carefully trained. Interrater reliability was very good and was maintained across the study period. Although the test–retest reliability data showed only fair agreement, there are several plausible explanations for this, not least learning effects: we believe that the knowledge that a simple ‘no’ would bring the interview to a much faster conclusion was important in some children who were sensitive to the respondent burden of several hours of different interviews and assessments. In addition, attenuation of data from initial to subsequent interviews is a well-known phenomenon for many psychometric assessments Reference Achenbach, Rescorla, Cichetti and Cohen37 and, as we have noted, our data are in line with test–retest findings from earlier work in the UK with the PSE. Reference Wing, Cooper and Sartorious32 We acknowledge, however, that the PSE–9 was not validated in children and adolescents in this respect.
We have considered the possibility that children with lower IQ scores may simply be more likely to misunderstand the questions about psychotic phenomena or interpret them in unintended ways. However, we think this is unlikely given the quality of the training for interviewers and the ability of the interviewers to cross-examine the participants.
In conclusion, we found that psychotic symptoms, similar in nature to those observed in psychotic illness, were commonly reported in our sample of 12-year-old children. In addition, we found a non-linear relationship with IQ score, a pattern not observed when premorbid IQ score has been studied in relation to later schizophrenia. Thus, the relationship between individual psychotic symptoms reported in 12-year-olds and those seen in later psychotic illness remains far from clear. Our results suggest that psychotic phenomena in children, though similar in nature to those in adults, might involve different causal pathways from those of the clinically psychotic disorders of adulthood.
Acknowledgements
We are extremely grateful to all the families who took part in this study, the midwives for their help in recruiting them, and the entire ALSPAC team. All authors report no competing interests. All the authors had full access to all of the data in the study and take responsibility for the integrity of the data and the accuracy of the data analysis. The UK Medical Research Council, the Wellcome Trust and the University of Bristol provide core support for ALSPAC. The Wellcome Trust funded this research. This publication is the work of the authors, who will serve as guarantors for the contents of this paper. Grant no. 072043.


 Open access
eLetters
No eLetters have been published for this article.