


Introduction
Around 37,000 years ago humans transitioned from marking abstract images such as handprints, dots and rectangles on cave walls to drawing, painting and engraving figurative art. These images, whether created on rock surfaces in the open air, in caves, or carved and engraved onto portable materials, were almost exclusively of animals, mainly herbivorous prey critical to survival in the Pleistocene Eurasian steppes. In most cases it is easy to identify the species depicted, and often the characteristics they exhibit at particular times of year. In Lascaux around 21,500 years ago, body shapes and pelage details were used to convey information about the sequence of rutting of several prey species on the cave's walls, in what was essentially an ethological calendar (Aujoulat Reference Aujoulat2005), and elsewhere, indicators such as the presence of antlers and aggressive confrontations are widespread indicators that seasonality, particularly that relating to creation, was a major characteristic of the earliest figurative art, as one might expect for hunter-gatherers.
Alongside these images, sets of abstract marks, particularly sequences of vertical lines and dots, <Y> shapes and various other marks are common throughout the European Upper Palaeolithic, occurring either alone or adjacent to and superimposed upon animal depictions, as has long been recognized (e.g. Hayden Reference Hayden2021; Leroi-Gourhan Reference Leroi-Gourhan1966; Reference Leroi-Gourhan, Leroi-Gourhan and Allain1979). These may occur on rock walls, but were commonly engraved onto robust bones since at least the beginning of the European Upper Palaeolithic and African Late Stone Age, where it is obvious they served as artificial memory systems (AMS) or external memory systems (EMS) to coin the terms used in Palaeolithic archaeology and cognitive science respectively, exosomatic devices in which number sense is clearly evident (for definitions see d’Errico Reference d'Errico1989; Reference d'Errico1995a,Reference d'Erricob; d'Errico & Cacho Reference d'Errico and Cacho1994; d'Errico et al. Reference d'Errico, Doyon and Colage2017; Hayden Reference Hayden2021). While the nature of accumulation of these is well known, and it is uncontroversial to assume that they mark information such as the passing of time and events within it, their specific meaning has remained elusive.
Our interest is with those non-figurative signs of the European Upper Palaeolithic associated with animal depictions, a relationship found with ~66 per cent of figurative images, according to Sauvet (Reference Sauvet1987). A variety of signs are associated with animal depictions, because of which it is sensible to assume that they had several meanings (Crellin Reference Crellin2020). This should be unsurprising, given that hunter-gatherers world-wide have used a wide range of recording, counting and communications systems involving subjects and numbers (e.g. de Smedt & de Cruz Reference de Smedt and de Cruz2011; Overmann Reference Overmann2013; Thornton Reference Thornton2003).
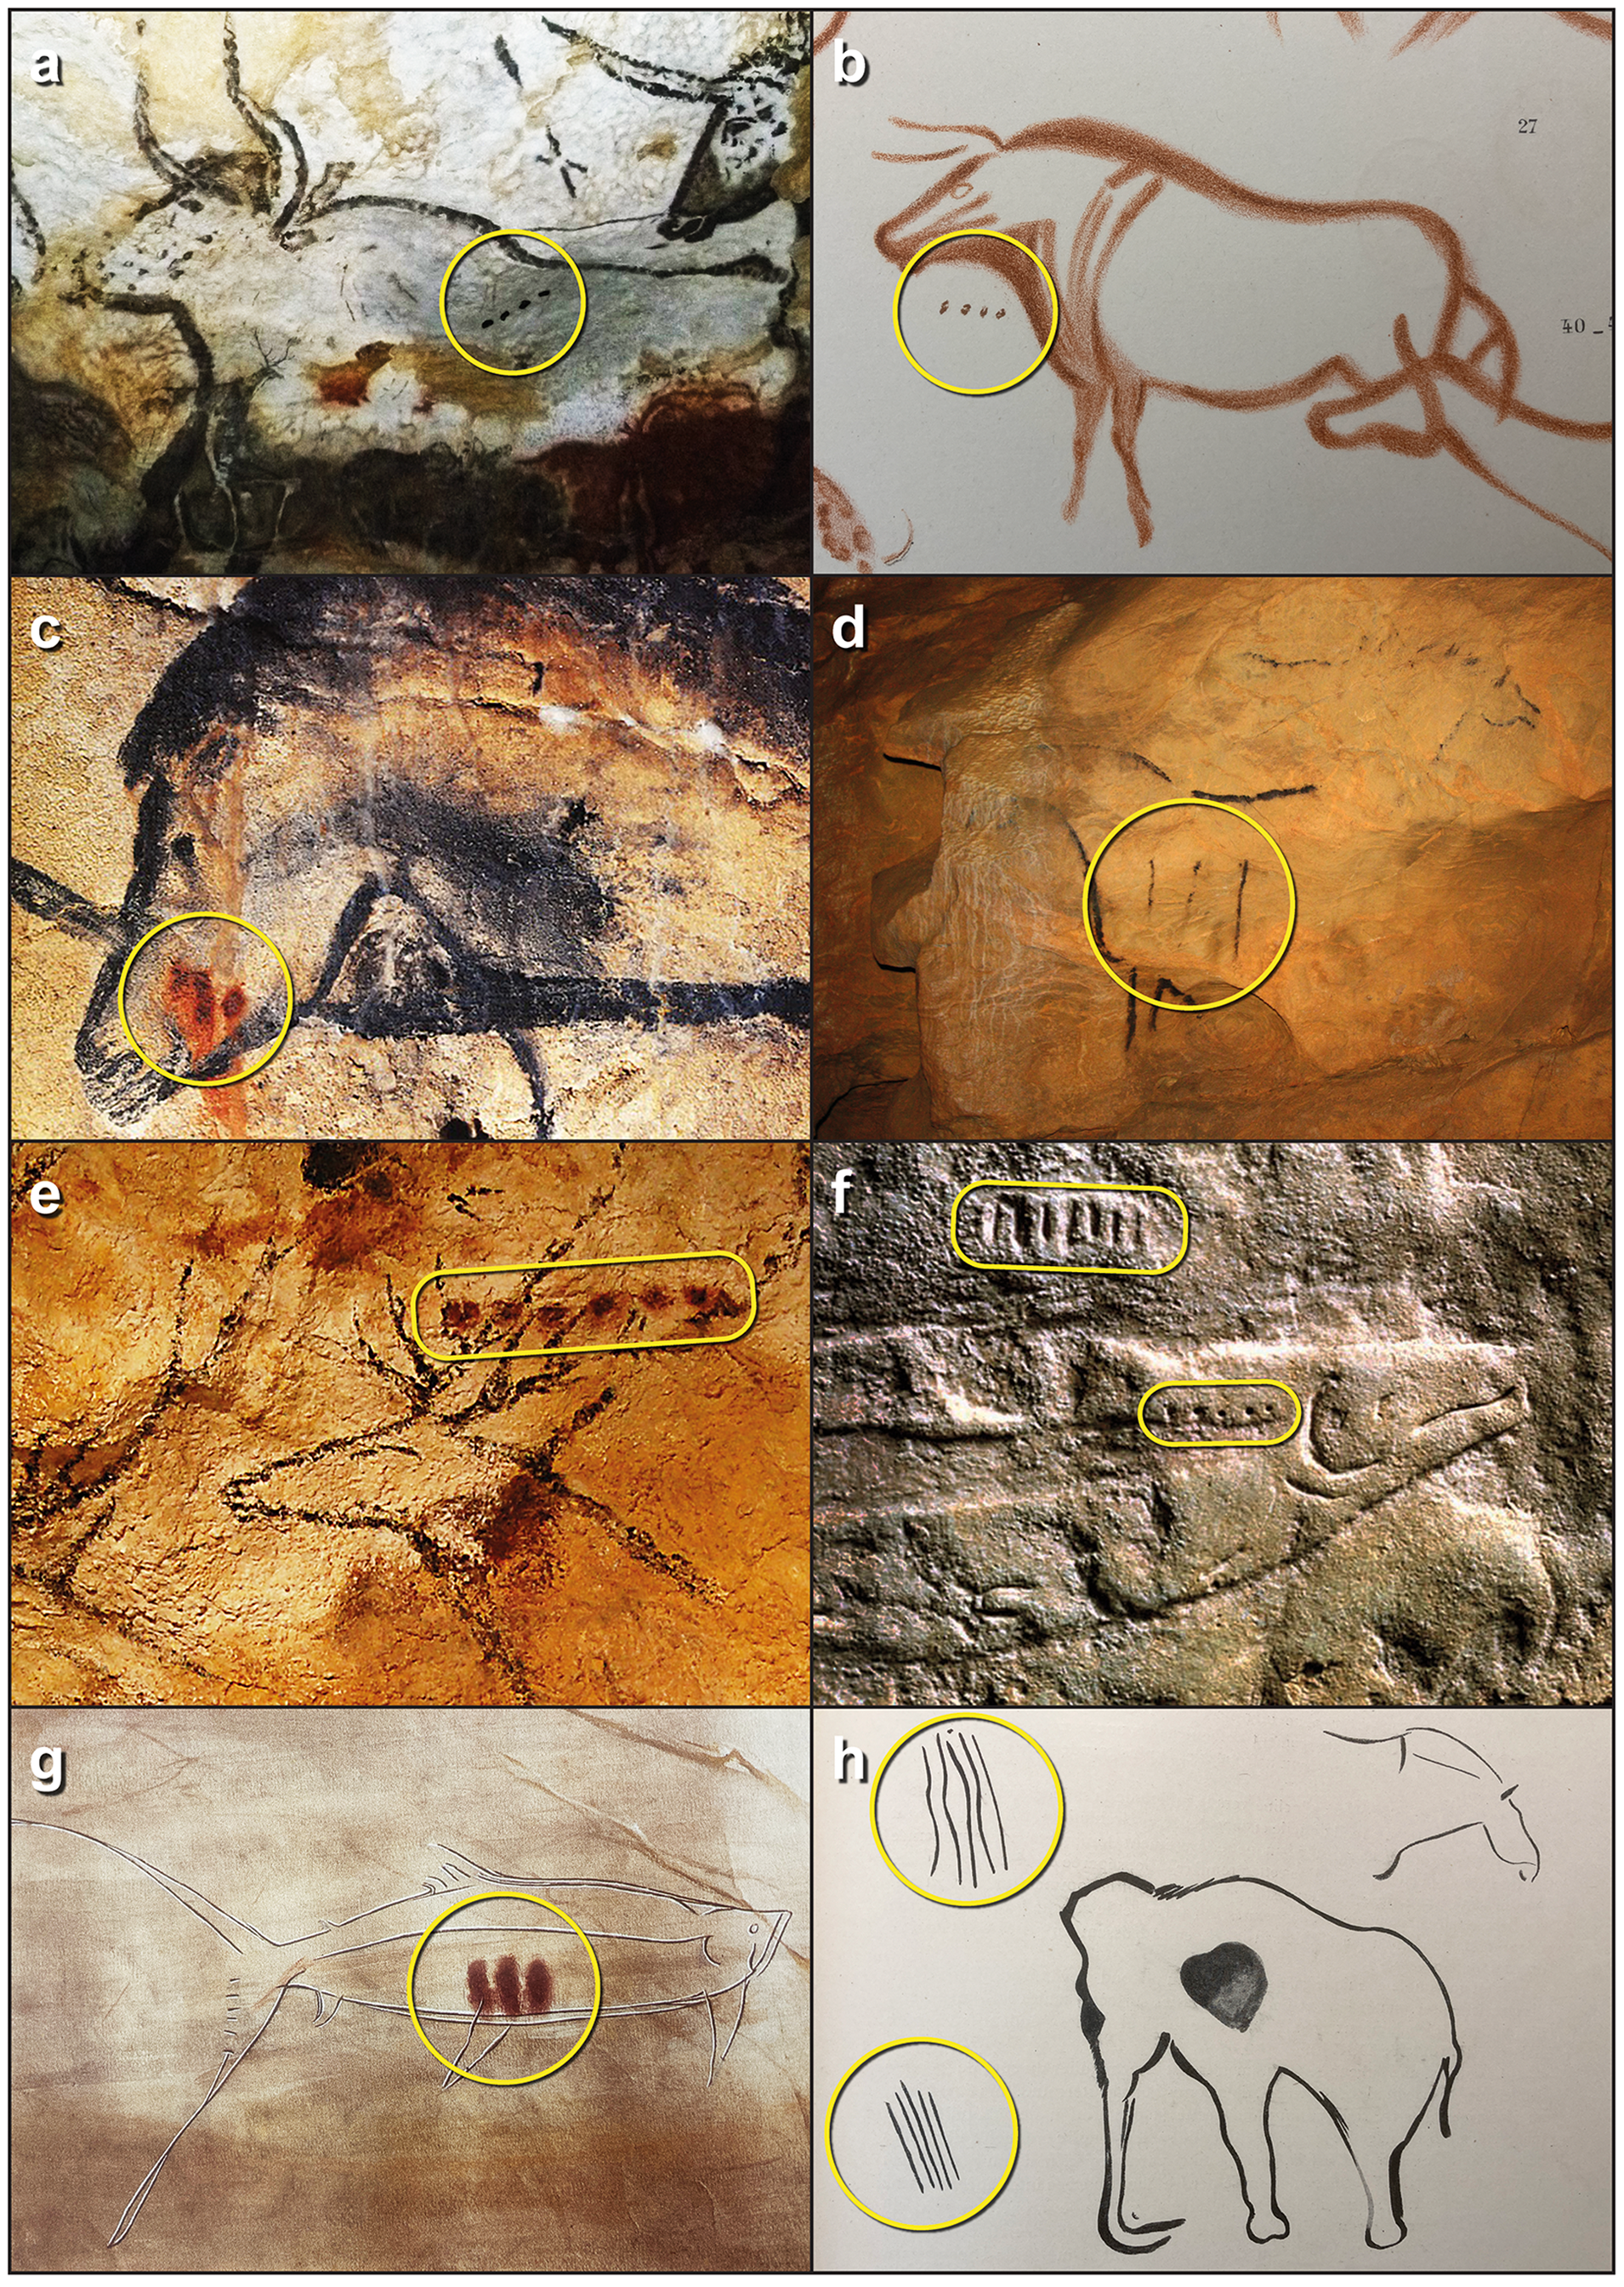
We focus specifically on two clear and simple patterns: animals associated with sequences of dots/lines (assumed to function similarly here), and the branching <Y> sign in which a second line diverges from a first (Figs 1 & 2). Although these occur throughout the Upper Palaeolithic, the greater majority of known examples date to the Late Upper Palaeolithic, possibly suggesting their meaning changed over time or they became far more common aspects of depictions from the Mid Upper Palaeolithic (Gravettian) onwards. As the identification of the animal with which the signs are associated is unambiguous, we investigate the meaning of the dots/lines and <Y> sign in ethological context. We do this by testing ecologically grounded hypotheses about prey behaviour using a database of such depiction-associated sequences. We reason that investigating the numbers of signs associated with images and the position of <Y> within line/dot sequences provide useful indicators of their meaning, based on the uncontroversial assumption that dots/lines represent numbers. By simple reasoning, the association of a number with an unambiguous subject—a horse, for example—might provide the foundation of a notational system that we could potentially analyse for further meaning. We reveal a system that was stable over a wide geographical area and over a period of tens of thousands of years.
Examples of animal depictions associated with sequences of dots/lines. (a) Aurochs: Lascaux, late period; (b) Aurochs: La Pasiega, late; (c) Horse: Chauvet, late (we differ in opinion with the Chauvet team, for whom it would be early); (d) Horse: Mayenne-Sciences, early; (e) Red Deer: Lascaux, late; (f) Salmon: Abri du Poisson, early; (g) Salmon (?): Pindal, late; (h) Mammoth: Pindal, early. (Sources: (a) https://commons.wikimedia.org/wiki/File:Lascaux_004.jpg (b) Breuil et al. Reference Breuil, Obermaier and Alcalde del Rio1913, pl. XVIII; (c) free https://web.archive.org/web/20120222092520/http://www.istmira.com/foto-i-video-pervobytnoe-obschestvo/3924-iskusstvo-predystorii-pervobytnost-2.html (d) https://www.hominides.com/musees-et-sites/grotte-mayenne-sciences/ (e) Wellcome Collection. Attribution 4.0 International (CC BY 4.0); (f) © The Wendel Collection, Neanderthal Museum; (g) Berenguer Reference Berenguer1994, 92, fig. 63; (h) H. Breuil, in del Rio et al. Reference del Rio, Breuil and Sierra1911, 61, fig. 57.)
Examples of the <Y> sign in sequences associated with animal depictions. (a) Horse: Pair-non-Pair, early, <Y> sign in position 3 in sequence of 3; (b) Horse: Lascaux, late, <Y> sign in position 1 of sequence of 1; (c) Horse: Sotarizza, late, <Y> sign in position 1 of sequence of 1; (d) Chamois: Labastide, late, <Y> sign in position 2 in sequence of 7; (e) Horse: Commarque, late, <Y> sign in position 2 in sequence of 2; (f) Horse (?): Parpalló, late, <Y> sign in position 1 of sequence of 1. (Sources: (a): B. Bacon; (b) Vialou Reference Vialou, Leroi-Gourhan and Allain1979; (c) B. Bacon, after García Guinea Reference García Guinea1975; (d) B. Bacon, after Omnès Reference Omnès1982; (e) Delluc & Delluc Reference Delluc and Delluc1981, fig. 39; (f) B. Bacon, after Fortea Pérez Reference Fortea Pérez1978.)

Upper Palaeolithic artificial/external memory systems
It is generally accepted that regular series of marks on Upper Palaeolithic material culture represent notational counting, constituting the ‘material scaffolding’ by which information can be stored outside the body (d'Errico & Cacho Reference d'Errico and Cacho1994; Overmann Reference Overmann2016; Wynn et al. Reference Wynn, Overmann, Coolidge, Janulis, Wynn and Coolidge2016). This can be achieved in several ways: from subitization (the ability to assess the numerosity of small sets of items -up to ~4-at a single glance), to cardinality (an ability to report the numerosity of the items in a set through counting, aided for numbers up to 20 by using fingers and toes, and beyond by internalizing the count mentally or by externalizing the count using simple tallies marked on sticks or bone), to ordinality (the ability to assign a value based on the sequential position of an item in a set). Cognitively these are distinct skills with distinct neuronal substrates in the brain (Tang et al. Reference Tang, Ward and Butterworth2008), with subitization being the most basic and ordinal representations the most sophisticated and going beyond cardinal representations (children master cardinal representation of numerosity before they understand ordinal representations: see, e.g., Sasanguie & Vos Reference Sasanguie and Vos2018). For further discussion of these issues, see the Supplementary Material.
Marshack (Reference Marshack1991) suggested that sequences of lines, dots and cupules on Upper Palaeolithic portable art formed part of a counting system with a one-to-one correspondence of signs to items, i.e., one line <|> or dot <•> would be the equivalent of (i.e. represent) one day. In his view, individual lines, dots and cupules represented units of time in numerical form and were therefore counting markers (one line/dot = one day), and sequences of these recorded lunar calendars. To record fully the yearly phases of the moon, he argued, Upper Palaeolithic people were able to use numbers up to ~377. While the lunar calendar notion failed to convince the scholarly community, Marshack's work paved the way for the recognition that these sets of markings were artificial/external memory systems, whatever the reason for this recording.
Francesco d'Errico has done much to advance our understanding of artificial/ external memory systems. His interest has been in the way that notational objects have been used and the implications of this for human cognitive evolution rather than decoding the specific information they were conveying (d'Errico Reference d'Errico and Nowell2002, 38). Through microscopic traceological analysis of engraved objects, he has significantly revised the evidence for such (e.g. d’Errico Reference d'Errico1989; Reference d'Errico1995a,Reference d'Erricob; d'Errico & Cacho Reference d'Errico and Cacho1994). Most importantly, he has demonstrated that numerical systems were used throughout the Upper Palaeolithic, a similar time frame to the African late Middle Stone Age (d'Errico et al. Reference d'Errico, Doyon and Colage2017). In his analysis of the complex engraved signs and figurative art on an antler retoucher from the Upper Magdalenian of La Marche Cave, he was able to demonstrate that this constituted an overall design, in which a concern to distinguish between groups of markings was prevalent, reflecting the use of the antler to record distinct categories of information as an artificial/external memory system (d'Errico Reference d'Errico1995b; see also Marshack & d'Errico Reference Marshack and d'Errico1995).
In the view of Overmann (Reference Overmann2013; Reference Overmann, Overmann and Coolidge2019), the increasing use of numerosity would lead to the quantification of time, and that such a quantification should be based on the seasons (see also de Smedt & de Cruz Reference de Smedt and de Cruz2011). This point is particularly important to what follows. The sequences of dots/lines associated with animal images certainly meet the criteria for representing numbers: they are usually organized in registers that are horizontal relative to the image with which they appear to be associated, and are of regular (rather than random) size and spacing, akin to the notion of a Mental Number Line being central to the development of mathematical abilities (Brannon Reference Brannon2006; Dehaene et al. Reference Dehaene, Bossini and Giraux1993; Pinel et al. Reference Pinel, Piazza, Le Bihan and Dehaene2004; Previtali et al. Reference Previtali, Rinaldi and Girelli2011; Tang et al. Reference Tang, Ward and Butterworth2008). The surviving sequences vary in length; hence it appears that they used the Additive/Plus One, or Cardinality Principle—each number is created by adding 1 to the preceding number, hence I, II, III … (Corchón Rodriguez Reference Corchón Rodriguez2012; Kelley & Milone Reference Kelley and Milone2005; Marshack Reference Marshack1991; Overmann Reference Overmann2016). For further discussion of numerosity, see the Supplementary Material.
Fritz (Reference Fritz1999) assembled a database of 90 Magdalenian portable objects from the Dordogne and the Pyrenees, noting considerable consistency in the ‘principal types [of sign] including linear marks, dashes, angular signs, arc shapes, broken lines … dots, various impact marks and combinations and repetitions thereof’ with no site- or region-specific difference. She concluded that these were underpinned by a single conceptual scheme that lacked any significant variation in space or time. There is, therefore, little controversy that the use of sequences of dots, lines and other marks, often associated with animal images, reflected a widespread use of cardinal artificial/external memory systems in Upper Palaeolithic space and time. The actual subject of such systems—the information recorded in them—has been, so far, elusive.
Upper Palaeolithic prey and predation: the wider context
Upper Palaeolithic hunter-gatherers were dependent to a large degree on the acquisition of horse, cervid, bovid, caprid, proboscidean, avian and aquatic foods. In modern populations, all of these share a characteristic annual cycle of mating and birthing seasons separated by spring and autumn migrations of regionally differing extent, with birds and fish defined more in terms of spawning and, therefore, presence/absence. Over the annual cycle, populations fission and fuse between smaller and larger groups, and hence their distribution in space and time varies considerably but predictably over the course of the year (e.g. Berger Reference Berger1977; Chaplin Reference Chaplin1977; Clutton-Brock et al. Reference Clutton-Brock, Guinness and Albon1982; Espmark Reference Espmark1964; Goodwin Reference Goodwin1999; Guthrie Reference Guthrie2005; Peck Reference Peck2004; Stiner Reference Stiner1994; White et al. Reference White, Pettitt and Schreve2016).
Zooarchaeological data from Upper Palaeolithic faunal assemblages reveals that similar behaviours were occurring in Pleistocene resources as one would expect, based either on direct equivalents in most cases or using modern elephants and rhinos as proxies for mammoths and woolly rhinos respectively (e.g. Delpech Reference Delpech1983; Gordon Reference Gordon1988; Goutas & Lacarrière Reference Goutas, Lacarrière, de las Heras, Lasheras, Arrizabalaga and de la Rasilla2012; Kuntz Reference Kuntz2011; Le Gall Reference Le Gall and Desse1984a,Reference Le Gallb; Reference Le Gall1992; Martin Reference Martin, Bintz and Thévenin1999; Nowak Reference Nowak1991; Rendu Reference Rendu2007). It follows that knowledge of the timing of migrations, mating and birthing would be a central concern to Upper Palaeolithic behaviour, the distribution and timing of which was fully dependent upon these resources (Bocquet-Appel & Demars Reference Bocquet-Appel and Demars2000; Gamble Reference Gamble1986; Van Andel & Davies Reference Van Andel and Davies2003). It is no surprise that thinking about animals is central to hunter-gatherers’ being in the world (Lévi-Strauss Reference Lévi-Strauss1962). Prey animals overwhelmingly dominate Palaeolithic art (Bahn Reference Bahn2016; Guthrie Reference Guthrie2005), and pelage, hair, antler growth, gregarious and aggressive behaviour and other indications of rutting in particular are commonly depicted in some numbers by the Late Upper Palaeolithic, such as in Lascaux, which can be seen as a great calendar of creation (Aujoulat Reference Aujoulat2005). Many of its animals are associated with signs: for example, among its row of ‘swimming’ deer stags—usually interpreted as an autumn migration scene—one stag is marked with seven red dots; elsewhere in the cave, in what is usually interpreted as a mating scene with a male and female aurochs in summer coats, the female's flank is marked with four black dots. Later in time at Font de Gaume, two reindeer stags lock antlers—presumably fighting in the rutting season—eight dots mark one set of antlers. We will return to these specific examples below.
Our hypothesis
Our interest is in the sequences of dots/lines associated with depictions of prey animals in Upper Palaeolithic art, and in the <Y> sign that appears in some of these sequences. As we have noted above, it seems justifiable to assume that such sequences were saying something about the specific taxa with which they were associated, rather than forming a part of the depiction. If they depicted blood or breath, for example, why would several taxa including aurochs, fish and a cicada be consistently marked with four dots/lines in various anatomical locations (Aujoulat Reference Aujoulat2005; Chollot Reference Chollot1964)? Hunting magic, shamanism, other ‘umbrella theories’ and, for that matter, random chance, do not provide an explanation for the redundancy of the number four in many images (Bahn Reference Bahn, Bahn and Rosenfeld1991, 1–13). Instead, we believe that it is likely that this information was numerical in nature, of either a cardinal or ordinal nature.
That we are looking for number-based information about specific prey animals is therefore our point of departure. It seems to us unnecessary to need to convey information about the numbers of individual animals, the times they have been sighted, or the number of successful kills of these; it seems far more likely that information pertinent to predicting their migratory movements and periods of aggregation, i.e. mating and birthing when they are predicably located in some number and relatively vulnerable, would be of greatest importance for survival. Given the obvious concern with visual clues to rutting behaviour in art discussed above, we hypothesize that such numerical information should record information about the timing of these events in the annual round.
We have seen above that the quantification of things using mental number lines and the additive/plus one principle, wherein one mark equates/represents one thing, was a characteristic of Upper Palaeolithic mark sequences. In our hypothesis, when associated with an animal they should mark units of calendrical time. Given that the number of these is always relatively few, it is unlikely these represent days. We think it likely that the total number of marks in a sequence is one way of denoting a number of months. The most obvious units of time for non-agricultural groups are lunar months (de Smedt & de Cruz Reference de Smedt and de Cruz2011; Marshack Reference Marshack1991). The recurrent cycle of the moon's four individual phases provides a readily visible framework for quantifying time, particularly when assisted by material scaffolding and, if necessary, the cycle of ~29 days could be subdivided into four subphases of ~7 days (Jègues-Wolkiewiez Reference Jègues-Wolkiewiez2005; Overmann Reference Overmann2013). As none of the sequences in our database (see below) contains more than 13 marks, they are consistent with the 13 lunar months of a year. Hence, we hypothesize that sequences are conveying information about their associated animal taxa in units of months. In other words, they present ethological information as a seasonal calendar.
If our hypothesis is correct, these artificial/external memory systems would have limited use unless their sequence of months could be anchored to a well-defined start date, in other words, a calendar. Many annual calendars are based on astronomy: for example, the timing of the equinoxes and solstices. However, these are hard to observe and, while pertinent to the agricultural year, are not relevant for Palaeolithic hunter-gatherers. The other type of calendar is based on meteorology, particularly the annual temperature cycle. These calendars are directly relevant to the cycles of flora and fauna that were crucial for survival in the Pleistocene. In the absence (we assume) of a detailed solar system of numbered years, we should be looking for something that unambiguously signals the turn of the year, i.e, a widely recognizable event with which month number one of the year begins. The obvious event is the so-called ‘bonne saison’, a French zooarchaeological term for the time at the end of winter when rivers unfreeze, the snow melts, and the landscape begins to green. This of course varies by several weeks from the south to the north of Europe, but corresponds approximately to late spring. We hypothesize that spring, therefore, with its obvious signals of the end of winter and corresponding faunal migrations to breeding grounds, would have provided an obvious, if regionally differing, point of origin for the lunar calendar. The problem with lunar calendars is that there are about 12.37 lunar months in a solar year. This incompatibility between the lengths of the solar year and the lunar month was of great concern in the classical world, where complicated systems were devised to overcome this problem, for example, using the 19-year cycle of the Moon, but we do not believe that any of these systems were plausible or necessary in the Palaeolithic world. We adopt the simple solution that they started counting months at the start of the bonne saison and continued until counting became irrelevant in late winter—simply re-starting the count of months at the start of the next bonne saison. A great advantage of this calendar is that it is stable in describing the life-cycles of animals and plants despite great geographical and cultural differences in the European Upper Palaeolithic.
Our hypothesis, then, is that the number of lines/dots associated with a particular taxon is conveying information in terms of the number of lunar months that follow the beginning of bonne saison (as we call it, relative to bonne saison or RBS). Hence three marks (whether lines or dots), for example, would refer to three months after the start of the bonne saison. It is important to note that this calendar operates as an interval calendar, where an event such as mating or birth is located in the calendar in terms of the number of lunar months that have elapsed since the onset of bonne saison (the event signalling the commencement of the calendar) and not as a fixed ‘date’. As we have noted above, however, many sequences contain a <Y> within them, and we need to understand the meaning of this sign. Overall, the total number of marks in sequences lacking a <Y>, those containing a <Y> and the ordinal position of the <Y> should, according to our hypothesis, represent specific events from the set ‘mating’, ‘birth’, ‘spring migration’ and ‘autumn migration’.
What might <Y> represent? It is one of the most commonly depicted signs in Palaeolithic art, and presumably meant something. Within sequences its position varies by taxon, as we shall see, hence it might denote the value of a property possessed by each taxon that is distinct from the cardinality of the sequence as a whole. We assume we have two related sets of information being recorded here: the total number of items in a sequence might denote the month in which one important event occurs, and the position of the <Y> within that sequence which denotes the timing of a second, distinct event. Given the set of behaviours of most interest to Palaeolithic hunters, we hypothesis that <Y> refers to birthing: due to the symbolism either one (line) becomes two (lines) or two parted legs. Hence, we potentially have two events, one of which is birthing, expressed in lunar months relative to bonne saison.
Testing the hypothesis
We hypothesize that the number of lines/dots, or the ordinal position of <Y> symbols, in sequences associated with depictions of prey taxa in Upper Palaeolithic art, convey information about events in those animals’ annual lives important to hunter-gatherers, expressed in lunar months RBS, i.e. anchored to the start of the bonne saison. That information is likely to reflect birthing, and possibly mating and/or migration of the animals of concern in the region in which the images are found (or originated).
In order to test our hypothesis we compiled as exhaustive a database of sequence/image associations as we could from the available global literature and web archives, in order to explore whether the number of markings and the position of <Y> in sequences was random or ordered, and in the latter case whether any apparent order correlated with the ethological and zooarchaeological indicators of the timing of birthing, mating and migration by taxon. After omitting any problematic examples (e.g. those with ambiguous numbers of marks or unclear taxonomic identification of associated images), these totalled 606 sequences without <Y> and 256 sequences with <Y>, largely from France and Spain, with some examples from further to the east (Table 1 and Supplementary Material). Chronologically they span the Early to Late Upper Palaeolithic, with the vast majority of examples in the latter. We appreciate this is a long span of time, and were concerned why any specific artificial memory system should last for so long. Initially, we divided our samples into two: an early and a late set, the former spanning the Early and Mid Upper Palaeolithic (Aurignacian–Gravettian) and the latter the Solutrean and Magdalenian, and ran our analysis. This made no difference to the results, however, and hence we combined the whole dataset for what follows below. For analytical purposes we classified deer and reindeer together as ‘cervids’; ibex and chamois as ‘caprids’; all fish (usually salmon or trout) as ‘fish’; and all birds together as such. The rationale for this was the similar timing of migrations, birthing and mating within each of these groups. Where these differed by species, for example between bison and aurochs (the latter based on modern cattle), we kept them separate. Our analytical groups are: aurochs, birds, bison, caprids, cervids, fish, horses, mammoths, rhinos. Because of exceptionally low numbers we exclude snakes and wolverines. We also omitted sequences associated with apparent human depictions, or images in which such were part, in order to treat these separately at a later date. Anecdotally, including these would not alter our results. The full databases and explication of these can be found in the Supplementary Material.
Number of sequences with and without <Y> in our analysis, by group.

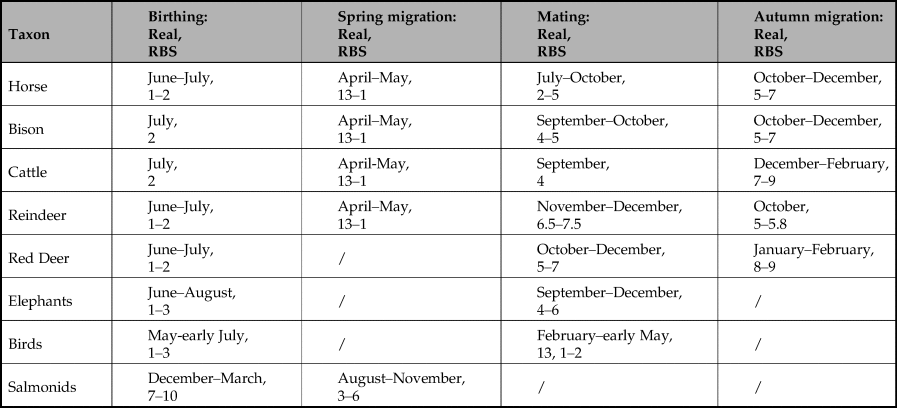
In order to compare the results with the timing of migration, mating and birth, we converted modern ethological information to month relative to bonne saison (RBS). Hence, the mating of bison, which usually occurs around August, would occur in month 3–4 RBS (three to four months from the start of May). The comparison of modern and Palaeolithic calendars is obviously approximate, given that the start of the bonne saison is based on local meteorological events such as the melting of river ice, disappearance of snows and greening of the landscape, the first appearance of migrating birds, etc., which will vary regionally. The ethological timing of these events is shown in Table 2, including modern months for simple reference. We summed the total number of marks RBS and express these as graphs: the peaks represent the most commonly occurring number of marks and hence, in our hypothesis, actions of that particular taxon that were of most interest to the users of the artificial/external memory system. By comparing the timing of these peaks to the seasonal behaviours RBS, we test if any are correlated.
Ethological calendar of mating, birthing and migration by taxa, shown in months and converted relative to bonne saison (RBS). 1 indicates late May or early June. As there are 13 phases of the first phase of the lunar month in the calendar year, we take 13 to represent the end of the year RBS, i.e. approximately April. Hence when bonne saison arrives the old calendar is discarded and events recorded anew RBS.
Our predictions are that the peaks in the number of marks associated with each taxon should not be randomly distributed, but should be clearly patterned; and that pattern, when expressed RBS, should correspond to important events in the annual lifecycle of that taxon, notably birthing, mating and/or migration. As the timing of these events differs between each of our analytical groups, the dominant number of marks should also differ between taxa. Finally, statistics should reinforce the fact that any patterning found cannot be explained as accidental.
Analysis
Figure 3 presents the number of marks in sequences of lines/dots (as bars) by analytical group (i.e. lengths of sequences), expressed in months relative to bonne saison (where 1 = late May/early June) together with fits of dual Gaussian mixture models illustrating overall trends in each set of data. It can be seen that, in most cases, the peaks of the models correlate either with mating or birthing seasons, indicated on the graphs by the greyscale bars. This is particularly clear for aurochs, bison, horse and mammoth and fish, visible but less precise for cervids, and not correlated for caprids. No correlation was observed between peaks and migrations, and where it is possible to distinguish between birthing and mating, the peaks clearly correlate with the latter, as is particularly clear for aurochs, bison, horse and mammoth, and again probable for cervids. The data support our hypothesis that the number of marks in sequences of lines/dots without <Y> convey information about the birthing, but particularly mating behaviour of each taxon.
The number of marks in sequences of lines/dots by analytical group (i.e. lengths of sequences), expressed in lunar months relative to bonne saison (where 1 = late May/early June). Bars below the graphs represent the timing of major events in the annual lifecycle of the taxa based on modern ethological parallels. In order to illustrate the peaks of the distribution of frequencies, we fitted dual Gaussian mixture models to each set of data (solid line; if the dual Gaussian fit did not converge we fitted a single Gaussian instead) in addition to the frequencies observed (open bars) for each number of marks in a sequence of dots or lines for each lunar month of the year.
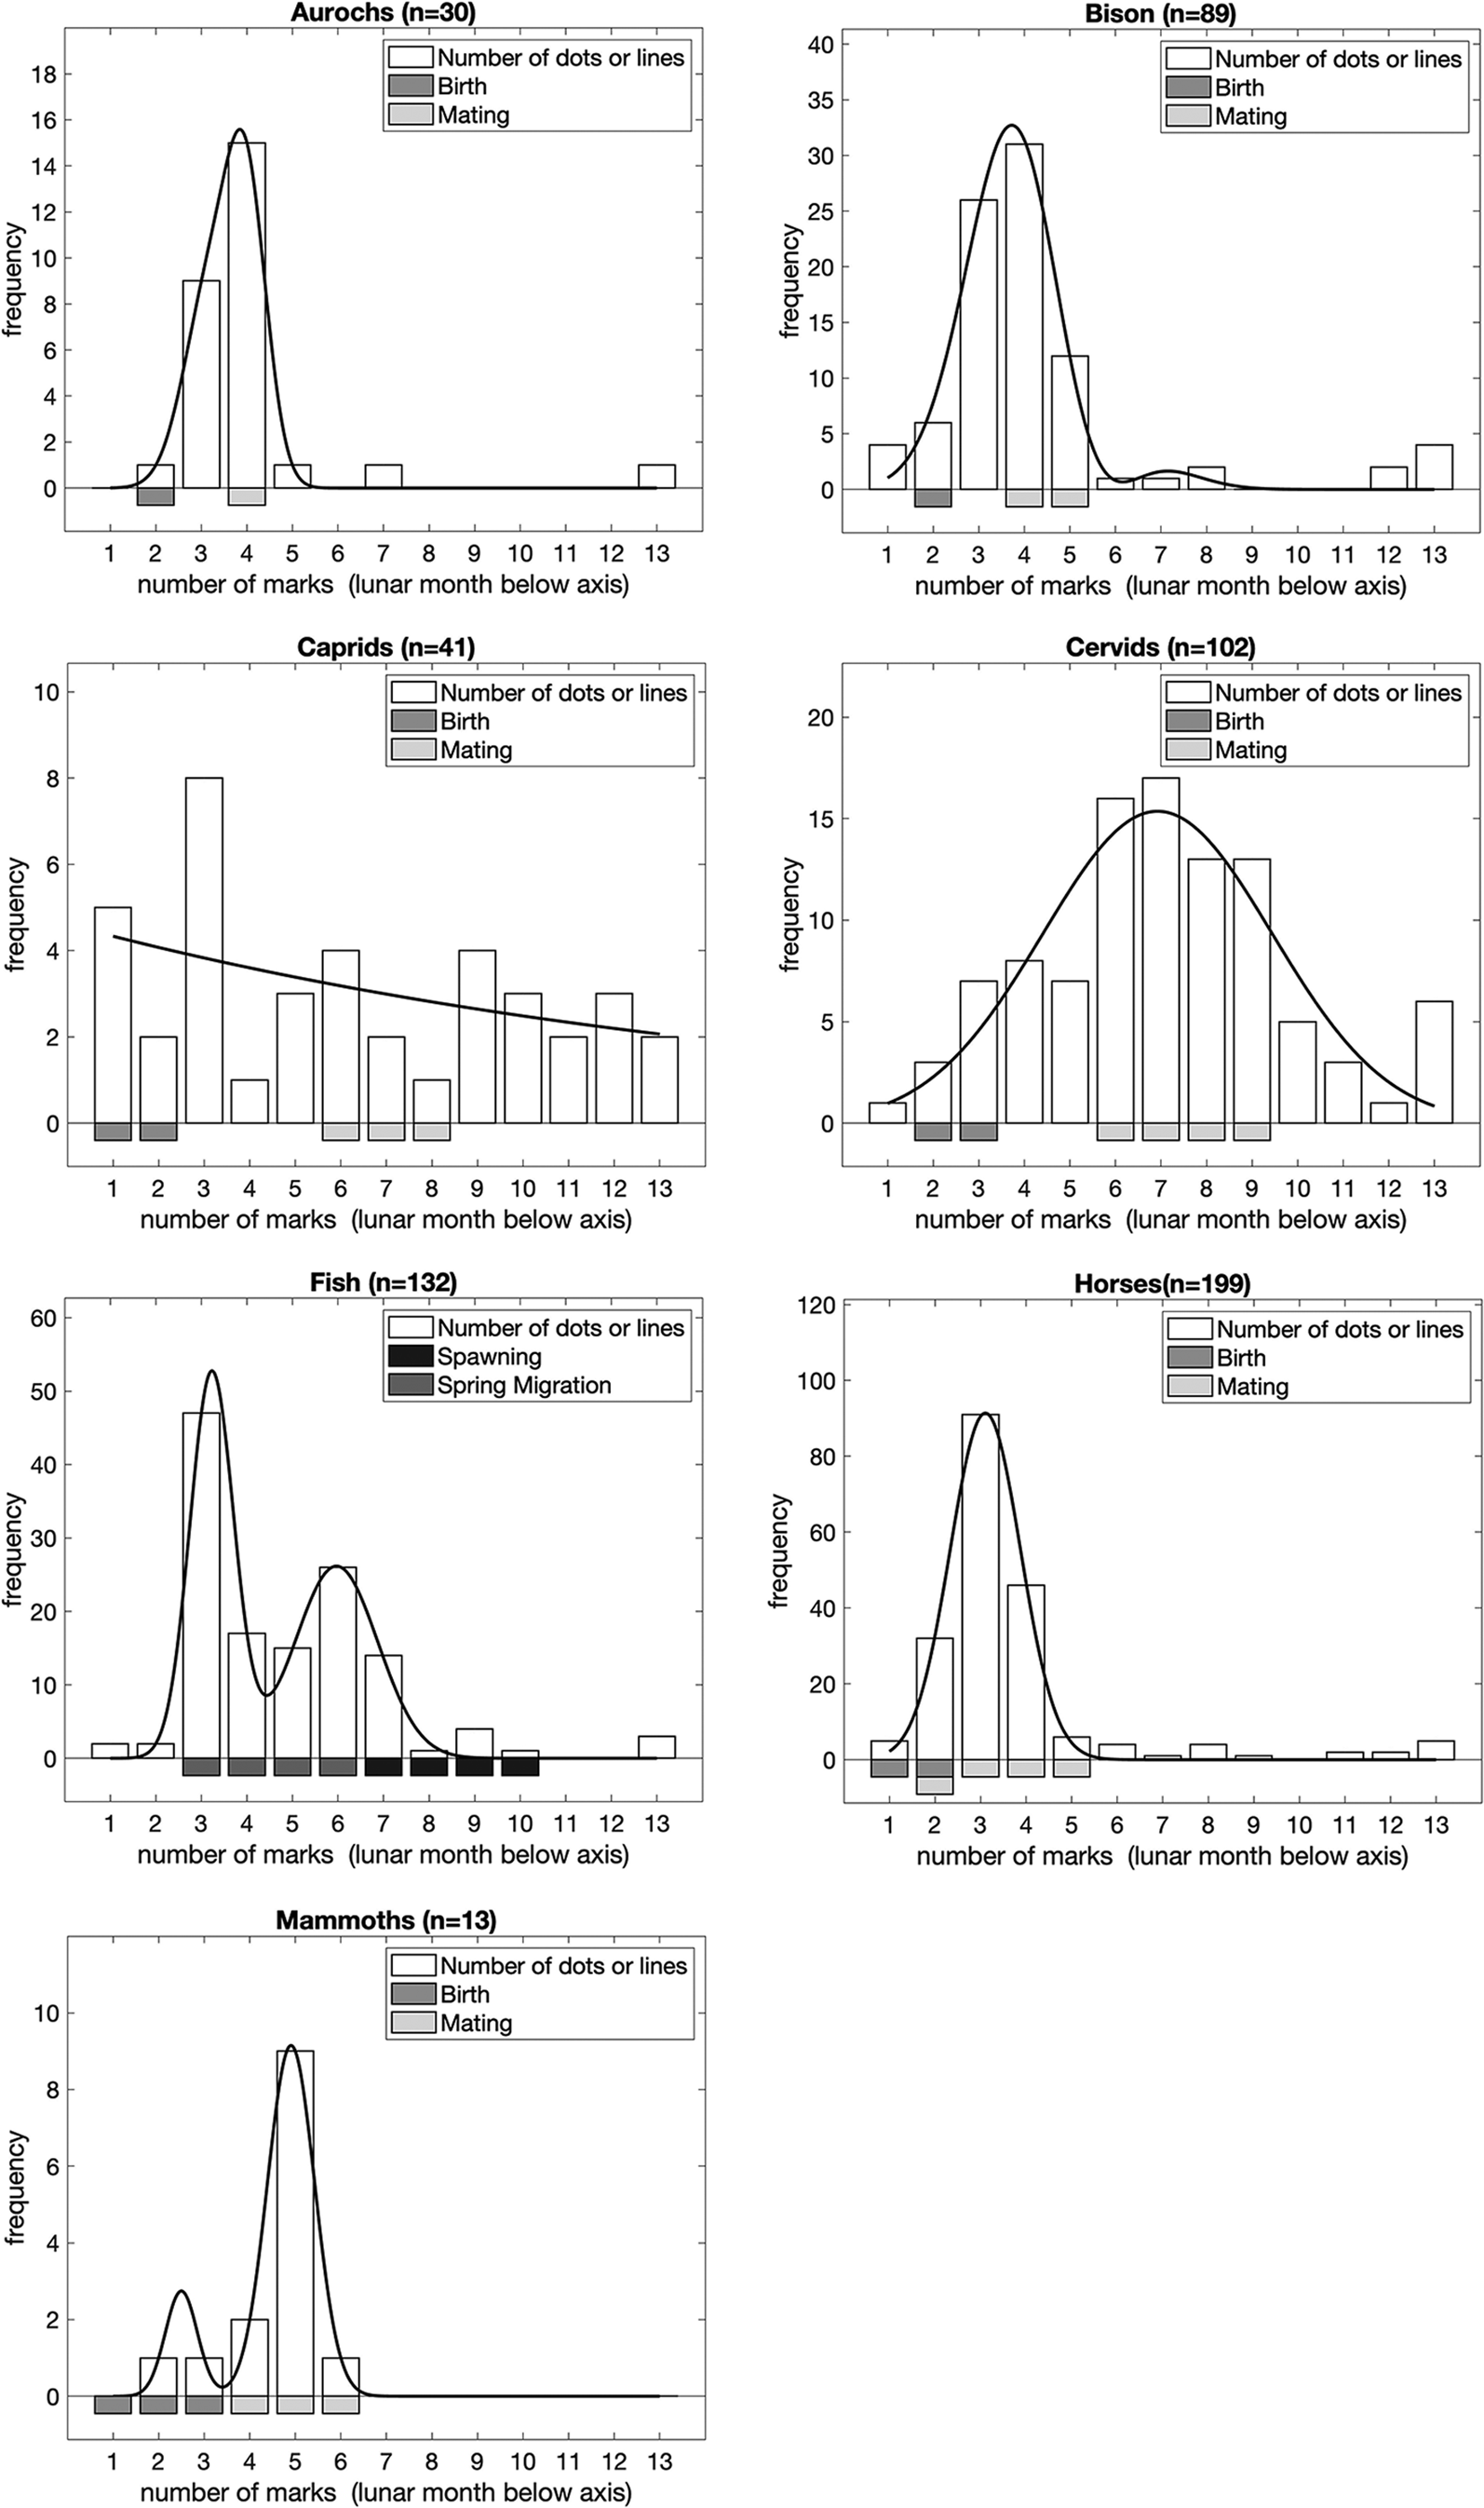
Figure 4 presents the position of <Y> in sequences, by analytical taxa. To determine the position of <Y>, we assumed that sequences were oriented in the same way as their associated animal depictions, i.e. with the animal the right way up. In most cases there is a striking correlation between the peak position of <Y> in the models and birthing for each taxon. The data support our hypothesis that the position of <Y> in sequences of lines/dots conveys information, in this case about birthing. This is particularly interesting, given that the number of lines/dots in sequences without a <Y> sign is indicative of mating.
The position of <Y> in sequences, by analytical taxa. Bars below the graphs represent the timing of major events in the annual lifecycle of the taxa based on modern ethological parallels. In order to illustrate the peaks of the distribution of frequencies, we fitted dual Gaussian mixture models to each set of data (solid line; if the dual Gaussian fit did not converge we fitted a single Gaussian instead) in addition to the frequencies observed (open bars) for each <Y> position within a sequence for each lunar month of the year.
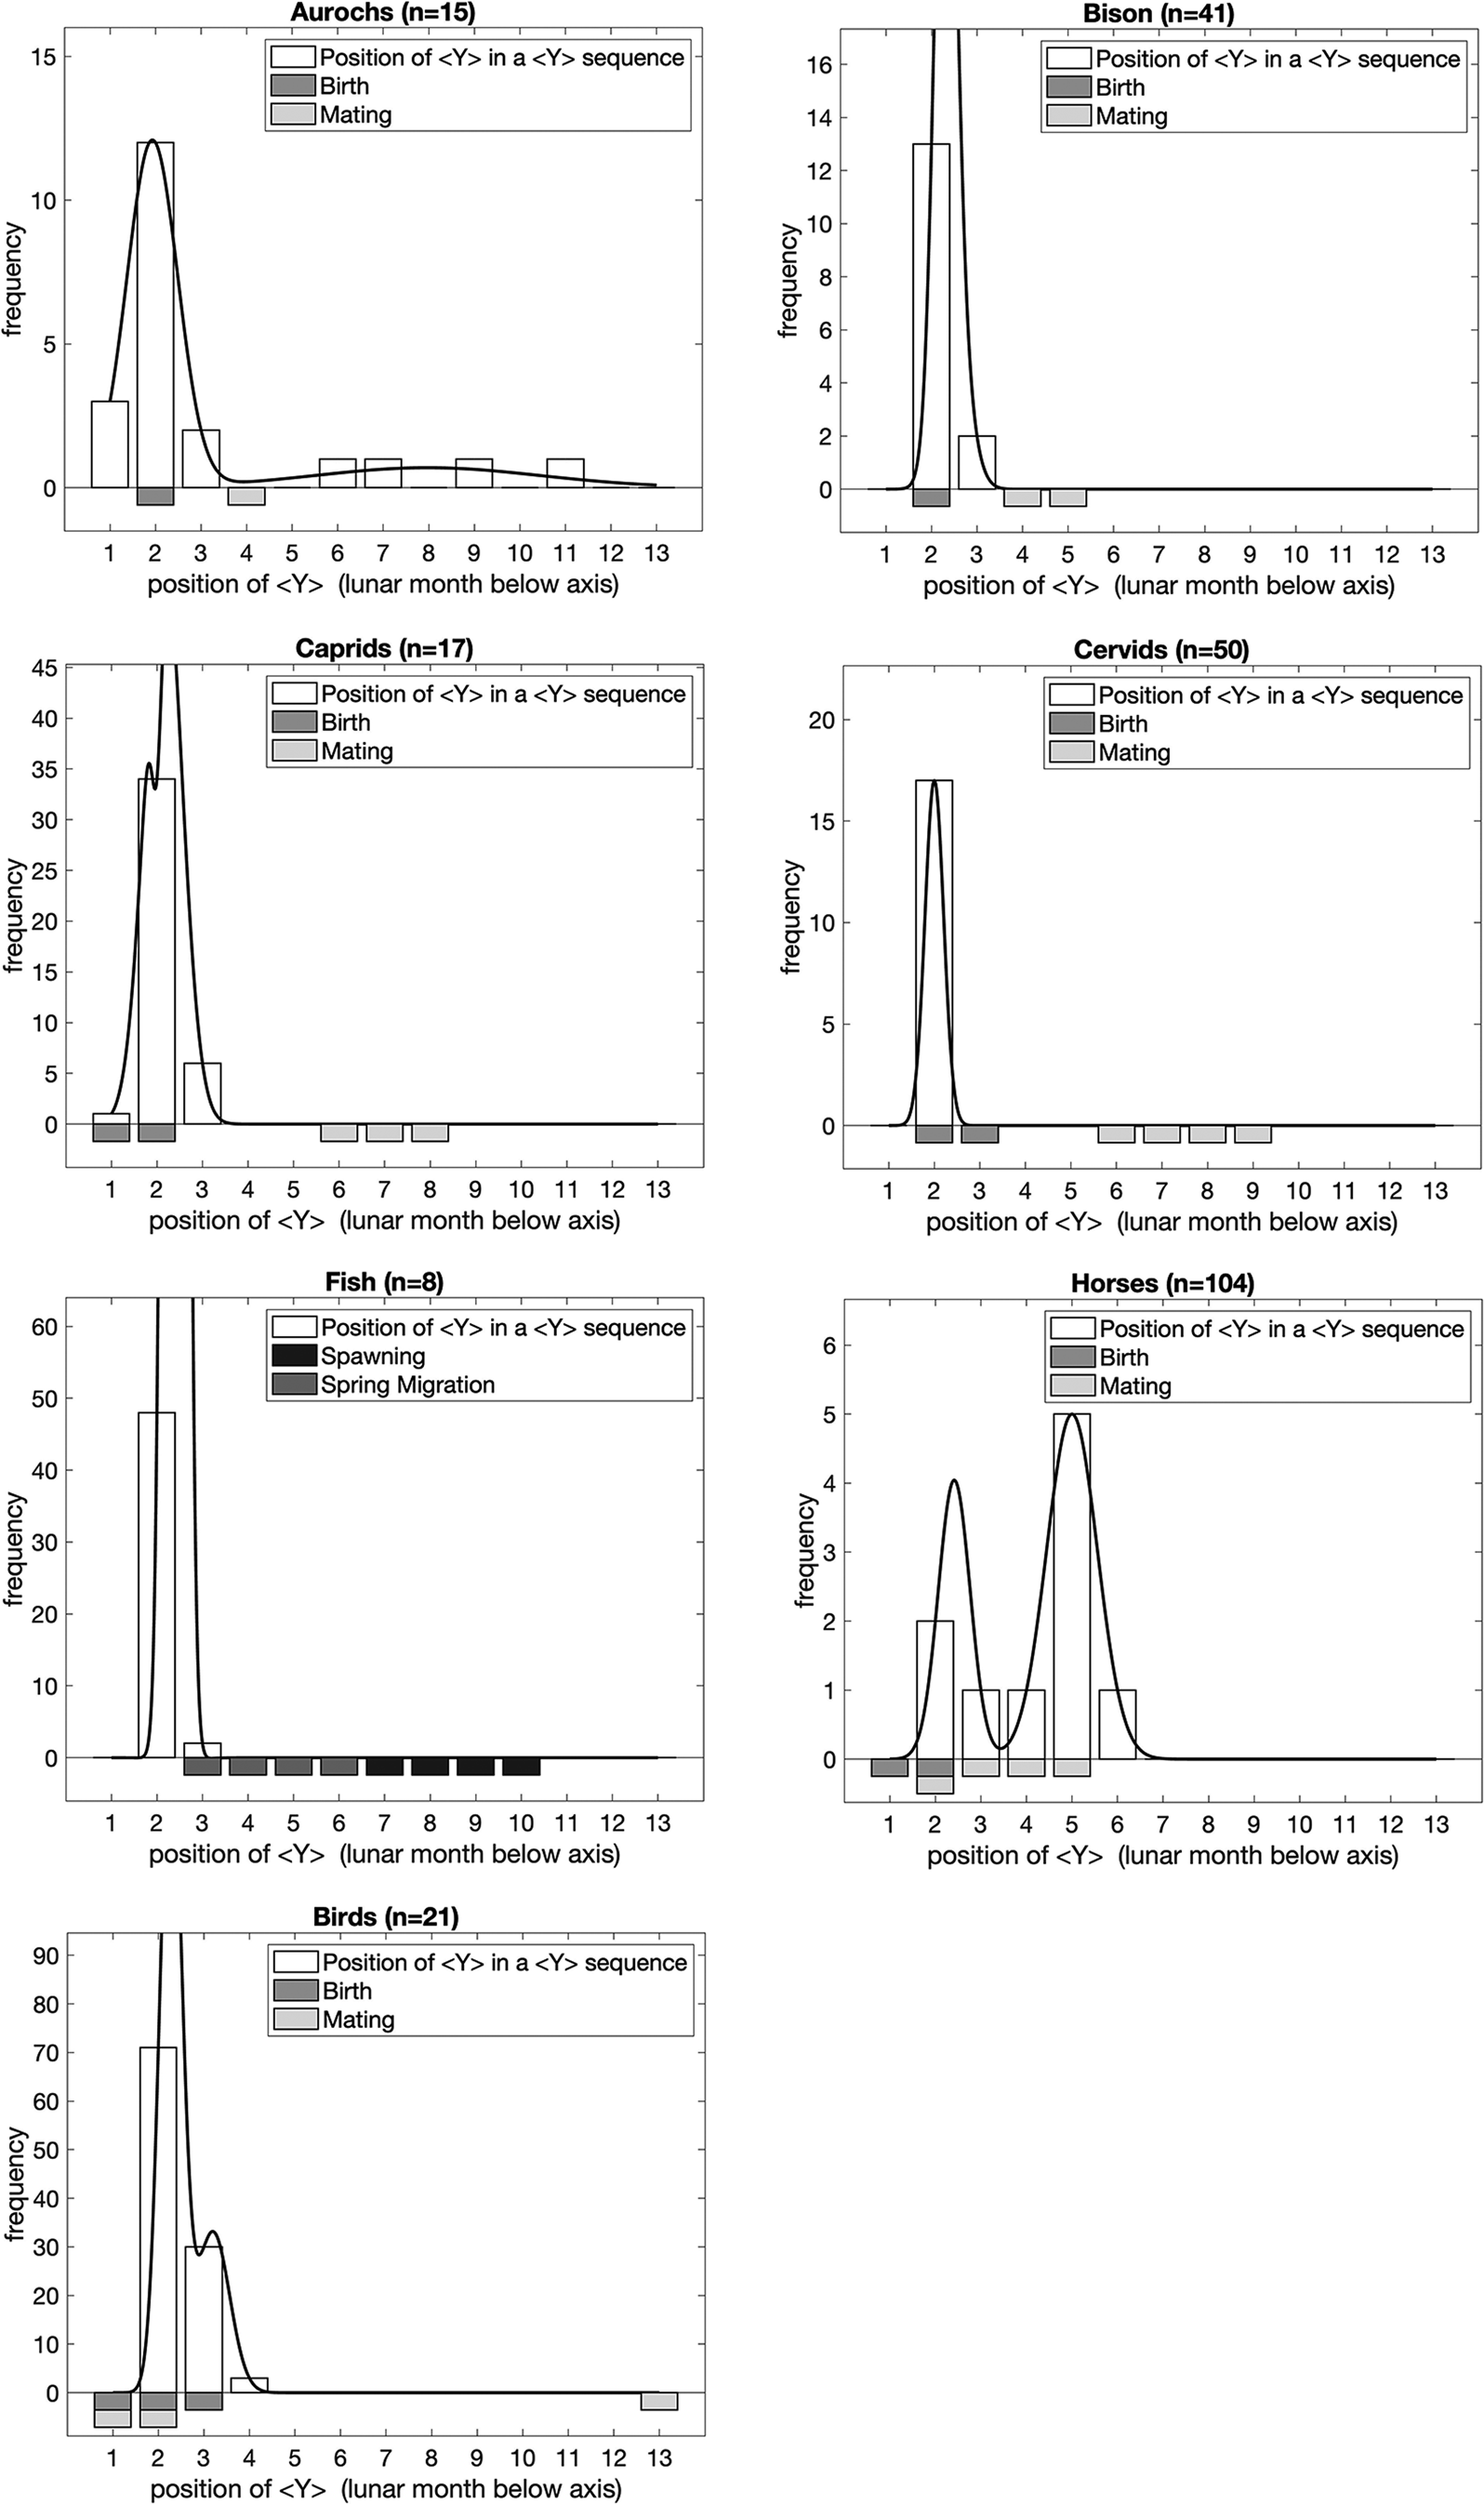
Figure 5 presents the number of marks in sequences which do contain <Y>. Once again there is a clear correlation, in this case with birthing, or both birthing and mating. Two analytical groups stand out from the others in that they are not terrestrial herbivores and from the point of view of Palaeolithic hunter-gatherers would be experienced more as an appearance and disappearance as migrations take them into and out of specific regions.
The number of marks in sequences which contain <Y>. Bars below the graphs represent the timing of major events in the annual lifecycle of the taxa based on modern ethological parallels. In order to illustrate the peaks of the distribution of frequencies, we fitted dual Gaussian mixture models to each set of data (solid line; if the dual Gaussian fit did not converge we fitted a single Gaussian instead) in addition to the frequencies observed (open bars) for each number of marks in a sequence containing <Y> symbols for each lunar month of the year.

For birds, the position of <Y> correlates with mating and hatching, as does the number of marks in sequences with <Y>. It seems fairly clear that the concern with sequences associated with birds was to convey the availability of eggs. For fish, the number of marks in sequences with and without <Y> correlates markedly with the spring migration and hatching.
Overall, there is a remarkable degree of correlation between the numbers of lines/dots in sequences with and without <Y> and the position of <Y> and the mating and birthing behaviours of our analytical taxa. Our data do not explain everything, but even taking imprecision and regional variability into account the degree of support for our hypothesis is striking. We now explore our results statistically.
Statistical analysis
Our data consist of records for each taxonomic group for each month of the year. The months of the year in which species engage in particular types of behaviour (mating, giving birth, or migration in spring and autumn) are all expressed as binary variables (for example, Aurochs give birth in month 2, so the ‘birth’ variable for Aurochs: Month 2 has a value 1, but has a value of 0 in all other months). In addition, we have variables indicating the number of times we observe numbers or ordinal positions of marks associated with that species which correspond to the numerical value of that month. So, for Aurochs: Month 2 we have variables that indicate the number of times we observe sequences of 2 dots or lines (1), the number of times we observe a <Y> symbol in position 2 of a <Y>-containing sequence (13), and the number of times we observe <Y> containing sequences of length 2 (10). We wanted to test how well the frequencies of marks corresponding to different months predict the occurrence of each type of behaviour. When predicting an outcome that can only take on binary outcomes, the appropriate test is logistic regression. We conducted these analyses using the statistical package R (R Core Team 2022) using the procedure ‘glm’ with a logit binomial family link function. We conducted separate simple logistic regressions, testing how well each measure of marks (ordinal position of the <Y> symbol in a sequence, number of dots or lines in a sequence without a <Y>, and total number of marks in a sequence with a <Y>) predicts each type of behaviour. When two measures of marks are both good predictors of a behaviour (as we expect might occur for position of <Y> and total number of marks in <Y> sequences, which will almost inevitably correlate with one another) we tested how well a model containing both predictors fits the outcome and then tested whether the improvement gained by adding the second predictor is statistically significant using the ANOVA procedure with a chi-squared model comparison test. It is important to verify that the data being assessed by a statistical test conforms to the mathematical assumptions underlying that test. For simple and multiple logistic regression, we used the R package ‘DHARMa’ (Hartig Reference Hartig2022) to test deviation, dispersion and occurrence of outliers prior to logistic regression (none of our data violates these assumptions).
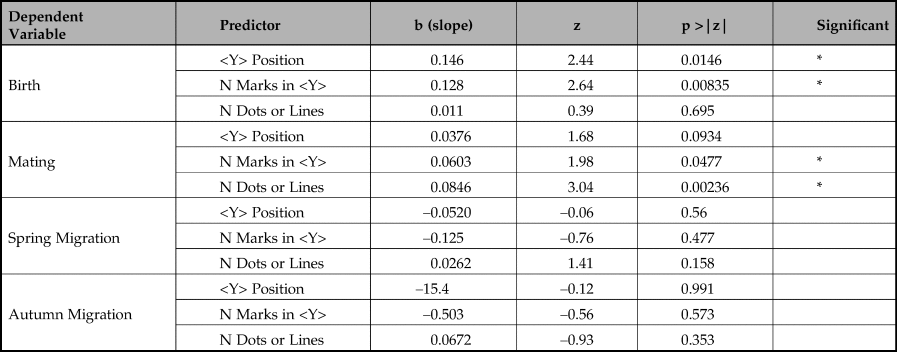
The results of these analyses are summarized in Tables 3–5 (and see the Supplementary Material for further details on our statistics).
Simple logistic regression results.
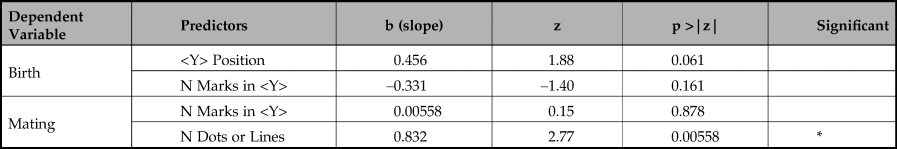
Multiple logistic regression results.
Model comparison results.
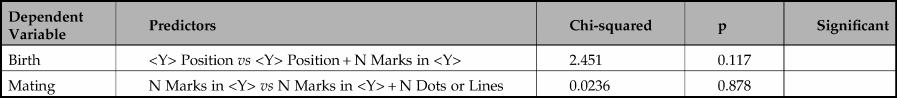
The first key message is that the birth periods are significantly well predicted by the position of <Y> (p < 0.0146). Although the length of <Y> sequences also predicts birth periods in a simple regression, our multiple logistic regression shows that when combined with <Y> position the length of sequence is not a reliable predictor of birth period and, in combination, is negatively correlated with birth month. Adding length of <Y> sequence to <Y> position does not significantly improve prediction of birth periods (chi-square(1) = 2.451, p >0.05).
Our second key finding is that mating periods are significantly well predicted by length of sequences of dots or lines not containing a <Y> (p = 0.00236). The number of marks in a <Y> sequence is also a predictor, but is far less reliable, only just reaching statistical significance (p = 0.0477). In a multiple logistic regression, the number of marks in a <Y> sequence fails to predict mating period (p = 0.878) whereas number of dots and lines is still highly reliable (p = 0.00558). Adding the number of marks in a <Y> sequence does not significantly improve prediction of mating periods (chi-square(1) = 2.451, p >0.05).
We found no statistically significant predictors of either Spring or Autumn migration periods.
One question which may strike the reader is whether support for our hypothesis actually depends upon a single outlier group—fish. For example, of all the species for which we have data, the month in which salmon spawn is clearly distinct at 6, whereas all the other species have typical months of parturition between 1 and 3. We therefore conducted additional analyses excluding fish from the dataset. There were no meaningful differences in the results of analyses with or without fish. These analyses, together with some additional statistical details, are presented in the Supplementary Material.
Discussion and conclusions: a phenological/meteorological calendar, but is it writing?
It is, we hope, uncontroversial that the Upper Palaeolithic groups used notational numeric systems, evidenced in numerous examples of notched, lined and otherwise marked batons, pebbles, bones, beads and other items, in addition to cave and rock-shelter walls (d’Errico Reference d'Errico1989; Reference d'Errico1995a,Reference d'Erricob; d'Errico & Cacho Reference d'Errico and Cacho1994; d'Errico et al. Reference d'Errico, Doyon and Colage2017; Marshack & d'Errico Reference Marshack and d'Errico1995; Overmann Reference Overmann2013). That artificial/external memory systems played a role in Upper Palaeolithic life is clear, but exactly what information they were recording has until now eluded us. We have proposed the existence of a notational system associated with an unambiguous animal subject, relating to biologically significant events informed by the ethological record, which allows us for the first time to understand a Palaeolithic notational system in its entirety. This utilized/allowed the function of ordinality (and, later, place value), which were revolutionary steps forward in information recording. The requirement, in ordinal representations of number, that the ‘special’ symbol at the ordinal position of the value being represented must be distinct from all other symbols in a sequence clearly invites a meaning to be associated with the special symbol. With such, there was no longer the need for a purely oral explanation of the system, as all of its components were self-contained to the point of being readable many thousands of years later. Thus, although a series of marks can of course be ambiguous, the Upper Palaeolithic written system was thus clear, unambiguous and permanent, and could have widespread meaning irrespective of any linguistic barriers (about which, of course, we know nothing), particularly given the fact that our database contains samples from across western—and some central—Europe. It made possible the accumulation and transmission of intelligible information over multiple generations, independent of the need to maintain parallel oral explanations (although of course we do not propose that these simply disappeared). This was clearly much more than a simple ‘tally’ of accumulated information. We believe that the numeric notational marks associated with the animals constituted a calendar, and given that it references natural behaviour in terms of seasons relative to a fixed point in time, we may refer to it as a phenological calendar, with a meteorological basis. It may be of greater significance, however, that it significantly backdates by thousands of years the permanent combination of information (in the form of numerosity/ordinality) with its subject (the animal/symbol).
It is unclear to us how visible, accessible, or universally shared this information would have been. While we might assume that portable art found in domestic contexts was visible to many or all, this of course does not necessarily imply that everyone could ‘read’ its message. With parietal art, at least that created in deep caves, we simply do not know who its audience were; perhaps it was viewed by many, or perhaps shared only with a minority of ‘literate’ initiates ‘in the know’ (e.g. Hayden Reference Hayden2018). Likewise, we are not claiming that the function of the system was incompatible with other aesthetic, didactic or ritual aspects of Palaeolithic visual culture (cf. Bahn Reference Bahn2016), or that it explains all associations of lines/dots with animals, or that it was practised at all times and by all groups across Upper Palaeolithic Europe. We of course acknowledge that far more examples of animal depictions occur without associated signs, and of course do not imply that our interpretations include these.
We believe that we have demonstrated the use of abstract marks to convey meaning about the behaviour of the animals with which they are associated, on European Upper Palaeolithic material culture spanning the period from ~37,000 to ~13,000 bp. In our reading, the animals integral to our analytical modules do not depict a specific individual animal, but all animals of that species, at least as experienced by the images’ creators. This synthesis of image, mathematical syntax (the ordinal/linear sequences) and signs functioning as words formed an efficient means of recording and communicating information that has at its heart the core intellectual achievement of abstraction. The ability to assign abstract signs to phenomena in the world—animals, numbers, parturition, cyclical phases of the moon—and subsequently to use these signs as representations of external reality in a material form that could be used to record past events and predict future events was a profound intellectual achievement. The pairing of animals/signs is evidence of the joining of multiple signs together in an ordered, rearrangeable, permanent and structured artificial/external information system, which used abstraction and symbols to convey complex information about the external world. A visual system such as this allowed observations to be accumulated with less unreliability than orally, and hence provided a degree of estimation of annual variability of these phenomena, and presumably to be embedded into wider artistic and behavioural and mythic contexts.
Can we call this phenological calendar based on meteorological information writing, however? In a general sense, writing can express quantity and/or commodities. As it was used to compare the numbers associated with animals rather than the animals themselves, it seems that in the Upper Palaeolithic system numbers represent discrete quantity, abstract values that could be manipulated independently of the animals that they are associated with. The value of <Y>, the position of which varies in the sequences, may be the precursor of place value, in which, for example, 5, 50 and 500 represent different values according to their position, thought to have been a Sumerian invention (d'Errico et al. Reference d'Errico, Doyon and Colage2017). An additional affordance of <Y> is that it may be the first known example of an ‘action‘ word, i.e. a verb (‘to give birth’), although we acknowledge that this is ambiguous: it could function as a noun, ‘birth’, or ‘place of birth’.
One common definition of ‘writing’ is that it is written language, i.e. not only acts as a notational system but one which has a connection to the phonetic form of the language spoken by the writer (Van de Mieroop Reference Van de Mieroop1999). Sumerologists place the origins of the development of writing around 3300 bc in the pictograms associated with abstract marks representing numbers; ‘the writing system invented or developed … of a pictographic character; its signs were drawings’ and cuneiform gradually developed out of this, which ‘is a script, not a language’ (Van de Mieroop Reference Van de Mieroop1999, 10: our emphases). Record keeping using small clay ‘tokens’ was present in the Near Eastern Neolithic in the tenth millennium bc, these objects widespread and abundant by the sixth millennium bc, and by the fourth millennium bc it is clear they were functioning, perhaps as generalized elements for simple counting tasks recording time, resources and the like, albeit among other functions that did not have a mnemonic function (Bennison-Chapman Reference Bennison-Chapman2018, 240). Cuneiform account keeping began with numerical signs in Uruk-phase Sumer (Schmandt-Besserat Reference Schmandt-Besserat1996), which by the Late Uruk period formed the precursor for writing in its combination of numerals and associated images (Englund Reference Englund, Radner and Robson2011), exactly what we have identified. In our reading, the European Upper Palaeolithic system functioned to record a subject and information about the behaviour of that subject expressed in relation to natural events; it therefore expressed far more than the tablets recording numbers of commodities from Uruk-period Mesopotamia (Steinkeller Reference Steinkeller1992). In the sense of the Sumerological use of the terms, we suggest that we can accord it the function of a script. But could the information that it recorded really be intelligible without at least the underpinning nouns for the animals, the moon and its phases, and the bonne saison and its defining events, in addition to the actions of mating and birthing? We will presumably never know the specific words for these in whatever languages were spoken in Upper Palaeolithic Europe, but we can assume that our script could be communicated orally by using them. Is this, then, not the definition of writing?
We may not be convinced that the Upper Palaeolithic sequences and associated symbols can be described as written language, given that they do not represent grammatical syntax, but they certainly functioned in the same way as proto-cuneiform. We may not describe them as ‘administrative documents’ as would a Sumerologist (e.g. Van de Mieroop Reference Van de Mieroop1999, 13), but that is exactly what they were, record-keeping of animal behaviour in systematic units of time and incorporating at least one verb. We do not want to press the controversial (and in many senses, semantic) question of whether writing was a Palaeolithic invention; perhaps it is best described as a proto-writing system, an intermediary step between a simpler notation/convention and full-blown writing. Assuming we have convinced colleagues of our correct identification, there will no doubt be a lively debate about precisely what this system should be called, and we are certainly open to suggestions. For now, we restrict our terminology to proto-writing in the form of a phrenological/meteorological calendar. It implies that a form of writing existed tens of thousands of years before the earliest Sumerian writing system.
Supplementary material
Online material may be found at https://doi.org/10.1017/S0959774322000415.


 Open access