

Introduction
Spending in competitive judicial elections has increased sharply in recent decades, reaching record levels and prompting greater scrutiny of campaign finance’s influence on judicial selection. Rising contributions have attracted increasing attention from both journalists (Liptak Reference Liptak2014) and scholars (Bonneau Reference Bonneau2007, Reference Bonneau, Bonneau and Hall2017), focusing on judicial selection and the impact of money in these elections. In 2009, former US Supreme Court Justice Sandra Day O’Connor, a vocal critic of judicial elections, observed that several judicial races in the preceding five years had cost more than the average US Senate race (Bucklo and Cole Reference Bucklo and Cole2009, 9).This pattern has persisted, notably in states such as Wisconsin, where a recent election shattered spending records (Waldman Reference Waldman2025).Footnote 1 Donations from both individuals and interest groups are now routine (Bannon, Lisk, and Hardin Reference Bannon, Lisk and Hardin2017). During the 2021–2022 election cycle, total spending in judicial races exceeded $100 million in 26 states.Footnote 2 The Brennan Center for Justice, an advocate for judicial independence, has warned that “fair and impartial justice is under threat in state supreme courts across the country” (Bannon Reference Bannon2018).
Nearly, 90% of respondents to a 2013 poll believed that campaign contributions influence judicial decisions (Brennan Center for Justice 2013). Although electoral competition in judicial races stabilized during the twenty-first century (Kritzer Reference Kritzer2015), the cost of these elections has continued to rise. Notably, recent years have seen an increase in high-cost contests and a greater involvement of outside groups (Keith Reference Keith2024), intensifying concerns about judicial impartiality and creating new challenges for policymakers. As money continues to flow into judicial campaigns, public perceptions of judicial bias and fairness remain at risk (Cann and Yates Reference Cann and Yates2016). These developments underscore the urgent need to address the influence of campaign finance on the integrity of state courts.
Studying individual donors in state supreme court elections
Our study addresses fundraising by state supreme court campaigns from individual donors during the era of “new style” judicial elections. Across studies of judicial elections, we observe a prominent role for individual donors (Bonneau Reference Bonneau2007, Reference Bonneau, Bonneau and Hall2017), as well as non-individual donors (Keith Reference Keith2024). We seek to better understand differences among judicial campaign donors and how incentives for participation differ by individual occupational groups. We focus on three categories of individual donors – attorneys, non-attorneys, and business donors (a subset of non-attorney donors). By evaluating the individual contributors that judicial campaigns attract, rather than money raised from corporations, interest groups, or political parties, we may better understand ongoing trends affecting individual donors, as well as the impact of candidate and office characteristics on judicial campaign fundraising.
Campaign fundraising and attorney donors
The dynamics of campaign fundraising in modern judicial elections remain complex and not fully understood. Earlier research (Bonneau Reference Bonneau2007) has shown links between fundraising and candidate attributes, but the motivations driving individual donors are less clear. Historically, only about 10% of Americans have contributed to political campaigns (Rosenstone and Hansen Reference Rosenstone and Hansen1993). Today, individuals represent the largest source of contributions in both state and federal elections (Jacobson and Carson Reference Jacobson and Carson2015; La Raja and Schaffner Reference La Raja and Schaffner2015). Studies show that donors are typically older, male, white, affluent, and hold ideologically extreme views (Francia et al. Reference Francia, Green, Herrnson, Powell and Wilcox2003; La Raja and Schaffner Reference La Raja and Schaffner2015). Additionally, donors tend to support incumbents and are more active in closely contested elections (Bonneau Reference Bonneau2007; Francia et al. Reference Francia, Green, Herrnson, Powell and Wilcox2003).
A primary focus of our study is the unique role of attorney donors in judicial elections. Bonica and Sen (Reference Bonica and Sen2021) note that American courts, including state courts selected by elections, are “captured” due to the power wielded by the legal profession.Footnote 3 Attorneys regulate judges through three mechanisms: (1) control over attributes of judicial selection, (2) restrictions over the performance of judges, and (3) professional oversight over the pool of judges (Bonica and Sen Reference Bonica and Sen2021, 94). Further, for many years, attorneys have given a large proportion of contributions to judicial campaigns (Bannon, Lisk, and Hardin Reference Bannon, Lisk and Hardin2017; Goldberg et al. Reference Goldberg, Samis, Edwin and Weiss2005). Together, we see an essential connection between attorneys and judges. Judges come from the ranks of practicing attorneys, and attorneys present cases before those same judges and are active donors in states where judges are elected.
Characteristics of attorneys, however, differ from the population at large. Though once more conservative than the average politician or voter (Eulau and Sprague Reference Eulau and Sprague1964), attorneys now fall to the left on the ideological spectrum. Attorneys are more liberal than most state judges and state politicians and voters who influence judicial selection (Bonica and Sen Reference Bonica and Sen2021, 129–30). The ideological or partisan leanings of attorneys also differ from individuals active in other industries, including professionals in accounting, finance, and medicine, which track in a more conservative direction (Bonica and Sen Reference Bonica and Sen2021). Election and public opinion research find voters connected to business are more pro-Republican than attorneys (Gelman et al. Reference Gelman, Park, Shor and Cortina2010).
Building on our understanding of contributor preferences, we explore the differing incentives for attorneys and non-attorneys to give to judicial campaigns. Our study examines each contested state supreme court election from 2000 to 2023 and donations from different occupational categories of individual donors, including attorneys and non-attorneys. Special attention is given to business donors, a category of non-attorney donors, which have been found (Bonica Reference Bonica2016; Gelman et al. Reference Gelman, Park, Shor and Cortina2010) to be more right-leaning than the more liberal preferences of attorneys (Bonica and Sen Reference Bonica and Sen2021).Footnote 4 For all donors – attorney or non-attorney – we reason that campaigns perform best when they attract like-minded donors and when a candidate advances the personal interests of a donor.
Over the first two decades of the twenty-first century, individual donation patterns in state supreme court elections shifted significantly. Attorneys tended to contribute more to incumbents and candidates with prior judicial experience, especially those affiliated with the Democratic Party. In contrast, non-attorneys and business donors favored Republican candidates and were particularly active in open seat elections. These donors also gave larger sums when the judicial office offered greater long-term value – such as influencing the partisan balance of the court or holding broader policymaking authority. Overall, while incumbency attracted support across all donor groups, attorneys were especially responsive to judicial experience and Democratic Party affiliation, and non-attorneys and business donors prioritized opportunities for investment and partisan advantage.
A theoretical framework for understanding attorney and non-attorney donations
In this section, we describe our theoretical expectations for donations to state supreme court campaigns by individual contributors, including those by attorneys, non-attorneys, and business donors. We apply extant theory to the incentives for donations in judicial elections. A critical part of our analysis is the unique motivations for giving to judicial campaigns, including divergent investment strategies used by attorney and non-attorney donors. With attorneys and business donors highly active in recent election cycles (Bannon, Lisk, and Hardin Reference Bannon, Lisk and Hardin2017), we expect that judicial campaigns connect in different ways to attorney and non-attorney donors and that these relationships are more acute in the modern era of judicial elections.
According to Francia et al. (Reference Francia, Green, Herrnson, Powell and Wilcox2003) and later refined by Magleby, Goodliffe, and Olsen (Reference Magleby, Goodliffe and Olsen2018), campaign contributors divide into four categories – investors, ideologues, intimates, and incidentals.Footnote 5 Two categories, investors and ideologues, are most prominent in elections in the United States, with investors motivated by material gains and ideologues motivated by purposive or ideological goals. As an occupation routinely affected by judges and their decisions, attorneys are primarily investors seeking material benefits and narrow policy outcomes.Footnote 6 Research also documents the ideological placement of attorneys toward the left of the ideological spectrum (Bonica and Sen Reference Bonica and Sen2021).Footnote 7 Combining the material benefit-seeking and ideological preferences of attorneys, we expect that candidates with experience (incumbents and candidates with lower court experience) and those connected to the Democratic Party will perform well with attorneys.Footnote 8
Though a more diverse group of donors, we expect non-attorneys and business donors to have predispositions that differ from those of attorneys. With business donors, a subset of non-attorneys, we expect greater ideological cohesion and a more conservative group of donors (Bonica Reference Bonica2016; Gelman et al. Reference Gelman, Park, Shor and Cortina2010).Footnote 9 Noting the financial tug-of-war that exists in this era of competitive elections, we expect that more conservative (and Republican) candidates, likely perceived as more likely to overturn civil awards (Brace, Yates, and Boyea Reference Brace, Yates and Boyea2012) and roll back tort law (Kagan Reference Kagan2009), will receive greater support from non-attorneys and business donors.
Candidate experience
Candidates’ characteristics should matter differently across groups of individual donors. We expect that candidates with judicial experience will draw distinctive levels of support from attorneys and non-attorney/business donors. Unlike most non-attorneys and business donors, attorneys are repeat players (Galanter Reference Galanter1974) and may appear before judges that previously sought election (Reddick and DeBuse Reference Reddick and Debuse2010). Though only a small percentage of attorneys appear before state supreme courts on a regular basis, justices do often receive contributions from lawyers that have represented a party in a state supreme court case (Cann Reference Cann2007). Given their increased probability of winning, we expect that experienced incumbents (Moskal and Waltenburg Reference Moskal and Waltenburg2025) and candidates with lower court experience (Boyea Reference Boyea2017) will attract more support from attorneys than non-attorneys or business donors. Consistent with the prior literature (Edelstein and Benesh Reference Edelstein and Benesh2024), we also expect that individual donors, generally, will respond to the salience of open seat elections, donating larger sums to campaigns where an incumbent judge does not seek reelection.
Hypothesis 1A: Candidates with judicial experience will receive larger contributions from attorney donors than from non-attorneys and business donors.
Hypothesis 1B: Open seat elections will receive larger contributions from individual donors than incumbent-challenger races.
Candidate partisanship
Ideological or purposive motivations should connect candidates to like-minded donors. We expect that candidates tied to the Democratic Party, the more liberal party in each of the American states (Erikson, Wright, and McIver Reference Erikson, Wright and McIver1993), will attract donors from the legal profession.Footnote 10 Attorneys should align their left-leaning preferences to the pro-plaintiff inclinations of a Democratic bench and avoid Republican candidates who are more likely to overturn plaintiff awards. We expect weaker support from non-attorneys and business donors for Democratic candidates and stronger support for Republican candidates.
Hypothesis 2: Left-leaning Democratic candidates will attract larger investments from attorney donors, while right-leaning Republican candidates will receive larger donations from non-attorneys and business donors.
Office value and policymaking role
While attorney investments should be motivated by judicial experience and a judge’s ideological or partisan identification, non-attorneys and business donors should respond to courts with enhanced value and broader policymaking authority. We expect larger investments by non-attorneys and business donors where judges are elected statewide rather than by district and where elections include explicit partisan signals. Office characteristics that enhance the value of a judicial position should also matter. We anticipate larger investments from non-attorneys and business donor where judges have a longer capacity to serve, courts are larger, courts operate above an intermediate appellate court, and where courts are more professionalized. Elections that decide a court’s partisan majority should also encourage larger donations. Though attributes of elections, structures of office, and partisan control may influence all donors, including attorneys and non-attorneys, these features are expected to encourage larger contributions from non-attorneys and business donors than attorneys.Footnote 11
Hypothesis 3: Judicial campaigns will receive larger amounts from non-attorneys and business donors where states use at-large representation, elections include explicit partisan signals, judicial positions have greater value and broad policymaking authority, and where a court’s partisan majority is at stake.
Data and methodology
To test our expectations about individual donor activity in state supreme court elections, we use data collected by OpenSecrets and its FollowTheMoney.org data archive. OpenSecrets collects campaign finance data from each state’s disclosure agency, including contribution records for each of the 576 contested supreme court campaigns between 2000 and 2023.Footnote 12 We evaluate only contested elections in the 22 states with competitive judicial elections since campaigns must communicate with and mobilize citizens. Retention elections are not evaluated due to their non-contested nature.
Within the campaign finance data collected by OpenSecrets, a standardized list of industries is applied to each individual donor to classify their occupation and employer information. OpenSecrets notes that states generally require campaign contributors to identify their profession, allowing most contributors to be accurately assigned to an industry. We applied the industry lists created by OpenSecrets to separate individual donors into three professional categories: attorneys, non-attorneys, and business donors. With a focus on individual donors, our study does not evaluate money donated by non-individual entities including corporations, interest groups, or political parties. While donations from non-individuals are fundamentally important for judicial campaigns, the incentives for giving are likely different from individual donors. By exploring funds raised from individuals and individual donors by occupation, we may better isolate the challenges of campaigns for encouraging individual donations.
A now-extensive body of data exists to explore features of state courts and judicial elections. From Brace and M.G. Hall’s State Supreme Court Data Archive (Brace and Butler Reference Brace and Butler2001) to M.E.K. Hall and Windett’s New Data on State Supreme Courts (M.E.K. Hall and Windett Reference Hall and Windett2013) to Bonica’s Database on Ideology, Money in Politics, and Elections (Bonica Reference Bonica2024), researchers have collected wide-ranging data to understand how state courts operate and the forces that affect judicial elections. With state court elections, studies by Melinda Gann Hall (Reference Hall2007, Reference Hall2015), Chris Bonneau (Reference Bonneau, Bonneau and Hall2017), and Bert Kritzer (Reference Kritzer2011, Reference Kritzer2015), among others, show an improved understanding of judicial election outcomes, voter turnout, and spending during the transition to the “new style” of judicial elections. With OpenSecret’s collection of contribution data, scholars have an opportunity to investigate questions about judicial campaign fundraising and how fundraising from individuals correlates with attributes of campaigns and state environments.
Modeling strategy
Our research involves candidate attributes nested in states. As such, we estimate multilevel models with random intercepts, which allows estimates of two or more levels of analysis. Candidate and state-level variables are used here to predict the amounts donated by individuals and separately for attorneys, non-attorneys, and business donors. With information about candidates nested in states, we address dependence between levels of analysis. An alternative approach is to use ordinary least squares (OLS) analysis. While the results are substantively similar when using OLS, that technique is inappropriate for models with multiple levels due to the assumption that coefficients are independent from other explanatory variables.
Dependent variables
To understand investments by individual donors and categories of individual donors in judicial campaigns, our general dependent variable (individual donations) is the natural log of the total amount of money raised from individual donors by candidate. To consider differences relating to how campaigns attract diverse groups of contributors, we have separated individual donations into three occupational categories: (1) attorneys (attorney donations), (2) non-attorneys (non-attorney donations), and (3) business donors (business donations). Non-attorney donors include all individual donors that are not attorneys, including employment areas tied to business, government agencies, labor, ideological groups, and political parties.Footnote 13 Individuals classified as business donors, a subset of non-attorney donors, include those in industries connected to agriculture, communications, construction, defense, energy, finance, general business, health, and transportation. To make donations comparable over time, we have adjusted donations to constant dollars (2023) using the Consumer Price Index.Footnote 14
Independent variables
The models of individual donations account for factors known to affect judicial elections and participation by donors and voters. Of the candidate and election level variables associated with candidate experience and partisan affiliation, we include measures for when an experienced state supreme court justice seeks reelection (incumbent),Footnote 15 where an experienced lower court judge seeks a position on the state high court (quality candidate), when a race involves an open seat (open seat), and the partisan affiliation of a candidate (Democrat).Footnote 16
For our state-level predictors of office value and the policymaking authority of state supreme courts, we consider whether an election takes place at the district or statewide level (district election) and whether an election ballot design is partisan or nonpartisan (partisan election). We also consider the length of the term of office (term length), the number of seats in a state’s supreme court (court size), whether a lower appellate court operates below a state supreme court (lower appellate court), the resources of a state supreme court using Squire and Butcher’s (Reference Squire and Butcher2021) updated measure of professionalization (professionalization), and whether partisan control of a state supreme court can be altered by the outcome(s) of an election year (partisan takeover). For each candidate and election variable, we consulted state records, newspapers, Ballotpedia, campaign websites, and contribution records to discern the correct candidate or election attributes.
We have thought carefully about other factors tied to contributions to political campaigns, including race-, candidate-, and state-specific attributes of judicial elections. As such, we have incorporated campaign and election controls relating to candidate gender (female), campaigns that accepted public campaign support (public funds),Footnote 17 and elections that decided a court’s leadership (chief justice race).Footnote 18 Controls relating to state environments include whether a race in the prior election cycle was won by 55% or less (competitive court), a factor variable that evaluates five levels of severity for state contribution limits (contribution limit: 1st–25th percentiles – the base category, contribution limit: 26th–50th percentiles, contribution limit: 51st–75th percentiles, contribution limit: 76th percentile to max limit, contribution limit: no limit),Footnote 19 two judicial canons (post-White clause, solicitation limit),Footnote 20 a control for states in the southern region (South),Footnote 21 and each state’s population (population).Footnote 22 In the interest of space, Table 1 presents a detailed description of the variables used in our models, and Appendix B of the Supplementary Material provides histograms for the dependent variables and descriptive statistics for each dependent and independent variable.
Descriptive statistics

Table 1. Long description
The table has two columns: Variable and Description. The first section, Dependent variables, includes Individual donations, Attorney donations, Non-attorney donations, and Business donations, each defined as the log of total fundraising by a campaign in 2023 dollars, specifying the donor type. The next section, Candidate/election variables, lists Incumbent (1 if candidate is an incumbent judge, 0 otherwise), Quality candidate (1 if non-incumbent has lower court experience, 0 otherwise), Open seat (1 if no incumbent is running, 0 otherwise), Democrat (1 if aligned with Democratic Party, 0 otherwise), Female (1 if candidate identifies as female, 0 otherwise), Public funds (1 if candidate accepted public campaign support, 0 otherwise), and Chief justice race (1 if for chief justice seat, 0 otherwise). The final section, State variables, includes District election (1 if held in a district, 0 otherwise), Partisan election (1 if partisan, 0 otherwise), Term length (6–12 years), Court size (5–9 seats), Lower appellate court (1 if present, 0 otherwise), Professionalization (0.29–0.938, Squire and Butcher’s index), Partisan takeover (1 if outcome changes partisan majority, 0 otherwise), Competitive court (1 if prior cycle decided by 55 percent or less, 0 otherwise), four Contribution limit variables (coded 1 if state falls within specified percentile range or has no limit), Post-White clause (1 if adopted, 0 otherwise), Solicitation limit (1 if adopted, 0 otherwise), South (1 if state is in the southern region, 0 otherwise), and Population (state population in thousands). Section labels are italicized and span both columns.
Results
Descriptive overview of individual contributions
Contributions by individuals over the first two decades of the twenty-first century fluctuated significantly. Using data from OpenSecrets, we find that at the turn of the century and well into the era of “new style” judicial politics, individual donors contributed about half (50.04%) of the total money donated to judicial campaigns. From the beginning of the century through 2023, individual giving ranged from 50.5% of electoral receipts in 2000–2001 to 43% in 2022–2023. While the percentage of individual donations ebbed and flowed, individual donors have made up a large and important share of total giving to state supreme court races.
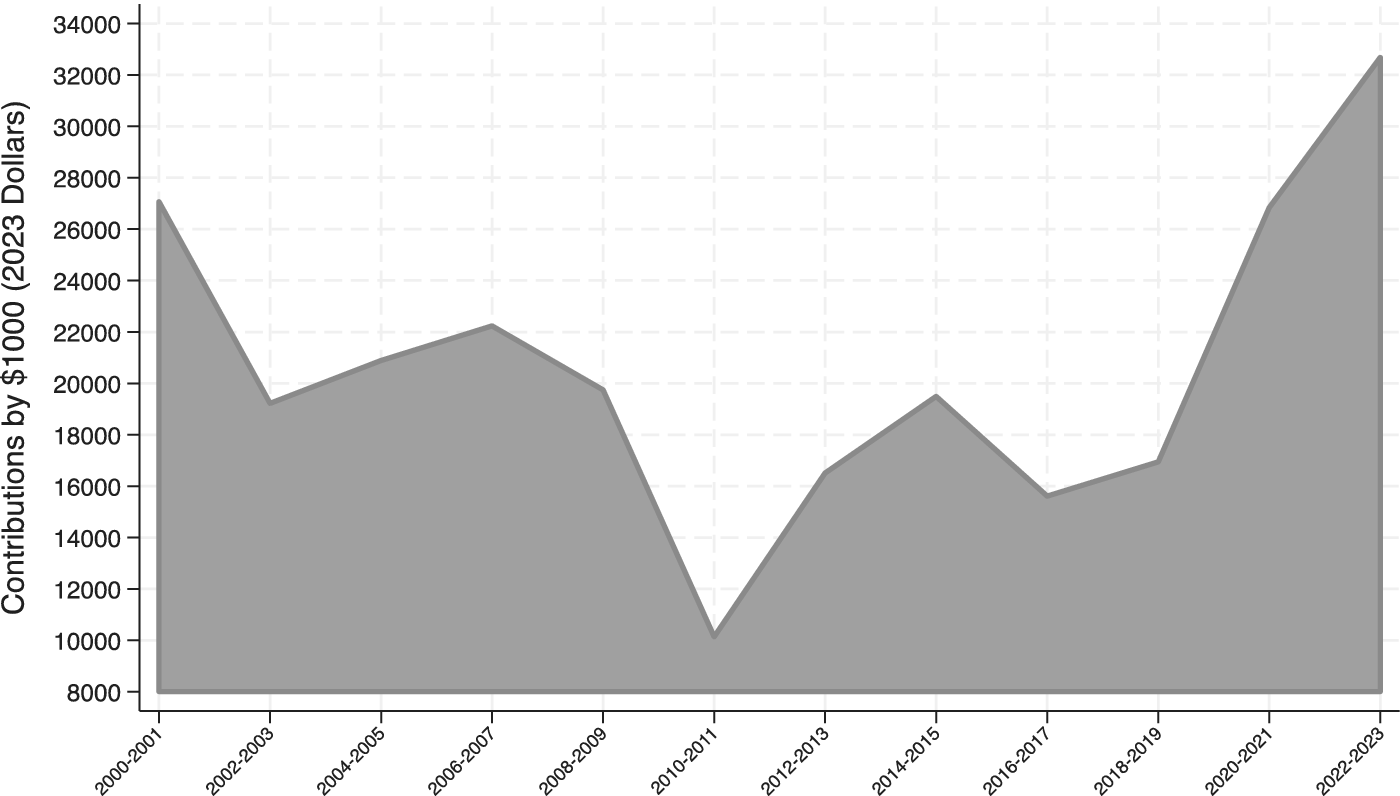
In Figure 1, we show specific patterns of individual donations to state supreme court campaigns with contributions displayed using $1,000 increments. We confirm the trends noted by Kritzer (Reference Kritzer2015) and others showing increased electoral stability during the early twenty-first century, with individual donations following that pattern. Using two-year election cycles and constant dollars (2023) to examine donation patterns, individual donors contributed $27 million during the 2000–2001 election cycle. The sum of individual donations then dropped through the 2010–2011 election cycle to $10.1 million, before increasing from 2012 through 2023. Individual donations again reached $27 million during the 2020–2021 election cycle and then $32 million during the 2022–2023 cycle. Individual donors, while now a smaller share of donations, currently donate larger amounts than at any point this century.
Individuals donations by election cycle.

Figure 1. Long description
The graph has the x-axis labeled with election cycles from 2000-2001 to 2022-2023, and the y-axis labeled Contributions by $1000 (2023 Dollars) ranging from 8000 to 34000. Starting at about 27000 in 2000-2001, contributions drop to about 19000 in 2002-2003, then rise gradually to about 22000 in 2008-2009. There is a sharp decline to the lowest point, near 9000, in 2010-2011. Afterward, contributions increase, peaking at about 34000 in 2022-2023. The area under the line is shaded gray, emphasizing the magnitude of contributions over time.
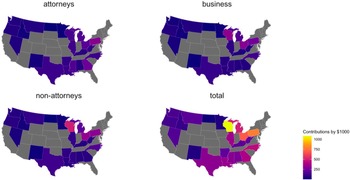
Figure 2 displays the patterns of average individual donations throughout the 22 states with judicial elections. We present in Figure 2 the non-transformed value of individual contributions and display contributions using $1,000 increments. Lighter colors represent states with higher individual giving, while darker shades show smaller individual donations. States shaded gray do not use competitive judicial elections. Contributors and different occupational sectors of contributors were very active in several states but less in others. With average giving by individual donors (lower right panel), contributors in Wisconsin were most generous with more than one million dollars donated per campaign. Average individual contributions were next highest in Pennsylvania and Ohio. Individual donations in North Dakota were smallest throughout the 22 states with competitive judicial elections with average giving just above $14,000 per campaign.
Individual donations by state.
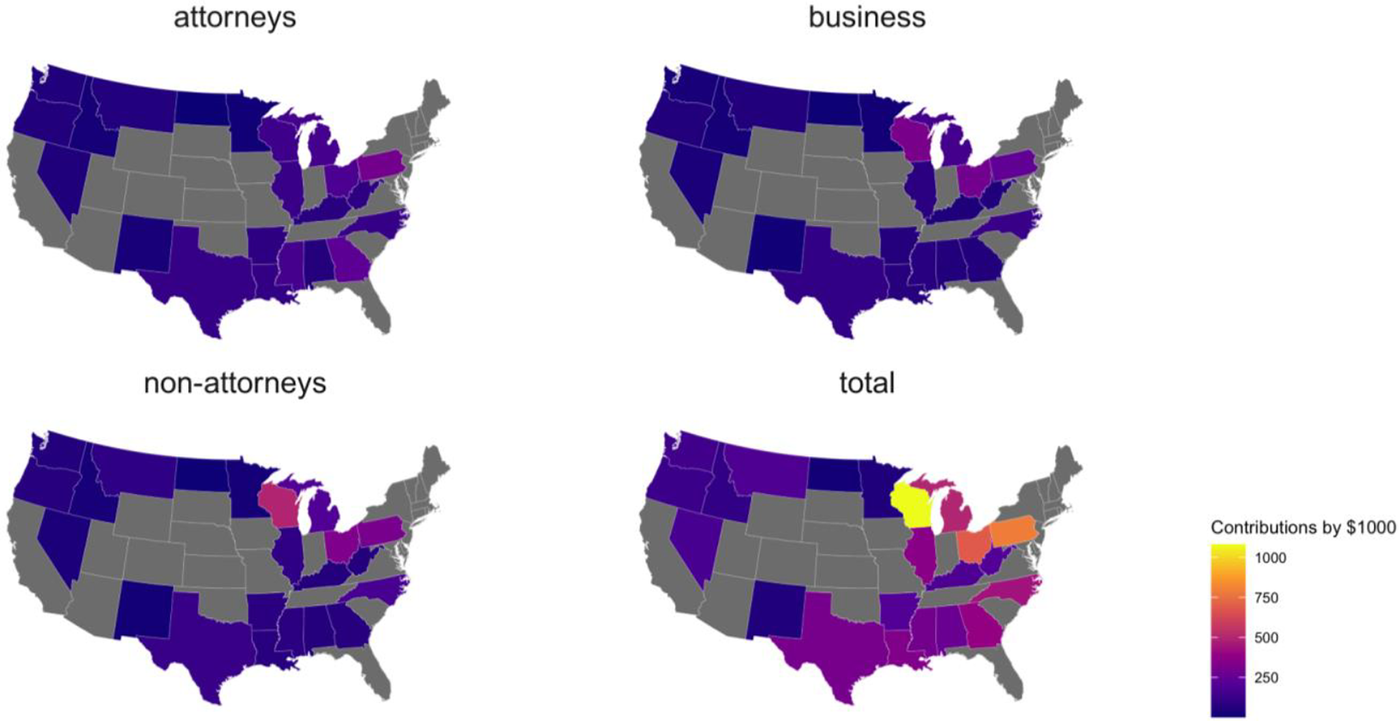
Figure 2. Long description
Top left panel labeled attorneys shows most states in dark purple, with higher contributions in Illinois, Ohio, and Pennsylvania. Top right panel labeled business displays a similar pattern, with Illinois and Pennsylvania more prominent. Bottom left panel labeled non-attorneys highlights Illinois with the brightest magenta, indicating the highest non-attorney contributions, while other states remain dark purple. Bottom right panel labeled total shows Illinois in yellow, Ohio in orange, and Pennsylvania in magenta, indicating the highest total contributions. The color scale at the bottom right ranges from dark purple for low contributions to yellow for the highest, with increments at 250, 500, 750, and 1000 thousand dollars. States with no data are gray.
With mean donations from attorneys (upper left panel), those in Pennsylvania ($295,000/campaign), followed by Georgia, gave larger sums than in other states. The smallest attorney donations were found in North Dakota with total attorney giving averaging less than $100 per campaign. Non-attorney donations followed the general pattern for individual donors with Wisconsin ($495,000/campaign) having the highest average amounts, followed by Ohio and Pennsylvania. North Dakota again had the smallest activity with non-attorneys giving just $5,600 per campaign. Business donors (upper right panel) in Wisconsin ($317,000/campaign) were most active, followed by Ohio and Pennsylvania. Business donors in North Dakota were least charitable giving an average of $5,600 per campaign. Throughout Figure 2, we see that states are far from uniform with varying degrees of individual activity by employment sector.
To provide a more complete understanding of judicial campaign contributions, Appendix C of the Supplementary Material reports the total amounts (adjusted 2023 dollars) donated by the three occupational categories by state and election cycle. We further report the ratio of attorney to non-attorney giving and the ratio of attorney to business donor giving by state and election cycle. We found non-attorneys to be more active than attorneys in most states and election cycles. Attorneys, however, gave larger sums than business donors by state and election cycle.
Regression results
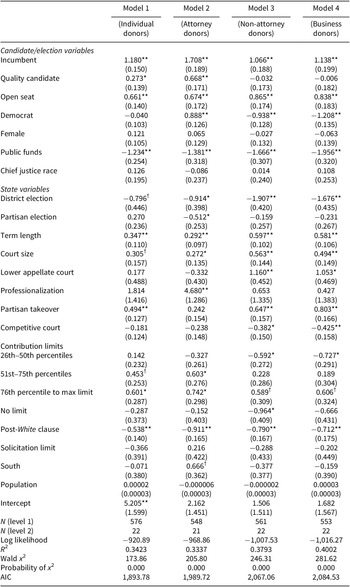
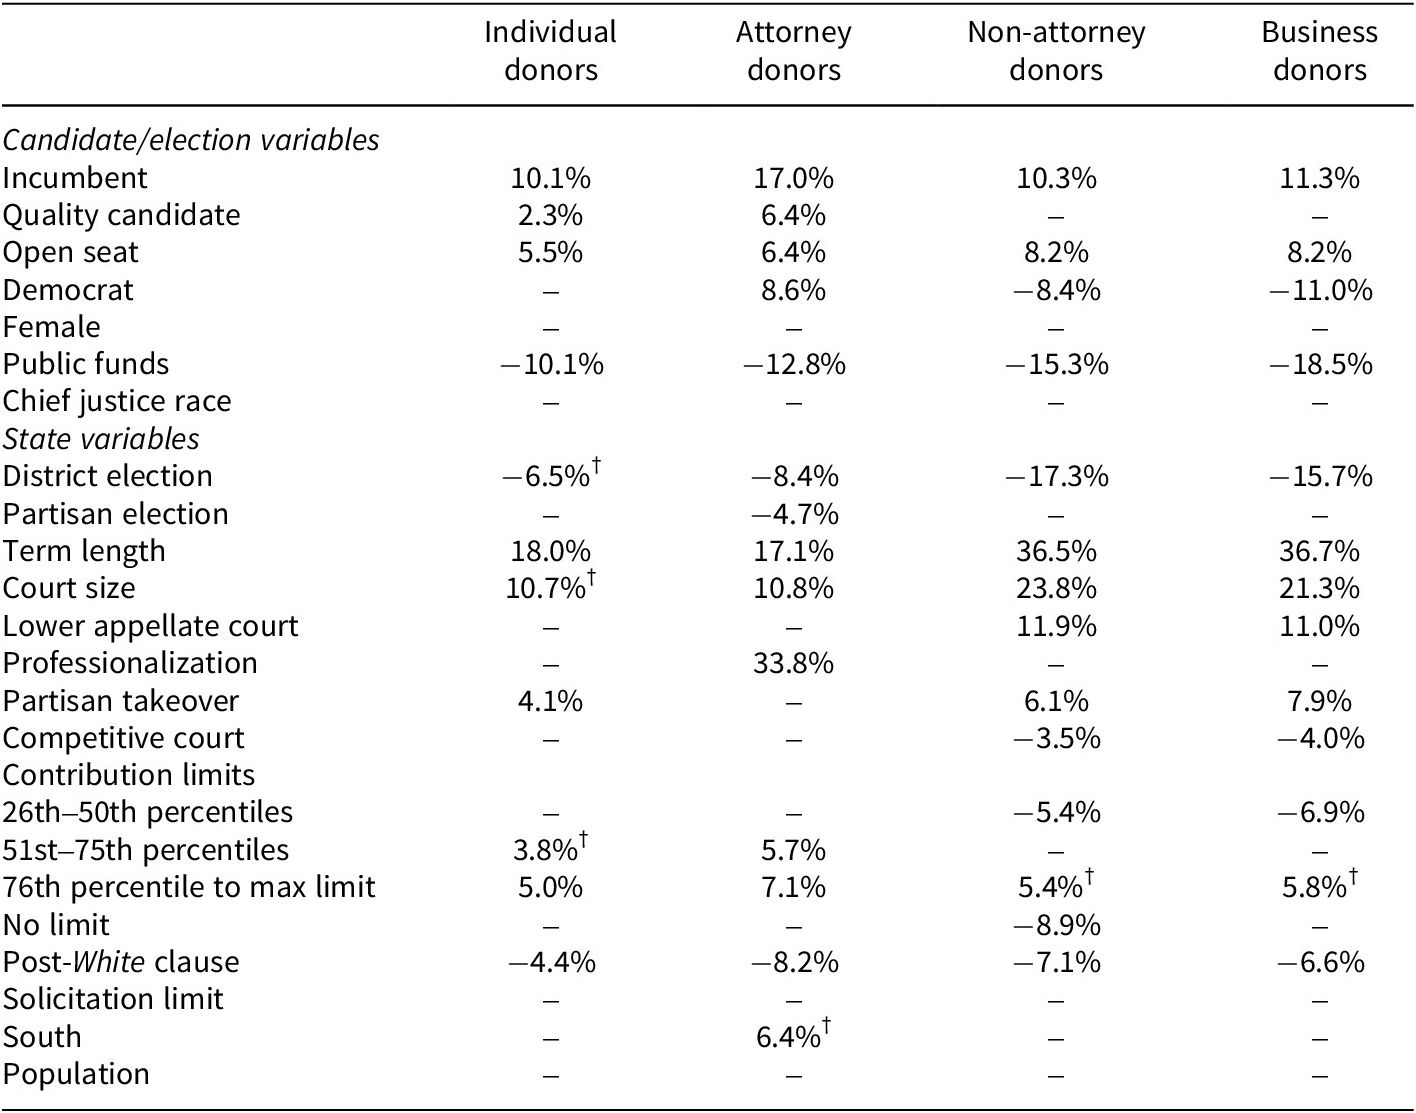
In Table 2, we report models that estimate contributions from all individual donors (Model 1), as well as attorney donors (Model 2), non-attorney donors (Model 3), and business donors (Model 4). The marginal effects for Models 1–4 can be found in Table 3, and plots of the marginal effects with associated confidence intervals can be found in Appendix D of the Supplementary Material. To allow an easier interpretation of the marginal effects of our explanatory variables on individual donations, we note in Table 3 the percentage change in the dependent variable where we consider change across the full range (minimum to maximum) of an explanatory variable.
Multilevel models predicting individual donations, contested elections, 2000–2023
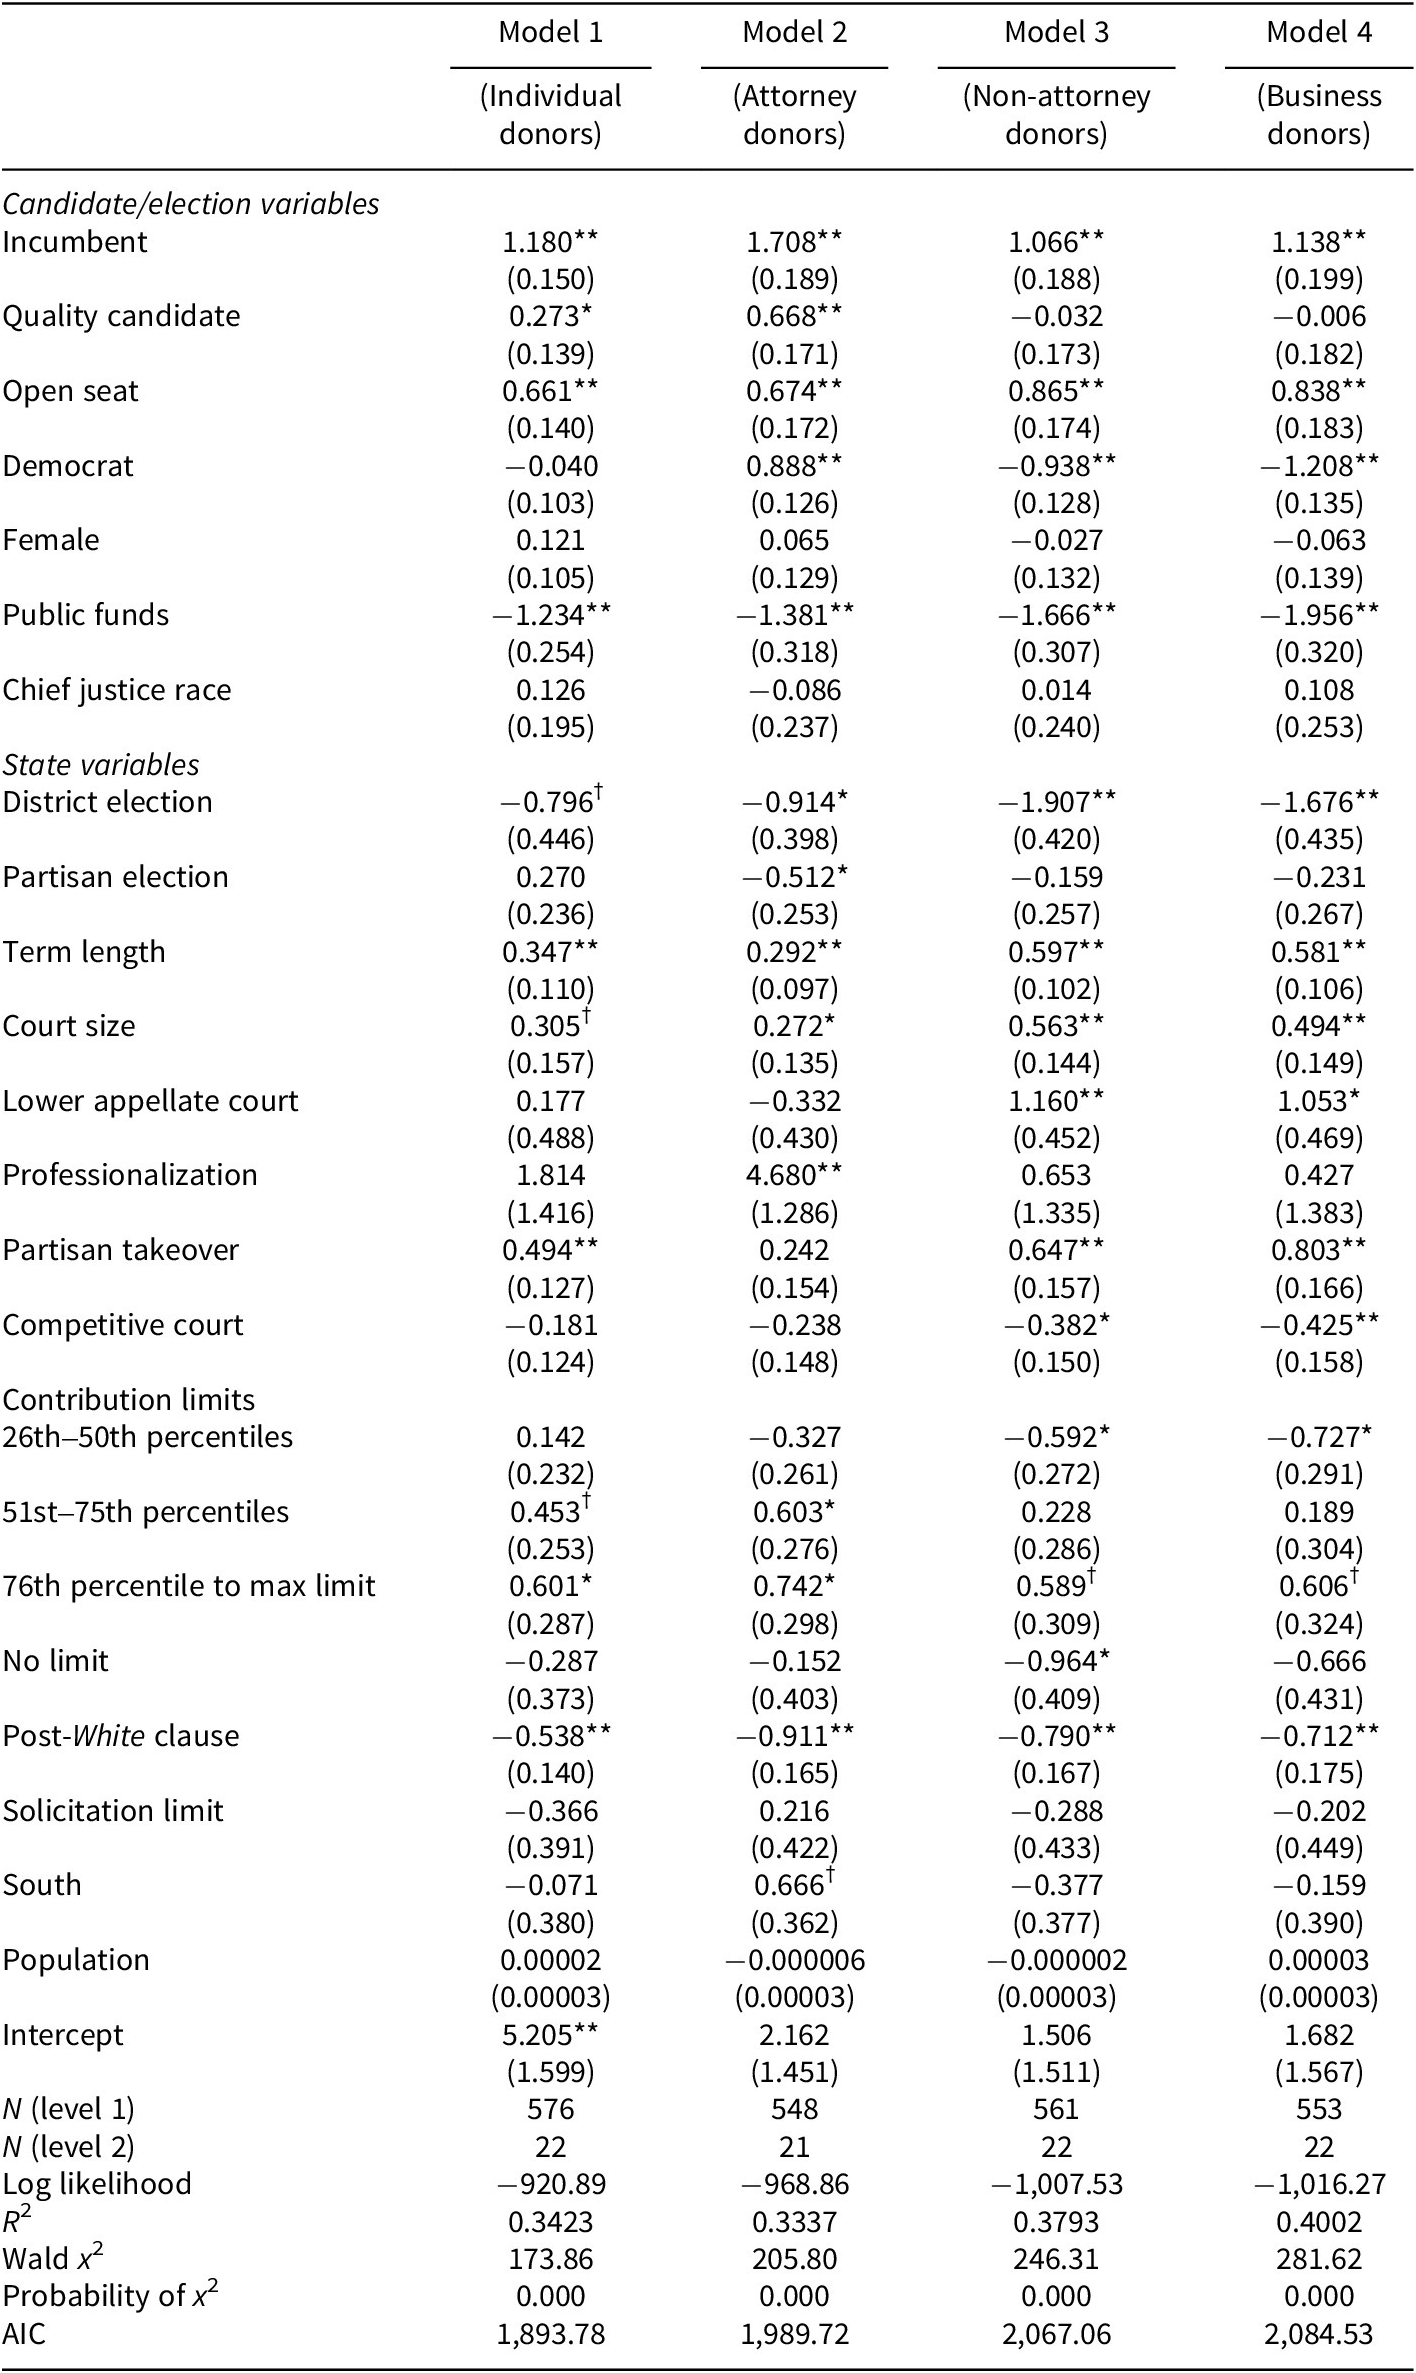
Table 2. Long description
The table presents four columns for Model 1 (Individual donors), Model 2 (Attorney donors), Model 3 (Non-attorney donors), and Model 4 (Business donors). Each row lists a predictor variable on the left, with its coefficient and standard error for each model. Significant predictors are marked with double asterisks for p less than 0.01, single asterisk for p less than 0.05, and dagger for p less than 0.1. For candidate and election variables, Incumbent status is positive and highly significant in all models, with coefficients ranging from 1.066 to 1.708. Quality candidate is significant and positive for Models 1 and 2, but not for Models 3 and 4. Open seat is positive and significant in all models. Democrat is significant and positive for attorney donors, but negative and significant for non-attorney and business donors. Female is not significant in any model. Public funds is negative and highly significant in all models. Chief justice race is not significant. For state variables, District election is negative and significant in Models 2, 3, and 4. Partisan election is negative and significant only for attorney donors. Term length and court size are positive and significant in all models except Model 1 for court size. Lower appellate court is positive and significant for non-attorney and business donors. Professionalization is significant only for attorney donors. Partisan takeover is positive and significant in Models 1, 3, and 4. Competitive court is negative and significant for non-attorney and business donors. For contribution limits, the 26th to 50th percentile is negative and significant for non-attorney and business donors. The 51st to 75th percentile is positive and significant for attorney donors. The 76th percentile to max limit is positive and significant for Models 1 and 2. No limit is negative and significant for non-attorney donors. Post-White clause is negative and highly significant in all models. Solicitation limit and South are not significant except for South in Model 2. Population is not significant in any model. Intercepts, sample sizes, log likelihood, R squared, Wald chi-squared, probability of chi-squared, and A I C values are provided for each model. The dependent variable is the natural logarithm of the amount raised from individual contributors in 2023 dollars, with standard errors in parentheses.
Note: Dependent variable is natural logarithm of amount raised from individual contributors (2023 dollars); standard errors are in parentheses, AIC = Akaike information criterion. **p < 0.01, *p < 0.05, †p < 0.1, two-tailed test of significance.
Marginal effects for models of individual donations
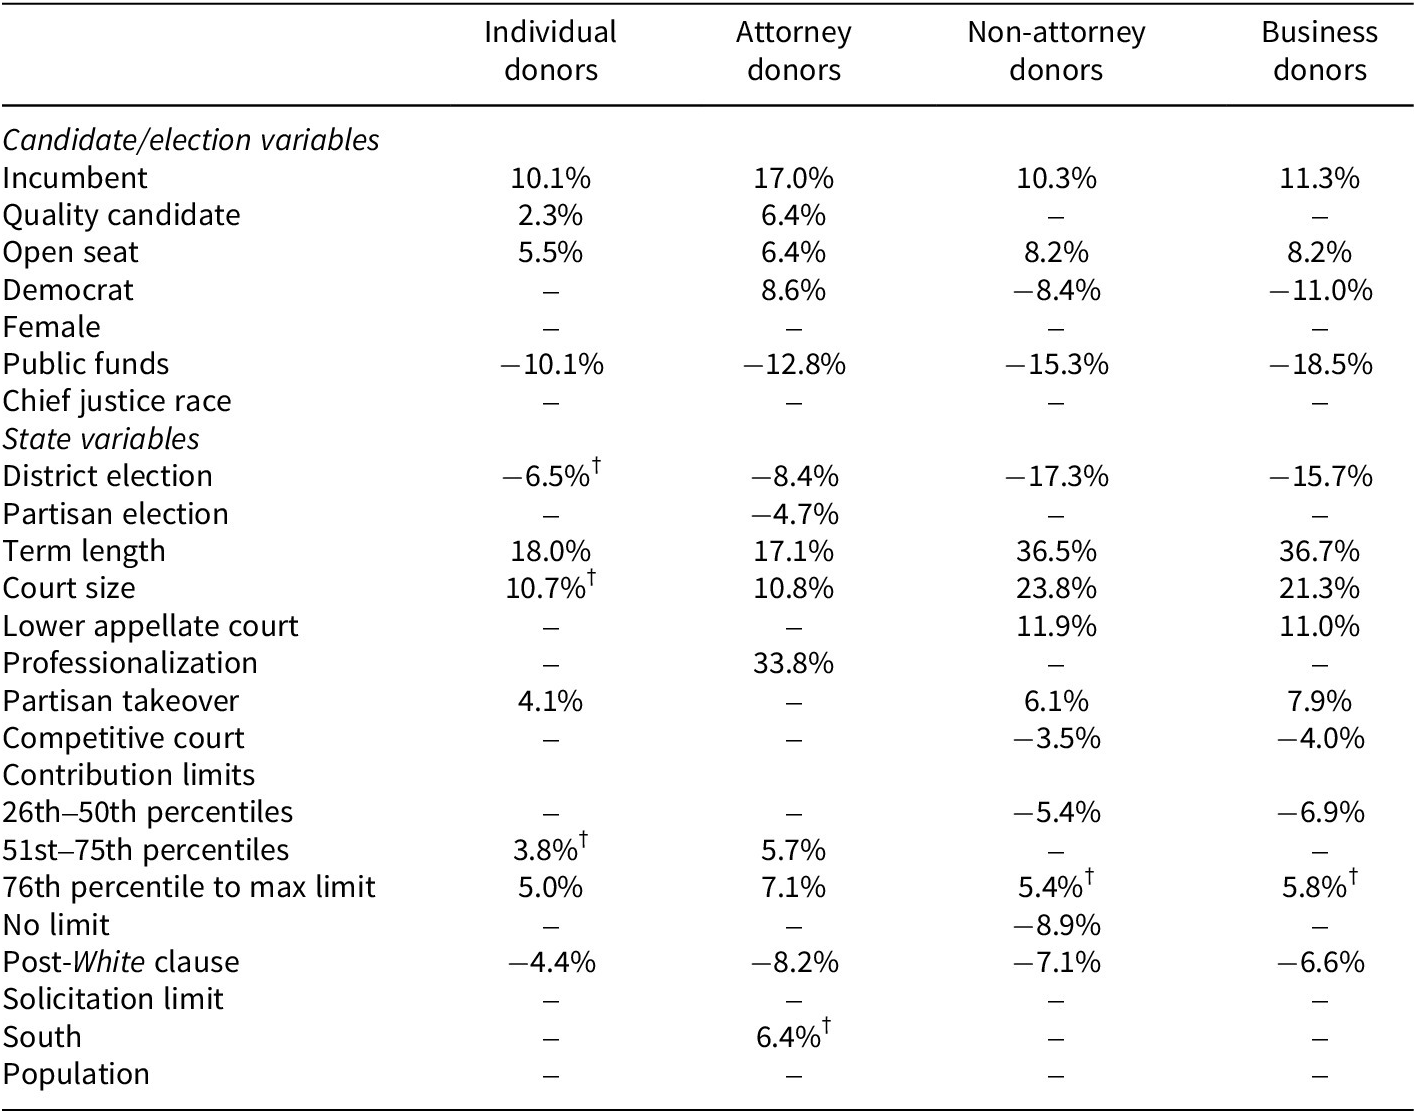
Table 3. Long description
The table has four main columns for donor types: individual donors, attorney donors, non-attorney donors, and business donors. The first section lists candidate or election variables. For ‘Incumbent’, the percent changes are 10.1, 17.0, 10.3, and 11.3 respectively. ‘Quality candidate’ shows 2.3 for individual, 6.4 for attorney, and dashes for the others. ‘Open seat’ has 5.5, 6.4, 8.2, and 8.2. ‘Democrat’ is dash, 8.6, minus 8.4, and minus 11.0. ‘Female’ and ‘Chief justice race’ are dashes for all. ‘Public funds’ is minus 10.1, minus 12.8, minus 15.3, and minus 18.5. The next section lists state variables. ‘District election’ is minus 6.5 (marginally significant), minus 8.4, minus 17.3, and minus 15.7. ‘Partisan election’ is dash, minus 4.7, dash, dash. ‘Term length’ is 18.0, 17.1, 36.5, and 36.7. ‘Court size’ is 10.7 (marginally significant), 10.8, 23.8, and 21.3. ‘Lower appellate court’ is dash, dash, 11.9, and 11.0. ‘Professionalization’ is dash, 33.8, dash, dash. ‘Partisan takeover’ is 4.1, dash, 6.1, and 7.9. ‘Competitive court’ is dash, dash, minus 3.5, and minus 4.0. For ‘Contribution limits’, the next three rows are 26th–50th percentiles (dash, dash, minus 5.4, minus 6.9), 51st–75th percentiles (3.8 marginally significant, 5.7, dash, dash), and 76th percentile to max limit (5.0, 7.1, 5.4 marginally significant, 5.8 marginally significant). ‘No limit’ is dash, dash, minus 8.9, dash. ‘Post-White clause’ is minus 4.4, minus 8.2, minus 7.1, minus 6.6. ‘Solicitation limit’ and ‘Population’ are dashes for all. ‘South’ is dash, 6.4 marginally significant, dash, dash. Notes indicate values are percent change in natural log of amount raised. Marginal significance is marked by a dagger and defined as p less than 0.1.
Note: Values represent percent change in natural log of amount raised from individual contributors.
† Relationship is marginally significant (p < 0.1).
The results in Table 2 support our expectations about how office experience affects individual donations. Experienced incumbents performed well across all groups of individual donors but especially well among attorneys. Among all individual donors, contributions to incumbent candidates were 10.1% higher than those to challengers. Attorneys were more receptive to incumbents, with attorneys giving 17% larger contributions to incumbents than to challengers. Non-attorney (10.3%) and business donors (11.3%) were also more supportive of incumbents than challengers, yet the impact of incumbency was noticeably smaller than for attorneys. With lower court experience, individual donations were associated with lower court experience, giving 2.3% larger donations than to candidates without experience. Among attorney donors, lower court experience was even more valued with quality candidates receiving donations that were 6.4% larger than those given to candidates without experience. Among non-attorneys and business donors, there was not an observed association between lower court experience and donations.
Aligned with earlier studies, we see a positive relationship between donor activity and open seat elections. All individual donors (5.5%) and attorney donors (6.4%) contributed larger amounts to open seat contests than incumbent-challenger contests. We find specific evidence that non-attorneys (8.2%) and business donors (8.2%) gave larger totals to open seat races where there was an opportunity to select a new justice to a state high court.
Consistent with our expectation about differing partisan and ideological preferences by donor groups, attorney donations were 8.6% larger for Democratic Party candidates than those directed to Republican Party candidates. Non-attorneys and business donors were disinclined to support left-leaning Democratic Party candidates with 8.4% and 11% smaller donations, respectively, than the amounts donated to right-leaning Republican candidates. We do not observe a relationship between partisanship and donations among all individual donors.
Our results support our third proposition – non-attorneys and business donors, more than all individual donors or attorneys, respond favorably to high-profile positions that have greater investment value and a broader policymaking role. While statewide/district election designs had a weak statistical effect on individual donations (6.5% larger in statewide elections), money contributed by non-attorneys (17.3%) and business donors (15.7%) was much larger where elections were at the statewide level. Like other occupations, attorney donors responded positively to statewide races, yet their support was just 8.4% greater where states had district campaigns. With length of term, non-attorneys gave 36.5% and business donors gave 36.7% larger donations when comparing the longest and shortest terms of elective state high courts. The effect of term length for all individual and attorney donors, while statistically important, was about half of the observed effect for non-attorneys and business donors. Campaign contributions by non-attorneys and business donors increased by 23.8% and 21.3%, respectively, where we compare the smallest and largest elective state supreme courts. The marginal effect of court size was smaller for all individual (10.7%) and attorney donors (10.8%).
Non-attorneys and business donors gave 11.9% and 11% larger contributions, respectively, where states had a lower appellate court, compared to states without a lower appellate court. We see no relationship between appellate structure and contributions by all individual or attorney donors. Where the partisan majority of a state high court was at stake, contributions by all individual (4.1%), non-attorney (6.1%), and business contributors (7.9%) were larger compared to where the partisan majority is safe. We observe no relationship between a potential flip in partisan majorities and attorney donations. Among the remaining features of state courts, ballot design and level of professionalization affected donations – though exclusively for attorneys. Partisan signals in judicial elections contributed to a 4.7% reduction in attorney contributions. Attorneys responded to a state supreme court’s level of professionalization, increasing their donations by 33.8% when comparing the least and most professionalized state supreme courts.
Other control variables affected individual contributions.Footnote 23 Across all sectors of individual donors, campaigns that accepted public campaign support received less money from individual donors. A court’s recent history of close elections, while not important to all individual donors or attorneys, discouraged donations from non-attorneys and business donors. Contribution limits had intriguing and varied effects on donations with individual donors giving larger amounts where states had larger limits, while non-attorneys and business donors gave smaller sums where more moderately restricted. Donations were also smaller where candidates were discouraged from making explicit policy statements – across all sectors. Though marginally significant, attorneys donated larger amounts to judicial campaigns in the South. We did not observe a relationship between individual donations and a candidate’s gender, chief justice elections, state use of the solicitation clause, and a state’s population.
Conclusion
We have sought to understand the conditions where judicial campaigns attract contributions from groups of individual donors. Using the most comprehensive data available, our study makes several noteworthy claims. First, we provide an important update on how the “new style” of judicial elections has evolved in recent decades. Judicial campaign support from individuals fluctuated and declined during the first decade of the twenty-first century before returning to pre-existing levels in the latter 2010s and early 2020s. Second, donors in states with judicial elections varied in noticeable ways. Though judicial campaigns in several states saw low activity among specific occupational sectors of individual donors, other states registered significant participation by attorneys, non-attorneys, or business donors.
We note that the expected influences on attorney, non-attorney, and business donations were confirmed in most cases. While office experience encouraged larger investments from attorneys, judicial experience was less important to non-attorneys and business donors. Open seats also encouraged donor participation across sectors, yet the effect was strongest for non-attorneys and business donors. Left-leaning candidates associated with the Democratic Party performed very well among attorney donors but found few allies among non-attorney and business donors. For non-attorneys or business contributors active in private enterprise, we find strong support for right-leaning Republican candidates.
Among non-attorneys and business donors, we found campaigns performed best in encouraging donations where judicial offices had larger statewide constituencies, longer terms, larger state high courts, and lower appellate courts. Non-attorneys and business contributors reacted favorably where the court’s partisan majority was at risk and could be won by the other major party. We note that overlap exists across the sectors of individual donors – attorneys, non-attorneys, and business donors all favored incumbent candidates, though attorneys more starkly, and open seats attracted all individual donors, but non-attorneys and business donors more than attorneys. Non-attorneys and business donors, however, were motivated by campaigns for offices with broader policymaking authority that encourage a greater return for their investment.
The role of money has been and remains an important source of controversy. With critics, like the late US Supreme Court Justice Sandra Day O’Connor and the Brennan Center for Justice, speculation continues about the harmful effects caused by politicizing judicial races. We confirm that judicial elections continue to evolve with money by individuals and sectors of individual donors a large portion of how campaigns raise money. With lingering concern about how judges make decisions after they receive donations, we speculate that the patterns found in this study suggest that campaigns attract different backgrounds of donors. With fundraising by judicial campaigns driven by unique occupational motives, the possibility that donors expect something in return remains a valid concern. As such, future studies should examine how donations from professional groups translate into judicial decisions that may or may not reflect donor preferences.
Supplementary material
The supplementary material for this article can be found at http://doi.org/10.1017/spq.2026.10023.
Data availability statement
Replication materials are available on SPPQ Dataverse at https://doi.org/10.7910/DVN/3I30Z8 (Boyea and Brace 2026).
Funding statement
The authors received no financial support for the research, authorship, and/or publication of this article.
Competing interests
The authors declared no potential competing interests with respect to the research, authorship, and/or publication of this article.
Brent Boyea is a Professor of Political Science at the University of Texas at Arlington.
Paul Brace is the Emeritus Clarence Carter Chair in Legal Studies in the Department of Political Science at Rice University.



 Open access

