





1. Introduction
As one of the largest carbon emitters in the world, India has to perform the balancing act of managing economic development while curbing carbon emissions. India's emissions trajectory is meaningful from a global mitigation perspective. The country accounts for ∼7% of global emissions, a share that is growing rapidly (Dubash et al., Reference Dubash, Khosla, Rao and Bhardwaj2018). India is pursuing a multi-pronged energy strategy with investments in coal-powered plants and large-scale implementation of renewable energy, particularly solar power (Durga et al., Reference Durga, Evans, Clarke and Banerjee2022).
This paper analyzes trajectories of carbon emissions at the district level in India. India has a federal governance structure, with powers divided between the Central and State governments. The district is the level of governance below the State. We select the district because of its importance in India's administrative setup. Policy implementation in India typically relies on district administrations, which are responsible for developmental initiatives at the local level. Understanding carbon emissions at the district level can help align local developmental priorities with broader mitigation goals (Garg et al., Reference Garg, Shukla, Kankal and Mahapatra2017).
Prior work on understanding regional emissions in India has lacked either spatial or temporal granularity in its analysis. For instance, Garg et al. (Reference Garg, Shukla, Kankal and Mahapatra2017) conduct an annual district-level analysis for five separate years for the period 1990–2013. Mohan et al. (Reference Mohan, Dharmala, Ananthakumar, Kumar and Bose2019) analyze state-level emissions for all years from 2000 to 2015. Currently, no analysis examines emissions at a high temporal resolution over India at the level of the district.
Here, we analyze changes in district-level emissions in India by developing a daily dataset from January 1, 2019, to August 31, 2024. The analysis can be easily updated to near real-time as data for later periods becomes available. While we aggregate our analysis to the district level in India, it is important to note that the analysis can also be conducted at the finer spatial resolution of 0.1°.
We use the Global Gridded Daily CO2 Emissions Dataset (GRACED) (Dou et al., Reference Dou, Wang, Ciais, Chevallier, Davis, Crippa, Janssens-Maenhout, Guizzardi, Solazzo, Yan, Huo, Zheng, Zhu, Cui, Ke, Sun, Wang, Zhang, Gentine and Liu2022, Reference Dou, Hong, Ciais, Chevallier, Yan, Yu, Hu, Huo, Sun, Wang, Davis, Crippa, Janssens-Maenhout, Guizzardi, Solazzo, Lin, Song, Zhu, Cui and Liu2023) for our analysis. GRACED is the only data source that can provide a sub-monthly temporal resolution for emissions on a near-real-time basis (Dou et al., Reference Dou, Wang, Ciais, Chevallier, Davis, Crippa, Janssens-Maenhout, Guizzardi, Solazzo, Yan, Huo, Zheng, Zhu, Cui, Ke, Sun, Wang, Zhang, Gentine and Liu2022). Other data sets include a lag period of at least one year. The data provide daily total emissions for a 0.1° global grid. In addition, emissions are split into major sectors, including ground transportation, aviation, industry, residential, and power.
Our analysis shows that India's annual emissions have increased by 17% between 2019 and 2023 (the last year for which complete data is available). We find inequality in emissions, with the top 7% of districts accounting for more than 50% of emissions. In contrast, the bottom 50% of districts account for less than 9% of total emissions. We examine the contribution of emissions by different sources and how this varies over time. Using three examples, we demonstrate the utility of high spatial and temporal emissions information in answering important social science questions.
Overall, our work makes a significant contribution by presenting a high-resolution portrait of carbon emissions in India.
2. Data and methods
2.1. Carbon emissions data
To obtain carbon emissions at high resolution, we use the GRACED dataset (Dou et al., Reference Dou, Wang, Ciais, Chevallier, Davis, Crippa, Janssens-Maenhout, Guizzardi, Solazzo, Yan, Huo, Zheng, Zhu, Cui, Ke, Sun, Wang, Zhang, Gentine and Liu2022, Reference Dou, Hong, Ciais, Chevallier, Yan, Yu, Hu, Huo, Sun, Wang, Davis, Crippa, Janssens-Maenhout, Guizzardi, Solazzo, Lin, Song, Zhu, Cui and Liu2023; Liu et al., Reference Liu, Ciais, Deng, Davis, Zheng, Wang, Cui, Zhu, Dou, Ke, Sun, Guo, Zhong, Boucher, Bréon, Lu, Guo, Xue, Boucher and Chevallier2020). The GRACED dataset provided near-real-time carbon emissions for a 0.1° global grid (approximately 10 km by 10 km per grid cell) with a daily temporal resolution. The dataset estimates carbon emissions from various data sources, including hourly electrical power generation, monthly production data, daily mobility data, individual flight location information, and monthly fuel consumption corrected for daily local air temperature. The information is downscaled using a spatial gridding procedure to provide final estimates at the grid level. The approach is described in Dou et al. (Reference Dou, Wang, Ciais, Chevallier, Davis, Crippa, Janssens-Maenhout, Guizzardi, Solazzo, Yan, Huo, Zheng, Zhu, Cui, Ke, Sun, Wang, Zhang, Gentine and Liu2022).
2.2. District geometry
Our analysis is based on 722 districts in India. We use updated district boundaries from prior work done by two of the co-authors (Jain et al., Reference Jain, Harrison, Kumar, Kim and Subramanian2024). The updated boundaries include the 13 new districts that were recently created in the state of Andhra Pradesh in India. We extract emission information from the GRACED dataset to the district level using code written in R. Our code accounts for partial overlaps between a grid cell and a district boundary.
2.3. Other data
We use high-resolution data from Facebook's Data for Good platform on India's population density (Tiecke et al., Reference Tiecke, Liu, Zhang, Gros, Li, Yetman and Dang2017) and relative wealth index (Chi et al., Reference Chi, Fang, Chatterjee and Blumenstock2022). We also use daily mobility data in India from Google's Community Mobility reports. We aggregate these datasets to the district level for our analysis.
3. Results
Figure 1 presents average daily emissions for India at the district and state levels. Panels (a) and (c) show significant variation in emissions across districts and states. In Panel (b), we plot the emission contribution of the top 50 districts in the country, which account for 51% of total emissions. In contrast, the bottom 50% of districts contribute less than 9% of total emissions. These results illustrate the utility of examining carbon emissions at the district level. Achieving India's mitigation targets will require policy implementation at local levels in ways that account for India's developmental priorities. The district is an important administrative level in this regard. Panel (d) shows how different states contribute to total emissions. Uttar Pradesh and Maharashtra are the top-emitting states in the country.
(A) Average daily emission (kgc/d) at the district level for India for the period January 1, 2019, to August 31, 2024. (B) Emission contribution for the top 50 most emitting districts. (C) Same as (A) at the state level. (D) Same as (B) for states.

Figure 2 presents the contribution of different emission sources to India's total emissions. Each point represents a day from January 1, 2019, to August 24, 2024. Power accounts for more than half of India's emissions. Power emissions are concentrated in power plants, which are large point sources. Figure 2 also helps provide perspective on why emissions are concentrated in certain districts, as seen in Panel (b) of Figure 1. The top-emitting districts, such as Singrauli, Bankura, and Anugul, have large coal-fired power plants. Figure 2 also demonstrates variations in emissions over time. The increase in power and industrial emissions largely explains the increase in total emissions. The steep decline in aviation, transportation, and industrial emissions during the second quarter of 2020 also highlights the impact of the COVID-19 pandemic.
Daily emissions from different sources and their contribution to India's total emissions.
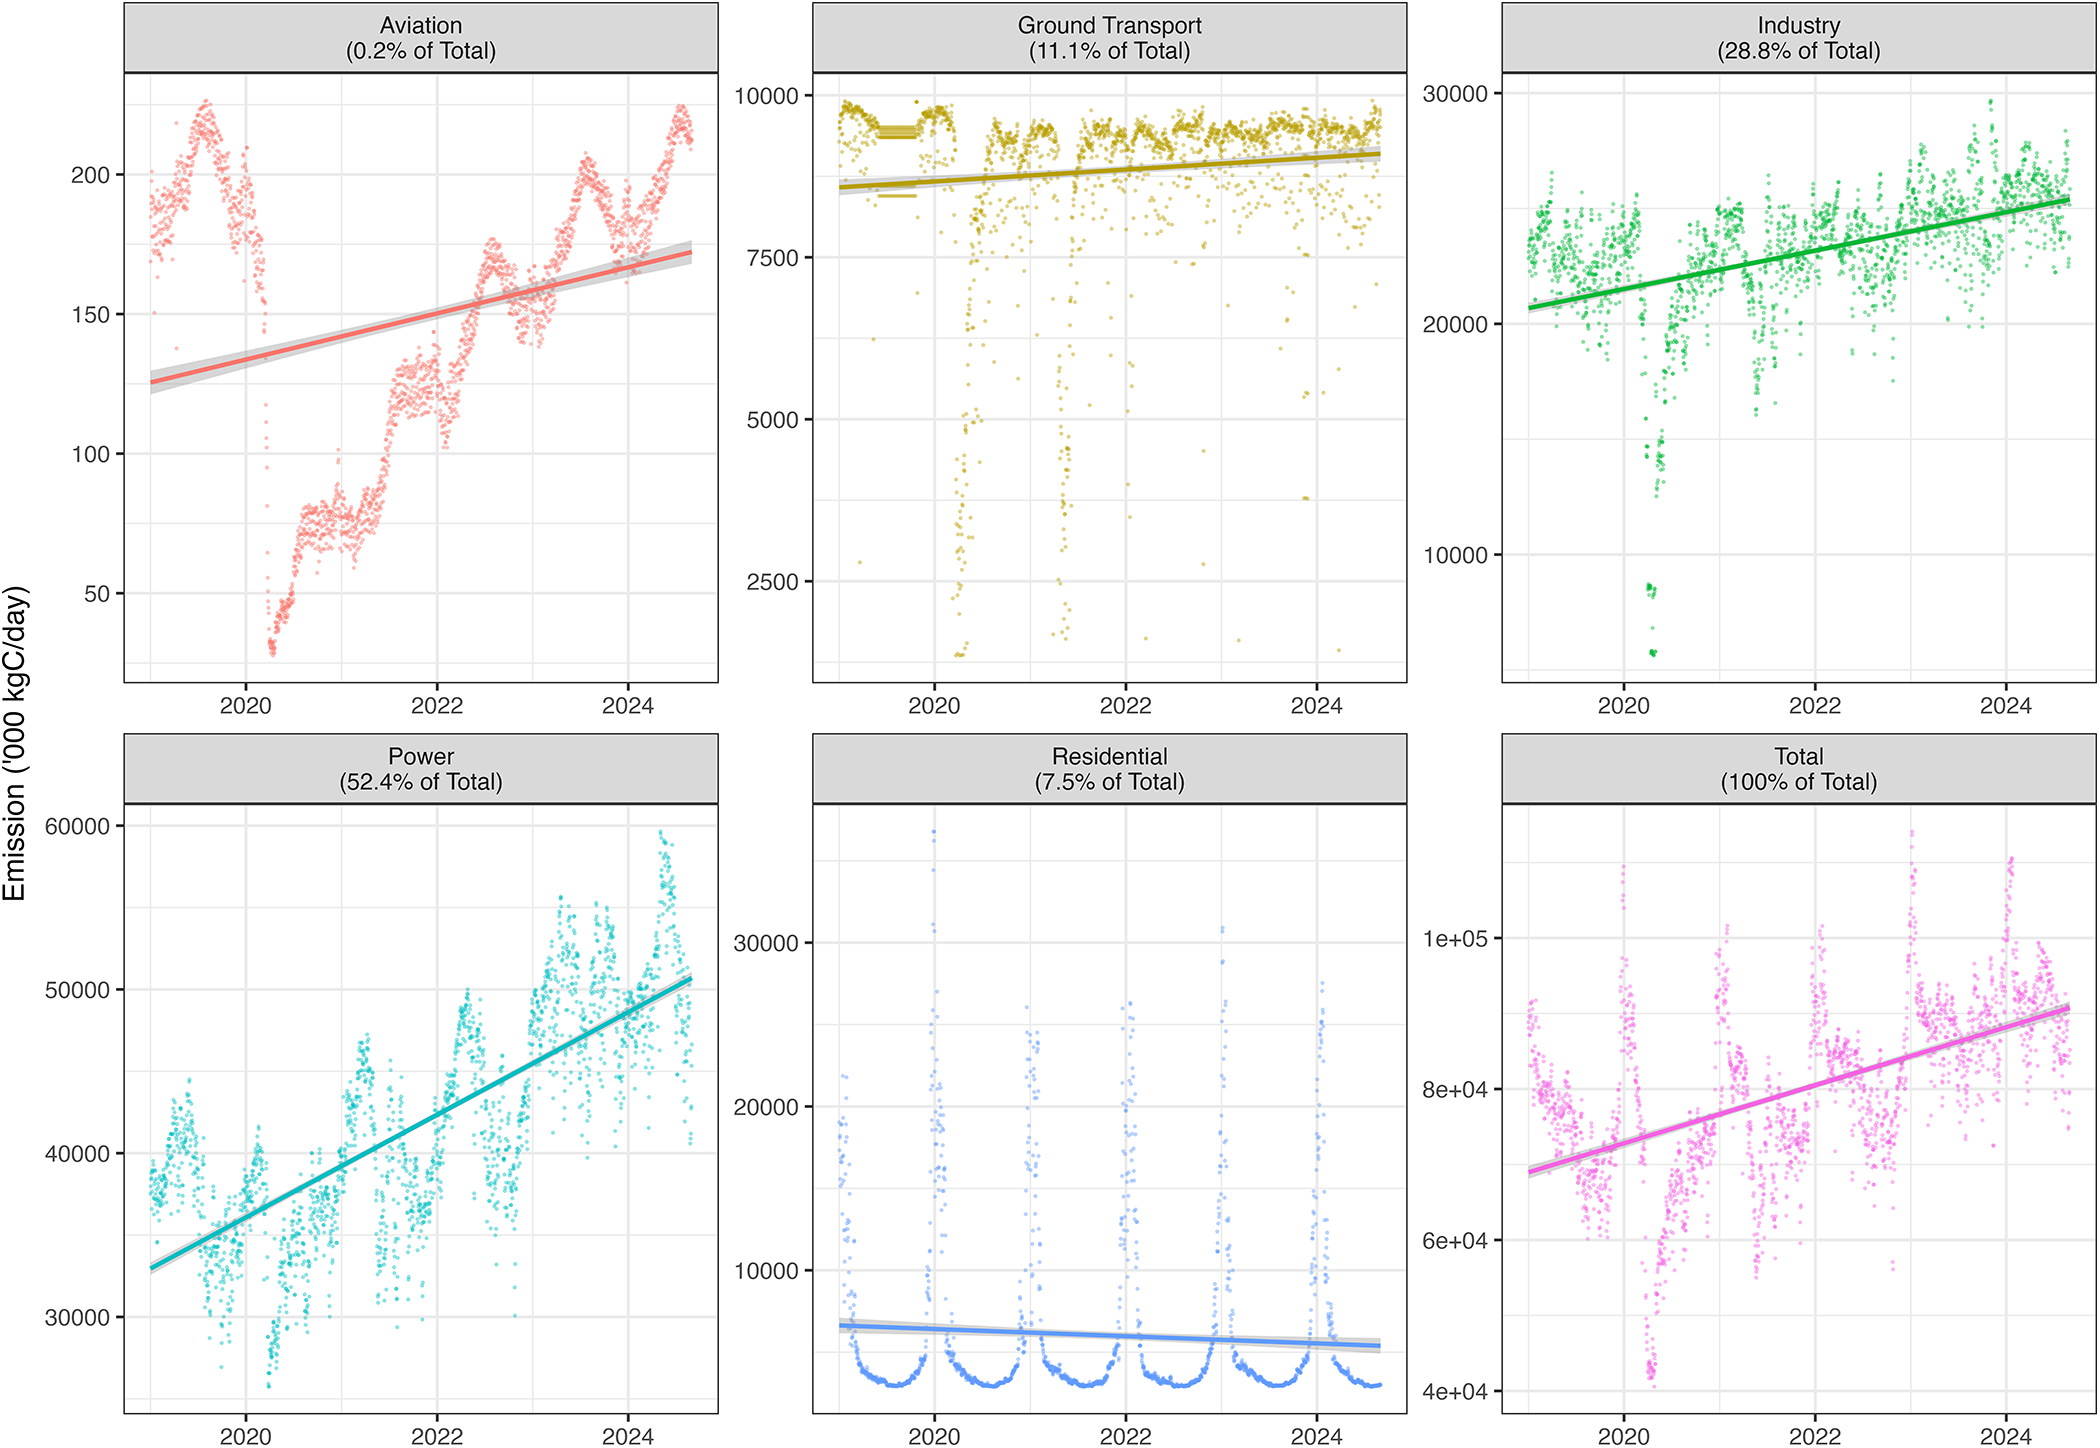
Figure 3 presents the variation in the contribution of different sources by the time of year. The plot starts from January on the left to December on the right. The contribution of residential emissions peaks during winter (November to February in the Indian subcontinent). The plot is based on the 2021 to 2024 period to remove any potential bias due to the pandemic.
The figure plots the variation in contribution of different emission sources to total emissions by time of year. The plot starts from January on the left to December on the right. The data used are for 2021 to 2024 to remove potential bias because of the pandemic.

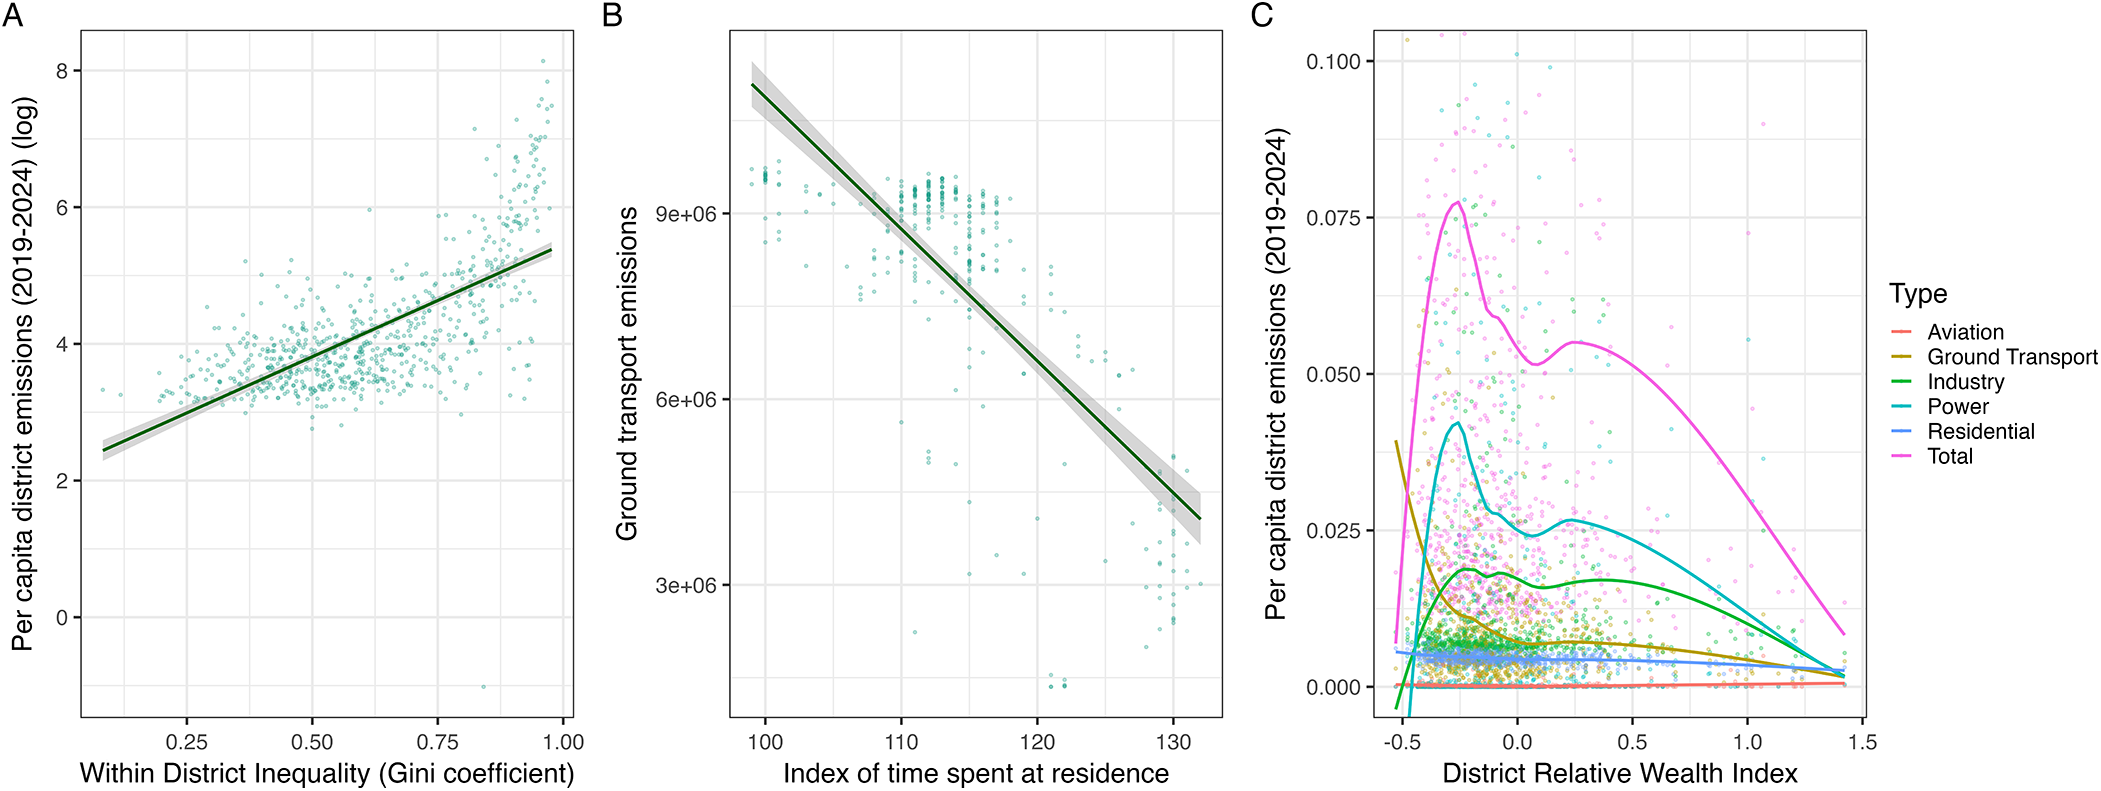
Having emissions data with a high spatial and temporal resolution can enable researchers to answer a number of important social science questions. In Figure 4, we demonstrate the utility of this data with three examples. Panel (a) plots the per capita emissions within the district against the within-district inequality in emissions. More unequal districts have higher per capita emissions. Panel (b) uses Community Mobility data from Google that was made publicly available during the COVID-19 pandemic. We plot the index of time spent by individuals in India at their residence daily against daily ground transport emissions in India. As individuals spend more time at home, ground transport emissions reduce. Panel (c) plots the relative wealth index at the district level against per capita emissions. For most emission types, the inverted U-shape empirically demonstrates the Kuznet's curve. Per capita emissions increase initially with district wealth, but decline after a certain threshold. All of these analyses are made possible by the spatial and temporal resolution of the emissions data.
(A) The panel plots the log of per capita district emissions against within-district emissions inequality at the pixel level. Each point represents a district. (B) The panel plots daily ground transportation emissions in India against the daily index of time spent at home in India (using Google mobility data). Each point represents a day. The data covers the period from February 15, 2020, to December 31, 2020. (C) The panel plots per capita district emissions against the relative wealth index in the district. Each point represents a specific type of emission for a district.
4. Discussion
India's carbon emissions trajectory is important from a global mitigation perspective. Past analyses of India's emissions have typically relied on estimates with a lag period of at least one year or have lower spatial and/or temporal resolution. In this paper, we provide a replicable approach to understanding India's emissions at a district level on a daily, real-time basis. While we focus primarily on Indian districts as the administrative unit of analysis for this paper, it is important to note that our methodology can be used to map changes in emissions at finer geographical scales.
Our work provides evidence that India's emissions are concentrated in a small percentage of districts. Our findings also shed light on the contribution of different sectors to India's total carbon emissions. While power accounts for more than 50% of total emissions, the contribution of different sectors varies across the year. For instance, emissions in the residential sector peak in the winter months.
We provide three examples demonstrating the utility of high-resolution emissions data in answering important questions. We show that per capita district emissions follow a Kuznets’ curve, that daily ground transport emissions are negatively linked to the time people spend in their residence, and that within-district emission inequality is positively linked to per capita district emissions. These findings provide important insights and raise questions that future research should seek to answer.
Overall, our analysis provides a complete characterization of the evolution of the carbon emissions in India at the district level.
Author contributions
A.S. and S.V.S. conceptualized and supervised the study. A.S. led the analysis and the writing of the draft. R.K. and S.V.S. contributed to the data interpretation and critical review & editing of the draft. All authors had final responsibility for the decision to submit for publication.
Funding statement
This research was funded by Bill & Melinda Gates Foundation, INV-002992. The first author was supported by the Raghunathan Fellowship at the Lakshmi Mittal and Family South Asia Institute, Harvard University. The funders had no role in study design, data collection and analysis, decision to publish or preparation of the manuscript. All authors had access to the data.
Competing interests
The authors report no conflicts of interest.
Research transparency and reproducibility
All data and code will be made available to researchers upon reasonable request.



 Open access

