


1. Introduction
Although sea-ice studies have been a focus of considerable research activity for over 100 years, our understanding of the biogeochemistry of sea ice is still rather limited. Most chemical studies to date have been linked to the study of factors influencing sea-ice ecology, and in particular the chemical processes that take place during ice formation, as the growing ice cover is colonized by the sea-ice biology (see reviews by Reference Thomas and DieckmannThomas and Dieckmann, 2002; Reference Papadimitriou, Kennedy, Dieckmann and ThomasThomas and Papadimitriou, 2004). There is a distinct paucity of information from abiotic systems, which severely limits our understanding of the dominant chemical transformations as sea water is transformed from its liquid phase to a semi-solid matrix (Reference Anderson and JonesAnderson and Jones, 1985; Reference Giannelli, Thomas, Haas, Kattner, Kennedy and DieckmannGiannelli and others, 2001; Reference MockMock and others, 2002; Reference Papadimitriou, Kennedy, Dieckmann and ThomasPapadimitriou and others, 2004). This general lack in sea-ice chemical studies is even more pronounced in the ice formed from the low-salinity waters of the Baltic Sea where sea ice is a dominant feature every winter. Although the salinity of northern Baltic Sea water is as low as 2−7 psu (practical salinity units), in the surface layer the ice shows typical sea-ice features (with preferred horizontal c axis, jagged grain boundaries, and a substructure within the grains associated with brine layers). This holds down to about 1 psu parent-water salinity (Reference PalosuoPalosuo, 1961; Reference KawamuraKawamura and others, 2001), when a planar ice−water interface is stabilizing, preventing the development of intra-crystalline substructure and strongly limiting impurities inclusion into the ice. Experiments on the freezing of low-impurity waters, although with very few solutes, have been performed previously (e.g. Reference Malo, Baker and GouldMalo and Baker, 1969; Reference Gross, Wu, Bryant and McKeeGross and others, 1975, 1977). A better understanding of the complex chemical processes that occur during sea-ice formation and subsequent metamorphism and melt is vital if we are to fully understand the geochemistry, and the chemical sources and sinks in ice-covered seas.
Clearly the biological activities within a confined habitat are the most influential factors governing the chemical properties of sea ice and at the same time masking the chemical properties of sea ice inherited from purely physico-chemical processes (Reference MeeseMeese, 1989; Reference Gleitz, van der Loeff, Thomas, Dieckmann and MilleroGleitz and others, 1995). Except for those major inorganic nutrients used by both heterotrophic and autotrophic components of the sea-ice biota, the ratios of other major ions (sodium, potassium, sulfate, chloride, etc.) in the ice remain fairly close to those measured in sea water (e.g. Reference AddisonAddison, 1977; Reference MeeseMeese, 1989). However, temperature gradients in sea ice provide a means of selectively immobilizing specific cryohydrates, such as CaCO3 6H2O (ikaite) and Na2SO4 10H2O (mirabilite), which leads to fractionation and variation in major-ion ratios (Reference RichardsonRichardson, 1976; Reference Weeks and AckleyWeeks and Ackley, 1982; Papadimi-Reference Papadimitriou, Kennedy, Dieckmann and Thomastriou and others, 2004). This has been evident in that sulfate/chloride ratios are different in sea ice than in the parent seawater (e.g. Reference Reeburgh and Springer-YoungReeburghand Springer-Young, 1983), and other ions which form cryohydrates at (relatively) high temperatures are immobilized in sea ice (e.g. Reference MeeseMeese, 1989).
While brine chemistry and inorganic nutrients such as nitrate, phosphate, silica and ammonium are the most numerously studied chemical properties of sea ice, there have been comparatively limited efforts to study the behavior of other dissolved inorganic and organic constituents of sea water. Recently Reference Giannelli, Thomas, Haas, Kattner, Kennedy and DieckmannGiannelli and others (2001) reported that dissolved organic carbon (DOC) may not behave conservatively during sea-ice formation and consolidation, becoming slightly enriched in artificial sea ice to salinity. Very few investigations have reported on the effects of ice formation and growth on trace elements in sea ice (e.g. Reference Granskog and VirkanenGranskog and Virkanen, 2001; Reference NedashkovskiiNedashkovskii, 2002). Reference Granskog and VirkanenGranskog and Virkanen (2001) showed that atmospheric supply, and snow-ice formation, is important for Pb levels in Baltic Sea ice. Reference NedashkovskiiNedashkovskii (2002) observed enrichment of both Cd and Pb in sea ice in respect to sea water, and proposed that incorporation of the sea-surface microlayer, highly enriched in Pb and Cd, results in an excess of these elements.
In the shallow waters of the Baltic Sea the potential impacts of sea-ice growth on seasonal chemical budgets are likely to be highly significant. The northernmost basin, the Bothnian Bay (mean depth 40 m), often has an ice season longer than 6 months. The land-fast sea ice grows typically 50-120 cm thick and extends to the 5-15 m isobath (Reference LepparantaLepparanta, 1981). Thus land-fast sea ice covers about one-third of the surface area, while pack ice covers the rest. Therefore one can assume that the potential influence of sea-ice growth is highest in the shallow land-fast sea-ice-covered region of the basin. To address this obvious lack of information, we report on the results from an experimental study in winter 2002, when ice was grown under natural conditions in a pool cut into fast ice in the brackish water (3 psu) of the Bothnian Bay, in the northernmost Baltic Sea. The objective was to study the fractionation of a range of different chemical classes during new ice formation at low salinities. Formation of snow ice during the experiment allowed us to study the chemical properties of this ice type as well. In addition, the experimental ice was compared with first-year ice with unknown age, growth and thermal history collected on two occasions in the same winter from the pack ice in the Both-nian Bay. This accommodates the comparison of new ice, often grown in experiments, with ice grown in natural conditions for a longer period. A purpose of this work was to shed more light on the chemical composition of sea ice in the Baltic Sea, which is, to date, virtually unknown, except for limited information mainly on nitrogen and phosphorus nutrient levels (e.g. Reference Mock, Meiers and GiesenhagenMock and others, 1997; Reference KaartokallioKaartokallio, 2001; Reference Granskog, Martma and VaikmaeGranskog and others, 2003b). We will also discuss the potential influence of sea ice on chemical cycling and budgets in seasonally ice-covered seas.
2. Materials and Methods
2.1. Ice growth experiment (new ice)
To study the chemical processes during initial ice formation in natural conditions, an opening (hereafter referred to as a pool), 1.5 m by 2 m, was cut into the 0.5 m thick fast ice in the vicinity of the Bothnian Bay Research Station (University of Oulu), on the western tip of Hailuoto island in the northeastern part of the Bothnian Bay (Fig. 1). The water at this location is brackish (water salinity 2.95 psu), and the pool was frozen under natural conditions. The under-ice water and ice grown within the pool were sampled for studies of the fractionation of major ions (Na+, K+, Mg2+, Ca2+, Cl_ and SO42_), stable oxygen isotopes (δ18O), DOC and trace elements (Al, Fe, Cu, Zn, Cd and Pb).
Location of the experimental site (cross), and the sampling locations for first-year sea-ice samples in February (solid triangles) and April (stars).The solid line approximates the land-fast ice edge in mid-February, and the dashed line the pack-ice edge in mid-April (modified from Finnish Ice Service ice charts). In February the pack ice extended further south.

Temperatures in the air, ice and under-ice water were measured using thermistors and logged onto Gantner IDL100 dataloggers. Weather conditions were also monitored at the nearby (1 km) Marjaniemi weather station (Finnish Meteorological Institute). Conductivity and temperature profiles of the water column were measured daily from a small hole in the corner of the pool using a WTW LF 197 sensor.
Conditions during the field experiment changed rapidly from rather calm and cold conditions to stormy and rather mild weather (Fig. 2). During the first phase the air temperature was around −13°C. After about 30 hours of ice growth a low-pressure system reached the area, and the conditions switched rapidly to mild temperatures (-3 to -8°C) and windy conditions, with snow accumulation onto the ice that considerably slowed down ice growth at the ice-water interface. Furthermore, snow ice started to form after the second sampling occasion (66.5 hours). At the end of the experiment (182 hours) the total ice thickness in the pool was 21 cm, of which 11 cm was snow ice.
(a) Air temperature and (b) ice and water temperature.The arrows indicate sampling times.The legend indicates the depth of the thermistors during initial set-up; after snow-ice formation (after 66.5 hours from the start of freezing), the uppermost thermistor was about 11cm below the ice-snow interface.

Ice samples were collected by cutting, with a stainless-steel saw that was soaked and rinsed with ultra-pure water between samplings, a block of ice about 20 cm × 7 cm from the pool after 22.5, 66.5 and 182 hours from the start of ice formation. Sampling was infrequent because we wanted to collect ice samples as undisturbed as possible. Following the second sampling (66.5 hours) it was decided that no other samples would be collected until the end of the experiment (182 hours) so that snow ice would develop as undisturbed as possible. The collected ice blocks were put immediately into polyethylene bags, and kept below -20°C in a freezer until preparation for analysis. Under-ice water samples were collected directly into polyethylene vials (25 mL) for major-ion and •18O determinations, and into acid-washed polypropylene tubes (50 mL) for trace element determinations. All water samples were frozen within 1 hour from retrieval and kept so until analysis. Samples for DOC were filtered directly through pre-combusted Whatman GF/ F filters into pre-combusted glass vials, and preserved with two drops of phosphoric acid (Merck, pro analysi grade). These were also frozen until analysis. All samples were transported in a freezer to the Rovaniemi Research Station (RRS) of the Finnish Forest Research Institute for further sample preparation.
2.2. Sampling of first-year sea ice
Sampling of first-year sea ice of unknown growth and thermal history was conducted on two occasions: in February 2002 on board the Swedish icebreaker ϒmer (three cores) and in early April 2002 onboard icebreaker Atle (five cores) in the pack ice in the western parts of the Bothnian Bay (Fig. 1). The samples were taken from undeformed ice floes or level areas of deformed ice floes. In February the ice was snow-covered (0-12 cm), relatively cold (-0.2 to -2.0°C) with air temperatures below freezing. In April the snow cover had disappeared, the ice was in general close to its melting point, air temperatures were above freezing and the ice had begun to decay. These samples represent sea ice with a range of different growth conditions and thermal history. They were collected with an ice-corer (Kovacs Enterprises Inc., New Hampshire, U.S.A.), transferred into plastic tubing and immediately put into a freezer (-20°C). The samples were transported in a freezer to the RRS for further sample preparation.
2.3. Sample preparation and analysis
For ice-texture analysis each ice sample (block or core) was cut lengthwise to obtain a 1 cm thick section, which was cut into 5-20 cm long vertical sections. These sections were attached to glass plates, planed to about 1 mm thickness and then examined between crossed polarizers to identify the crystal structure. Based on the structure the ice was first divided into texture classes, namely granular ice, intermediate granular columnar ice and columnar ice (Reference Eicken and LangeEicken and Lange, 1989). Thereafter granular ice was divided into snow ice (including snow ice and superimposed ice) and granular sea ice based on its δ18O composition. In short, granular layers with δ18O values lower than the parent sea water are assumed to be snow ice (see Reference Granskog, Martma and VaikmaeGranskog and others, 2003a).
For chemical analyses the ice samples were prepared in the cold room at the RRS (-22°C). First, 1-2 cm of all the outer surfaces of the sample blocks from the growth experiment were removed using a band-saw. The remainder was sawed into 10-20 mm thick horizontal sections. From the cores 2 cm of the outer surfaces were removed using a band-saw, and the remaining slabs were cut into 20-50 mm horizontal sections for major-ion analysis, and along textural boundaries for trace-element and δ18O determinations. The surfaces of these sections were further scraped off using a ceramic knife (Boker Baumwerk GmbH, Germany) inside a laminar flow-bench, and put into acid-washed polyethylene cups (250 mL, with screw caps) for melting. Procedural blanks were prepared in exactly the same manner as the samples, using frozen ultra-pure water cores (see Reference Jauhiainen, Moore, Derome, Peramaki and DeromeJauhiainen and others, 1999). All material in contact with the samples was carefully acid-washed and thoroughly soaked and rinsed with ultra-pure water, prior to use.
Salinity was determined using the measured conductivity (Schott handylab LF1 conductometer) converted to salinity (psu) using the Reference Fofonoff and MillardFofonoff and Millard (1983) algorithms. DOC was determined using high-temperature combustion oxidation as described in Reference Giannelli, Thomas, Haas, Kattner, Kennedy and DieckmannGiannelli and others (2001); procedural blanks were below the detection limit of the instrument (10 μM). δ18O was determined using standard methods by a mass spectrometer (Finnigan-MAT Delta-E), to an accuracy of 0.1 (Reference Granskog, Martma and VaikmaeGranskog and others, 2003a).
Major cations (Na+, K+, Mg2+, Ca2+) and anions (Cl―, SO4 2−) were determined using a Dionex Dx-120 ion chromatograph at the RRS. Frozen samples were melted in a hot-water bath. Before analysis, samples were diluted to be within the range of the calibration curve. A new calibration was performed for every batch of samples and was checked by reference standards. Cations were analyzed via suppressed ion chromatography with Dionex CG12 and CS12 columns, 500 ^L loop and 18 mM methanesulfonic acid eluent. Anions were analyzed via suppressed ion chromatography with Dionex AG15 and AS15 columns, 2 mL loop and 38 mM sodium hydroxide eluent. The suppression was provided by a Dionex CSRS-ULTRA for cations and Dionex AMMS III for anions. The methods are described in more detail by Ke-Reference Kekonen, Moore, Mulvaney, Isaksson, Pohjola and van de Walkonen and others (2002).
Trace elements (Al, Fe, Cu, Zn, Cd and Pb) were measured byThermo Elemental X7 ICP-MS (Thermo Elemental, Winsford, U.K.). Because the water and ice samples were not filtered, to avoid further contamination, the measurements represent the total concentration of these elements in the samples. The instrument was equipped with collision cell technology (CCT), standard low-volume glass impact bed spray chamber (Peltier-cooled at +3°C), concentric glass nebulizer and Cetac ASX-500 autosampler. The use of a collision cell was necessary to allow determination of iron at low µg L-1 level. All collision-cell gas connections were made using stainless steel, and 7% H 2 in He was used as the collision gas. The ion lens settings, nebulizer flow rate and torch position were optimized daily, to obtain maximum 115 In count rate. The instrument was calibrated before every batch of samples, and calibration was updated frequently during measurements. The limit of detection (LOD) was defined as the signal equal to the blank signal, y B, plus three standard deviations of the blank, Sb .
When the blank signal and its standard deviation were known, the LOD concentration was obtained as follows:
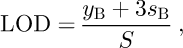
where S is the slope of the calibration line, that is, the sensitivity. This gives the most unbiased estimator for LOD, assuming that sensitivity is correctly estimated (Reference Miller and MillerMiller and Miller, 2000). LOD for each element was as follows (in μg L-1): Al 2.35, Fe 1.65, Cu 0.94, Zn 2.50, Cd 0.0028 and Pb 0.059.
3. Results
3.1. Ice growth experiment (new ice)
Figure 3 shows profiles of salinity, DOC, chloride and iron in the ice at the end of the experiment, after 182 hours of ice growth. The topmost 11 cm is snow ice, whereas the lower part is columnar ice formed during congelation growth. The incorporation of DOC, chloride and iron follows that of the salinity of the ice.
Profiles of (a) salinity, (b) dissolved organic carbon (DOC), (c) chloride (Cl―), and (d) iron (Fe) in the ice at the end of the experiment (182 hours).The inverted triangle shows the average concentration in under-ice water. The dashed line shows the snow-ice/congelation-ice interface

Linear correlations between salinity, depth and major ions (not shown) indicate that all ions are strictly related to salinity and also each other (R> 0.91, P < 0.0001). Salinity and the ions are also related to depth (R = −0.73 to −0.79,P<0.0001), probably a result of changes in the growth rate with depth and the amount of initial salt entrapment.
In the literature the fractionation of major ions has been studied by comparing the ratio of sulfate, sodium, potassium, magnesium and calcium to chloride in the ice to that in the parent sea water (e.g. Reference Reeburgh and Springer-YoungReeburgh and Springer-Young, 1983; Reference MeeseMeese, 1989). We consider that our experimental ice had a very short (and known) thermal history, compared to natural sea ice sampled in several other studies cited (e.g. Reference AddisonAddison, 1977; Reference Overgaard, Wadhams and LepparantaOvergaard and others, 1983; Reeburgh and Springer-Yhung, 1983; Reference MeeseMeese, 1989).
SO4 2¯ is enriched in the majority of the samples compared to parent sea water (Fig. 4a), the enrichment being somewhat higher at higher salinities in congelation ice. Slight enrichment is also observed for Ca2+ and Mg2+ in the ice (Fig. 4b and c). In contrast, K+/Cl¯shows slight depletion of K+ through most of the ice (Fig. 4d). Sodium (not shown) shows conservative behavior, with Na+/Cl― ratios very close to that of the parent sea water in all samples. There were no significant changes in any of the ion ratios with time in congelation ice, that is, the ratios were the same in the early samples (22.5 and 66.5 hours) as at the end of the experiment (182 hours) (analysis of variance (ANOVA), P> 0.05).
Plot of (a) sulfate, (b) calcium, (c) magnesium and (d) potassium against chloride for new ice grown in the experiment. The solid line represents the average sea-water ion (SO4 2−, Ca2++,Mg2++ orK+)/Cl ratio, and the dashed lines shows the extreme values observed in sea water during the experiment

Table 1 shows the average enrichment factors Dc for different ions in respect to Cl―. Dc is defined as follows (Reference Weeks and AckleyWeeks and Ackley, 1982):
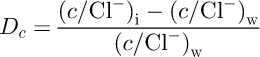
where c is the concentration of the ion of interest, and subscripts i and w indicate ice and water respectively. Positive values of D c indicate that there is an excess of the ion c in the ice in respect to Cl― compared to parent sea water. D c values show the same as Figure 4, that SO4 2−, Ca2+ and Mg2+ are enriched, K+ is depleted, and Na+ is basically unchanged in the ice in respect to Cl― during initial ice formation.
Mean ± s.d. enrichment factors D c (see text) for different ions in new ice, grown during the experiment, and infirst-year sea icefrom the pack ice in February and April

Inferred from ion to K+ ratios, potassium is the most mobile ion of those measured, with considerable depletion in the ice in respect to other ions. All ion/K + ratios were significantly higher in congelation ice than in snow ice (ANOVA P < 0.01). The ion Cl― ratios for snow ice are closer to the ratios in the parent sea water than in congelation ice (one-way ANOVA, P<0.025).
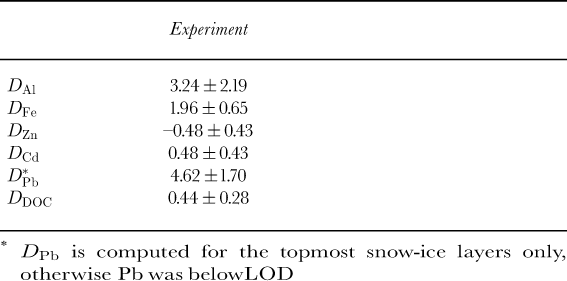
Comparison of the measured DOC values in the ice to those in water diluted to the salinity of the ice (expected values in the ice if DOC would behave conservatively) shows there is an excess of DOC in the ice (Fig. 5). This is also seen in the positive enrichment factor for DOC in respect to salinity (Table 2).
Mean ± s.d. enrichment factors D c (see text) for different trace elements and DOC for new ice grown in the experiment in respect to salinity, that is, salinity (psu) has been substitutedfor Cl―in Equation (2)
Plot of the ratio of the concentration of individual species (Al, Fe, Zn and DOC) in ice (at 182 h) to that in water (C i / C w) vs the ratio of salinity in ice to that in water (S i / S w).The dashed line shows the expected C i/C w ratio if the individual species behave conservatively to salinity.

Aluminum and iron are enriched in both the snow-ice and the columnar ice layers in respect to salinity (Table 2; Fig. 5). Zinc, on the other hand, shows depletion in respect to salinity (Table 2). The level of Pb is below LOD in the ice, except in the topmost snow-ice layers, where the levels are considerably enriched in respect to salinity (Table 2). Cd shows slight enrichment in the ice (Table 2); this is especially evident for the snow-ice layers.
3.2. First-year sea ice
The structural and δ 18 O composition of the sea-ice samples collected in the pack ice of the Bothnian Bay revealed that the ice had undergone very complex growth processes. Snow-ice or superimposed-ice formation was evident in all cores; meteoric ice fractions to total ice mass ranged from 5.6% to 23.4% (computed according to Reference Jeffries, Shaw, Morris, Veazey and KrouseJeffries and others, 1994). Rafting also seemed to have occurred at some of the sites, with granular ice layers between sometimes tilted columnar ice layers. At one site the ice formed resembled platelet ice in structure, and there was a several meter thick layer of unconsolidated ice crystals underneath the ice floe at the time of sampling. Observations therefore suggest that the ice growth in the Bothnian Bay pack ice is very complex, with thermodynamic growth at the upper surface (snow ice and superimposed ice) and the ice-water interface (congelation ice), and also dynamic thickness growth (e.g. by rafting) all being important. The variable growth conditions are, not surprisingly, reflected in the highly variable chemical properties of the ice grown in these conditions.
Figure 6 shows vertical profiles of Cl― in samples collected in pack ice in western parts of the Bothnian Bay in February and April 2002. In April the profiles showed little resemblance to each other, whereas in February they showed rather uniform salinity profiles, except in the very topmost parts which are modified by flooding and snow-ice formation also evident in previous investigations in the same area (e.g.Reference Weeks, Gow, Kosloff and Digby-ArgusWeeks and others, 1990). In April the (mean) bulk ice salinity (0.20 psu) has decreased from that observed in February (0.50 psu).
Profiles of Cl― in first-year sea-ice samples collected in February (left) and April (right) 2002. Notice the different horizontal scale.

Linear correlations between salinity, depth and major ions (not shown) show that all ions are strongly related to salinity and each other (R> 0.94, P<0.0001), while salinity and ions are unrelated to depth (R = −0.20 to −0.28,P<0.05).
The fractionation of major ions shows behavior very similar to that of the ice grown in the experiment (Fig. 7), despite varying growth processes and thermal histories of the samples. SO42−, Ca2+ and Mg2+ show slight enrichment in the ice, while K+ is depleted (Fig. 7). The same is also true of the D c values in Table 1, shown separately for samples collected in February and April. In February samples, the ion/Cl― ratios in the snow-ice layers are almost without exception significantly closer to that of sea water than in the remaining ice (individual cores, paired t test, P <0.05; data not shown). In April, however, there is no difference (paired t test, P> 0.05; data not shown).
Plot of (a) sulfate, (b) calcium, (c) magnesium and (d) potassium vs chloride in first-year sea ice.The solid line represents the average sea-water ion (SO4 2-, Ca2+, Mg2+ or K+)/chloride ratio, while dashed lines showthe extreme values observed.

Linear correlations between depth, salinity, δ18O, Fe, Al, Cd, Cu and Pb show that relationships between these are non-existent, with a few exceptions. Most notable is that none of the trace elements, except for Cu (R = 0.90, P <0.01, n = 12), show any relationship with salinity. This implies that these elements are not controlled by salinity to the same degree as major ions. Pb shows significant relations with δ18O (R = ― 0.53,P<0.001) and depth (R = -0.41, P <0.02), which is an indication of elevated levels in the surface parts of the ice.
Trace-element levels in different ice types (Table 3) were compared with ANOVA. Only Pb showed a significant difference between ice types, with higher levels in snow ice than in either columnar or intermediate granular columnar ice (P <0.05; Tukey multiple comparison test). Whether trace elements are enriched in the pack-ice samples in respect to salinity cannot be definitely answered, because the levels of trace elements in the under-ice water varied so much between the stations that both depletion and enrichment were observed in the ice in respect to salinity.
Mean±s.d. (µg L-1) of trace elements in different ice types for first-year sea ice

4. Discussion
4.1. Major ions
The major ions (Na+, K+, Mg2+, Ca2+, Cl―and SO4 2−―) were strongly related to salinity in this low-salinity Baltic Sea ice, both in new ice and in first-year sea ice. This indicates that major-ion chemistry is largely controlled by salinity alone and that the ratios between ions remain fairly constant in the entire ice sheet. This compares well to Reference MeeseMeese (1989) who reported that major-ion chemistry in sea ice formed in higher-salinity waters is controlled by salinity, and her results showed similar correlations between ions from first-year sea ice in the Beaufort Sea.
Deviations in the ion/Cl− ratios in the ice in respect to that in sea water are an indication of selective fractionation either during initial freezing (e.g. Reference Malo, Baker and GouldMalo and Baker, 1969) or in older ice by the formation of cryohydrates during thermal cycling which causes selective mobilization or retention of ions compared to others in the brine (e.g. Reference Reeburgh and Springer-YoungReeburgh and Springer-Young, 1983; Reference MeeseMeese, 1989). The results for previous investigations on the SO4 2−/Cl― ratio in sea ice have been summarized by Reference Reeburgh and Springer-YoungReeburgh and Springer-Young (1983), and showed that both relative enrichment and depletion of SO4 2− occurs during sea-ice formation and ageing. SO4 2−enrichment was observed in new ice (after 22.5 and 66.5 hours of growth), taken prior to any flooding or snow-ice formation, indicating that selective fractionation or formation of cryohydrates occurred already during the very early stages of ice growth. If brine drainage occurred later, the changes in the initial ratios were insignificant in the new ice. First-year sea-ice ion ratios also indicate that the ion ratios are not much affected after initial ice growth, and the ions are removed in a nearly constant ratio with ageing. With the temperatures observed during our experiment, CaCO3 and Na2SO4 should be the only salts to precipitate, according to the standard sea-ice phase diagram (e.g. Reference RichardsonRichardson, 1976; Reference AddisonAddison, 1977; Reference MeeseMeese, 1989).
Both Ca2+ and SO4 2−showed enrichment in the ice, while Mg2+ was also enriched (Figs 4 and 7). This compares with observations of Mg2+ enrichment by Reference AddisonAddison (1977) and Reference MeeseMeese (1989) in young (arctic) sea ice. Reference MeeseMeese (1989) assumed that Mg 2+ may be precipitating at higher temperatures with an ion other than Cl ―. The recorded temperatures in the ice were above —10 oC during new ice formation, so if the assumption of Mg2+ forming a salt is correct, this happens already at relatively high temperatures. However, an explanation for the enrichment of Ca 2+, Mg2+ and K+ in new ice is the diffusion-controlled sequence of preferential incorporation of cations, Ca2> Mg2+> K+ reported by Reference Malo, Baker and GouldMalo and Baker (1969), which is supported by the fact that the Dc values decrease in the same order (Table 1). This initial sequential segregation of ions is quite likely since brine drainage seems not to have affected the initial ion ratios in new ice. Reference AddisonAddison (1977) and Reference MeeseMeese (1989) observed depletion of K+, which is attributed to the fact that K+ is mobile in the brine compared to Cl― and therefore shows depletion in respect to sea water (Reference Weeks and AckleyWeeks and Ackley, 1982). Sodium behaved conservatively as observed in young natural sea ice by Reference AddisonAddison (1977) and Reference MeeseMeese (1989). Samples collected in the pack ice have possibly been subject to lower temperatures than ice formed during the experiment, which would have potentially enabled formation of, for example, the MgCl2 H2O salt (Reference Weeks and AckleyWeeks and Ackley, 1982). That would partly explain the higher DMg values in the natural ice samples than observed for new ice (Table 1), as well as the somewhat higher enrichment of Ca2+ in first-year sea-ice samples (Table 1).
Snow ice had ion/K+ ratios closer to the parent sea water than congelation ice (ANOVA, P> 0.05). The ion/Cl― ratios were also closer to sea-water values. This was observed for both new ice and first-year sea ice. This implies different brine retention/rejection processes during snow-ice formation. If the underlying (congelation) ice is impermeable, brine transport from congealed snow ice through or into the underlying ice is limited, snow-ice formation approximates a closed system, and ion ratios are therefore unchanged. Indeed the temperatures during new ice formation in the topmost congelation ice are lower than about −1 to −0.6OC which is required for ice at the observed salinities (0.6-1.0 psu) to become permeable (brine volumes>5%) (M. Lepparanta and T. Manninen, unpublished information; Reference Golden, Ackley and LytleGolden and others, 1998). The major-ion concentrations in snow measured at coastal sites in the Bothnian Bay (Reference Soveri and PeltonenSoveri and Peltonen, 1996) are so low, several orders of magnitude lower than in sea water, that different ion ratios in snow in respect to sea water have a negligible effect on the ion ratios in snow ice.
Assuming that 1m of ice would grow with the same SO42−/Cl− ratio as in our observations on average, and the rejected brine would be evenly mixed into a 5 m water layer, that would change the ratio in the water by around 2 % from the initial value. However, with the maximum observed ratio in ice, the change would be 4%. The same applies roughly for the other major ions which were observed to be enriched (Mg2+ and Ca2+). For K+ the change would be smaller and opposite in sign. This is a reasonable assumption in the shallow coastal areas of the Bothnian Bay, where land-fast sea ice covers a third of the whole basin every winter. However, more detailed studies are needed, especially on the sea-water composition in winter, to quantify the influence of sea-ice growth on the chemical budgets and seasonal cycling in the area.
4.2. DOM and trace elements
Enrichment of DOC in respect to salinity was observed in new ice, which implies that during ice formation selective retention of DOC took place. This has been observed during artificial sea-ice formation as well (Reference Giannelli, Thomas, Haas, Kattner, Kennedy and DieckmannGiannelli and others, 2001). However, the two datasets so far are very limited, and further studies are needed to verify these findings. The mechanism of DOC, and perhaps DOM and humic substance, enrichment in sea ice in respect to sea-water salinity remains unknown.
The reason for the behavior of trace elements is unknown, and clearly deserves more attention. Our results show that these elements are not controlled by salinity alone, not even during initial ice formation. Elevated levels of Pb in surface parts of the ice support the observations of Reference Granskog and VirkanenGranskog and Virkanen (2001) that Pb is accumulated from the atmosphere onto the sea ice in the Baltic Sea. However, Al and Fe were also enriched in snow-ice layers in respect to sea water. This can be expected based on the observed Al and Fe levels in snow in the area (Reference Soveri and PeltonenSoveri and Peltonen, 1996), and implies atmospheric input as a reason. Nedash-Reference Nedashkovskiikovskii (2002) observed a considerable excess of Pb and Cd in sea ice in the Amur Bay, Sea of Japan, with enrichment factors up to 10 and 5 for Cd and Pb, respectively. We did not observe such enrichments in congelation ice, but rather in snow-ice layers for Pb only (Table 2).
Relative enrichment of Fe and Al in the new ice may also partly be related to the enrichment of DOC, since Fe and Al are known to bond to organic matter. In view of the high concentrations of Al and Fe, compared to those of other trace metals, they may affect (decrease) the binding of other metals to DOM as well (Reference Tipping, Rey-Castro, Bryan and Hamilton-TaylorTipping and others, 2002). The depletion of Zn may be partly caused by its relatively low affinity to DOM when salinity is increased (Lorres and Pennock, 1998), and also gets mobile in the high-salinity brine. However, the effect of salinity (ionic strength), pH and DOM composition on binding of elements to DOM is complex and poorly understood (Lorres and Pennock, 1998), especially in estuarine environments such as the Baltic Sea. A detailed account of these processes is beyond the scope of this investigation. We can only note that these may be of importance during sea-ice formation and within the sea-ice brine, especially in (sea) ice formed in DOM-rich waters such as the Baltic Sea.
Whether trace elements were enriched in the first-year sea ice in respect to salinity cannot be definitely answered. Only Pb was clearly enriched in the ice, due to atmospheric accumulation as noted earlier for new ice. The levels of Pb in snow at the Bothnian Bay coast (Reference Soveri and PeltonenSoveri and Peltonen, 1996) are several orders of magnitude higher than in sea water, implying that snow-ice formation has a considerable impact on the Pb levels in sea ice in the region, especially since snow-ice formation is an important phenomenon in the area (Reference Granskog, Martma and VaikmaeGranskog and others, 2003a). The trace-element levels in the under-ice water varied substantially, from one first-year sea-ice sampling location to another. With the observed range in sea water, all elements except Pb showed both enrichment and depletion in sea ice in respect to salinity. The variable levels in the under-ice water imply that the pack ice is likely to acquire a wide range of trace-element concentrations during its development. This may partly explain the large variability observed. The strong relation of Cu with salinity in the first-year ice may be a result of lowered binding to humic substances at water salinities of 3 psu (Lorres and Pennock, 1998), i.e. an increased amount of free Cu2+ ions in the water. Then Cu would behave similarly to major ions, i.e. be strongly related to salinity during ice growth. However, the number of samples with measurable Cu levels was limited (n = 12), so these results need more data to be verified.
Sea ice is a porous medium and therefore could show similarities with porous soils, especially forest soils or top soils, where the concentration of species in solution is largely controlled by adsorption and retention processes onto surfaces and especially organic matter (e.g. Reference EvansEvans, 1989). The extent of retention/adsorption is, however, controlled by several factors such as pH, ionic strength (in sea-ice brine its salinity and composition) and organic matter content and composition. All these factors may vary considerably in the sea-ice brine, for example with small changes in temperature.
5. Conclusions
The chemical properties of new ice formed in brackish water with a salinity of 3 psu were investigated. Samples were also collected from first-year sea ice with an unknown growth and thermal history. The behavior of dissolved organic carbon (DOC), major ions and trace elements was studied.
The ratio of major ions in the ice and parent sea water indicate different behavior of ions during ice formation. When compared to concentration in sea water diluted to the same salinities, some ions such as sulfate, calcium and magnesium are enriched in the ice, while others, like potassium, are depleted. This applies to both new ice and first-year sea ice. These observations agree well with those expected based on the sequential segregation of ions during freezing (Reference Malo, Baker and GouldMalo and Baker, 1969). The observed magnesium enrichment in the ice samples also compares with the observations of Reference MeeseMeese (1989), who suggested that Mg2+ precipitates with other salts than Cl― at higher temperatures than shown by the phase diagram, and that a revision of the phase diagram is in order. Most likely, however, the Mg2+ enrichment in new ice was due to the sequential segregation of cations (Melo and Baker, 1969), because evidence for cryohydrate formation and brine rejection was lacking. Snow ice had ion ratios closer to that of the parent sea water than congelation ice, suggesting that brine retention was different. This can be explained by an impermeable ice layer beneath the congealing snow slush which inhibits brine loss, so snow ice approximates a closed system.
DOC also becomes slightly enriched in new ice compared to what would be expected from the ice salinity. This behavior has been observed earlier during artificial sea-ice formation, and our observations support observations of selective retention of DOC during ice formation observed in artificial sea ice (Reference Giannelli, Thomas, Haas, Kattner, Kennedy and DieckmannGiannelli and others, 2001). The levels of trace elements were independent of salinity effects and also of each other. In respect to salinity, both Al and Fe are enriched in the ice, while Zn was depleted. The exact mechanism behind this differential behavior remains unexplained. The Al, Fe and Pb levels in the snow-ice layers were clearly enriched by atmospheric supply, and hence independent of salinity. Further studies are clearly needed to study the behavior of trace elements during initial formation and ageing of sea ice.
First-year sea ice showed large variability in chemical properties, reflecting highly variable growth processes. The statement of Reference Anderson and JonesAnderson and Jones (1985) that no typical composition of sea ice exists seems warranted. While the major ions showed similar behavior in both new ice and first-year sea ice, trace elements showed much more variable behavior in first-year sea ice. Only Pb was definitely enriched in the surface parts of first-year ice, due to atmospheric supply. The large variability in trace-element levels probably reflects the fact that ice grown in the pack-ice region had been subject to a wide range of conditions, had a longer thermal history, and perhaps that trace elements are more susceptible to changes by secondary processes than major ions.
Chemical processes during sea-ice formation are less known than the physical ones. Even though the impact of sea ice on ocean chemistry has been shown to be small in the Arctic Ocean, at least on longer time-scales (e.g. Reference Anderson and JonesAnderson and Jones, 1985; Reference MeeseMeese, 1989), the ocean chemistry may be affected especially during the initial ice-formation processes. During ice formation the rejected brines may influence the composition of the under-ice waters, especially in shallow waters, such as the parts of the Bothnian Bay covered with land-fast sea ice, particularly because selective re-tention/rejection during sea-ice growth does occur. Even though the potential exists for sea ice to affect chemical budgets and cycling (see also Reference Granskog and VirkanenGranskog and Virkanen, 2001), observations of many of the chemical species are too sparse, sporadic and inadequate to allow any definite statement on their behavior during sea-ice formation and ageing, and on the subsequent impact of sea-ice formation and melt on chemical cycling and budgets in ice-covered seas.
Acknowledgements
The Bothnian Bay Research Station of the University of Oulu provided facilities during the experiment. The Rova-niemi Research Station of the Finnish Forest Research Institute provided cold-room and laboratory facilities for sample preparation and analysis. Thanks are due to the Swedish Maritime Administration for use of their icebreakers as a sampling platform, and to the crews of the icebreakers Ymer and Atle for their kind assistance. J. Ikavalko, T. Roine and I.Werner assisted in the field. The comments of T. A. Douglas and J.-L. Tison improved the manuscript considerably. The editorial help of M. A. Lange is also acknowledged. Funding was granted by the Academy of Finland (through project “Winter time processes in the Bothnian Bay -effects of an ice cover”), theJenny and AnttiWihuri Foundation, and the Walter and Andree de Nottbeck Foundation.



