Growing out of the work of Anderson et al. (Reference Anderson, Blais, Bowler, Donovan and Listhaug2005), a sizeable literature identifies differences in perceptions of democracy between electoral winners and losers. While intuitively we can assert that electoral winners have reason for more positive evaluations of the system, the literature highlights that losers’ consent – the tacit support of democracy among electoral losers – remains fundamental to democratic stability. This article suggests that the insights from the losers’ consent literature may be limited when applied to mixed member electoral systems. These hybrid systems allocate seats in single-member districts (SMDs) and by proportional representation (PR) within the same legislature; the existing research does not take into consideration that one may simultaneously be a winner at one level and a loser at another – a particular concern in these electoral systems. In addition, it remains unclear whether those who voted for losers possess lower levels of satisfaction than disaggregated types of non-voters.
Two surveys from the German Longitudinal Election Study (GLES)Footnote 1 provide an opportunity to analyse losers’ consent in consecutive elections rather than rely on any one snapshot in time (also see Campbell Reference Campbell2015). As the earliest adopter of a mixed member electoral system and as a stable democracy, the German case established expectations for later adopters of mixed systems and for scholars alike. An analysis of public opinion following the Bundestag elections in 2009 and 2013 provides a means to tackle the multiple levels of electoral loss and how non-voters view Germany’s democracy in different coalitions.Footnote 2 The ideological distribution among German voters and society in general varied slightly between 2009 and 2013 and turnout varied marginally as well (70.8 and 71.5 per cent of the voting eligible population respectively), yet the electoral outcome differed considerably. The 2009 election resulted in a centre-right governing coalition of the Christian Democratic Union (CDU), Christian Social Union (CSU)Footnote 3 and the Free Democratic Party (FDP), while the 2013 election found the CDU and CSU in a grand coalition with the largest centre-left party, the Social Democratic Party (SPD).
The contribution of this analysis is multifold. Most works on losers’ consent and Germany in particular measure losers’ consent at one point in time. Through two separate post-election surveys, we can compare the perceptions of winners and losers more thoroughly. Secondly, we can disaggregate what it means to be a winner or a loser in a mixed member electoral system and thus identify which kind of loser has the perception which deviates the most from the winners’. Third, we can compare the winners and losers to distinct subgroups of non-voters based on partisan preferences.
This article first presents the literature on losers’ consent, tying this to mixed systems and non-voting. Hypotheses follow, as does background to the German case. A regression analysis identifies the distinct effects of being a loser at the district level versus the national level, with the district-level vote appearing to have a larger substantive effect. However, being a two-level loser, rather than an additive effect, attenuates the expected decrease in satisfaction with democracy. The three types of non-voters are also associated with lower evaluations, with the strongest effects among those who preferred the losers or who lacked a party preference. Lastly, additional ways of enlarging the losers’ consent literature are presented.
LOSERS’ AND NON-VOTERS’ CONSENT
There is a considerable amount of literature that tackles the differences in the perceptions of electoral winners and losers. Winners are more likely to see their preferred policies or pork projects come to fruition, and to view voting in positive terms. In contrast, electoral losers have little reason for positive expectations after an election. Whether it is that winning boosts perceptions or that losing depresses views remains unclear (e.g. Anderson and Tverdova Reference Anderson and Tverdova2001; Ginsberg and Weissberg Reference Ginsberg and Weissberg1978; Kaase and Newton Reference Kaase and Newton1995; Moehler Reference Moehler2009; Singh et al. Reference Singh, Karakoç and Blais2012). In addition, the most appropriate means of measuring the winner–loser divergence is unclear, in part due to differing focuses on diffuse support (Easton Reference Easton1965) versus narrower conceptions of democratic support (e.g. Canache et al. Reference Canache, Mondak and Seligson2001), with dependent variables ranging from satisfaction with democracy to perceptions of electoral institutions and qualities of the election (e.g. Howell and Justwan Reference Howell and Justwan2013; Kornberg and Clark Reference Kornberg and Clarke1994; Lambert et al. Reference Lambert, Curtis, Brown and Kay1986; Nadeau and Blais Reference Nadeau and Blais1993). This lack of consensus on measurement may be irrelevant in that the findings largely confirm a winner–loser gap, with the age of democracy and the presence of dominant parties influencing this divergence (e.g. Anderson et al. Reference Anderson, Blais, Bowler, Donovan and Listhaug2005).
If losers fail to buy into democracy as the only game in town, it ultimately undermines democratic institutionalization. Losers must accept that elections are the avenue to political power rather than consider approaches outside democratic rules (e.g. Moehler and Lindberg Reference Moehler and Lindberg2009; Riker Reference Riker1986), in the hope that today’s losers can become tomorrow’s winners. The goal of successful democratic institutions thus is to ‘reduce the stakes of political battles’ (Przeworski Reference Przeworski1991: 36). Although such concerns about losers’ consent are greater in younger democracies with weak democratic roots, to ignore losers in older democracies risks ignoring opportunities to improve democratic representation.
Despite the losers’ consent literature expanding to democracies young and old, several concerns remain. First, the effects of the electoral system remain underdeveloped (see Anderson and Guillory Reference Anderson and Guillory1997; Bowler and Donovan Reference Bowler and Donovan2002; Cho and Bratton Reference Cho and Bratton2005) despite an acknowledgement that electoral institutions, as the ‘rules of the game’ (North Reference North1990), influence who become winners versus losers. Anderson et al. (Reference Anderson, Blais, Bowler, Donovan and Listhaug2005) state that electoral institutions exaggerate the effects of being a winner or loser, while others find that proportional representation and consensual systems generally produce smaller gaps between winner and loser (e.g. Anderson and Guillory Reference Anderson and Guillory1997; Banducci and Karp Reference Banducci and Karp2003; Klingemann et al. Reference Klingemann, Hofferbert and Budge1994; Lijphart, Reference Lijphart1984). However, little attention is given to mixed member electoral systems in the losers’ consent literature. Such systems have proliferated in the post-Cold War period. Countries as diverse as Albania, Bolivia, Hungary, Italy, Japan, Lesotho, Mexico, New Zealand, the Philippines, Russia, Seychelles, Thailand and Taiwan use or have used a mixed system since 1990. Debates continue as to whether these systems produce outcomes in each seat tier comparable to pure electoral systems (e.g. Lancaster and Patterson Reference Lancaster and Patterson1990; Moser Reference Moser1997), or if the combination creates a contamination effect (Ferrara et al. Reference Ferrara, Herron and Nishikawa2005; Herron and Nishikawa Reference Herron and Nishikawa2001). The general expectation remains that supporters of smaller parties will vote strategically in district competition, consistent with Duverger’s Law (Duverger Reference Duverger1954), while supporters of all parties will vote sincerely with their party list vote.Footnote 4 However, other strategic actions are also possible and are often overlooked in the broader literature. For example, CDU/CSU voters in the past may have ‘loaned’ party list votes to the FDP as a means of ensuring the viability of their traditional coalitional partner, although Angela Merkel openly tried to discourage such behaviour in 2013.
Mixed member electoral systems also challenge the typical means of identifying winners or losers in that some voters can potentially be both simultaneously. For example, one may vote for a winning candidate in the district competition but for a losing party with their PR party vote (or vice versa).Footnote 5 Henderson (Reference Henderson2008) remains one of the few to address the distinction between voting for a district winner and voting for a party in the ruling coalition, finding no consistency across three majoritarian legislative systems (Australia, Canada and the UK). Surprisingly, the losers’ consent literature which includes evidence from mixed systems largely fails to address this multilevel complexity (e.g. Esaiasson 1990). For example, Campbell’s (Reference Campbell2015) study on Germany defines winners or losers solely on the party list vote, while Rich (Reference Rich2016) finds that perceptions of Taiwan’s democracy are affected by winning at each level but relies on party preference to assume the party list vote. This study differs by focusing on the vote choice at both levels in Germany, but also defines winning as casting a vote at either level for a party that ultimately enters the ruling coalition.
Secondly, the losers’ consent literature rarely considers non-voters, as much of the literature relies on party preference and not vote choice to classify winners and losers (e.g. Jou, Reference Jou2009; Moehler Reference Moehler2009; Moehler and Lindberg Reference Moehler and Lindberg2009). Others, like Loewen and Blais (Reference Loewen and Blais2006), simply exclude non-voters from their analysis. With the global decline in turnout, one would assume that non-voters differ in perceptions of the electoral system and democracy more broadly, creating in effect a concern about non-voters’ consent.
The research that does include non-voters (e.g. Blais and Gélineau Reference Blais and Gélineau2007; Donovan and Karp Reference Donovan and Karp2006; Herreros and Criado Reference Herreros and Criado2007; Tavits Reference Tavits2008) rarely disaggregates types of non-voters.Footnote 6 Non-voters who generally support winners receive the benefits of victory without the opportunity costs associated with voting and thus should have less negative views compared with other non-voters. In contrast, non-voters supportive of losing candidates should have more in common with losers. Still, the expectation remains of a psychological effect from voting, indicative of a greater civic identification or an acknowledgement of elections as the main instrument for influencing government. Lastly, the heterogeneity of non-voters without partisan preference, ranging from those uninterested in politics to those interested but alienated by the current electoral choices, should have the least positive evaluations.
Moving beyond one election should also help glean insight, albeit limited, into the effects in shifts in the ruling coalition. Admittedly, due to the timing of the GLES survey, not all respondents would yet know if their preferred party was part of the ruling coalition. While the 2013 coalition process in particular transformed many who may have expected to be electoral losers into winners, perceptions of parties may not be so clear cut. For example, the SPD was arguably the big loser in 2009, being the largest opposition party, but was made co-winner in the 2013 grand coalition. However, many SPD supporters may not be satisfied with the transition from being the leader of the opposition to being a junior coalitional partner with the long-standing CDU/CSU rival. Thus SPD voters may not identify strictly as winners in 2013. Similarly, whereas the 2013 grand coalition may be interpreted as more moderate since parties in grand coalitions are often forced to make concessions or accept temporary stalemates in policy debates (e.g. Merkel and Webels Reference Merkel and Webels2008: 164), some party supporters clearly lose out. The FDP, for example, failed to win a single seat in 2013, whereas they were the junior coalition partner in 2009. Additionally, the Greens may feel that they have been sold out because their traditional partners in the SPD joined a central governing coalition.
Germany, as a mixed member proportional (MMP) system, requires that the overall distribution of seats must be proportional. In the majority of mixed member systems, the outcome of district competition has no effect on the allocation of party list seats, allowing for very disproportional outcomes if one party dominates in district competition. However, under MMP, the overall distribution of seats is dictated by the party list vote and thus district races are less determinative than in mixed member majoritarian (MMM) systems (e.g. Japan).
Rather than focus on the distinction between local and national representation (e.g. Henderson Reference Henderson2008; Singh et al. 2012), this analysis suggests giving greater weight to whether or not voters have cast votes for parties within the ruling coalition. In doing so, it follows a strategy more similar to Anderson and LoTiempo (Reference Anderson and LoTiempo2002), who defined winners as voting for the majority party in Congress. By this view, even voting for a district candidate that is successful but fails to enter the winning coalition should create a similar effect to being a loser as their policy and constituency goals are unlikely to be met. In other words, if winning is defined as coalitional entry, winning in the district just to be in the opposition would constitute losing. Still, the district vote, by connecting a local face to the party, may play a greater role in satisfaction than a PR vote where voters are unlikely to know any of the names on the list.
Moreover, losing at both levels should have an explicit influence on perceptions. If voters focus on district versus national representation rather than government formation more broadly, then the two separate voters would logically have separate influences. Thus the assumption remains that losing at both levels will accentuate feelings of dissatisfaction as respondents expect little representation of their preferences.
Shifting to non-voters, clear distinctions should be evident through disaggregation. Non-voters supportive of national winners should exhibit less negative views on democracy than non-voting losers and non-voting non-partisans, as they largely free-ride on the turnout of co-partisans. In contrast, those non-voters identifying with losing parties have little favourable to expect from the outcome. Meanwhile, non-voters without a party preference, while potentially content abstainers, are probably more detached from the political process and thus given less reason to view the system favourably.
Based on this literature, this analysis will test the following hypotheses:
Hypothesis 1: Voting for either a district loser (H1a) or a party list loser (H1b) will negatively influence democratic satisfaction.
Hypothesis 2: Voting for a district loser will depress democratic satisfaction more than voting for a party list loser.
Hypothesis 3: Voting for losers at both levels will attenuate the decrease in democratic satisfaction expected from the individual losses at each level.
Hypothesis 4: Non-voters will correspond with a decline in with democratic satisfaction.
THE GERMAN CASE
West Germany implemented a mixed system in the lower house (Bundestag) with two separate ballots in 1953, a system extended to a unified Germany in 1990. Currently 299 seats are elected in SMDs, with the same number elected by PR in regional (state) lists. As an MMP system, parties who are successful in district races have these seats filled first before allocating the PR seats according to the party list vote. Thus success in the district election does not increase the total number of seats allocated to the party.
Despite using a form of proportional representation, and coalitional governments being the norm, the German party system has remained relatively stable, with the SPD and CDU/CSU being the largest centre-left and centre-right parties respectively since 1949. Figure 1 identifies the seat share of the CDU/CSU since 1949, which remained consistently in the high 40s for much of the Cold War, but an outright majority only once (1957). In terms of recent elections, the CDU/CSU’s performance in 2013 clearly stands out as their strongest showing since unification and the closest to an outright majority in 50 years.
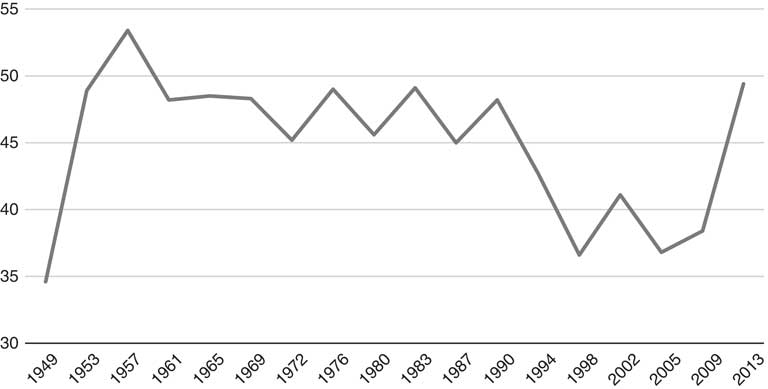
Figure 1 Seat Share of the CDU/CSU
Only three grand coalitions have occurred in post-war Germany (1966, 2005 and 2013), none of them expected prior to the election. In 1966, one year after elections, four ministers of the FDP defected from the centre-right ruling coalition, leaving the CDU/CSU to reach out to the SPD after a brief attempt at a minority government. In 2005 and 2013, elections resulted in neither traditional coalition having a majority. The 2005 election led to a brief discussion about more unusual ideologically mixed coalitionsFootnote 7 before a grand coalition between the largest SPD and the CDU/CSU was brokered. The results of the 2005 coalition may in part have spurred support for the FDP in 2009 through strategic party list voting among traditional CDU/CSU voters to encourage a centre-right majority coalition. Regardless, the FDP increased its vote share by 5 per cent in 2009, its best performance since unification, while the CDU/CSU witnessed its smallest percentage of the vote in the post-war period.
What then explains the CDU/CSU rebounding in 2013 with an 11 per cent boost in seats and barely missing an outright majority? Table 1 presents the seat distribution from the 2009 and 2013 elections. Of particular note is that while Angela Merkel’s CDU/CSU gained seats, its traditional coalition partner, the FDP, largely disintegrated in 2013, with support falling below its pre-2009 level and receiving no seats in 2013. A cursory view suggests that the CDU/CSU success is not a fundamental shift in partisanship as public support within coalitional lines appeared fairly stable. Furthermore, ticket splitting among those that identified with the CDU/CSU declined from 21.33 per cent in 2009 to 10.56 per cent in 2013, with similar declines among SPD identifiers (22.56 per cent to 13.45 per cent). Meanwhile, little change occurred in ticket splitting among supporters of the Greens (33.06 per cent to 33.64 per cent) or Die Linke (The Left) (19.79 per cent to 17.45 per cent) and split-ticketing increased among FDP identifiers (36.52 per cent to 50.00 per cent).
Table 1 Seat Distribution by Party in the 2009 and 2013 Bundestag Election
ANALYSIS
The GLES data include a question asking which party one supported in the district and party list votes.Footnote 8 For our purposes, a winner is defined as a vote for a candidate or party within the winning coalition and a loser is a candidate or party outside the winning coalition.Footnote 9 Thus a vote for a district candidate who wins their seat but is not in the ruling coalition is coded as losing. As a consequence of the grand coalition, the number of winners increased considerably from 2009 to 2013: 49.67 per cent of district votes were for winners compared with 76.45 per cent in 2013, with a similar distinction among PR winners (49.61 vs. 72.97 per cent). Among non-voters, those with no party preference constituted the super-majority in both surveys (74.24 and 70.59 per cent respectively). As expected, the percentage of non-voters who identified with winners more than doubled, from 8.2 to 19.38 per cent. However, this tells us little about the perceptions of winners and losers.
Using a measure of satisfaction with democracy ranging from 1 (not satisfied at all) to 4 (very satisfied), respondents averaged 2.47 in 2009 and 2.63 in 2013. A cursory analysis finds that PR winners, SMD winners and dual winners all averaged above 2.80 in both years, while all three types of losers were under 2.50. Among non-voters, only those preferring winners topped 2.50 in either survey.
For a stronger test of losers’ and non-voters’ consent, two ordinal logit regressions were employed on a four-point measure of satisfaction with democracy (from 1 (not satisfied at all) to 4 (very satisfied)).Footnote 10 To measure losing, first two dummy independent variables are included: PR Vote Loser if a respondent cast their party list vote for a party that was not in the governing coalition and SMD Vote Loser if a respondent voted for a district candidate whose party was not included in the governing coalition. These two variables are highly correlated in the 2009 survey (0.81) but less so in 2013 (0.58). To test whether there is an interaction effect in being a district and party list loser, an interaction term (Two Level Loser) is included, leaving as the baseline two-level winners.
Three dummy variables disaggregating non-voting are also included, based on their party preference (Non-voter–Preferred Winner, Non-voter–Preferred Loser, Non-voter–No Party Preference). This is determined by a GLES question that asks self-identified non-voters what party they would have supported. Additional controls are included for gender (Female), age (as a continuous variable), household income (an 11-point scale) and education (a five-point scale). Party identification dummy variables are created based on answers to the GLES question ‘Which party do you feel closest to?’, leaving the CDU/CSU as the base category.Footnote 11 Based on the lingering effects of the Cold War-era division and to capture general political engagement, a dummy variable for respondents in East Germany as well as a five-point measure of Interest in Politics are also included. Finally, to capture economic evaluations which could affect satisfaction, we included five-point measures of evaluations of current conditions (Econ Eval Current), evaluations of the last two years (Econ Eval Retro) and expected economic conditions in a year’s time (Econ Eval Future). Descriptive statistics are included in Table 1A in the Appendix. Of all the independent variables, only three correlated at 0.60 or stronger (PR Vote Loser, SMD Vote Loser and Two Level Loser), with weaker correlations in 2013 compared with 2009.Footnote 12
Starting with 2009, we find that among voters both types of losers associate with a decline in satisfaction with democracy (see Table 2). Of particular note, SMD Vote Loser (which captures those who still voted for a PR winner) shows a slightly larger coefficient than PR Vote Loser (which captures those who voted for a SMD winner), although a Wald test fails to find a statistically significant difference between the two variables. While being a PR loser is arguably more important in terms of national policy preferences, the findings here suggest that even in Germany’s MMP system, the district vote figures considerably into perceptions of the democratic system. Furthermore, in contrast to expectations, the positive coefficient on a two-level loser suggests this attenuates the negative evaluations expected by losing in two tiers versus just one, although this variable fails to reach statistical significance.
Table 2 Ordinal Logit Regressions of Satisfaction with Democracy, 2009 and 2013

Notes: ∗∗∗p<0.001, ∗∗p<0.01, ∗p<0.05, tp<0.10 (two-tailed tests).
Moving forward, non-voters supportive of losers or who had no party preference corresponded with declines in satisfaction. Non-voters who preferred parties outside of the ruling coalition were considerably less satisfied – over a point and a third lower on a four-point scale – than election winners and with a coefficient over thrice that of non-voters favouring winning parties. A Wald test finds the coefficients statistically differ between non-voting winners and losers at 0.10, with a stronger distinction between non-voting losers and non-voters without a preference (at 0.05).
Moving on to the party variables, surprisingly, SPD supporters associated weakly with democratic satisfaction (significant at 0.10), despite not being in the winning coalition in 2009, whereas Die Linke as well as parties that won no seats both predictably corresponded with lower satisfaction. East German respondents in general were also less satisfied as well (at 0.001). Interest in politics corresponds with a small boost in evaluations, while current and future economic evaluations also positively associate with satisfaction.
In the analysis of 2013, again we see that both types of losers have lower levels of democratic satisfaction, but the SMD Vote Loser variable has a larger coefficient than before (−1.7618), with a Wald test verifying a statistically significant distinction between it and PR Vote Loser (significant at 0.001). Again, counter to expectations, we see an attenuating effect of being a two-level loser, with the 2013 model suggesting that losing twice may result in a net positive perception. This result may simply be a statistical artefact due to the high correlations between district and party list vote as most voters do not split across parties. Another interpretation would be that many losers either did not expect to be losers or in the face of a grand coalition did not expect ideologically extreme policies out of the new government.
Again, non-voters exhibit similar patterns to 2009, with the largest coefficients on those with no party preference. Of particular note, non-voters supportive of losers were only significant at 0.10. Wald tests between non-voting losers and both of the other non-voting groups fail to reach significance. Other controls exhibit patterns similar to 2009, with a few exceptions. Income corresponded with increased satisfaction, while the Other Parties dummy corresponded with a decline in satisfaction of about one point.
Several additional tests were included as robustness checks. Firstly, a thinner model only including the vote choice and non-voter types were tested for each year (see Table 3), with findings consistent to the original models. Concerned that the findings may be motivated largely by the party dummy variables, models were rerun with those variables removed, with largely consistent results (see Table 4). Next, a pooled data set was tested, with and without a dummy variable for the 2013 election, with similar results (Table 4). Of particular note, adding a dummy variable for the 2013 election corresponded with over half a point drop (−0.6165) in satisfaction, significant at 0.001. Additional models that separated loser and non-voter status by year (e.g. PR Vote Loser 2009, PR Vote Loser 2013) also generated largely consistent results (omitted for space).
Table 3 Additional Specifications of Satisfaction With Democracy, 2009 and 2013 (Ordinal Logit Regressions)
Notes: ∗∗∗p<0.001, ∗∗p<0.01, ∗p<0.05, tp<0.10 (two-tailed tests).
Table 4 Ordinal Logit Regressions of Satisfaction with Democracy, Pooled Data
Notes: ∗∗∗p<0.001, ∗∗p<0.01, ∗p<0.05, tp<0.10 (two-tailed tests).
In addition, as coefficients may be difficult to interpret in ordinal logit regressions and a single figure may obscure variance among voter and non-voter types, predicted probabilities were generated for each type of loser as well as double winners and non-voters (Table 5). Control variables were left at their means. For simplicity the probabilities were generated from a binary logit model, collapsing the dependent variable into not satisfied versus satisfied. As expected, two-level winners have the largest predicted probabilities of satisfaction. Clear differences persist in the predicted probabilities between being a PR loser versus a SMD loser, with the rates over 0.50 for the former. Probabilities again show that losing on both levels does not create an additional decline, with a clear increase in evaluations among two-level losers from 2009 to 2013. Meanwhile, non-voters who preferred winners are predicted to be at least somewhat satisfied with democracy, with predicted probabilities at 0.60 or greater in both surveys, with non-voters with no party preferences predicted to have the lowest satisfaction facts in both surveys.
Table 5 Predicted Probabilities of Satisfaction with Democracy

In sum, the findings here are largely consistent with expectations. Losing at either level corresponds with lower rates of satisfaction (H1a and H1b), with larger coefficients on the SMD Vote Loser across models (H2). A positive interaction variable for those who voted for losers at both levels suggests that dual losing attenuates democratic dissatisfaction, contrasting with H3. Non-voters, especially those without a party preference, also show lower rates of satisfaction (H4). In neither of the original models did non-voters who preferred winning parties reach statistical significance, consistent with expectations. Overall, the findings suggest the added leverage of disaggregation. In the mixed member electoral system context, this suggests that voting in the district tier for a coalitional loser influences satisfaction beyond the party list. Whether this pattern holds for elections at different levels in other contexts (e.g. national versus provincial elections) or to mixed systems in general is unclear. Nor would it be wise to extrapolate those findings to other federal elections in Germany without considering the broader political context. Nevertheless, the findings suggest ways in which our conception of losers’ and non-voters’ consent deserves reevaluation.
CONCLUSION
Post-election public opinion survey data in 2009 and 2013 not only confirm a winner–loser gap in Germany consistent with previous research but also provide the added leverage of disaggregating the types of losers in losers’ consent research. The findings here suggest that backing a district candidate whose party fails to enter the governing coalition has a greater substantive effect on satisfaction with democracy than being a party list loser, despite the party list vote playing a greater role in the overall distribution of seats in Germany’s Bundestag. Similarly, the inclusion of the perceptions of non-voters allows us to identify whether non-voters diverge in perceptions of democracy akin to electoral losers. All three categories of non-voters negatively correspond with satisfaction, with the largest coefficient on those without a partisan identification and the smallest those who supported winning candidates. Intuitively, the results suggest that expanding the number of winners increases democratic satisfaction. Not only is this consistent with the broader literature that finds greater satisfaction under proportional representation systems compared with majoritarian designs, but it suggests institutional means to influence satisfaction in mixed systems. The findings here also suggest that non-voter consent deserves greater attention and ways to encourage non-voters, regardless of partisanship, to turn out.
Several aspects remain for future work on the losers’ consent literature, especially in regard to mixed member electoral systems. Firstly, the competitiveness of the elections, at both the district and national levels, probably influences the winner–loser gap. A loser in a closely contested election may have a greater gap between pre-election expectations and post-election reality. Secondly, cross-national comparisons may provide insight into the saliency of the subtypes of mixed systems. Where districts outnumber party list seats or where the two tiers are unlinked (mixed member majoritarian), the public may pay greater attention to district competition than in mixed member proportional systems like that of Germany. Similarly, Germany’s history as a stable democracy compared with many mixed systems that emerged in countries at the same time as democratization probably effects levels of satisfaction, especially among losers. Simply put, that losers and non-voters are generally positive regarding democratic satisfaction highlights Germany’s democratic institutionalization. Beyond mixed member electoral systems, greater attention should be placed on expanding our measurement of electoral winners and losers beyond a binary view to capture not only subnational elections (e.g. Lander elections in Germany), but also the ideological distance between voters and their candidate or party choice.
APPENDIX
Table A1 Summary Statistics for 2009 and 2013


