


Introduction
Fetal growth restriction (FGR) affects a significant proportion of pregnancies delivered prematurely. Various datasets estimate FGR to range from 18 to 30% amongst infants delivered at <32 weeks gestational age (GA). Reference Chow, Creighton, Chambers and Lui1-Reference Ferdynus, Quantin and Abrahamowicz3 FGR predominantly results from placental insufficiency, characterised by failure of the placenta to supply adequate oxygen and nutrients to the developing fetus. Fetal programming, as seen in FGR fetuses, is a process whereby permanent alterations in physiology and metabolism result from insult or stimuli during early critical periods of development. The resulting chronic fetal hypoxaemia influences organ growth, and preferential blood flow to vital organs such as the brain, adrenals and heart. Reference Chaoui, Tennstedt, Göldner and Bollmann4-Reference Mari, Uerpairojkit, Abuhamad and Copel6 The redistribution of blood to the brain is assessed by increased end-diastolic flow in the middle cerebral artery, and is termed the ‘brain-sparing effect’. Reference Wladimiroff, vd Wijngaard, Degani, Noordam, van Eyck and Tonge7 However, this ‘preferential’ fetal brain perfusion does not translate into improved short or long-term neurodevelopmental function. Reference McLean, Hough, Sehgal, Ditchfield, Polglase and Miller8,Reference Murray, Fernandes, Fazel, Kennedy, Villar and Stein9
Improved ultrasound technology now permits visualisation of small calibre vessels. The flow pattern in coronary arteries is typically biphasic, with a dominant diastolic and minor systolic component. The latter is not easily detectable, hence assessments typically pertain to the dominant diastolic phase. Diastolic arterial flow is characterised as area under the curve (velocity time integral, cm) and velocities. Non-invasive measurement of coronary artery blood flow (CABF) using transthoracic echocardiography (Echo) closely reflects invasive measurements using Doppler guidewire. Reference Hozumi, Yoshida and Asami10,Reference Yasuoka, Harada, Orino, Tamura and Takada11 Spectral Doppler and colour flow measurements detect clinically important changes in CABF patterns. Reference Harada, Tamura, Orino and Yasuoka12 CABF assessments in left anterior descending (LAD) artery in healthy term newborns and various neonatal clinical situations using transthoracic Echo have been previously published. Reference Hozumi, Yoshida and Asami10,Reference Sehgal, Ramsden and McNamara13-Reference Harada, Toyono and Tamura16 CABF is visualised much earlier in FGR fetuses, may reflect selective adaptation of vascular resistance in myocardial vascular beds and is proposed as a ‘heart sparing effect’ induced by chronic, and acute on chronic hypoxaemia. Reference Baschat, Embruch and Harman17-Reference Baschat, Gembruch, Reiss, Gortner and Diedrich18 Data on lamb fetuses using radio-labelled microspheres for myocardial blood flow quantification noted a 2.5 fold increased flow under hypoxaemic conditions, correlating inversely to partial pressure of oxygen. Reference Peeters, Sheldon, Jones, Makowski and Meschia19 Putatively, visualisable CABF suggests augmentation of coronary flow to attempt compensation and maintain myocardial oxygen balance. Reference Baschat, Embruch and Harman17,Reference Baschat, Gembruch, Reiss, Gortner and Diedrich18 Unfortunately in spite of the above adaptation, and similar to the brain, the end-organ functionality of fetal heart in FGR is not improved. Preterm FGR fetuses are known to have globular hearts with reduced function. Reference Pérez-Cruz, Cruz-Lemini and Fernández20 Elevated cord blood levels of cardiac troponin in FGR deliveries indicate that increased fetal CABF may not prevent cardiac function deterioration. Reference Chaiworapongsa, Espinoza and Yoshimatsu21
Postnatal data on preterm infants are limited, but confirmed similar and continued alterations (increased sphericity, diastolic dysfunction [higher trans-mitral E/A ratio and end-systolic wall stress {ESWS}] and systolic dysfunction [lower mean velocity of circumferential fibre shortening {mVCFc}]). Reference Leipala, Boldt, Turpeinen, Vuolteenaho and Fellman22-Reference Sehgal, Allison, Gwini, Miller and Polglase24 Serial Echo assessments in the first two weeks of life in preterm infants ranging from 23 to 32 weeks showed that while left ventricular (LV) output increased in appropriate for gestational age (AGA) infants over a period of time, this did not materialise in FGR infants. By 14 d of life, LV output was significantly lower in FGR infants. Reference Leipala, Boldt, Turpeinen, Vuolteenaho and Fellman22 Arguably, a preferential blood supply to the myocardium as part of in-utero adaptation in FGR, may not translate into better cardiac function in the postnatal period. Based on fetal data, we hypothesise that CABF will be increased but cardiac function impaired in preterm FGR infants, compared to AGA infants, when evaluated in the initial weeks of postnatal life. The aim of this study was to evaluate CABF and indices of cardiac function in preterm FGR infants, against AGA infants using transthoracic Echo.
Methods
Archived images from the database of our previously published studies were accessed to ascertain presence of CABF Doppler and colour flow recordings. Reference Sehgal, Gwini, Menahem, Allison, Miller and Polglase23,Reference Sehgal, Allison, Gwini, Miller and Polglase24 Both studies as well as the current appraisal of pre-recorded data were approved by Monash Health Ethics Review Committee. Infants <28 weeks GA were excluded as they are more likely to have a patent ductus arteriosus (PDA) which influences Echo measurements. Assessments were performed in the second week of life and infants with a PDA on the initial scan were reassessed at the end of the second week; continued patency resulted in exclusion of the infant. FGR was defined as birthweight <10th centile for GA and sex with absent/reversed antenatal umbilical artery Doppler recordings. Reference Chow, Creighton, Chambers and Lui1,Reference Fenton and Kim25 Our cohort born between 28 and 32 weeks GA reflects the majority of moderate to severe FGR cases. Reference Sehgal, Sehgal and Tan2 We excluded infants with possible asphyxia, congenital malformations or chromosomal abnormalities and born to diabetic mothers. Demographic and clinical information was recorded for the study cohort. Non-invasive blood pressure (BP) measurements were obtained using an appropriate-sized cuff on the right arm with the infant in a quiet state and positioned supine (using model IntelliVue MX800; Philips, Boeblingen, Germany). The average of 2 readings were recorded. Details about Echo assessments have been reported by us and other investigators earlier. Reference Sehgal, Gwini, Menahem, Allison, Miller and Polglase23,Reference Sehgal, Allison, Gwini, Miller and Polglase24 These were performed using the Vivid E95 Advantage Cardiovascular Ultrasound System (GE Medical Systems, Milwaukee, Wis., USA) using a 12 Hz probe, with the infant in supine position. Offline analysis was performed using EchoPAC™ (Horten, Norway) software. All Doppler measurements were calculated from an average of three consecutive cardiac cycles, the angle of insonation being kept to <15°.
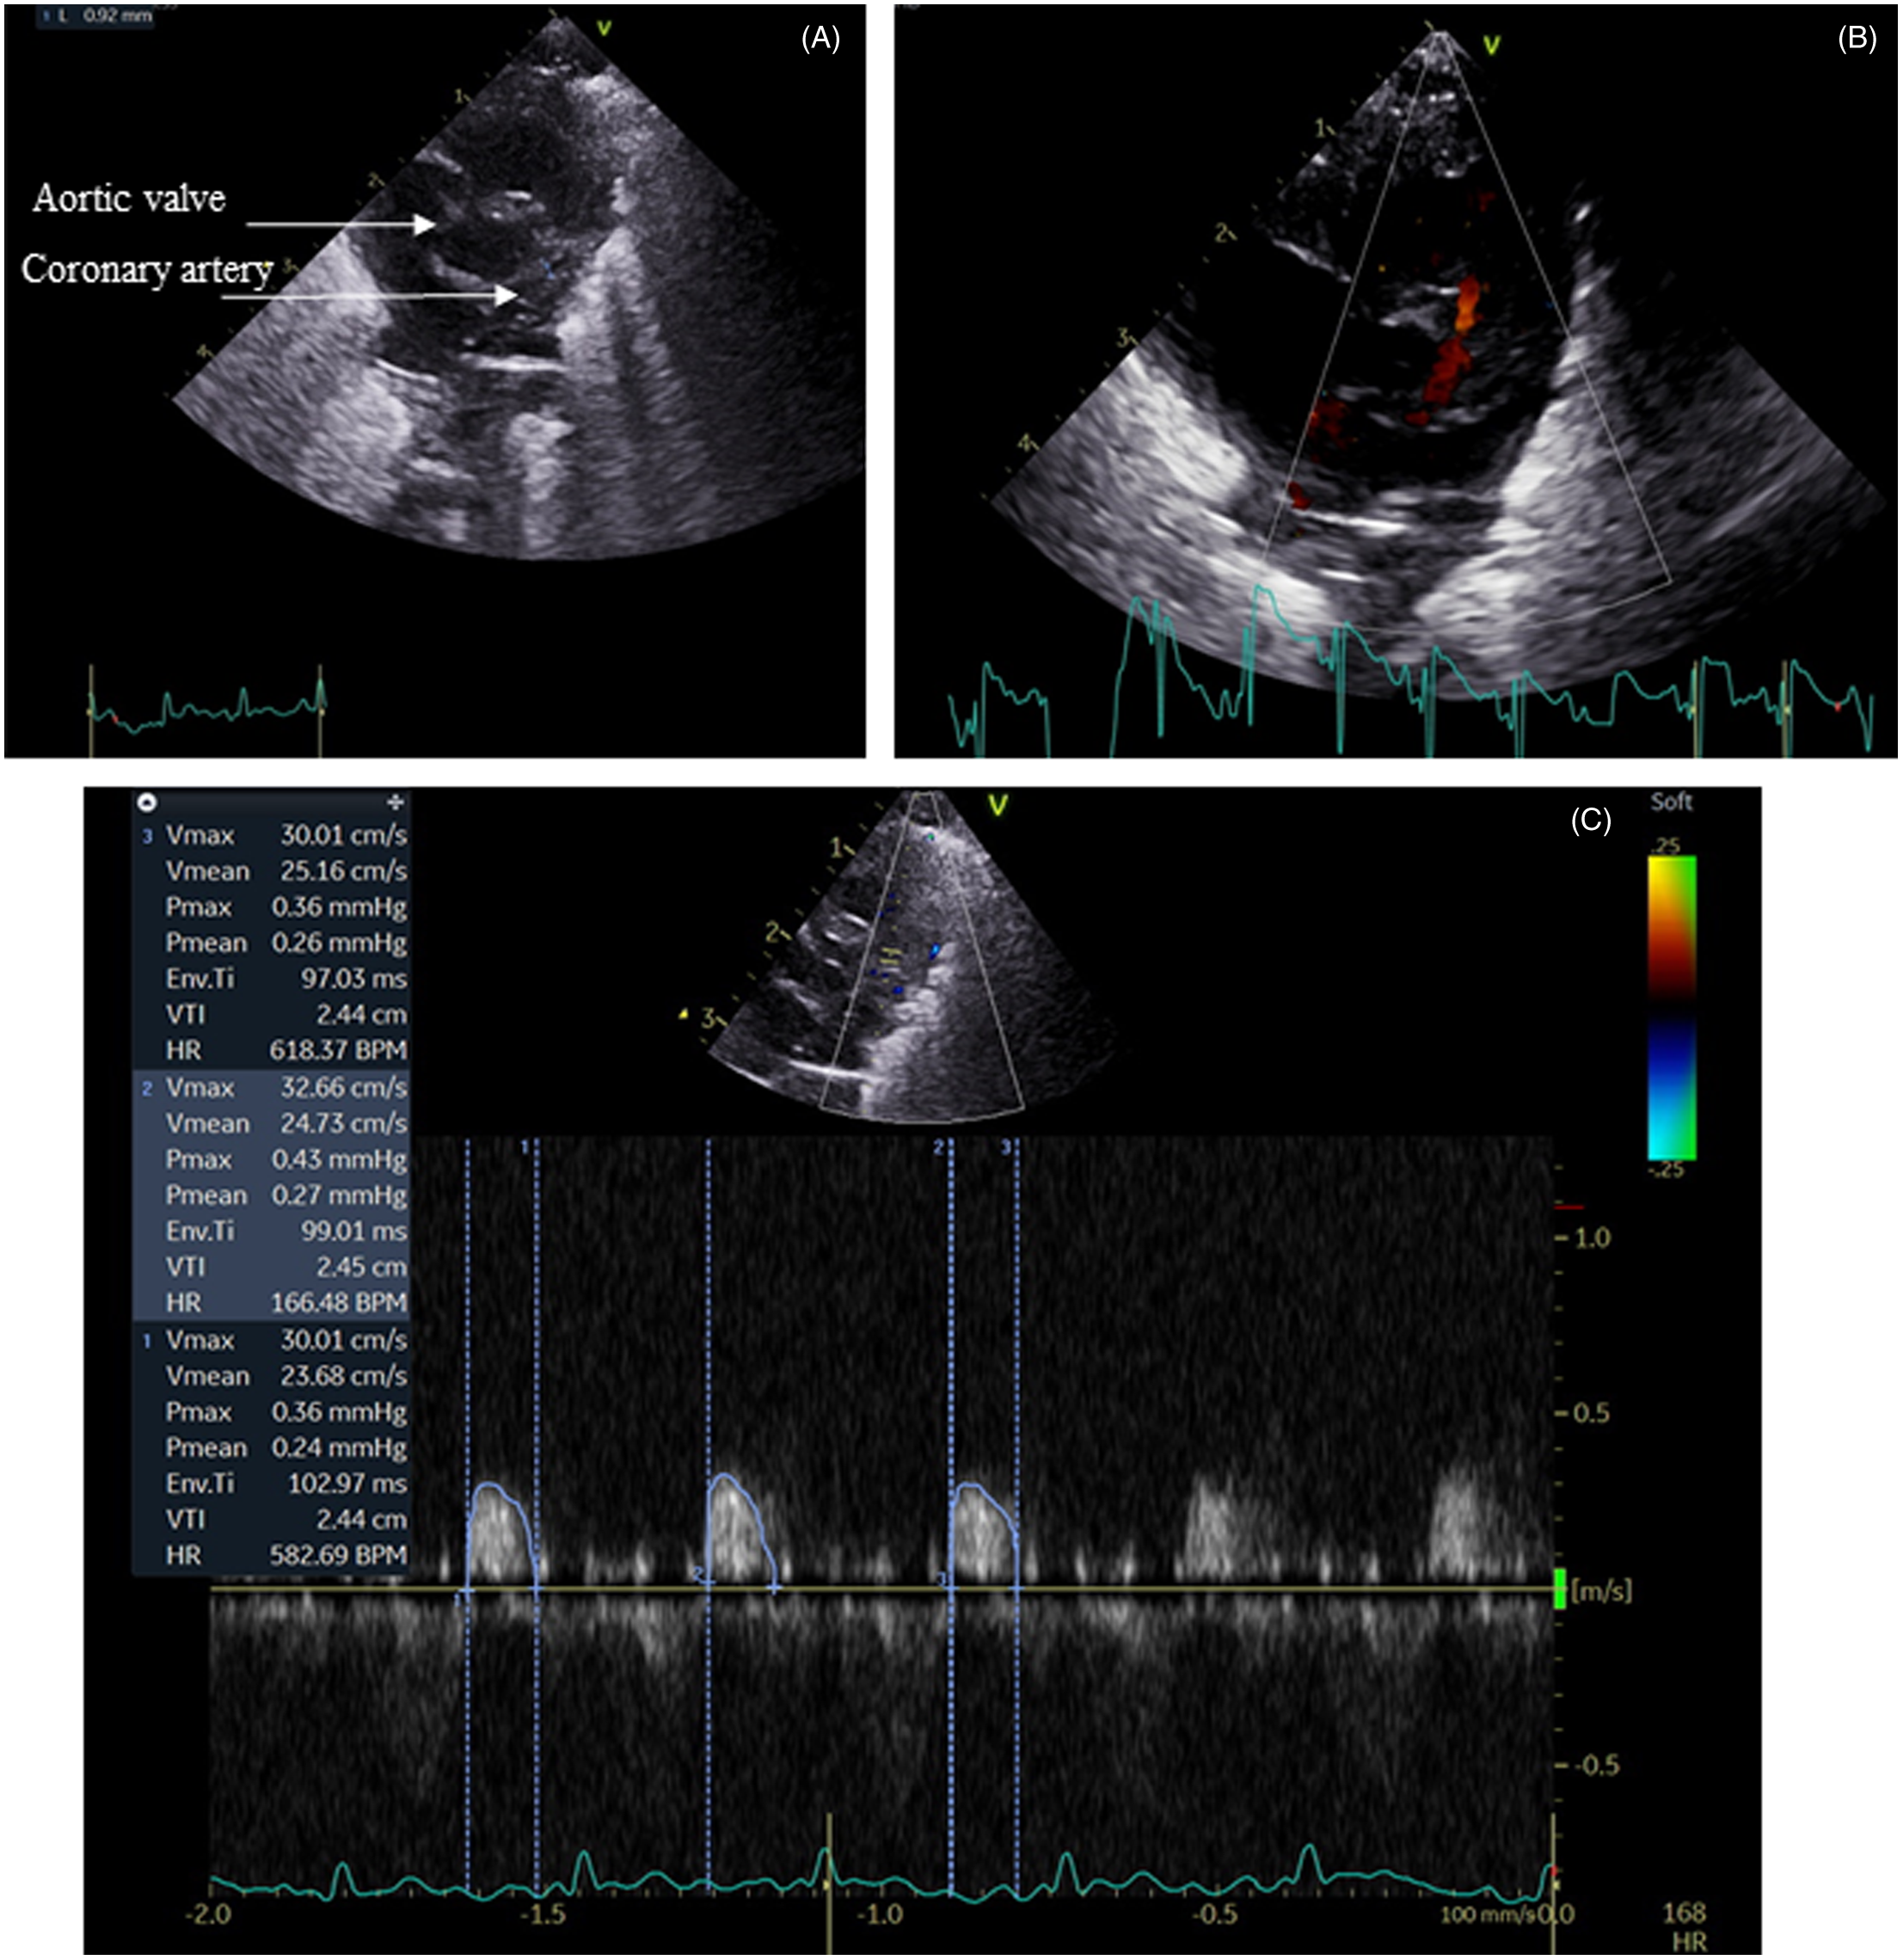
CABF evaluation: The LAD coronary artery was interrogated as this is the main vessel supplying blood to the LV. Previous studies in term and preterm infants have evaluated coronary flow in this vessel using Doppler methods. Reference Harada, Tamura, Orino and Yasuoka12-Reference Harada, Toyono and Tamura16 The vessel was identified using colour Doppler flow analysis, set to a low Nyquist limit (15–30 cm/sec) (Fig 1). The internal LAD vessel dimensions were measured at end diastole with callipers applied to the endothelial border at origin. The pulse wave Doppler sample gate was placed over the LAD distal to the bifurcation. As the majority of CABF occurs during diastole, diastolic arterial flow was measured (Fig 1). The inclusion criteria to include the infants from the archived studies was the presence of CABF Doppler recordings.
Coronary artery imaging. Panel A: Short axis view showing coronary artery origin. Panel B: Colour Doppler. Panel C: Pulse wave Doppler showing predominant diastolic trace.
Statistics
Amongst the total cohort of 80 infants (40 FGR and 40 AGA) in the two previous studies, Reference Sehgal, Gwini, Menahem, Allison, Miller and Polglase23,Reference Sehgal, Allison, Gwini, Miller and Polglase24 CABF recordings were documented in 28 FGR and 26 AGA infants. This selected cohort of 54 infants formed the subjects of the current study. Hence, the subsequent analyses refer to 54 infants. Indices were summarised as mean ± standard deviation. Continuous variables (such as GA, birthweight, BP, ventilation requirements) were compared using Student’s t test and categorical variables (such as sex, antenatal steroids, surfactant) were compared using χ2 or Fisher’s exact tests. Analyses were performed using Stata software BE/17. Two-tailed significance was set at p < 0.05.
Results
The GA at birth and postnatal age at assessment in the two groups were comparable. Demographic and clinical characteristics are depicted in Table 1. None of the infants were mechanically ventilated, all were on nasal continuous positive airway pressure at assessment. Respiratory support requirements (distending airway pressure and fractional inspired oxygen) were comparable between the two groups. Specific treatment for PDA closure was not administered; all infants had spontaneous closure. No infant was on inotropic support before or at the time of assessment. The systolic BP (mm Hg) in FGR infants was 51 ± 3 compared to 46 ± 3 in AGA infants (p < 0.001). Non-invasive BP and rate pressure product (RPP = heart rate × systolic BP) were significantly higher in FGR infants (Table 1). The RPP in FGR and AGA infants was 7576 ± 535 vs 6833 ± 493, respectively, p < 0.001.
Demographic and clinical variables
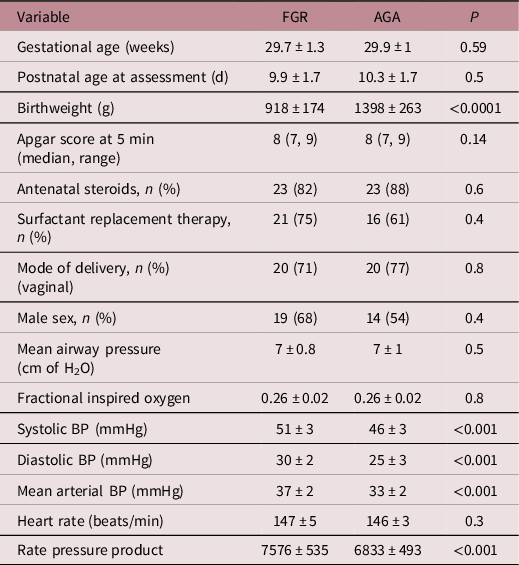
FGR, fetal growth restriction; AGA, appropriate for gestational age; BP, blood pressure; rate pressure product = heart rate × systolic blood pressure
Table 2 depicts parameters evaluating cardiac structure and function. The LV in FGR infants was dilated and hypertrophied (↑end-diastolic diameter, posterior wall thickness and mass). The LV end-diastolic diameter in FGR vs AGA infants was 14.6 ± 9.6 vs 13.6 ± 7.3 mm, respectively, p = 0.0001. The LV mass was also greater in FGR infants, 6.4 ± 0.8 vs 5.3 ± 3g, respectively, p < 0.001. LV function was noted to be impaired (↑trans-mitral E/A, greater wall stress [47 ± 6 in FGR vs 33 ± 3 g/cm2 in AGA, p < 0.001] and ↓ velocity of fibre shortening [1.9 ± 0.3 in FGR vs 2.7 ± 0.5 circ/s in AGA, p < 0.001]). Table 3 depicts CABF in FGR and AGA infants. While LAD artery calibre was comparable, CABF was significantly higher in FGR infants (LAD velocity time integral, 2.4 ± 0.9 vs 1.6 ± 0.8 cm, p = 0.002). As CABF is closely interlinked with cardiac function and diastolic BP, CABF was indexed to systolic function (LV output and circumferential fibre shortening), diastolic function (trans-mitral E/A velocities), diastolic BP and RPP. Indexed CABF was significantly higher in FGR infants (Table 3). In essence, in this group of moderately FGR preterm infants, our data noted cardiac hypertrophy and dilatation with impaired myocardial function in the presence of higher coronary flow.
Comparison of echocardiographic variables of cardiac function
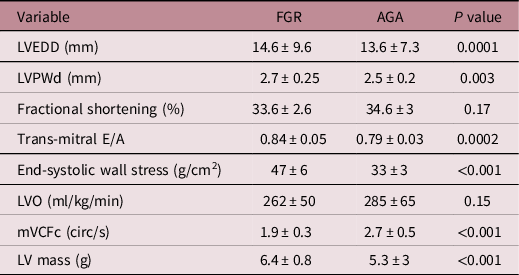
FGR, fetal growth restriction; AGA, appropriate for gestational age; LV, left ventricular; LVEDD, left ventricular end-diastolic dimension; LVPWd, left ventricular posterior wall in diastole; LVO, left ventricular output; mVCFc, mean velocity of circumferential fibre shortening.
Comparison of coronary indices
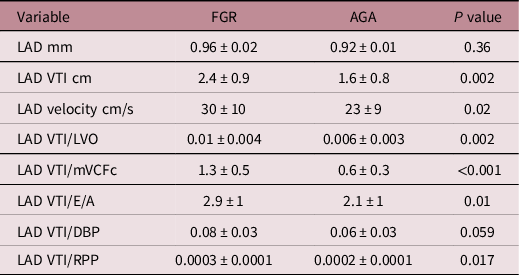
FGR, fetal growth restriction; AGA, appropriate for gestational age; LVO, left ventricular output; mVCFc, mean velocity of circumferential fibre shortening; LAD, left anterior descending; VTI, velocity time integral; DBP, diastolic blood pressure; RPP, rate pressure product.
Discussion
This Echo study noted elevated CABF in the FGR cohort (‘heart sparing effect’). However, this was not accompanied by better heart function. The above dichotomy may be a persistent response to fetal hypoxaemia (fetal programming) and circulatory adaptation (oxygen sensitivity of the coronary vasculature) or reflection of altered cardiac architecture and function. Alongside reduced cardiomyocyte binucleation and maturation, these findings could have lifelong implications for cardiovascular function. Vasodilation of coronary arteries in an attempt to spare the heart putatively signifies use of ‘last flow reserves’. Reference Chaoui26,Reference Abuhamad27 This is corroborated by data from animal studies where greater compliance of coronary vessels has been noted in FGR lambs. Reference Bubb, Cock and Black28
Autoregulation and mechanistic linkages
The adaptation of the transitional circulation in acute and chronic hypoxaemia has been recently summarized by our group.29 Myocardial oxygen requirements are met by regulation of CABF, which is determined by coronary perfusion pressure and vascular resistance. Reference Baschat, Embruch and Harman17,Reference Baschat, Gembruch, Reiss, Gortner and Diedrich18,Reference Sehgal, Allison, Miller, Polglase, McNamara and Hooper29,Reference Baschat and Embruch32 Acute hypoxaemia in fetal lambs led to a redistribution of cardiac output (↑ in CABF 2–3 fold). Chronic hypoxaemia resulted in a 5–6 fold increase, possibly reflecting adaptation, remodelling and reactivity of the coronary vascular tree. Reference Reller, Morton, Giraud, Wu and Thornburg31,Reference Thornburg and Reller33 Prostaglandins (PG) are thought to play an important role in CABF regulation. Reference Kraemer and Folts34 Intra-coronary instillation of PG in animal models led to a dose-dependent reduction in coronary vascular resistance and increase in CABF. Reference Hecher, Snijders, Campbell and Nicolaides35-Reference Baschat, Cosmi and Bilardo37 Ewes affected by chronic placental restriction demonstrate higher levels of PG endoperoxide synthase (inversely associated with fetal partial pressure of oxygen) as well as greater numbers of PG receptors. Reference Williams, McMillen, Zaragoza and Olson38
CABF and interactions with cardiac milieu
Table 4 outlines available ultrasound data on human neonates during the initial postnatal days Reference Harada, Tamura, Orino and Yasuoka12-Reference Harada, Toyono and Tamura16 ; assessments in FGR infants have not been performed previously. Lower CABF was associated with lower cardiac output in healthy neonates and those with acute hypoxaemia, Reference Oskarsson and Pesonen15,Reference Harada, Toyono and Tamura16 while LV hypertrophy in aortic stenosis or hypertrophic cardiomyopathy, and ventricular septal defects are accompanied by higher CABF, Reference Crowley, Dardas, Harcombe and Shapiro39-Reference Jureidini, Marino and Waterman41 putatively as adaptation to higher myocardial oxygen demand and increased LV mass. However, our study demonstrated that this relationship (termed aorto-myocardial coupling) is not maintained in FGR infants, plausibly due to chronic intrauterine hypoxaemia induced myocardial architectural changes such as decreased cardiac sarcomeric proteins, compensatory increase in glycogen and collagen deposition, and reduction in the number of binucleated cardiomyocytes and decreased matrix metalloproteinase-2 activity. Reference Sohn, Chai and Lee42-Reference Corstius, Zimanyi and Maka45 While low partial pressure of oxygen is mainly responsible for changes in fetal CABF, high systemic afterload (higher end-diastolic intraventricular pressure [↑ trans-mitral E/A and ↑ ESWS]) further increases myocardial oxygen requirements. Myocardial dysfunction with a subsequent fall in cardiac output Reference Baschat, Embruch and Harman17,Reference Hoffmann30,Reference Rizzo, Capponi, Pietropolli, Bufalino, Arduini and Romanini46 could jeopardise CABF itself as a terminal event. Our findings of increased CABF in hypertrophied FGR myocardium should be seen in this context.
Previous studies in human neonates documenting coronary indices
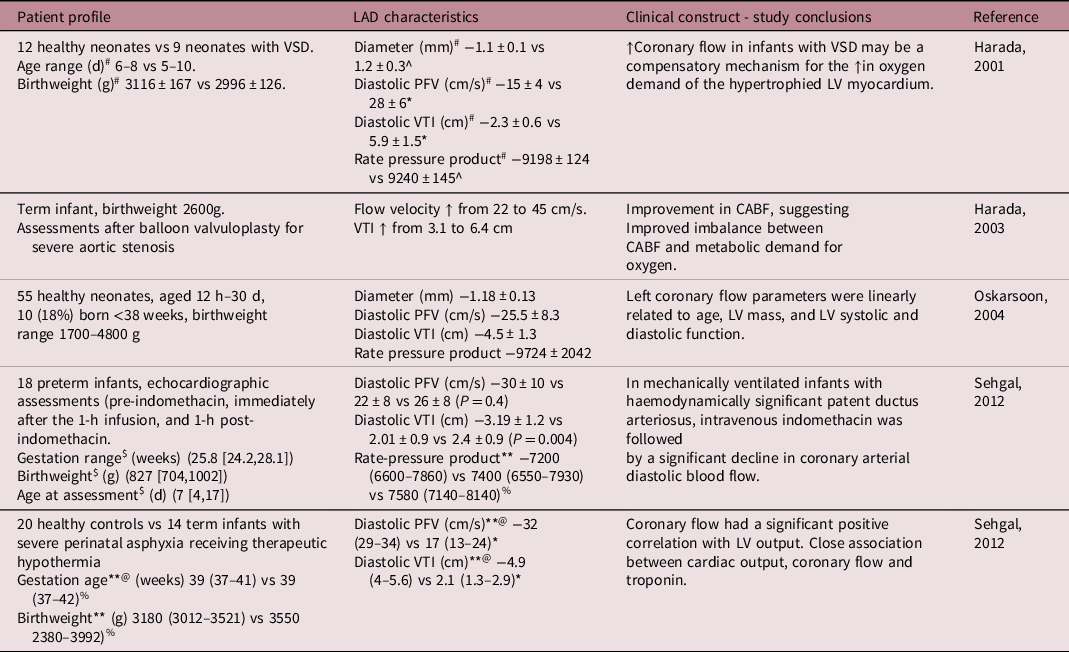
PFV, peak flow velocity; VTI, velocity time integral; LV, left ventricular; VSD, ventricular septal defect.
*P < 0.01.
^Not significant, #Normal vs VSD, $median (IQR-interquartile), **median (range), @normal vs infants with severe asphyxia, %Not significant.
A number of previous studies have highlighted early visualisation and increased CABF in hypoxaemic FGR fetuses (25 weeks vs 31 weeks in AGA), Reference Baschat, Gembruch, Reiss, Gortner and Diedrich18,Reference Chaoui26,Reference Rizzo, Capponi, Pietrolucci, Boccia and Arduini47-Reference Machlitt, Wauer and Chaoui50 indicating a global increase in myocardial blood flow throughout the cardiac cycle. Visualization of CABF in FGR fetuses was associated with circulatory redistribution, acidemia, poorer perinatal outcomes and impaired myocardial function. Reference Rizzo, Capponi, Pietropolli, Bufalino, Arduini and Romanini46,Reference Gudmundsson, Tulzer, Huhta and Marsal51 Myocardial hypertrophy/dysfunction may be primary (internal myocardial changes) or a combined effect due to systemic vascular stiffness. The ESWS was higher in the FGR cohort in our study. Higher ESWS is also noted in patients with aortic stenosis (↑ LV mass and hypertrophied myocardium), where it correlated with markers of LV remodelling. Reference Carter-Storch, Moller and Christensen52 Preservation of ESWS (lower ESWS) is considered important, as it has been demonstrated to be the most important determinant of LV oxygen consumption in pressure overload; elevated ESWS increases the risk of myocardial ischaemia. Reference Strauer, Beer, Heitlinger and Höfling53,Reference Tanaka, Fujiwara, Onodera, Wu, Hamashima and Kawai54 Unlike other parameters such as stroke volume and ejection fraction, wall stress is an index of LV performance that is considered afterload independent, since it accounts for both wall thickness and pressure generation. The alteration of ventricular wall stress is associated with morphological and functional changes in the myocardium. Higher CABF in FGR cohort of our study may reflect increased oxygen consumption due to such pressure overload, and may be a driving force behind higher CABF.
Figure 2 summarises interactions of various haemodynamic forces in the hypoxaemic milieu. In-utero hypoxaemia influences changes in vascular architecture and hence, flow dynamics. Majority of elastin deposition in the arteries occurs in the third trimester; infants born premature miss out on that surge. Compounded by the deposition of collagen and other cyto-architectural changes, the elevation in systemic afterload has back-pressure effect on the structure and function of the LV myocardium. Intrinsic myocardial changes may happen concurrently, and contribute to impaired cardiac function.
Interaction of various haemodynamic forces in the hypoxaemic milieu.
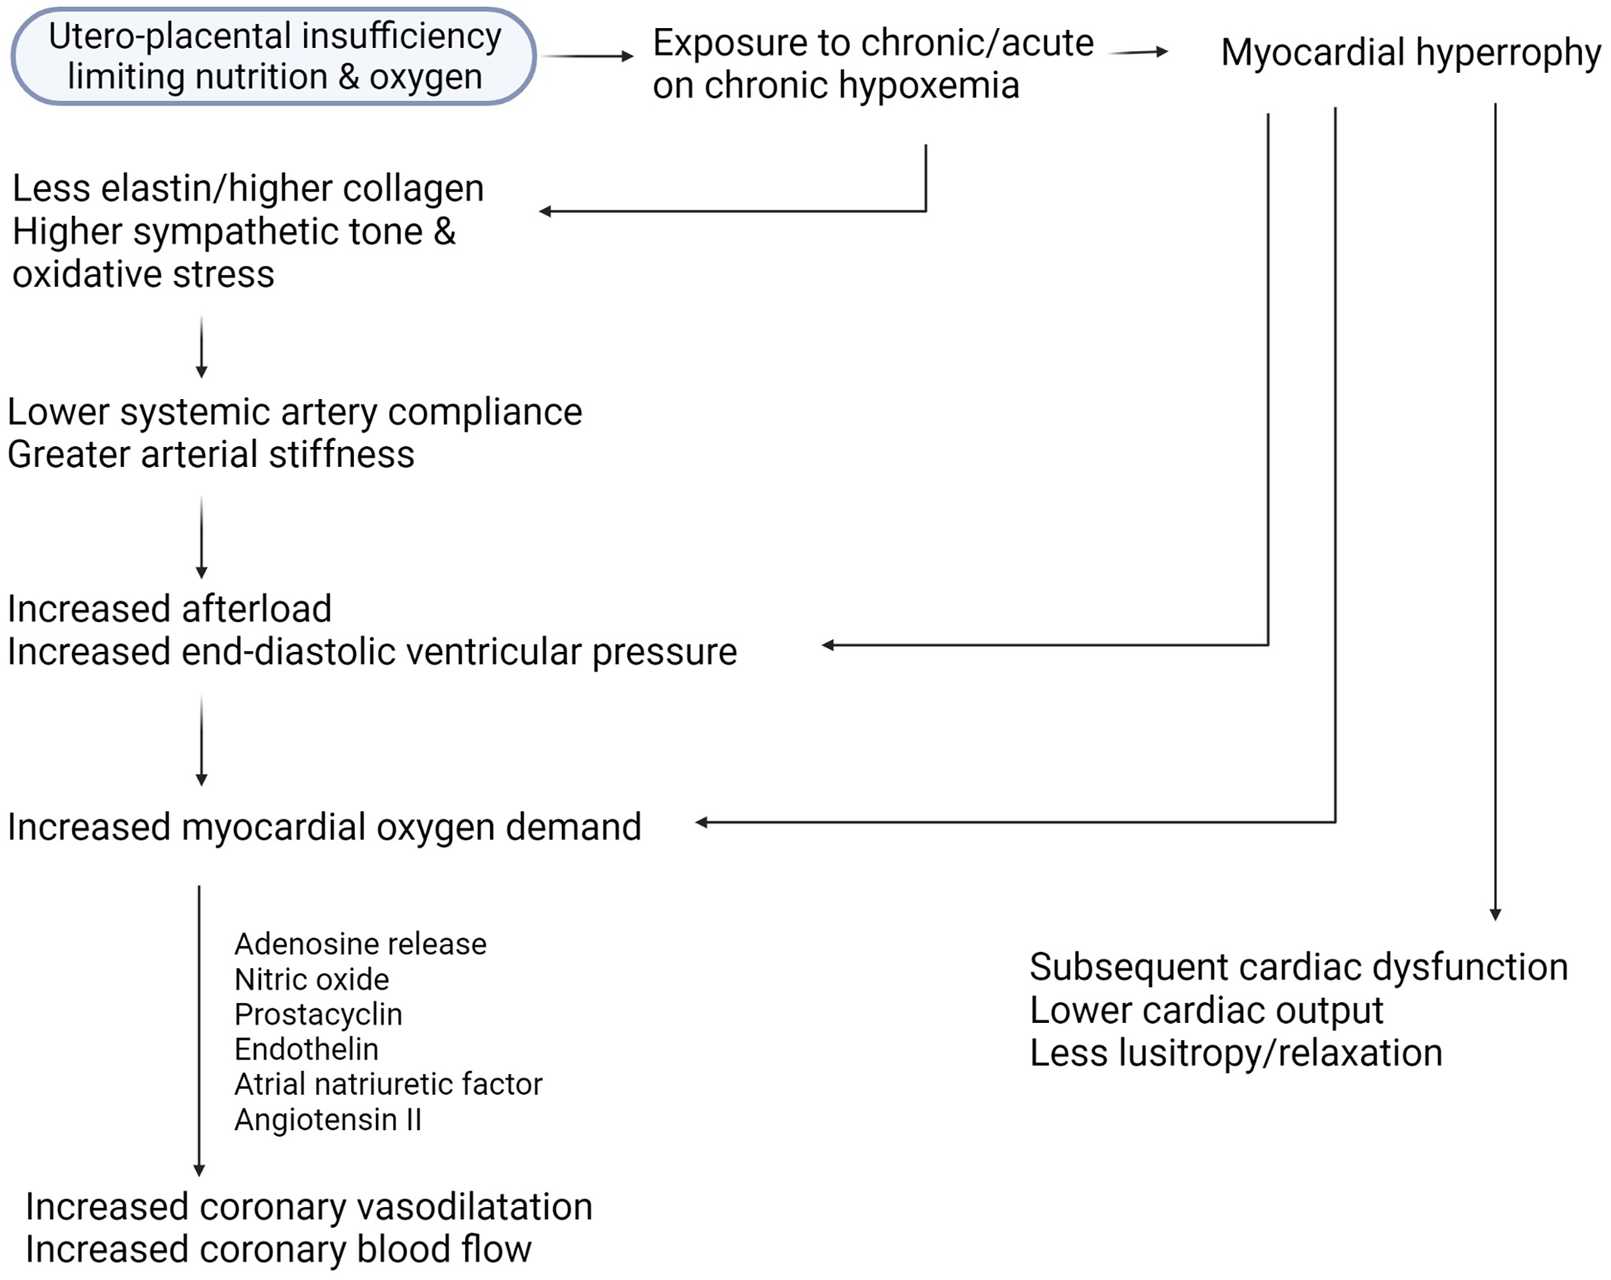
The RPP was higher in FGR infants. The RPP correlates with measured LV myocardial oxygen consumption as indicated by experiments in lambs exposed to infusion of phenylephrine and sodium nitroprusside. Reference Shaddy, Tyndall, Teitel, Li, Mills and Rudolph55 The non-invasive index of RPP also had the best correlation with exercise-induced myocardial oxygen consumption (r = 0.88) in healthy human volunteers as measured via aortic catheters. Reference Kitamura, Jorgensen, Gobel, Taylor and Wang56 While prognostic data in infants is unavailable, a study on >7000 adults with heart failure-preserved ejection fraction noted that an increase in RPP from baseline to discharge was associated with increased 30-d mortality/heart failure. Reference Verma, Sun and Hernandez57 Possibly, a higher RPP in FGR infants is a surrogate for higher myocardial oxygen consumption, and may drive the need for higher CABF. In essence, the increase in CABF in FGR cohorts may be a persistent end-organ adaptation. The presence of increased CABF (heart sparing) but lower cardiac function parallels the finding of increased cerebral blood flow (brain sparing) but lower neuro-development function. This may be related to alterations in cardiac architecture itself.
Clinical relevance of dichotomy between CABF and cardiac function
Aorto-myocardial coupling seems disrupted in FGR infants, as explained above. In patients with known diastolic dysfunction secondary to LV hypertrophy, the failure of myocardial relaxation and drop in coronary vascular resistance in the face of increasing demand (e.g. obesity) may plausibly heighten the risk of cardiovascular disease (CVD), as CABF augmentation may not increase as per need, as it is already amplified having used up its ‘coronary flow reserve’. Reference Rimoldi, Rosen and Camici58,Reference Galderisi, Cicala and Caso59 Abnormal relaxation (higher LV end-diastolic pressure [↑trans-mitral E/A ratio and ESWS]) indicates pathological cardiac remodelling, diastolic dysfunction and possibly may increase sensitivity to ischaemic injury during adult life in FGR offspring. Reference Xu, Williams, O’Brien and Davidge60 Epidemiological studies by Barker and colleagues have demonstrated higher CVD related mortality due to circulatory causes amongst adults who had lower birthweight. Reference Barker, Osmond, Golding, Kuh and Wadsworth61,Reference Barker, Winter, Osmond, Margetts and Simmonds62 Combined with intrinsic cardiac changes, the above flow dynamics in FGR infants may putatively increase the risk of CVD in adulthood, when faced with additional workload such as strenuous exercise, obesity or hypertension. Indexed CABF data in our cohort should be seen in this context. ‘Catch-up growth’ (in-utero undernutrition followed by rapid childhood growth) may be deleterious in this context as it might require further augmentation of CABF. Reference Visentin, Grumolato, Nardelli, Camillo, Grisan and Cosmi63 This is supported by data that mean 24-h ambulatory BP is higher in adolescents born low birthweight in combination with later obesity, in comparison to normal birthweight, with or without obesity. Reference Lurbe, Carvajal, Torro, Aguilar, Alvarez and Redon64 Higher BP (and the consequent RPP) would augment myocardial oxygen demand. Other relevant mechanistic links between FGR, hypertension and risk of adult onset CVD such as accelerated vascular ageing and programming of the renin-angiotensin system, may work in tandem with our present postulations. Reference Sehgal, Alexander, Morrison and South65
Potential drugs and diet recommendations for improving cardiovascular outlook in FGR infants
An important next step would be to explore interventions to stop or reverse the cardiovascular effects secondary to FGR. The interventions may be during fetal life or postnatally.
Drugs: Phosphodiesterase-5 breaks down cyclic guanosine monophosphate; sildenafil decreases the activity of Phosphodiesterase-5, thereby increasing the levels of cyclic guanosine monophosphate, thereby improving vascular relaxation. Decreased release of endothelial nitric oxide synthase and thus, less nitric oxide (vasodilator) is seen in pregnancies complicated by pre-eclampsia or FGR, which explains the rationale to use sildenafil as a therapeutic option. Reference Motta-Mejia, Kandzija and Zhang66 However, a recent randomised controlled trial investigating the effect of sildenafil compared with placebo in pregnancies with severe FGR showed no differences on the main outcome of prolongation of pregnancy. A non-significant 2.3% increase in BW was noted. Reference Sharp, Cornforth and Jackson67 Trapani et al. investigated 100 women with pre-eclampsia, randomised to sildenafil or placebo. Lower mean BP and improved utero-placental resistance were noted but no improvement in neonatal outcomes. Reference Trapani, Goncalves, Trapani, Vieira, Pires and Pires68 Further refinement in dosage and time of intervention may be required.
Diet: In one study on 81 FGR-born children were compared with 121 AGA-born children at age 4–5 years. Reference Rodriguez-Lopez, Osorio and Acosta-Rojas69 Breastfeeding and postnatal nutrition improved cardiovascular remodelling (heart sphericity) and lowered carotid wall thickness induced by FGR. In children and adolescents who were born FGR, dietary intake of omega-3 poly-unsaturated fatty acids was inversely associated with BP and also resulted in decreased arterial wall thickness. In this study of >3000 children aged 8–15 years, pulse pressure was significantly higher in children born FGR compared with normal BW children. Importantly, children with the highest tertile of omega-3 poly-unsaturated fatty acids intake had significantly lower BPs.Reference Skilton, Raitakari and Celermajer70 Dietary consumption of omega-3 fatty acids led to lower BP in childhood and adolescence and lower aortic wall thickness. Reference Skilton, Pahkala and Viikari71,Reference Skilton, Ayer and Harmer72 In a large cohort of racially and ethnically diverse, low-income women, the effect of Mediterranean-style diet as protective for pre-eclampsia was evaluated. Data were obtained via interview and food frequency questionnaire within 24–72 h postpartum, respectively. After multivariable adjustment, greatest adherence with Mediterranean-style diet was associated with lower pre-eclampsia odds. Reference Minhas, Hong and Wang73
Challenges and limitations of the technique
Although advancement in ultrasound technology has improved image resolution, Echo evaluation of CABF may be limited by spatial resolution. As the calibre of the LAD coronary artery in this cohort of infants is small, accurate measurement of CABF is particularly dependent on the accuracy of vessel diameter measurement. We used a 12 Hz probe; the availability of further higher frequency probes may enhance accuracy by improving spatial resolution. The flow pattern in coronary arteries is typically biphasic flow, with a dominant diastolic and minor systolic component. As the latter is not easily detectable; assessments are limited to the dominant diastolic phase. We kept the angle of insonation to <15°. If this is not achieved, modern machines allow use of angle correction to avoid under-reading of the flow curve. CABF Doppler were not available for the whole cohort; this may be contributed by both incomplete data collection and lack of visualisation of vessels. Presently, there is insufficient data on CABF in relation to GA during postnatal period. We did not follow the cohort for subsequent analyses at term corrected GA, which would have given sequential information about postnatal adaptation. Whether CABF in FGR infants return to normal AGA levels, and the possible timeline when this would happen, is unknown.
Conclusions and future directions
In this study we demonstrated a dichotomy between CABF and cardiac function in preterm FGR infants in the initial postnatal weeks. CABF was higher but cardiac function was lower in FGR, compared to equally preterm AGA infants. This is similar to the uncoupling noted in studies on FGR fetuses. The in-utero increased CABF is a cardiac adaptation to the hypoxaemic fetal state secondary to utero-placental insufficiency. Postnatally, it may reflect altered state of metabolism, fetal programming, higher PG levels in FGR, effects of altered myocardial architecture leading to greater oxygen consumption/requirements, but likely a combination of all the above. While coronary imaging and CABF assessment may be technically challenging, necessitating enhanced learning and imaging skills, it does provide important physiological data in high-risk cohorts such as FGR. Earlier visualisation of coronary flow alongside myocardial dysfunction and perinatal outcome data indicates possibility of earlier stratification (e.g. vs pregnancies where LV function is reduced but normal CABF). Whether assessments of CABF in FGR-born adults provide predictive ability for CVD in middle-older ages, needs prospective study. Our findings add the role of CABF to this biological plausibility, making stress-induced CABF assessments attractive monitoring and prognostic tools in select populations.
Financial support
This research received no specific grant from any funding agency, commercial or not-for-profit sectors.
Conflicts of interest
No conflicts.


 Open access