


Childhood obesity is a global public health problem.Reference Abarca-Gómez, Abdeen and Hamid1 Because the incidence of obesity is constantly increasing, and it has started to be seen at younger ages, the cardiovascular complications of obesity have also started to be encountered earlier.Reference Cote, Phillips and Harris2,Reference Lentferink, Kromwijk, van der Aa, Knibbe and van der Vorst3 However, cardiovascular risk assessments are rarely performed for obese children, obesity-related cardiovascular complications are not detected early, and precautions and treatments are not implemented to an adequate extent.Reference Lona, Hauser and Kochli4 The early detection, evaluation, and treatment of cardiovascular complications are important in terms of the quality and quantity of life.
Aortic/arterial stiffness is a criterion that shows the mechanical strain and elasticity of the aortic wall, and it is affected by several factors such as age, sex, heart rate, blood pressure, and body mass index.Reference Nemes, Takacs and Gavaller5 Aortic/arterial stiffness is an independent and strong criterion that predicts cardiovascular mortality, as well as a risk marker.Reference Cheung6
Systemic, regional, or local arterial stiffness can be measured by various non-invasive methods. Pulse wave velocity, which is a measure of regional arterial stiffness, is the most widely used method because it is a simple, accurate and reproducible method and is a strong predictor of adverse cardiovascular outcomes. Pulse wave velocity is considered the gold standard method for measuring arterial stiffness. Since pulse wave velocity is only an indirect measurement of regional arterial stiffness, it does not reflect the degree of arteriosclerosis in the local arterial wall. Local arterial stiffness can also be measured by echocardiography. To assess arterial stiffness by echocardiography, the pressure change caused by a change in blood volume is required.Reference Cho and Kim7
In our study, it was aimed to evaluate pulse wave velocity and echocardiographic measurements together in obese and overweight children and compare the results. The arterial wall structure may deteriorate throughout patient follow-up even without the presence of hypertension, and this is a warning sign that dietary habits need to be adjusted. Additionally, we wanted to demonstrate the vascular side effects of obesity on cardiovascular diseases with the aid of a non-invasive device in the absence of a paediatric cardiologist, and determine whether these measurements have a predictive value.
Material and methods
Study population
This study included 21 obese, 20 overweight, and 21 normal-weight patients who presented to the paediatric cardiology and paediatric endocrinology outpatient clinics of the Department of Paediatrics at a university hospital between 2021 and 2022.
Patients who were obese or overweight underwent follow-up care in the paediatric endocrinology department and were sent to the paediatric nephrology and paediatric cardiology departments for echocardiographic tests and pulse wave velocity studies, respectively. Normal-weight children were referred to paediatric cardiology due to an innocent murmur, and echocardiographic assessment revealed no structural heart abnormalities and no comorbidities or hypertension.
Patient information collected included patient age, sex, height, weight, BMI, systolic and diastolic blood pressure measurements, prior medical history, prescribed medicines, and co-morbidities.
In the study, the patients were divided into three groups in terms of their body mass index, where the patients who were above the 95th percentile were considered obese, those who were in the 85th–95th percentiles were considered overweight, and those who were in the 5th–85th percentiles were considered normal weight.
Approval was obtained for the study from the Clinical Studies Ethics Committee of the Faculty of Medicine at Gazi University. The parents of all children who were included in the study signed the informed consent form. Patients with CHD or acquired heart disease, chronic systemic diseases, which affect the blood vessels and patients who did not sign the informed consent form were excluded from this study.
Echocardiographic measurements
The echocardiographic examinations were made with a Vivid S5 ECHO device from the firm General Electric Medical Systems (USA) using a 3.5–5 MHz probe. The same paediatric cardiology specialist performed the echocardiographic examinations of all patients, including 21 patients in the obese group, 20 patients in the overweight group, and 21 patients in the normal weight group. M-mode and Doppler examinations were made from the subcostal, parasternal long axis, parasternal short axis, apical four-chamber, apical five-chamber, and suprasternal views. All measurements were made in compliance with the recommendations of the American Society of Echocardiography. The left ventricular ejection and shortness fractions were calculated using the Simpson method.Reference Lopez, Colan and Frommelt8 The ascending aorta diastolic diameter was measured above 3 cm from the aortic annulus at the peak of the QRS complex on the concurrently recorded electrocardiogram, and the ascending aorta systolic diameter was measured during the maximal anterior motion of the aorta arterial strain, elastic modulus (Ep), and aortic stiffness β index was calculated (Fig 1).Reference Nemes, Geleijnse and Forster9 The results were calculated using the following formulae:
Aortic strain measurement in transthoracic echocardiography.

Aortic diameter change (mm) = SD − DD,
Aortic strain = (SD–DD)/DD,
Elastic modulus E(p) = (SBP − DBP)/strain,
Aortic stiffness β index = ln(SBP/DBP)/strain, where ‘ln’ means natural logarithm,
Aortic distensibility = (2 × strain)/(SBP − DBP).
Pulse wave velocity measurements
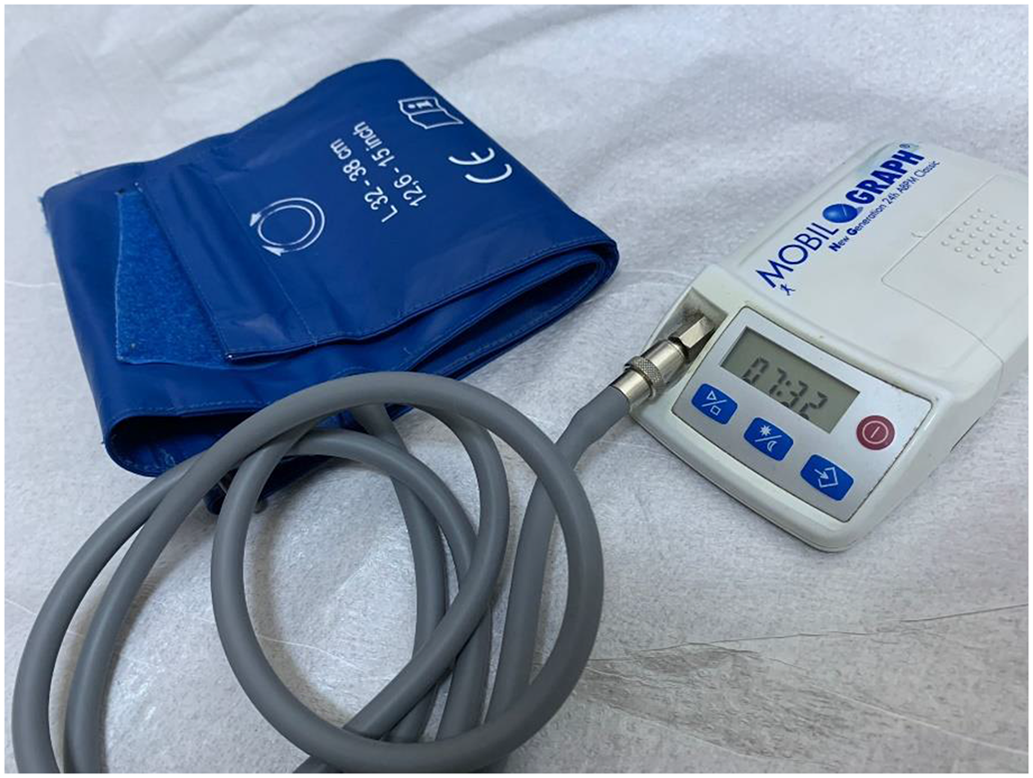
Twenty-one obese and 20 overweight patients underwent pulse wave velocity measurements at the Department of Pediatric Nephrology. Pulse wave velocity was measured during a single laboratory visit. The protocol included a rest of 10 minutes in a supine position, and the oscillometric pulse wave analysis was performed from the left upper arm using The Mobil-O-Graph® NG -24h Ambulatory Blood Pressure Monitor (I.E.M., Stolberg, Germany) device. The device measures the resting systolic and diastolic (blood pressure), mean aortic pressure, and pulse wave velocity automatically. Mean aortic pressure is calculated with the help of brachial blood pressure measurement. The central aortic waveform detected using the reflection point is divided into forward (P1) and reflected (P2) waves. Pulse wave velocity (meters per second) is calculated using the time difference between these waves. Since these measurements are determined by the interaction between pulse waves, pulse wave velocity is thought to represent systemic arterial stiffness.Reference Benas, Kornelakis and Triantafyllidi10
Statistical analysis
All statistical analyses were carried out using the SPSS 15.0 (Statistical Package for the Social Sciences, Chicago, IL, USA) program. The Kolmogorov–Smirnov test was used to test the normality of the distributions of all numeric data. Frequency and percentage values were calculated for the categorical variables, and Chi-squared tests were conducted to calculate intergroup differences. The descriptive statistics of the normally distributed numeric data are presented as mean (±standard deviation) values, while those of the non-normally distributed numeric data are presented as median (interquartile range) values. In the comparisons of the numeric data between independent groups, student’s t-test or the Mann–Whitney U test was used based on data distribution. Depending on the normality of the distributions, Spearman’s or Pearson’s correlation tests were carried out to analyse the relationships between numeric data. The correlation coefficients are expressed as “r.” A negative correlation was assumed between variables when the r value was close to −1, while a positive correlation was assumed when the r value was close to +1. The level of statistical significance was accepted as p < 0.05.
Results
The anthropometric data of the 62 patients who participated in the study, including 21 obese, 20 overweight and 21 normal-weight patients, are presented in Table 1. The values are presented as mean ± standard deviation (min-max).
Anthropometric data of the patients who were subjected to echocardiographic examinations

n: Number of cases SD: Standard deviation; min: Minimum value; max: Maximum value.
p1-p2: p-value of the comparison of the obese and overweight groups.
p1-p3: p-value of the comparison of the obese and normal weight groups.
p2-p3: p-value of the comparison of the overweight and normal weight groups.
In the obese group, 48% (10) of the patients were male, 52% (11) were female, the mean age of the patients was 14.0 ± 1.5 (12–17.5), their mean height was 166.2 ± 8.8 (151–181) cm, their mean weight was 89.8 ± 16.7 (63.5–128) kg, their mean body mass index (BMI) was 32.5 ± 5.5 (25.5–47.6) kg/m2, their mean systolic blood pressure value was 122.3 ± 11.0 (100–145) mmHg and their mean diastolic blood pressure was 64.1 ± 10.4 (46–92) mmHg.
In the overweight group, 45% (9) of the patients were male, 55% (11) were female, the mean age of the patients was 14.3 ± 1.9 (12–17.5), their mean height was 166.5 ± 10.2 (148–186) cm, their mean weight was 69.2 ± 10.4 (54–90) kg, their mean BMI was 25.1 ± 1.1 (23.3–27.7) kg/m2, their mean systolic blood pressure was 119.2 ± 17.0 (90–149) mmHg and their mean diastolic blood pressure was 64.4 ± 10.7 (50–86) mmHg.
In the normal weight group, 48% (10) of the patients were male, 52% (11) were female, the mean age of the patients was 14.8 ± 1.79 (12–17.5), their mean height was 163.3 ± 10.9 (140–186) cm, their mean weight was 53.7 ± 10.0 (40–73.5) kg, their mean BMI was 19.9 ± 1.7 (16.4–24.2) kg/m2, their mean systolic blood pressure was 115.0 ± 13.2 (95–135) mmHg and their mean diastolic blood pressure was 66.9 ± 9.3 (55–85) mmHg.
The mean body weight values of the patients were 89.8 ± 16.7 (63.5–128) kg in the obese group, 69.2 ± 10.4 (54–90) kg in the overweight group and 53.7 ± 10.0 (40–73.5) kg in the normal weight group. The mean weight of the obese group was significantly higher than those of the overweight and normal weight groups (p = 0.0001). The mean BMI values of the patients were 32.5 ± 5.5 (25.5–47.6) kg/m2 in the obese group, 25.1 ± 1.1 (23.3–27.7) kg/m2 in the overweight group and 19.9 ± 1.7 (16.4–24.2) kg/m2 in the normal group, and there was a significant difference among the three groups (p = 0.0001). In the systolic and diastolic blood pressure measurements, no significant difference was found among the obese, overweight and normal weight groups (p > 0.05).
Sixty-two patients in total underwent echocardiographic examinations, the systolic and diastolic diameters of the aorta were measured, arterial strain, arterial diameter change, elastic modulus, aortic stiffness ß index and aortic distensibility values were calculated, and the results of the intergroup comparisons are presented in Table 2. The mean arterial strain values were 0.146 ± 0.0 (0.06–0.3) in the obese group, 0.106 ± 0.0 (0.05–0.18) in the overweight group and the mean arterial strain value of the obese group was significantly higher than that of the overweight group (p = 0.01). The mean arterial diameter change values were 0.3 ± 0.1 (0.16–0.64) mm in the obese group, 0.234 ± 0.087 (0.13–0.38) mm in the overweight group and the mean arterial diameter change values of the obese group was significantly higher than that of the overweight group (p = 0.02). There was no significant difference between the groups in terms of the systolic and diastolic diameters of the aorta, elastic modulus, aortic stiffness ß index or aortic distensibility values (p > 0.05).
Comparison of the echocardiographic data of the patients
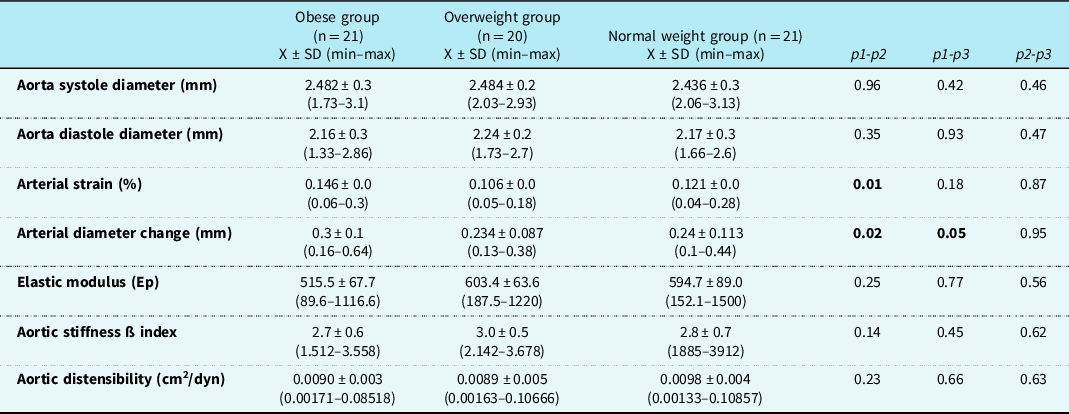
n: Number of cases SD: Standard deviation; min: Minimum value; max: Maximum value.
p1-p2: p-value of the comparison of the obese and overweight groups.
p1-p3: p-value of the comparison of the obese and normal weight groups.
p2-p3: p-value of the comparison of the overweight and normal weight groups.
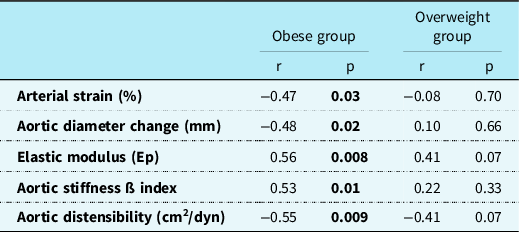
In the examinations of the correlations between the echocardiographic measurements and the pulse wave velocity measurements of the obese group, negative correlations were determined between the arterial strain, aortic diameter change, and aortic distensibility measurements of the patients and their pulse wave velocity measurements (respectively r = -0.47; r = −0.48; r = −0.55; respectively p = 0.03; p = 0.02; p = 0.009). In the same group, positive correlations were determined between the elastic modulus and aortic stiffness ß index measurements of the patients and their pulse wave velocity measurements (respectively r = 0.56; r = 0.53; respectively p = 0.008; p = 0.01). In the overweight group, there was no significant correlation between the arterial strain and aortic distensibility measurements of the patients and their pulse wave velocity measurements (respectively r = −0.08; r = −0.41; respectively p = 0.70; p = 0.07). There was also no significant correlation between the aortic diameter change, elastic modulus (Ep) and aortic stiffness ß index measurements of the patients in the overweight group and their pulse wave velocity measurements (respectively r = 0.10; r = 0.41; r = 0.22; respectively p = 0.66; p = 0.07; p = 0.3) (Table 3).
Correlations of the echocardiographic measurements and PWV measurements of the obese and overweight groups
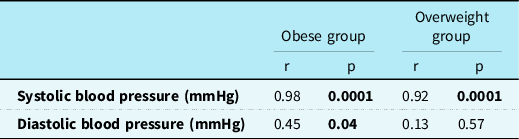
In the obese group, there was a positive and statistically significant correlation between systolic blood pressure measurements and pulse wave velocitypulse wave velocity measurements (r = 0.98; p = 0.0001), while there was a moderate, positive, and statistically significant correlation between diastolic blood pressure measurements and pulse wave velocity measurements (r = 0.45; p = 0.04). In the overweight group, a positive correlation was found between systolic blood pressure measurements and pulse wave velocity measurements (r = 0.92; p = 0.0001) (Table 4).
Correlation of PWW measurements with blood pressure measurements in obese and overweight groups
Discussion
Childhood obesity has become a global public health problem, and the prevalence of the disease has increased two-fold since 1980.Reference Weihrauch-Bluher, Schwarz and Klusmann11 The detection and prevention of obesity in childhood are vital to the prevention of cardiovascular disease development.Reference Lona, Hauser and Kochli4
Arterial stiffness is one of the structural and functional changes of the arterial wall that are detectable at the earliest ages, and it is an independent predictor of future cardiovascular events.Reference Kim, Park and Yoon12 The mean arterial strain values in our study were 0.146 ± 0.0 (0.06–0.3) in the obese group, 0.106 ± 0.0 (0.05–0.18) in the overweight group, 0.121 ± 0.0 (0.04–0.28) in the normal weight group and the mean arterial strain value of the obese group was significantly higher than that of the overweight group (p = 0.01). No significant differences were found between the groups in terms of the systolic and diastolic diameters of the aorta, or their elastic modulus, aortic stiffness β index, or aortic distensibility values (p > 0.05). The low arterial strain values of the overweight group suggest the onset of alterations in the arterial wall. Decreased elastic modulus is associated with higher arterial strain.Reference Nemes, Geleijnse and Forster9 These results were supported by the fact that the obese group’s elastic modulus values, in which arterial strain was highest, were lower than those of the other groups. The elastic modulus data of the overweight group, which has the lowest arterial strain, are also high compared to the other groups. No statistically significant difference in blood pressure was observed between the groups of patients in our study. Consequently, the finding that the obese group had higher arterial strain than the overweight group may indicate that mechanisms other than hypertension may be responsible for this difference. Further research is required in this field, despite the fact that these findings might be beneficial in highlighting how vascular wall modifications become apparent during the first stages of weight growth. Different results on aortic stiffness parameters have been reported in previous studies conducted with obese and normal-weight groups. Pac et al. found significantly lower aortic diameter change and aortic distensibility values in the obese group than in the normal weight group in their study (p < 0.05).Reference Pac, Guray and Polat13 In the study conducted by Pandit et al., the elastic modulus (Ep) and aortic stiffness ß index values in the obese group were found significantly higher compared to those in the normal weight group (p < 0.05).Reference Pandit, Kinare, Chiplonkar, Khadilkar and Khadilkar14 Previous studies have revealed increased aortic stiffness ß index values in cases of obesity.Reference Koopman, McCrindle and Slorach15,Reference Urbina, Kimball, Khoury, Daniels and Dolan16 Aortic distensibility refers to the change in the arterial volume corresponding to pressure changes, and it is affected by changes in blood pressure.Reference Panchangam, Merrill and Raghuveer17 A reduction in aortic distensibility shows an increase in the stiffness of the arterial wall.Reference Panchangam, Merrill and Raghuveer17 The absence of a significant difference between the groups in terms of their cardiac measurements and calculations may have originated from the fact that the patients had a shorter history of being overweight or obese due to their ages. Although there was no significant difference in blood pressure between the groups, the obese group’s arterial strain and arterial diameter change values were noticeably higher than those of the overweight group. Despite the fact that blood pressures were similar, the obese group’s association between echocardiographic measurements and pulse wave velocity measurements suggests that echocardiography is a reliable technique for the ongoing monitoring of these patients.
It is known that atherosclerosis develops following a long preclinical period in the arteries of children and young adults before its clinical symptoms are detected in adulthood.Reference Kumar, Kotran, Robbins and Akyol18 For the prevention of future cardiovascular complications, it is important to notice arterial disorders in the childhood period and take precautions. Arterial/aortic stiffness measurements can be made using non-invasive methods in childhood, and these measurements can be used to predict cardiovascular risk in adulthood. Very few studies have been conducted regarding aortic/arterial stiffness measurements in paediatric populations. Because aortic/arterial stiffness is related to the structure of the aortic/arterial wall and cardiovascular risk factors, echocardiographic examinations should be included in the follow-ups of patients.
Arterial stiffness can also be measured using the pulse wave velocity method, which is a non-invasive method. Pulse wave velocity is obtained by dividing the distance covered by the pulse wave that starts in the aorta during systole and progresses due to the elasticity characteristics of the arterial wall over time.Reference Panchangam, Merrill and Raghuveer17 Pulse wave velocity is one of the non-invasive determinants of arterial stiffness, and increased pulse wave velocity is associated with cardiovascular events and increased cardiovascular mortality rates.Reference Lurbe, Torro and Garcia-Vicent19 It was shown that obesity and especially abdominal fat accumulation in adulthood were associated with increased pulse wave velocity, and weight loss resulted in lower pulse wave velocity values.Reference Recio-Rodriguez, Gomez-Marcos and Patino-Alonso20,Reference Dengo, Dennis and Orr21 In our study, although there was no significant difference between the pulse wave velocity measurement results of the groups (male and female; obese and overweight), the pulse wave velocity measurements in the obese and overweight groups were higher compared to those in the normal weight group (p > 0.05). This result suggested that arterial stiffness had started in the obese group.
Different results have been reported in previous studies examining the relationship between pulse wave velocity and arterial stiffness in children. This difference may be associated with differences in the locations of the devices used and the arterial segments measured. Due to their high elastin/collagen content, central arteries have higher elasticity compared to peripheral arteries. Therefore, the method of measurement and the arterial segment that is being measured should be taken into account. The fact that different results have been obtained in different studies suggests that several factors can affect pulse wave velocity values.
In the obese group in this study, negative correlations were determined between the aortic diameter change and aortic distensibility measurements of the patients and their pulse wave velocity measurements (respectively r = –0.48; r = –0.55; p = 0.02; p = 0.009). It is known that aortic distensibility is negatively correlated with pulse wave velocity.Reference Kim, Park and Yoon12 In the obese group, elastic modulus and aortic stiffness ß index values were found to be positively correlated with pulse wave velocity measurements (respectively r = 0.56; r = 0.53, respectively p = 0.008; p = 0.01). Increased elastic modulus and aortic ß index values indicate increased arterial stiffness. These results indicated that the obese group in our study was at risk in terms of cardiovascular complications and hypertension development.
The number of studies investigating the correlations between pulse wave velocity values and aortic measurements is very low. In the study performed by Pandit et al., a positive correlation was identified between pulse wave velocity measurements and elastic modulus (Ep) and aortic ß stiffness index values (p < 0.05).Reference Pandit, Kinare, Chiplonkar, Khadilkar and Khadilkar14 In obese children, increased pulse wave velocity, elastic modulus (Ep), and arterial ß stiffness index values may be considered an early indicator of structural changes in large arteries.
In agreement with the results of other studies in the literature, in the obese group in this study, a positive correlation was identified between systolic and diastolic blood pressure measurements and pulse wave velocity measurements (respectively r = 0.98; p = 0.0001; r = 0.45; p = 0.04). The presence of a positive correlation between systolic blood pressure measurements and pulse wave velocity measurements in the overweight group also indicated the onset of arterial wall changes (r = 0.92; p = 0.0001). Although the blood pressure values in our study were within normal limits, the onset of arterial wall changes was a highly important result in terms of follow-up. This showed that arterial complications could occur before the emergence of clinical symptoms such as hypertension. In the follow-ups of obese patients, the echocardiographic measurement of arterial walls should be kept in mind in terms of the prevention of complications. Pulse wave velocity measurement can be considered a significant indicator for the assessment of early functional changes in the carotid artery, and it can be utilised in preclinical examinations. It was reported that age, blood pressure, weight, and sex are related to pulse wave velocity.Reference Pac, Guray and Polat13,Reference Celik, Ozcetin and Yerli22
Limitations
Because a major proportion of the patients presented from outside of the city and got to stay in the city where the study was performed for only one day for pulse wave velocity assessments, the number of patients in our study was limited due to parental reluctance. More research with a larger number of patients is required in this field. Another limitation would be the absence of pulse wave velocityV measures in children with normal weight. Pulse wave velocity measurements in normal-weight children, as well as comparisons with echocardiographic and blood pressure measurements, may provide more information on the subject. Another limitation of the study is the fact that laboratory conditions like hyperglycaemia and hyperlipidaemia that may impact arterial stiffness in individuals other than those with obesity were not assessed. Mean arterial pressure and heart rate were measured but not recorded, which is another study limitation.
Conclusion
In our study, we determined that aortic measurements showing the arterial wall were correlated with pulse wave velocity measurements. Echocardiographic assessments should be included in the routine follow-ups of patients because pulse wave velocity measurement devices are not found in every centre, echocardiographic procedures are available in most centres, these procedures can be implemented easily, and they make patient follow-up easier. The onset/observation of changes in echocardiographic parameters without changes in blood pressure further demonstrates the significance of this evaluation.
Mobil-O-Graph device.


 Open access