





Introduction
Radiotherapy plays a vital role in the management of head-and-neck squamous cell carcinoma (HNSCC) cancers, Reference Wong, Johnson, Hui, Lam, Ma and Chan1 used alone or in combination with surgery and chemotherapy. Reference Bourhis, Aupérin, Borel, Lefebvre, Racadot and Geoffrois2,Reference Köylü, Selçukbiricik, Aksoy and Güven3 Over the past two decades, the introduction of highly conformal radiotherapy techniques, such as intensity-modulated arc therapy (IMRT), Reference Barcelona, Waldron, Sullivan, Su, Bratman and Cho4 and volumetric modulated arc therapy (VMAT), Reference Hirotaki, Tomizawa, Kitou, Jinno, Moriya and Fujisawa5 has enhanced the conformation of the dose to complex targets and further spared adjacent critical structures. Reference Adib, Bouyhamarane, Youssoufi, Drissi, Mesradi and Boutayeb6 The increased conformity, however, renders these treatments more sensitive to geometric uncertainties. Reference Kumar, Sharma, Bhatt and Sharma7
In the head-and-neck region, reproducible patient positioning for the duration of a course of radiotherapy remains problematic. Despite the use of thermoplastic immobilisation masks and image-guided radiotherapy (IGRT), small setup deviations may still occur from fraction to fraction. These deviations are usually defined in terms of systematic and random uncertainties, which can both be incorporated into the margins used around the planning target volume (PTV). Reference Guerini, Buglione, Nici, Riga, Pegurri and Mataj8–Reference Saha, Mallick, Das, Shrimali, Achari and Chatterjee10 Systematic errors are consistent deviations affecting all fractions in the same direction, Reference Mruma, Dharsee, Malichewe, Kisukari, Yoram and Myanza11 while random errors represent day-to-day variations which may vary in magnitude and can accumulate over time. Reference Wagenaar, Kierkels, van der Schaaf, Meijers, Scandurra and Sijtsema12
Cone-beam computed tomography (CBCT) has now become the standard IGRT imaging modality in head-and-neck radiotherapy, recording changes in patient positioning and any changes in the anatomy and physiology of the patient over the course of treatment. Reference Nasser, Yang, Moros, Caudell and Redler13,Reference Zul Iskandar, Nor Aniza, Nur Fa’izah, Rukiah, Muhammad Safwan and Rosmizan14 CBCT-based corrections provide a powerful tool for reducing systematic setup errors. However, it remains uncertain whether early setup measurements may be used as reliable predictive surrogates for predicted later dosimetric compromises. If reliable early geometric metrics can be identified, they may offer useful input in decisions concerning adaptive radiotherapy (ART).
Despite the dominant role of anatomical deformation in driving dosimetric change during HNSCC RT, translational setup variation retains independent clinical relevance that should not be dismissed. Rigid positional errors accumulate across all fractions and, even when modest in magnitude, act as a systematic spatial offset superimposed on top of anatomical change—compounding geometric misses rather than substituting for it. Moreover, the interaction between positional instability and anatomical deformation is not simply additive: a patient who is both geometrically unstable and undergoing rapid tumour or parotid regression faces a compounded risk of underdosage that neither metric alone captures. This dual vulnerability is precisely the scenario in which early monitoring could offer the greatest triage value. Early translational CBCT shifts are attractive as a potential triage criterion because they are automatically available from routine IGRT workflow and do not require advanced deformable image registration or contour propagation. If patients with elevated early three-dimensional (3D) shift magnitudes could be reliably identified as being at higher risk for subsequent PTV coverage degradation, this information could be used to trigger intensified monitoring, increased CBCT frequency or earlier referral for adaptive replanning—before dosimetric compromise becomes irreversible. Such a proactive triage strategy would align with emerging ART frameworks. The key unresolved question is not whether setup errors matter—they demonstrably do—but whether early translational metrics carry a sufficient predictive signal to serve as actionable individual-level biomarkers or whether they must be combined with complementary indicators such as progressive weight loss, neck diameter reduction and volumetric shrinkage of tumour and salivary glands to achieve clinically useful discrimination.
This article reports a retrospective study of 50 HNSCC patients treated with curative-intent VMAT. Our primary aims were (1) to quantify population-level systematic (Σ) and random (σ) translational setup errors from weekly CBCT acquisitions and assess their dosimetric consequences on PTV coverage; and (2) to evaluate whether early 3D translational shifts—derived from the mean of the first three to four CBCT sessions—can serve as a triage criterion to identify patients at risk for subsequent PTV D95% degradation of ≥3%, using receiver operating characteristic (ROC) analysis. By isolating the contribution of rigid translational errors from the broader landscape of anatomical and deformational changes, we aim to define what role, if any, early geometric monitoring can play in a proactive ART strategy for HNSCC.
Materials and Methods
Patient cohort and selection
This study was a retrospective analysis of a cohort of 50 HNSCC patients treated with curative intent at our institution (Table 1), referred to hereafter as the full cohort (N = 50) (Figure 1). The patient population was heterogeneous in primary tumour site, with the most common locations being the larynx (n = 20), nasopharynx (n = 20), hypopharynx (n = 5), nasal cavity (n = 3) and oropharynx (n = 2). All patients were immobilised with a 3-point thermoplastic mask and treated with VMAT using the simultaneous integrated boost (SIB) Reference Murtaza, Mehmood, Silvia Favretto and Cora15,Reference Iatì, Parisi, Santacaterina, Pontoriero, Cacciola and Brogna16 techniques, with prescribed doses that were site- and target-volume dependent and that generally ranged between approximately 54 and 70 Gy in conventional fractions. No patient required an interim replanning CT during the course of treatment. A clinical margin of 3 mm (0·3 cm) was used to expand CTVs to PTVs, in accordance with our institutional protocol for immobilised head-and-neck patients treated with daily image guidance.
Summary of the study cohort and CBCT dataset

Table 1. Long description
The table presents data on a study cohort of 50 HNSCC patients treated with curative intent. It includes four columns: Characteristic, Number of patients (N), Total CBCT scans, Median CBCTs per patient, and Range CBCTs per patient. The table has one row of values. Row 1: Value, 50, 271, 6, 3-7.
Patient selection flowchart.

For the purpose of the dosimetric recalculation, we selected a cohort of 46 patients (n = 46) for the dosimetric analyses. Four patients from the original cohort of 50 were excluded because their treatment plans were archived in a format incompatible with Monaco treatment planning system (TPS) dose recalculation (inaccessible plan data). Inclusion criteria for the dosimetric sub-cohort required (1) a complete CBCT imaging dataset (≥3 weekly acquisitions), (2) accessible and recalculable clinical treatment plans in Monaco TPS and (3) complete dosimetric data for all delineated PTVs. Patients lacking any of these were excluded from dosimetric analyses but retained in the CBCT dataset. The organ at risk (OAR) dose analysis was restricted to the 40 patients with larynx (n = 20) or nasopharynx (n = 20) primary tumours, as these subsites had fully consistent and comparable OAR contouring protocols. Patients with other primary sites were excluded from OAR comparisons to ensure analytical homogeneity. Consequently, parotid gland analysis included 38 patients for the left parotid and 39 patients for the right parotid, as two patients had parotid glands involved by tumours (infiltrated parotids) and were excluded from the respective parotid dose analyses to avoid confounding dosimetric interpretation.
Immobilisation and imaging workflow
All patients were treated with a standard 3-point thermoplastic mask system. We clinically implemented our workflow using the VMAT technique for delivery on an Elekta VERSA HD linac, with image guidance from the onboard XVI system. The daily setup workflow followed a standardised institutional protocol consisting of the following sequential steps: (1) patient positioning and mask application in the supine position on the treatment couch; (2) acquisition of orthogonal kV planar images (anterior and lateral projections) using the XVI imaging system; (3) rigid registration of kV images to the corresponding digitally reconstructed radiographs (DRRs) from the planning CT, based exclusively on bony anatomy landmarks; (4) application of couch translational corrections (in the left–right (LR), superior–inferior (SI), and anterior–posterior (AP) directions) derived from the kV registration; (5) acquisition of a CBCT for the first fraction, and weekly thereafter, to verify the final treatment position prior to beam-on; (6) CBCT registration to the planning CT using soft-tissue and anatomical structure matching—in contrast to kV imaging which relies on bony landmarks, CBCT registration incorporated the spinal cord, the PTV and CTV structures and other critical contoured structures (OARs) to achieve a clinically meaningful positional verification; (7) any residual positional discrepancy identified on CBCT was corrected by additional couch shifts before treatment delivery; (8) treatment delivery of the VMAT plan after verification of satisfactory registration.
We routinely acquired kV planar imaging (ant & lat) on treatment day. A rigid registration based on bony structures was performed to obtain initial couch shifts. After these were applied, a CBCT was acquired to verify the final treatment position for treatment delivery for the first treatment fraction.
We routinely acquired CBCT imaging weekly. The number of weekly acquisitions was flexible at the operator’s discretion (e.g., if the initial position was not well set) and also varied due to occasional technical problems (Table 1).
Setup error and margin analysis
Setup errors were quantified using the translational shifts recorded from the weekly CBCT images. All calculations were performed separately for the LR, SI and AP directions. The analysis was conducted in two sequential steps: first at the patient level and then at the population level.
For each patient, the systematic setup error was defined as the mean of all recorded shifts during treatment. Reference Stroom and Heijmen17,Reference van Herk, Witte, van der Geer, Schneider and Lebesque18 This value represents the patient’s consistent setup deviation across fractions and was calculated as ${\bar e_{\rm{p}}} = \left( {{1 \mathord{\left/ {\vphantom {1 {{n_{\rm{p}}}}}} \right.} {{n_{\rm{p}}}}}} \right)\sum\nolimits_{\rm{i}} {{e_{{\rm{p,i}}}}}$
where e p,i is the measured shift for patient p at fraction i, and n p is the number of CBCT scans for that patient.
The patient random setup error was defined as the standard deviation of the individual shifts around the patient’s mean value, Reference Stroom and Heijmen17 reflecting the day-to-day variability in positioning: ${\sigma _{\rm{p}}} = \surd \left[ {\left( {1/\left( {{n_{\rm{p}}} - 1} \right)} \right){\Sigma _{\rm{i}}}{{\left( {{e_{{\rm{p,i}}}} - {{\bar e}_{\rm{p}}}} \right)}^2}} \right]$
At the population level, the group systematic error (Σ) was calculated as the standard deviation of the patient-specific mean shifts across all patients: $\Sigma = \surd \left[ {\left( {1/\left( {P - 1} \right)} \right){\rm{ }}{\Sigma _{\rm{p}}}{{\left( {{{\bar e}_{\rm{p}}} - \bar e} \right)}^2}} \right]$
where P is the total number of patients and ē is the mean of all patient mean shifts.
The group random error (σ) was calculated as the root mean square of the patient-specific random errors: $\sigma = \surd \left[ {\left( {1/P} \right){\rm{ }}{\Sigma _{\rm{p}}}{\rm{ }}\sigma _{\rm{p}}^2} \right]$
Population-based CTV-to-PTV margins were subsequently derived using the van Herk margin formula (van Herk et al., 2000), which was developed to ensure that 90% of patients receive at least 95% of the prescribed dose to the CTV in the presence of geometric uncertainties. The formula is expressed as: $M\, = \,2.5\Sigma \; + \;0.7\sigma $
where M is the required margin in a given translational direction, Σ is the population-level systematic error (standard deviation of patient mean errors), and σ is the population-level random error (root mean square of patient standard deviations). The formula applies a coefficient of 2·5 to the systematic component, which dominates the margin requirement because it represents a consistent directional offset affecting all fractions uniformly, and a coefficient of 0·7 to the random component, which has a lesser dosimetric impact due to statistical averaging across fractions. Calculated margins for each translational axis (LR, SI and AP) using this formula are reported in Table 5.
Dosimetric recalculation strategy
Planning system and error application
The planning and recalculation were performed on the Monaco TPS version 6.2.2.0, connected to the MOSAIQ Record and Verify version 2.86 SP3.
In order to create the effect of the setup error, a new dose calculation named Plan B was created for each of the 46 patients. Plan B was derived from the clinical plan (plan A) by shifting the isocentre to represent the population setup systematic error in the TPS in a rigid way without re-optimisation. By just recalculating the dose with the isocentre already being shifted, the same monitor unit (MU) and segmentation were preserved so that a meaningful dose distribution could be compared. Isocentre shifts were applied along all three translational directions (LR, SI and AP) in accordance with the Monaco TPS coordinate convention: left is positive (+), superior is positive (+) and anterior is positive (+). The population systematic error values used for the shifts were all positive, corresponding to shifts of +0·20 cm (SI), +0·20 cm (LR) and +0·17 cm (AP). These shifts represent the worst-case population-level systematic deviation and were applied uniformly to all isocentres without individual patient adjustment or plan re-optimisation to isolate the dosimetric effect of the rigid systematic error.
Dosimetric metrics
The dosimetric implications were assessed by comparing the recalculated plan (plan B) with the clinical plan (plan A). Measurements of interest included target coverage. Target coverage was assessed using (D95%), defined as the dose received by 95% of the PTV, with the clinical requirement of coverage being ≥95% of the prescribed dose. Reference Phat, Thao, Kien, Tai, Sandwall and Sulieman19 PTV coverage degradation was assessed after applying population-based systematic setup errors, and patients were classified as dosimetrically flagged if a ≥3% reduction in coverage was observed in at least one PTV. For flagged plans, CTV coverage was clinically reviewed by the treating radiotherapists and deemed acceptable, though no formal statistical analysis of clinical target volume (CTV) metrics was performed. OAR measurements were also taken for maximum dose (D max) to the spinal cord and brainstem and mean dose (D mean) to the left and right parotids.
3D vector calculation
For each patient, the three-dimensional (3D) vector magnitude of setup displacement was calculated using the following equation: $3{\rm{D shift}} = \surd \left[ {{\rm{L}}{{\rm{R}}^2} + {\rm{S}}{{\rm{I}}^2} + {\rm{A}}{{\rm{P}}^2}} \right]$
Mean 3D shifts were computed across the selected early fractions for each patient.
ROC analysis
ROC analysis was performed to evaluate the ability of early 3D shifts to predict subsequent PTV coverage degradation. The area under the curve (AUC) was calculated as a summary measure of predictive performance. Optimal thresholds were determined using the Youden index. The Youden index (J = Sensitivity + Specificity − 1) was maximised to identify the threshold that optimises the balance between sensitivity and specificity for predicting ≥3% PTV coverage degradation. This approach was chosen over fixed empirical cut-offs to allow a data-driven optimal threshold determination. The binary outcome (flagged vs. non-flagged) was defined as described above, and analyses were performed separately using the mean 3D shift from the first three and first four CBCT acquisitions as predictor variables.
Results
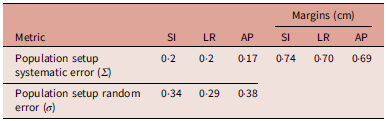
Population Setup Errors Population setup uncertainties shown in Table 2 were comparable in the SI and LR directions, with systematic errors (Σ) of 0·20 cm. The AP axis showed a slightly lower systematic error of 0·17 cm. Random errors (σ) were consistently higher than systematic components across all axes, reaching a maximum of 0·38 cm in the AP direction.
Population systematic (σ) and random (σ) setup errors by translational axis

Table 2. Long description
A table with two rows and three columns. The columns are labeled Metric, SI, LR, and AP. The rows are labeled Population setup systematic error (Σ) and Population setup random error (σ). The values in the table are as follows: Row 1: Population setup systematic error (Σ), SI: 0-20, LR: 0-20, AP: 0-17. Row 2: Population setup random error (σ), SI: 0-34, LR: 0-29, AP: 0-38.
Patient Distribution: Among the 46 patients included in the final analysis cohort, 18 patients (39·1%) were flagged for experiencing a PTV coverage loss of 3% or greater. The remaining 28 patients (60·9%) were categorised as non-flagged, as they maintained acceptable target coverage. Of the 18 flagged patients, 7 (38·9% of flagged; 15·2% of the total dosimetric cohort) experienced PTV D95% values falling below the institutional tolerance threshold of 95% of the prescribed dose in at least one PTV structure following the simulated systematic error shift. These cases represent instances where the simulated setup error produced clinically intolerable PTV underdosage, thereby substantiating the clinical relevance of the geometric findings.
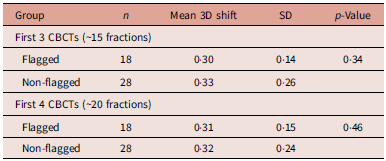
Early 3D Shift Comparison (First 3 and First 4 CBCTs): As detailed in Table 3, the mean early 3D setup shift measured during the first three CBCT assessments was 0·30 cm for flagged patients and 0·33 cm for non-flagged patients. This difference between the two groups was not statistically significant (p = 0·34). When the analysis was extended to the first four CBCT scans, mean 3D shifts remained similar between the flagged (0·31 cm) and non-flagged (0·32 cm) groups. No statistically significant difference was observed, with a p-value of 0·46.
Early 3D shift comparison using first 3 and first 4 CBCTs

Table 3. Long description
The table compares 3D shift measurements between flagged and non-flagged groups using the first 3 and first 4 CBCTs. It has 6 rows and 5 columns. The columns are labeled Group, n, Mean 3D shift, SD, and p-Value. The table is divided into two main sections: First 3 CBCTs and First 4 CBCTs. Each section has two rows: Flagged and Non-flagged. For the First 3 CBCTs section, the Flagged group has 18 samples with a mean 3D shift of 0.30 cm, an SD of 0.14, and a p-value of 0.34. The Non-flagged group has 28 samples with a mean 3D shift of 0.33 cm, an SD of 0.26, and a p-value of 0.34. For the First 4 CBCTs section, the Flagged group has 18 samples with a mean 3D shift of 0.31 cm, an SD of 0.15, and a p-value of 0.46. The Non-flagged group has 28 samples with a mean 3D shift of 0.32 cm, an SD of 0.24, and a p-value of 0.46.
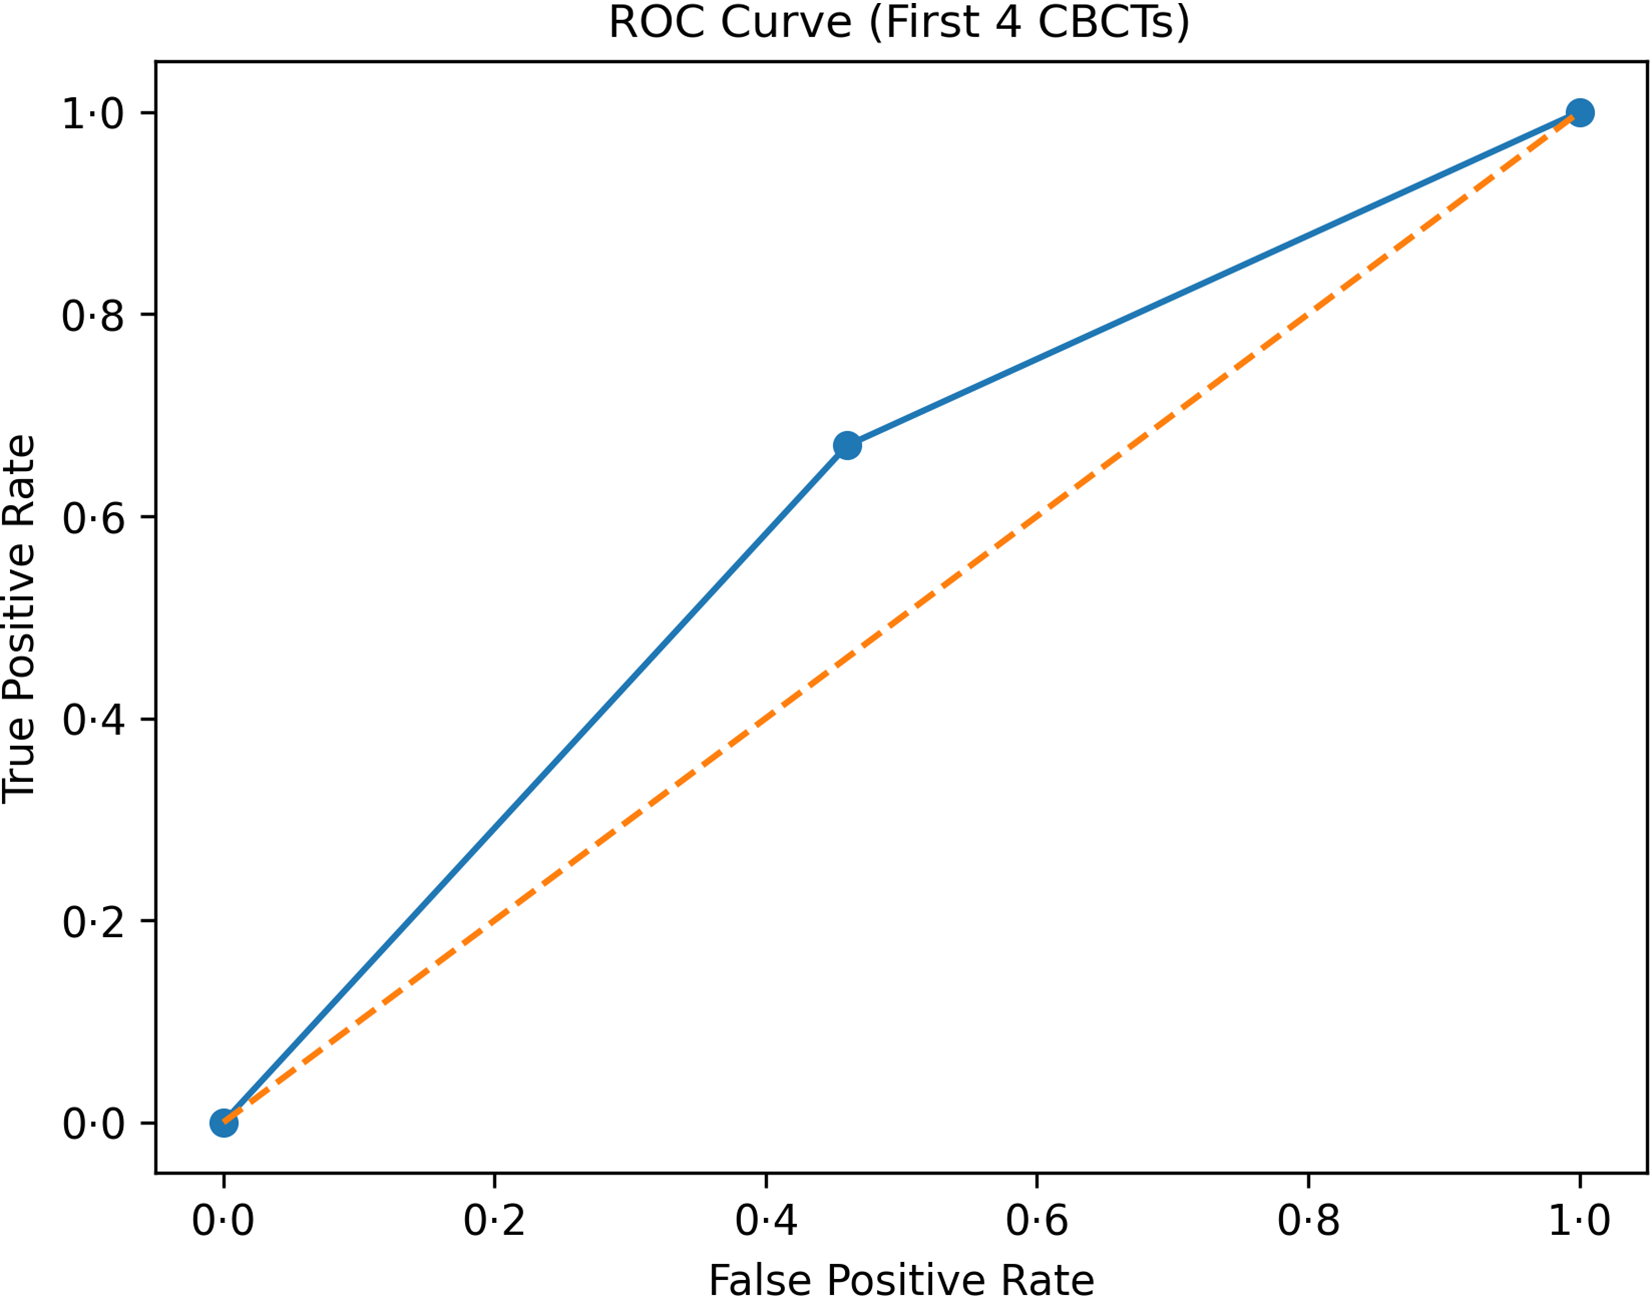
ROC analysis for PTV degradation: The ROC analysis results in Table 4 show limited predictive performance for early 3D shifts, with AUC values of 0·49 for the first three CBCTs and 0·53 for the first four CBCTs. While sensitivity ranged from 61 to 67%, the specificity of these models remained between 50 and 54%.
ROC analysis for prediction of ≥3% PTV degradation

Table 4. Long description
A table comparing the predictive performance of models using the first three and first four CBCTs. The table has two rows and four columns. Column headers are Model, AUC, Optimal cut-off, Sensitivity, Specificity. Row 1: First 3 CBCTs, 0.49, 0.28, 61 percent, 50 percent. Row 2: First 4 CBCTs, 0.53, 0.29, 67 percent, 54 percent.
PTV margins

Table 5. Long description
A table with four rows and four columns. The columns are labeled Metric, SI, LR, AP, and Margins (cm). The rows are labeled Population setup systematic error (Σ) and Population setup random error (σ). Row 1: Population setup systematic error (Σ), SI: 0-2, LR: 0-2, AP: 0-17, Margins (cm): SI: 0.74, LR: 0.70, AP: 0.69. Row 2: Population setup random error (σ), SI: 0.34, LR: 0.29, AP: 0.38.
Table 5 presents the PTV margins calculated from the population-based setup errors, resulting in requirements of 0·74 cm in the SI axis, 0·70 cm in the LR axis and 0·69 cm in the AP axis. These margins are listed alongside the measured systematic and random errors used for the calculation.
Dosimetric Impact on OARs: The comparison of dosimetric parameters in Table 6 shows significant dose increases in the shifted plan (Plan B) for the brainstem D max (+1·23 Gy, p = 0·004) and the left parotid D mean (+3·64 Gy, p < 0·001). In contrast, changes to the spinal cord D max and right parotid D mean were not statistically significant.
Descriptive statistics for OAR doses

Table 6. Long description
The table presents dosimetric statistics for various structures, comparing Plan A and Plan B. It includes columns for the structure name, number of samples (N), mean dose with standard deviation (SD) for Plan A, mean dose with SD for Plan B, the mean difference between the plans (B-A), and the p-value indicating statistical significance. The structures analyzed are the brainstem (Dmax), spinal cord (Dmax), left parotid (Dmean), and right parotid (Dmean). The table has 4 rows and 6 columns. Row 1: Brainstem (Dmax), 40, 39.28 ± 16.56, 40.51 ± 15.89, +1.23, 0.004. Row 2: Spinal cord (Dmax), 40, 39.85 ± 3.55, 39.73 ± 3.65, -0.12, 0.600. Row 3: Left parotid (Dmean), 38, 36.65 ± 9.68, 40.29 ± 9.02, +3.64, <0.001. Row 4: Right parotid (Dmean), 39, 38.87 ± 11.45, 38.44 ± 10.74, -0.43, 0.435.
Discussion
The present study investigated whether early translational setup behaviour observed during the initial CBCT sessions could serve as a surrogate indicator for subsequent dosimetric instability in head-and-neck VMAT with SIB. In addition to characterising population-based setup uncertainties, the study evaluated the impact of systematic setup errors on target coverage and OAR dosimetry while exploring the potential role of early imaging-derived setup metrics in identifying patients who may require closer ART surveillance or replanning.
Population systematic setup errors were relatively small and comparable across translational axes (Σ = 0·17–0·20 cm), suggesting effective immobilisation and image-guided setup correction throughout treatment. In contrast, random errors were consistently larger, particularly in the AP direction (σ = 0·38 cm), indicating that interfraction variability remained the dominant contributor to geometric uncertainty. This pattern is clinically important in highly conformal head-and-neck VMAT treatments because steep dose gradients increase sensitivity to daily positional variations. The predominance of random over systematic error components is consistent with previous CBCT-based investigations in head-and-neck radiotherapy, where daily variations related to swallowing, neck flexion, shoulder positioning and patient comfort were identified as major contributors to setup instability. Reference Navran, Heemsbergen, Janssen, Hamming-Vrieze, Jonker and Zuur20–Reference Sikdar, Krishnan, Rs, Chakravarty, Gupta and Gupta23
Using the measured population errors, calculated setup margins ranged from 0·69 to 0·74 cm across axes, substantially larger than the institutional CTV-to-PTV expansion of 0·3 cm used clinically in this cohort. This observation suggests that the applied margin may provide limited robustness against the full extent of population-derived setup uncertainty, particularly when considering accumulated interfraction variability. Nevertheless, the relatively small systematic errors observed imply that daily image guidance and online setup correction likely compensated for a substantial proportion of geometric deviations before treatment delivery. Therefore, the findings should not be interpreted as evidence of inadequate treatment practice, but rather as highlighting the dependence of tight-margin strategies on consistent volumetric IGRT and immobilisation accuracy. In modern head-and-neck radiotherapy workflows, narrow margins can remain clinically acceptable when supported by rigorous CBCT verification and correction protocols.
The dosimetric simulation further demonstrated that even small systematic setup deviations may produce clinically relevant target coverage degradation in selected patients. After introducing the population systematic error into the TPS without replanning or re-optimisation, 39·1% of patients experienced ≥3% PTV coverage loss. Although the magnitude of reduction was moderate, such decreases may still be important in SIB-based VMAT plans due to the high conformality of dose distributions and the proximity of critical organs. These findings reinforce the importance of maintaining geometric precision throughout treatment and support the concept that certain patients may exhibit increased susceptibility to dosimetric deterioration despite apparently acceptable average setup performance.
The OAR analysis similarly demonstrated that setup-related geometric perturbations may influence normal tissue dose distributions. Significant dose increases were observed for the brainstem and left parotid gland, whereas spinal cord and right parotid doses remained relatively stable. The observed increase in left parotid mean dose is clinically noteworthy because parotid glands are highly sensitive to positional and anatomical changes during treatment. In contrast, the absence of significant spinal cord dose variation may reflect the relative geometric stability of centrally located serial organs within the immobilisation framework. Overall, these findings suggest that setup uncertainties may not uniformly affect all OARs and that anatomical location and surrounding dose gradients strongly influence dosimetric sensitivity.
Despite the measurable dosimetric impact of simulated setup errors, early translational setup shifts derived from the first three or four CBCTs did not reliably discriminate patients who later developed target coverage degradation. Mean 3D shifts were comparable between flagged and non-flagged groups, and ROC analysis yielded AUC values close to 0·5, indicating essentially non-informative predictive performance (Figure 2). Although sensitivity values reached 61–67%, specificity remained limited, reducing potential clinical utility as a standalone predictive tool. Importantly, extending the analysis from the first three to the first four CBCTs produced only minimal improvement in predictive discrimination, suggesting that increasing the number of early CBCT observations alone may not substantially enhance prediction accuracy when using rigid translational metrics exclusively.
Receiver operating characteristic (ROC) curve for early cone-beam computed tomography (CBCT) shifts (first 4 CBCTs). The ROC curve illustrates the predictive performance of early three-dimensional setup shifts for identifying patients with ≥3% PTV coverage degradation.

Based on the analysis of setup errors across patients with varying numbers of CBCT imaging sessions, the data suggest that increasing the frequency of CBCT imaging does not inherently lead to a reduction in the magnitude of setup shifts (Figure 3). The results indicate no clear correlation between the total number of CBCTs performed and the average absolute shift, with patient-specific setup errors generally stabilising between 0·20 and 0·30 cm across all cohorts. This plateau effect implies that the measured shifts are primarily driven by random daily setup variations—such as internal anatomical motion or minor inconsistencies in patient positioning—which persist regardless of the frequency of imaging. While the AP axis demonstrates a consistent baseline error magnitude, the fluctuations observed in the SI and LR axes appear to be characteristic of individual patient variability rather than a systematic outcome of the imaging protocol.
Impact of cone-beam computed tomography (CBCT) frequency on average absolute setup shifts. Each data point represents the mean absolute translational shift magnitude per patient, plotted against the total number of CBCT acquisitions performed during treatment. Curves are shown separately for three translational axes: AP (anterior–posterior), SI (superior–inferior), and LR (left–right). Horizontal dashed lines indicate the corresponding population random errors (σ) derived from the full cohort.

These findings shift the interpretation of setup analysis away from the simplified concept that ‘setup errors directly predict dose degradation’ towards a more clinically relevant perspective in which early translational instability may contribute to identifying patients who could benefit from intensified adaptive surveillance. In this context, early setup behaviour may still possess triage value when interpreted alongside additional anatomical and dosimetric information rather than as an isolated predictive biomarker.
The lack of strong correlation between early translational shifts and subsequent dosimetric degradation further suggests that rigid setup metrics alone do not adequately capture the dominant mechanisms underlying adaptive changes in head-and-neck radiotherapy. Clinically significant dose modifications are known to arise from multiple non-rigid anatomical processes, including weight loss, tumour regression, parotid shrinkage, soft-tissue deformation and density changes throughout treatment. Reference Nuyts, Bollen, Eisbruch, Strojan, Mendenhall and Ng24–Reference Treechairusame, Zhang, Hu, Aliotta, Li and Aristophanous27 Several longitudinal CBCT and replanning studies have demonstrated progressive reductions in target coverage and increases in parotid dose despite acceptable daily setup corrections, emphasising the substantial contribution of anatomical deformation beyond rigid translational displacement. Reference Van Timmeren, Chamberlain, Bogowicz, Ehrbar, Dal Bello and Garcia Schüler28 Consequently, translational setup vectors alone appear insufficient for robust prediction of dosimetric instability.
From a clinical workflow perspective, the present findings support the importance of maintaining frequent volumetric image guidance in head-and-neck VMAT treatments, particularly when tight PTV margins are employed. Since random interfraction variability exceeded systematic error magnitude and approached or surpassed the applied 0·3 cm margin in certain directions, reliance on weekly verification imaging alone may be insufficient to ensure geometric robustness in all patients. Instead, frequent CBCT imaging combined with online correction remains important for minimising accumulated setup uncertainty and preserving target conformity. However, the results also suggest that increasing CBCT frequency without incorporating anatomical or deformable information may not adequately identify patients at highest risk for adaptive replanning.
Accordingly, future ART strategies may benefit from composite triggering approaches integrating multiple indicators, including setup instability, anatomical deformation, volumetric changes and early dosimetric trends. Such multimodal adaptive frameworks may provide improved identification of patients requiring replanning compared with rigid translational metrics alone. The development of deformable dose accumulation methodologies and AI-assisted longitudinal imaging analysis may further improve individualised adaptive decision-making in head-and-neck radiotherapy.
Several limitations should be acknowledged. First, deformation and anatomical volume changes were not quantitatively evaluated, limiting assessment of the non-rigid contributors to dosimetric degradation. Second, the study applied a population-based systematic error simulation rather than patient-specific accumulated dose recalculation, which may not fully reproduce individual treatment evolution. Finally, the analysis of the dosimetric evaluation was restricted to PTV-based metrics, which were used as the primary endpoint. Consequently, CTV dosimetric analysis was not performed, limiting the assessment of the direct impact of setup errors on target volume coverage. Despite these limitations, the study provides clinically relevant insight into the relationship between setup uncertainty, margin robustness and early ART assessment in head-and-neck VMAT.
Conclusion
This study demonstrates that population-level translational errors in HNSCC VMAT, though modest in magnitude, are sufficient to induce clinically relevant PTV coverage degradation in a substantial proportion of patients, underscoring the value of early geometric monitoring as a proactive triage tool. Critically, however, early 3D translational shifts from the first three to four CBCT acquisitions alone lack the discriminatory power to reliably identify which individual patients will experience dosimetric compromise. This finding redirects the clinical framing: rather than relying on early rigid setup metrics as a standalone trigger for adaptive replanning, institutions should consider integrating translational instability with complementary anatomical indicators—such as progressive weight loss, parotid shrinkage and tumour regression—into composite adaptive triggers.
Financial support
This research received no financial support.
Competing interests
The authors declare no competing interests.







 Open access

